
AI Accelerator Market Forecast 2030

Ai accelerator market forecast 2030, a look at the potential multi trillion dollar TAM for AI accelerators from a supply side approach.
In this article
AI Accelerator Market Forecast 2030: The Trillion Dollar Blindspot
A capacity-first, constraint-up framework that redefines how we value data center AI through 2030 and beyond.
Why the Market Keeps Getting AI Wrong
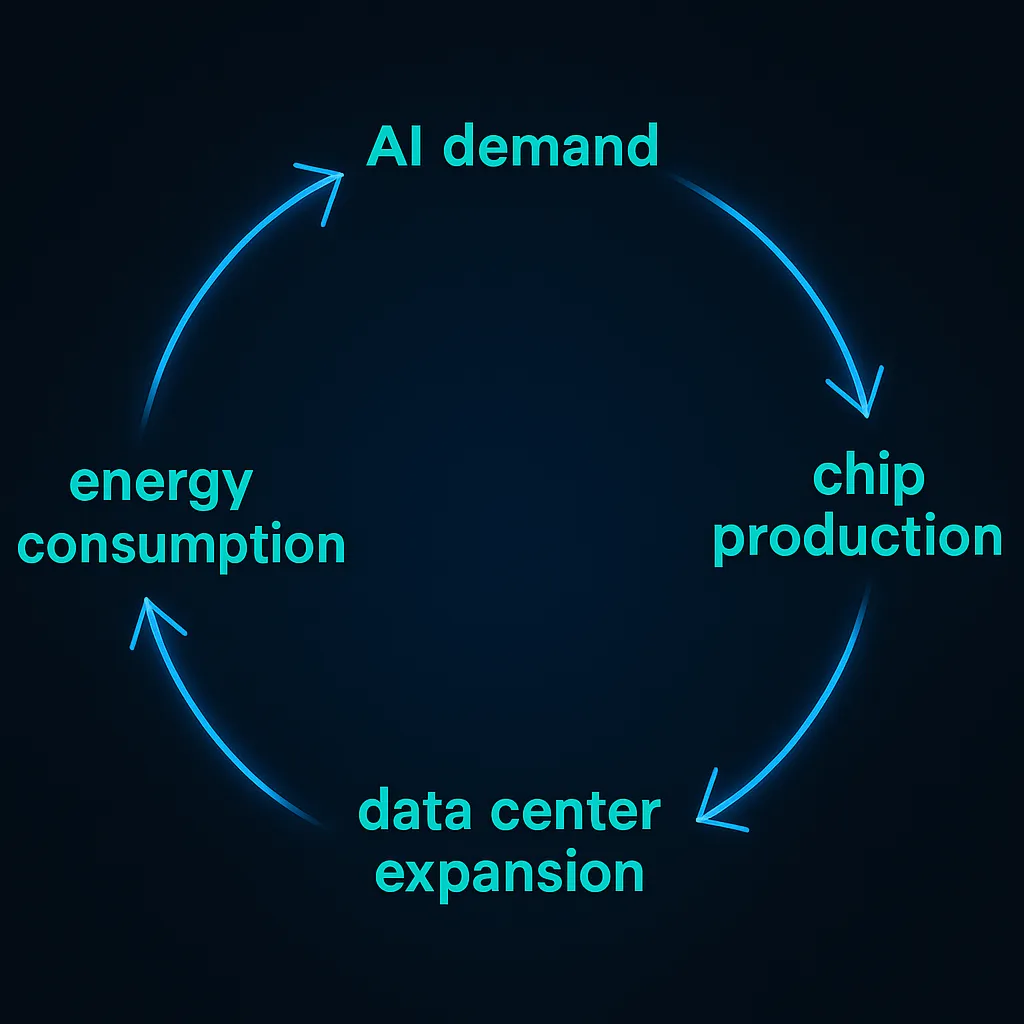
Every cycle has its disbelief. In 1995, it was the internet. In 2007, it was smartphones. In 2025, it is compute. The financial world is struggling to internalize what is happening in AI infrastructure. Forecasts remain cautious, while the physical economy of chip manufacturing tells a very different story. AI demand is not slowing; it is constrained by supply.
This report is the most comprehensive Northwise macro analysis to date. It represents months of research, capacity modeling, and financial synthesis. We start not from wishful thinking about end-user demand, but from the one thing that does not lie: manufacturing capacity.
Our findings suggest that by 2030, the global Total Addressable Market (TAM) for AI accelerators alone (GPUs and ASICs for training and inference) will exceed $1 trillion annually. When memory, networking, and CPUs are included, the total AI compute stack could surpasses $1.7 trillion.
We’ll walk through the math step by step, show every assumption, and explain exactly how capacity bottlenecks determine valuation potential for companies like NVIDIA and AMD.
Why Analysts Underestimate AI TAM
Most analyst reports start from demand. We start from constraints. This method reverses the logic by anchoring the model to real, measurable supply-side physics: wafer output, yields, packaging, and allocation.
We don’t just assume AI will keep growing; we assume fabs will keep running at full utilization. That’s what makes this piece contrarian. It doesn’t matter what enterprises want: it matters what TSMC, Samsung, and Intel can make.

Why can we make this assumption? C.C. Wei, CEO of TSMC just reported it himself in q3 earnings: “We need to work very hard to narrow the gap between supply and demand”.
“All of these models have gotten quite complex… We also face a lot of limitations and hard decisions about [how] we allocate our compute towards many great ideas.” — Sam Altman, CEO of OpenAI
We also integrate the psychological and institutional biases that cause others to underestimate this industry. The “human linear bias” makes it nearly impossible for most analysts to visualize exponential demand. We’ll explain that too.
The AI Capacity Bottleneck
The AI Capacity Bottleneck
The defining story of this decade is not the rise of AI demand. It is the struggle to supply it.
NVIDIA’s Jensen Huang has described modern data centers as “AI factories,” places where compute is no longer just a tool but a production line for intelligence itself. In his 2024 GTC keynote, he predicted that:
“every data center will become a generative AI factory, producing intelligence as its output.”
Months later, on NVIDIA’s earnings call, he was more candid about the limits of that vision: “We expect the demand will continue to be stronger than our supply provides through the year, and we’ll do our best.”
AMD’s Lisa Su, speaking at CES 2025, shared a similar view from a different position in the ecosystem.
“We are still in the very early innings of AI adoption, and inference will ultimately out scale training by orders of magnitude.”
Her point was simple but profound. The curve of AI compute does not bend back toward normal. Each new model creates new layers of demand for silicon, bandwidth, and energy. Every training cycle amplifies the need for hardware that can process, move, and store data faster than before.
At Northwise, we see this as the truest signal in all of technology. Supply is no longer a passive input to innovation. It is the governor of progress. Each incremental advance in lithography, interposer density, or energy efficiency determines not only the next quarter of chip shipments but the very pace at which intelligence itself can scale.
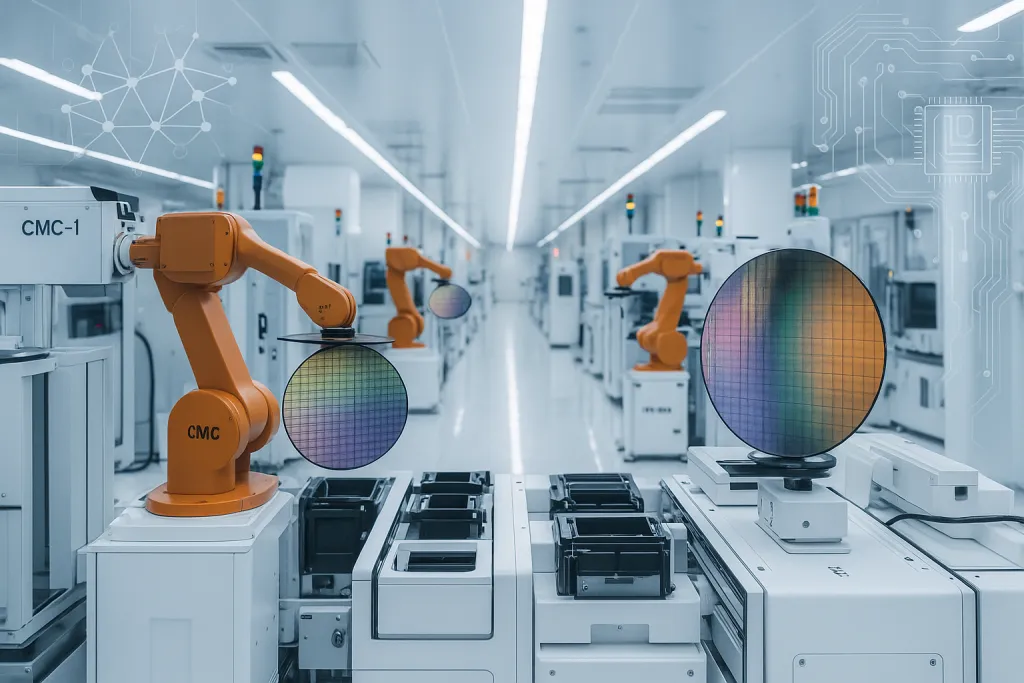
This is the bottleneck the market still struggles to price. Analysts frame AI as a demand story, yet the data show something different. TSMC’s 2nm lines are already oversubscribed. Nvidia’s next-generation GPUs are sold out before production. Energy grids are being upgraded in anticipation of data center loads that will not stabilize.
The constraint is real, measurable, and structural. Capacity, not enthusiasm, will determine the boundaries of this new economy. In the decade ahead, it will not be demand curves that shape valuations but the rate at which humanity can turn sand, silicon, and power into compute.
AI Chip Supply Chain: Foundries as the Limit
To understand the trajectory of AI compute, we have to start with the one number that defines the limit of possibility: wafer capacity. Every forecast, every valuation, and every assumption about the future of artificial intelligence eventually runs into the same physical constraint: how many advanced chips the world can actually make.
The global supply chain for leading-edge semiconductors is effectively a three-player system. Taiwan Semiconductor Manufacturing Company (TSMC) dominates the most advanced nodes, producing roughly 90 percent of sub-5nm wafers. Samsung Foundry trails with its 3nm and early 2nm gate-all-around processes, while Intel Foundry Services is reemerging as a credible third option with its 18A and forthcoming 14A nodes.

Together, these firms are expected to bring total production of sub-3nm wafers to about 24 million per year by 2030, up from an estimated 12 million in 2025, according to data from SEMI and Yole Group.
That figure includes the massive U.S. fab expansions now underway: TSMC’s Arizona facility, Samsung’s complex in Taylor, Texas, and Intel’s foundry buildout in Ohio and Arizona. Collectively, these programs represent more than $250 billion in new investment over the next five years. Even with that surge, capacity will remain tight because AI demand is scaling faster than lithography tools and packaging plants can be built.
But wafer counts tell only part of the story. What ultimately matters is yield, the percentage of good chips that survive the manufacturing process. At today’s most advanced geometries (3nm and below), yields are volatile.
As NVIDIA’s CFO noted in 2024, “CoWoS packaging remains the primary constraint.” TSMC has echoed this, with C.C. Wei stating that demand for advanced packaging exceeds their current throughput.
In our model, we combine wafer output and yield to estimate usable chip supply. At a conservative 100 usable accelerators per wafer after losses, the industry would produce roughly 7 million advanced GPUs and ASICs in 2025, growing to over 21 million by 2030. These are the physical boundaries of AI compute or the maximum number of high-performance chips the world can deliver under realistic conditions.
Year | Wafers per year (≤3 nm) | Commentary |
|---|---|---|
2025 | 12M | Leading-edge ≈ 1.0M wpm. Includes early N2 pilots and 18A start. |
2026 | 14M | Tool deliveries and packaging throughput improve. |
2027 | 17M | 2 nm mass production, Intel and Samsung yields stabilize. |
2028 | 20M | Advanced packaging becomes a gating factor. |
2029 | 22M | Early 1.6 nm (A16) lines. |
2030 | 24M | Assumes U.S. and EU fabs reach target utilization. |
This constraint-driven approach reframes how investors should think about AI growth. It is not a question of whether demand will exist. It is a question of how fast supply can catch up. Every marginal gain in yield, every additional EUV tool, and every packaging advance directly converts into incremental TAM. In this market, manufacturing efficiency is the new revenue driver.
What Percent of Chips Go to AI?
Once total wafer output is established, the next question is how much of that capacity actually flows into artificial intelligence.
This is where the modeling turns from engineering to interpretation.
AI chips share manufacturing lines with a wide range of high-performance computing (HPC) products — CPUs, GPUs for gaming and workstations, networking silicon, and even mobile processors that use similar nodes.
Foundries rarely disclose how many wafers are reserved for each category, but the financial composition of their revenue tells the story indirectly.
TSMC, for instance, reported in 2025 that roughly 60 percent of its wafer revenue now comes from HPC and AI-related designs, a share that has climbed steadily from around 40 percent in 2022. Samsung and Intel are following the same trajectory as they ramp their 3 nm and 18A nodes.
While revenue share is not the same as wafer allocation, it does signal where utilization pressure is concentrated. AI accelerators consume far larger die areas than mobile chips and require advanced packaging such as CoWoS or InFO-SoIC, meaning each design pulls more wafers per dollar of end product.
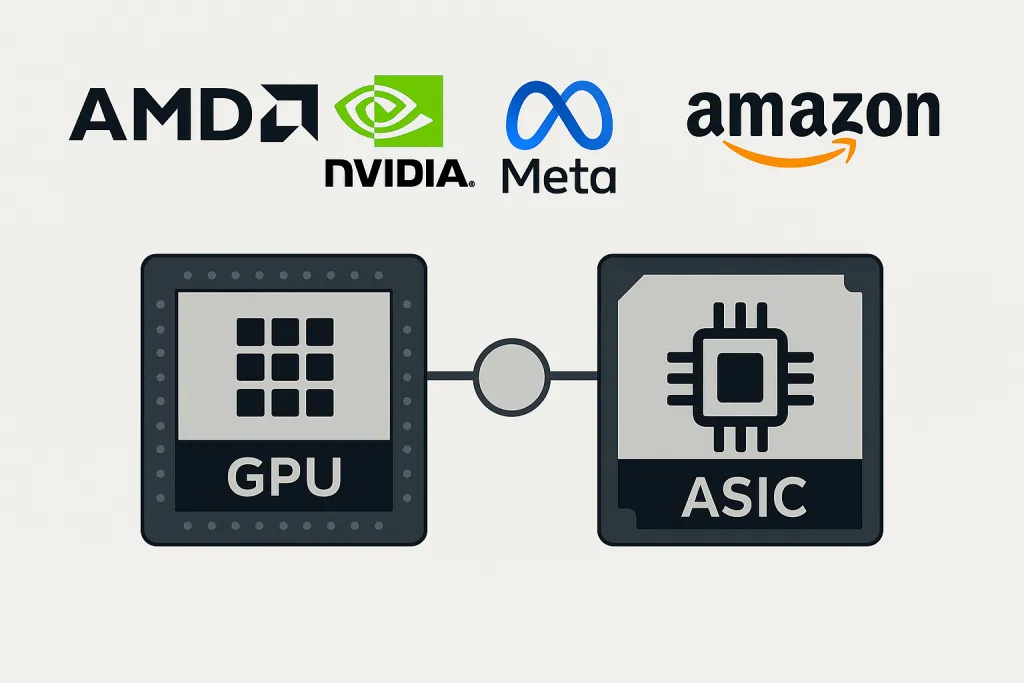
In our model, we estimate that about 60 percent of advanced-node wafer capacity in 2025 will be dedicated to AI and HPC workloads, rising toward 70 percent by 2030 as inference and edge deployments scale.
This range is not absolute.
Driver | Explanation |
|---|---|
OpenAI & Microsoft | Joint cluster buildouts exceed $100B through 2028; compute demand surges. |
Google (TPU) | TPU v5 deployments scale across training and inference; efficiency pushes wafer prioritization. |
Meta (MTIA) | Record AI capex ($40B+) and custom chip programs expand compute dependency. |
Amazon (Trainium/Inferentia) | Internal silicon offsets Nvidia reliance; wafer share grows across AWS. |
New GPU lines (Rubin, MI450/500) increase silicon area per die and total wafer pull. |
If mobile demand weakens or hyperscalers’ capex accelerates, the share could rise faster, pushing our total market size higher. Conversely, if yield improvements allow more efficient die utilization or if specialized ASICs take a larger share of inference workloads, AI’s wafer allocation could fall closer to 50 percent.
Acknowledging that uncertainty matters because it defines the sensitivity of the entire TAM model. A ten-point swing in allocation changes the output by hundreds of billions of dollars. That is why Northwise frames capacity as a dynamic constraint rather than a fixed ceiling.
The fabs will always run full, but what fills them, AI, mobile, or automotive, will decide how the value flows through the ecosystem.
In the years ahead, the most important signal for investors may not be quarterly revenue at NVIDIA or AMD, but rather the language in TSMC’s management commentary about mix, utilization, and advanced-node share.
Each percentage point of allocation is a leading indicator of where the next trillion dollars of compute will be manufactured.
AI Bottlenecks: Effective Yield and Packaging
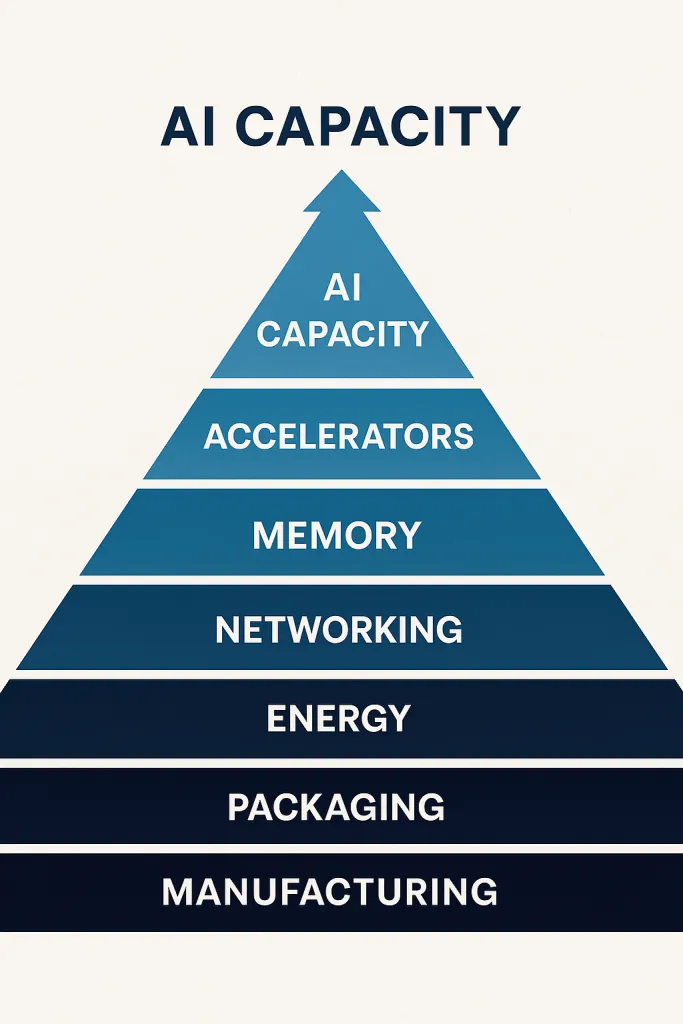
Allocating wafers to AI gives us a ceiling on potential production. But what really determines how much usable compute the world can deploy is what survives the journey through the fab and the packaging line.
Every wafer starts as potential. Only a fraction becomes a functional AI accelerator. At 3 nanometers and below, the process is unforgiving, hundreds of layers, billions of transistors, and tolerances measured in atoms. A single defect can render an entire die useless. That is why yield — the ratio of good chips to total chips produced — is the most critical multiplier in our model.
Even after a chip clears the fab, it faces another bottleneck: advanced packaging. High Bandwidth Memory stacks, silicon interposers, and chiplet integration are now as complex as the wafers themselves. These steps are so demanding that packaging capacity has quietly become the new constraint on AI production.
Early 3nm production for Apple’s A17 Pro reportedly achieved yields near 70 percent, while initial 2nm and 18A lines are expected to begin closer to 55–60 percent. As processes mature and defect density improves, we project effective yields for advanced AI accelerators to rise toward 72 percent by 2030.
Yield improvement is not linear, however. Each new node introduces additional complexity: more layers, denser interconnects, and tighter tolerances. Packaging adds another layer of fragility. High Bandwidth Memory (HBM) stacks and interposers are often the true gating factors in AI chip production.
AI Accelerator Output and ASP Framework
Each wafer yields about 100 usable accelerators after losses. At full utilization, that equates to 7 million units in 2025 and 21 million by 2030.
Pricing assumptions use a weighted average across GPU and ASIC families. Our model includes popular ASICs, as well as Nvidia’s Blackwell → Rubin → Rubin Ultra and AMD’s MI350 → MI400 → MI450 → MI500.
Assigning price trajectories to AI accelerators is not a static exercise. It reflects the interplay between scarcity, manufacturing cost, and product mix across a rapidly evolving landscape.
NVIDIA continues to command the highest ASPs in the industry because of its full-stack moat: hardware, networking, and CUDA software that collectively justify a structural premium. We model its average selling price rising from $30,000 in 2025 to $38,000 by 2030, a steady climb supported by consistent demand and limited competition at the high end.
AMD’s ASP curve is flatter, starting at $23,000 and reaching $33,000 by 2030. The company’s strategy emphasizes broader deployment and cost efficiency over exclusivity. While its flagship MI450 and MI500 lines will approach parity with NVIDIA’s performance, earlier MI300 and MI350 products will continue shipping through the decade. That cross-generational overlap keeps AMD’s blended ASP below NVIDIA’s even as total unit volumes expand.
ASICs are harder to price because they are largely built for internal use by hyperscalers such as Google, Amazon, and Microsoft. These chips remove the vendor margin and software value embedded in GPUs, resulting in lower effective ASPs. We begin our model at $9,000 in 2025, rising gradually to $14,000 by 2030, reflecting modest cost inflation offset by efficiency gains and volume scaling.
Year | Nvidia ASP | AMD ASP | ASIC ASP | Weighted Average ASP |
|---|---|---|---|---|
2025 | $30,000 | $23,000 | $9,000 | $26,800 |
2026 | $32,000 | $27,000 | $10,000 | $28,500 |
2027 | $35,000 | $30,000 | $11,000 | $30,000 |
2028 | $36,000 | $31,000 | $12,000 | $31,000 |
2029 | $37,000 | $32,000 | $13,000 | $31,800 |
2030 | $38,000 | $33,000 | $14,000 | $32,400 |
Importantly, we do not model the industry using only top-tier chip prices. Each generation of AI hardware remains in production for several years, meaning older, lower-priced accelerators continue to make up a meaningful share of deployments. This blended approach smooths extreme ASP volatility and more accurately captures how capacity converts into revenue across the cycle.
Our weighted average across NVIDIA, AMD, and ASIC systems yields a composite ASP of $26,800 in 2025, rising to $32,400 by 2030. This growth is driven not by speculative pricing but by the compounding value of compute itself. As yields, packaging, and performance per watt improve, each dollar spent on silicon buys exponentially more capability, yet supply remains tight enough to preserve pricing power.
In the end, pricing in this market is a reflection of constraint. Every wafer that can be produced is already spoken for, and that structural scarcity ensures stability where most expect compression.
Ai Accelerator TAM 2030: Training & Inference
With unit output and pricing established, the next step is synthesis. This is where physical capacity and economic reality converge into a clear picture of the total addressable market for AI accelerators.
Our model begins with wafer supply, adjusts for yield and allocation, and multiplies by the weighted ASP curve outlined above. The outcome is not a forecast based on sentiment but a realistic upper bound on what the world can physically produce.
Even under conservative assumptions, the global market for AI accelerators used in both training and inference expands from roughly $210 billion in 2025 to more than $1 trillion by 2030. This growth is driven by manufacturing progress, not speculation.
NVIDIA captures the majority of this value through its software ecosystem and performance lead, while AMD’s share rises as its product cadence accelerates. ASICs continue to scale within hyperscaler data centers, where internal silicon increasingly displaces third-party GPUs.
We also factor in the longevity of older chips. Each generation continues shipping for years after launch, often serving inference or regional workloads. This cross-generational continuity keeps volumes high and ASPs balanced even as technology advances.
The table below reflects this blended reality, showing how wafer supply, yield, and pricing translate directly into revenue. In practice, the industry is not simply producing chips. It is producing compute, and each incremental manufacturing gain converts directly into monetizable capacity.
This is how our AI accelerator market forecast 2030 with trillion-dollar figures emerges. It is not driven by market enthusiasm but by the physical limits of what can be built.
Year | Nvidia | AMD | ASIC / Custom Silicon |
|---|---|---|---|
2025 | 82% | 14% | 4% |
2026 | 77% | 18% | 5% |
2027 | 72% | 22% | 6% |
2028 | 68% | 24% | 8% |
2029 | 65% | 25% | 10% |
2030 | 62% | 26% | 12% |
By 2030, the AI accelerator market has effectively become a duopoly anchored by NVIDIA and AMD, with both firms accounting for nearly nine out of every ten dollars spent on data center compute. The distinction between GPUs and ASICs is fading as hyperscalers move toward co-developed, semi-custom inference solutions, often designed in collaboration with NVIDIA or AMD rather than in isolation.
This hybrid landscape reflects a pragmatic shift: hyperscalers no longer choose between off-the-shelf or in-house silicon; they combine both, optimizing performance, cost, and software integration. The long-term direction of the market is not fragmentation but partnership-driven consolidation, where compute becomes a jointly engineered resource rather than a competitive product line.
Why Analysts Underestimate AI Demand
The gap between Wall Street’s models and the physical reality of AI infrastructure comes down to how and where analysts start their thinking. Most begin with demand forecasts and work backward. We start our AI accelerator market forecast 2030 with supply and work forward. The difference produces entirely different worlds.
Here’s why so many models miss the mark:
- They anchor to adoption curves, not manufacturing curves.
Traditional TAM models assume AI adoption follows enterprise software diffusion: gradual, capped, and cyclical. In truth, AI hardware follows a capacity curve, not a demand curve. As long as fabs can produce advanced nodes, they will be sold. - They underestimate scarcity.
TSMC’s 2nm lines are fully booked years in advance, and packaging throughput is already a gating factor. Supply, not demand, defines the slope of the curve. Forecasts built on user adoption rather than wafer availability miss the constraint that truly governs this market. - They flatten inference growth.
Many models assume training remains the core workload. In reality, inference will soon outscale training by a wide margin as billions of devices and agents come online. That shift fundamentally changes the shape of compute demand. - They benchmark to old cycles.
Analysts treat AI as another semiconductor boom that must normalize, similar to PCs or smartphones. But compute does not plateau like consumer devices. It compounds because model usage compounds. Each new model spawns millions of parallel tasks, sustaining exponential demand. - They ignore pricing power in constraint.
Conventional models assume ASPs will fall as competition rises. History suggests the opposite in supply-limited environments. When scarcity defines production, companies with access to capacity set the price floor, not the market. - They underestimate feedback loops.
AI models are now designing chips, optimizing data centers, and accelerating their own compute needs. Analysts rarely factor in these recursive loops that make demand not just exponential but self-reinforcing.
The Psychology of Underestimation
Even when the math is clear, human nature resists exponential thinking. Analysts, investors, and even executives tend to model growth as if it must slow because that is what feels rational. Our instincts evolved in linear systems, not compounding ones. We are wired to look for plateaus.
This bias is known as exponential growth neglect. It causes even sophisticated observers to underestimate how quickly capacity-driven markets can expand once they cross a self-reinforcing threshold. AI has already reached that threshold. Compute now begets more compute. Each new model accelerates the creation of the next, each hardware generation amplifies the one before it, and the cycle compounds faster than most can process.
Institutional inertia adds another layer. Financial firms are built to forecast around predictability, not acceleration. Compliance departments favor conservative baselines because overestimation carries reputational risk, while underestimation does not. As a result, Wall Street tends to price exponential markets as if they were cyclical.

This creates a deep disconnect between what investors believe and what is physically occurring. AI infrastructure does not behave like consumer technology. It behaves like an industrial expansion wave, where capital, talent, and power are continuously reinvested into more capacity. Each round of scaling increases both supply and demand, forming a closed feedback loop that is emotional as much as mathematical.
At Northwise, we call this the psychology of disbelief. It is the moment where the future feels too large to be possible. Investors hesitate, analysts hedge, and the data quietly compounds in the background. Those who understand that capacity defines valuation, not sentiment, recognize this disbelief as the signal, not the noise.
Phase 2: The Full AI Compute Stack
Phase 1 modeled only GPUs and ASIC accelerators used for AI training and inference. But those chips do not exist in isolation. Every GPU cluster depends on memory, networking fabrics, and host CPUs that coordinate workloads.
These adjacent layers add hundreds of billions of dollars to the compute stack and understanding their economics is critical for accurate TAM forecasting.
The Hierarchy of the AI Compute Stack
AI clusters are built in tiers. Each rack of accelerators draws from multiple complementary hardware markets:
- Memory: High Bandwidth Memory (HBM3e → HBM5) and conventional DRAM feeding GPU and CPU pipelines.
- Networking: High-speed interconnects (InfiniBand, Ethernet, NVLink, Ultra Ethernet Consortium standards) enabling data transfer across GPUs.
- Host CPUs: EPYC, Xeon, and ARM-based controllers that manage orchestration and data preprocessing.
These layers scale with accelerators because each GPU requires more bandwidth, more interconnects, and more CPU coordination as clusters grow.
AI Memory Modeling
We start with public shipment forecasts from SK hynix, Micron, and Samsung. Their investor guidance and reports from TrendForce and Omdia anticipate AI-related HBM revenue growing from ~$25B in 2025 to $150–200B by 2030, implying a ~40% CAGR.
Adding DRAM used in AI servers brings total AI memory TAM to roughly $400B by 2030.
Year | HBM + DRAM TAM ($B) | CAGR | Commentary |
|---|---|---|---|
2025 | 55 | — | HBM3e and early HBM4 ramp; capacity constrained. |
2026 | 80 | 37% | Hyperscaler contracts and packaging expansion. |
2027 | 120 | 40% | HBM4/HBM4e widespread adoption. |
2028 | 200 | 41% | HBM5 announced; DRAM price rebound. |
2029 | 300 | 38% | AI systems dominate DRAM mix. |
2030 | 400 | 35% | HBM5/6 era; density increases and ASP moderation. |
AI Networking and Interconnects
Networking is the circulatory system of the AI data center. Without bandwidth, accelerators idle. Companies like Broadcom, Arista Networks, Marvell, and NVIDIA (InfiniBand/NVLink) capture this segment.
Based on data from Dell’Oro Group and IDC, AI-driven network silicon revenue grows from ~$40B in 2025 to ~$250B in 2030, a ~45% CAGR.
Year | Networking TAM ($B) | CAGR | Commentary |
|---|---|---|---|
2025 | 40 | — | Ethernet/InfiniBand high-end adoption starts. |
2026 | 65 | 41% | 800G and 1.6T interconnect rollout. |
2027 | 100 | 43% | Cloud migration to AI fabrics. |
2028 | 160 | 44% | ASIC offload chips proliferate. |
2029 | 210 | 40% | Optical interconnect adoption. |
2030 | 250 | 38% | Rack-scale optical systems mainstream. |
AI Related CPUs and System Control Logic
Though less glamorous, CPUs remain indispensable. Every 8–16 accelerators need a host processor, typically AMD EPYC, Intel Xeon, or ARM variants. Based on hyperscaler disclosures and server TAM data from IDC and Gartner, we estimate AI-driven CPU revenue at ~$130B by 2030, rising from ~$35B in 2025.
This growth rate is already showing in AMD’s recent reacceleration in CPU demand, and NVDA’s sudden push to partner with Intel in the space.
Year | CPU TAM ($B) | CAGR | Commentary |
|---|---|---|---|
2025 | 35 | — | EPYC Genoa, Sapphire Rapids shipments. |
2026 | 50 | 36% | Turin and Granite Rapids adoption. |
2027 | 75 | 38% | ARM custom CPUs enter mix. |
2028 | 100 | 35% | Co-packaged CPU-GPU clusters. |
2029 | 115 | 27% | Slower growth as efficiency improves. |
2030 | 130 | 23% | Mature phase; sustained by inference orchestration. |
AI Total Addressable Market 2030
Combining all layers gives a more realistic picture of AI infrastructure economics. The accelerator layer remains roughly half of total spend, with memory and networking close behind. Each depends on the same bottlenecks: advanced packaging, energy, and capital.
Layer | 2030 TAM ($B) | Share |
|---|---|---|
Accelerators (GPUs/ASICs) | 1,020 | 50% |
Memory (HBM + DRAM) | 400 | 25% |
Networking / Interconnect | 250 | 15% |
Host CPUs / Control Logic | 130 | 10% |
Total AI Compute Stack | 1,800 | 100% |
This model draws directly from hyperscaler budgets and industry disclosures. For instance, Meta’s 2025–2026 AI infrastructure capex guidance surpasses $40B, with a third allocated to networking and system integration. Amazon, Microsoft, and Google follow similar ratios in their filings and earnings calls.
Why Modeling the Full AI Stack Matters
Phase 2 proves that the AI supercycle extends beyond GPUs. The ecosystem multiplier means every dollar spent on accelerators drives nearly another dollar in adjacent hardware.
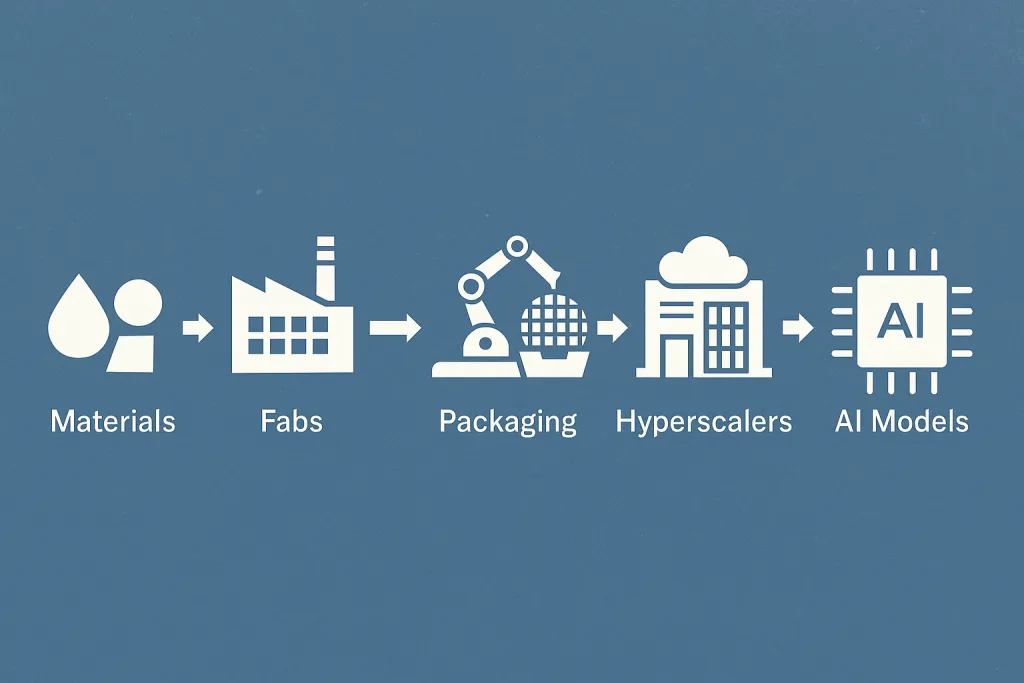
This makes TAM compression narratives obsolete. As long as compute demand grows, memory, networking, and CPUs remain tied to the same constraint: manufacturing and energy capacity.
From Demand Curves to Capacity Curves
AI is not another tech wave. It is an infrastructure revolution. Every chip that can be manufactured will be purchased, and every watt that can be generated will be consumed. Supply, not demand, will continue to define the slope of this curve for the rest of the decade.
The exercise of working backward from manufacturing capacity reveals a truth most analysts miss: there is no “AI bubble.” There is only a bottleneck. As long as the world remains physically constrained by wafer output, advanced packaging, and power availability, demand cannot meaningfully slow. Each new node expansion or energy breakthrough only unlocks the next leg of the cycle.
This is why the trillion-dollar TAM is not an abstraction but a floor. The total AI compute stack — accelerators, memory, networking, and control logic — already maps to the most powerful industrial supply chain of the century. Companies that command capacity, directly or indirectly, are not cyclical beneficiaries. They are the infrastructure.
Yet the market still values many of these players as if their trajectories will flatten. AMD is the clearest example. Its MI400 and MI450 platforms will ship into a demand curve that is not softening but steepening.
Its partnerships with hyperscalers give it exposure to both the GPU and ASIC layers of the market, meaning much of the so-called “custom silicon” demand that analysts attribute elsewhere will, in practice, flow through AMD’s semi-custom design pipeline.
While NVIDIA remains the dominant force, the market’s negligence toward AMD’s long-term positioning reflects the same bias that keeps most investors underestimating exponential systems. They see a price chart instead of a capacity map. Northwise sees a company aligned with the physics of the next decade: one that is not constrained by imagination but by how fast the world can build fabs and generate power.
This is the central insight of the Northwise framework: markets are not shaped by what is possible but by what is producible. The firms that sit closest to the constraint line are the ones with the most asymmetric upside.

Celsius Stock Analysis: The Shelf Reset and the Second Growth Curve
Celsius stock analysis of the shelf reset, Alani growth, Pepsi economics and cash flow, with a 2030 model and a Premium valuation and entry-price framework.

Meta AI Spending: The Customer Is Already Here
Can Meta turn AI spending into shareholder returns? We model advertising, Muse, hardware, capital costs and cash flow through 2030, with a full valuation.

IREN Stock Dilution: Can the Build Reach Shareholders?
IREN stock analysis of AI growth, funding and dilution through 2030. Read our full valuation, 27 scenarios and price zones free. Excel model is Premium.
Northwise Portfolios
See how the research becomes real decisions
Reader discussion
Discuss the research
Create a Free account to join the discussion with a display name.
Create a Free Account
No comments yet. Start a thoughtful discussion.