
Meta Stock Forecast 2030

A long-term Meta stock forecast 2030 analyzing ad monetization, AI-driven margin expansion, scenario valuations, price targets & buy zones.
In this article

META Stock Forecast 2030: Scenario Analysis of Ads, AI, and Long-Term Value
A structural valuation framework modeling Meta’s advertising engine, AI-driven operating leverage, and multi-scenario outcomes through 2030.
Executive Summary
Meta enters the second half of the decade with a business model that is often misunderstood in public discourse but highly coherent when examined through an economic lens. The company is not in the process of reinventing itself. It is refining and extending a performance-driven advertising system that already operates at global scale, while using AI to reshape its cost structure and expand its long-term operating leverage.
At its core, Meta remains a platform where advertisers allocate spend based on measurable outcomes rather than abstract reach. Improvements in targeting, ranking, creative optimization, and measurement continue to raise advertiser return on investment, allowing pricing power to improve even as inventory expands. This dynamic underpins the durability of Meta’s revenue base and provides a stable foundation for long-horizon compounding.
AI plays a central role in this framework, but not in the way it is often framed externally. The most economically important impact of AI inside Meta is internal. Automation, improved systems efficiency, and faster iteration reduce labor intensity and flatten operating expense growth. These changes alter the margin profile of the business before any meaningful contribution from standalone AI monetization is required.
Beyond the core advertising engine, Meta is gradually extending monetization across additional surfaces within its existing ecosystem. Messaging, conversational commerce, and emerging agentic workflows introduce new execution layers that sit on top of established distribution rather than competing with it. These extensions are designed to scale deliberately, preserving user experience and ecosystem control while adding incremental economic value over time.
This report evaluates Meta through a scenario-based framework that emphasizes structural durability, constraint analysis, and capital allocation discipline. It avoids short-term forecasting, headline price targets, or speculative adoption curves. Instead, it focuses on how Meta’s advertising engine, AI-driven operating leverage, and expanding execution surfaces interact over time to produce a wide but asymmetric range of long-term outcomes.
The analysis that follows is intended for investors with a multi-year horizon who are evaluating Meta as a long-duration compounder rather than a narrative-driven trade.
Table of Contents
1. Structural Thesis and Modeling Orientation
1.1 What Meta Is Being Modeled As in 2030
1.2 What This Framework Explicitly Avoids
1.3 Why Scenario-Based Modeling Is Required for Meta
2. Meta’s Advertising Engine as a Long-Duration Economic Utility
2.1 Performance Advertising at Global Scale
2.2 ROI-Driven Pricing Power and Demand Elasticity
2.3 Meta’s Share of Global Advertising Spend
2.4 Why Structural Ad Decline Is the Wrong Risk Frame
3. AI as Margin Architecture, Not a Replacement Business
3.1 Internal AI as a Cost Suppression Engine
3.2 Operating Leverage and Labor Intensity Reduction
3.3 Revenue per Employee Expansion
3.4 Why AI Is Modeled as Margin First, Monetization Second
4. Product Surface Expansion and Incremental Inventory Growth
4.1 Threads as Incremental Attention and Monetization Surface
4.2 WhatsApp, Messaging, and Conversational Commerce
4.3 Agentic Systems Embedded in Existing User Flows
4.4 Reality Labs as a Contained, Non-Core Variable
5. Financial Trajectory Through 2030
5.1 Revenue Growth Durability Across Cycles
5.2 Operating Margin Expansion Drivers
5.3 Free Cash Flow Scaling and Visibility
5.4 Share Count Reduction as Structural EPS Support
6. Scenario Framework and Valuation Outcomes
6.1 Bear Case: Politically Constrained, Still Compounding
6.2 Base Case: AI-Accelerated Advertising Engine
6.3 Bull Case: Ads and AI Execution Layer Compounding Together
6.4 Scenario Comparison and Key Differentiators
7. Capital Allocation, Buybacks, and EPS Leverage
7.1 Capital Return Philosophy
7.2 Buybacks as a Long-Term EPS Engine
7.3 Interaction Between Free Cash Flow and Valuation Multiples
8. Risk Framework and Constraint Analysis
8.1 Regulatory and Political Friction
8.2 Geographic ARPU Dispersion and Europe
8.3 Youth Engagement and Platform Evolution
8.4 What Would Actually Break the Model
9. Margin of Safety and Downside Protection
9.1 Where the Market Is Likely Overpricing Risk
9.2 Structural Supports to Earnings and Free Cash Flow
9.3 Why the Bear Case Still Produces Compounding
9.4 Downside Scenarios That Are Not Modeled and Why
10. Probability Weighting and Expected Value Synthesis
10.1 Scenario Probability Assignments
10.2 Probability-Weighted Outcome
10.3 Downside Boundedness Versus Upside Asymmetry
11. Northwise Positioning and Portfolio Conviction
11.1 Current Position Size and Portfolio Weighting
11.2 Why Meta Is a High-Conviction Holding
11.3 Portfolio Fit and Correlation Considerations
11.4 Conditions That Would Change Our Positioning
12. Final Assessment and Long-Term Investor Fit
12.1 Meta as a 2030 Compounder
12.2 Appropriate Time Horizon and Risk Profile
12.3 The Northwise View
1. Structural Thesis and Modeling Orientation
This section establishes the analytical lens used throughout the report. The goal is to define the economic structure that governs Meta’s long-term behavior and to anchor all subsequent modeling, scenario construction, and risk analysis to that structure. The emphasis is on durability, scalability, and constraint awareness rather than short-term narrative interpretation.
1.1 What Meta Is Being Modeled As in 2030
Meta Platforms is modeled as a global performance advertising utility with AI-enabled operating leverage and expanding execution layers built on top of its existing distribution.
Advertising remains the economic foundation. Meta’s platforms sit directly inside advertiser allocation decisions where spend is determined by measurable outcomes such as conversion efficiency, engagement quality, and downstream revenue impact. This positioning allows pricing power to scale alongside performance improvements rather than relying on inventory growth alone.
AI reinforces this system by continuously improving targeting, ranking, creative optimization, and measurement. These gains raise advertiser return on investment and support higher revenue per impression over time. By 2030, revenue growth reflects a combination of performance gains, pricing efficiency, and incremental surface expansion.
Under this framework, Meta functions as infrastructure for performance-driven commerce and engagement at global scale.
1.2 What This Framework Explicitly Avoids
This framework focuses on mechanisms that have demonstrated persistence across cycles and regulatory environments.
The analysis centers on advertising economics, operating leverage, and capital allocation rather than speculative shifts in user behavior or rapid monetization of emerging technologies. AI is incorporated where it alters cost structure, system efficiency, and execution capacity inside existing platforms.
Product initiatives are evaluated based on their ability to extend or reinforce the core advertising system. Valuation logic follows cash generation, margin structure, and reinvestment discipline rather than headline narratives or isolated growth metrics.
These boundaries narrow the analysis to drivers that plausibly shape Meta’s long-term economic trajectory.
1.3 Why Scenario-Based Modeling Is Required for Meta
Meta operates across regulatory regimes, product surfaces, and monetization layers that evolve on different timelines. Geographic constraints vary. Product monetization ramps unevenly. AI reshapes internal efficiency earlier than it contributes directly to external revenue. Capital allocation interacts with each of these variables.
Scenario-based modeling allows these dynamics to be examined without collapsing them into a single outcome. It separates structurally durable components from variables that introduce dispersion in results. It also clarifies which levers influence long-term value creation and which primarily affect timing.
Across all scenarios in this report, several elements remain stable. The advertising engine persists. Internal AI continues to reshape operating leverage. Free cash flow anchors capital returns. Differences across scenarios arise from execution pace, regulatory friction, and the contribution of incremental execution layers over time.
This approach frames Meta as a long-duration compounder whose value emerges from system behavior rather than any single outcome.
2. Meta’s Advertising Engine as a Long-Duration Economic Utility
This section examines the economic core of Meta’s business. The objective is to explain why advertising inside Meta’s ecosystem behaves less like cyclical media spend and more like a long-duration utility tied to measurable performance outcomes. This distinction is central to understanding revenue durability, pricing power, and long-term compounding.
2.1 Performance Advertising at Global Scale
Meta Platforms operates one of the largest performance advertising systems in the global economy. Its platforms sit directly inside user workflows where intent, attention, and action converge. This positioning allows advertisers to allocate spend based on observed outcomes rather than inferred brand lift.
At scale, this creates a feedback loop. Advertisers deploy campaigns, observe conversion performance in near real time, adjust creative and targeting, and reallocate budget toward channels with the highest marginal return. Meta’s systems are designed to absorb and accelerate this loop, increasing throughput rather than merely serving impressions.
By 2030, the relevance of this structure lies in its repeatability. Millions of advertisers participate across geographies and business sizes, producing a diversified demand base that smooths individual category cycles and reduces dependence on any single end market.
2.2 ROI-Driven Pricing Power and Demand Elasticity
Pricing power within Meta’s advertising system emerges from return on investment rather than scarcity. As targeting accuracy, ranking efficiency, and creative optimization improve, advertisers generate higher revenue per dollar spent. This allows Meta to capture a greater share of the value created without materially impairing advertiser economics.
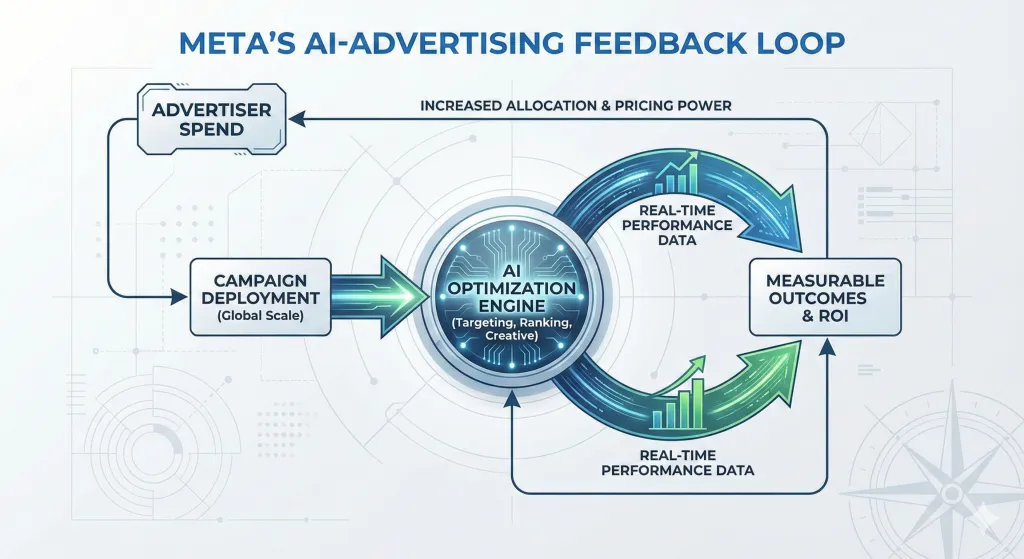
Demand elasticity behaves differently under this model. When performance improves, spend often increases rather than contracts, particularly among small and medium-sized businesses that scale budgets alongside returns. This dynamic supports sustained pricing power even as inventory expands across new surfaces.
Over time, this structure produces a system where revenue growth reflects efficiency gains inside the ad stack as much as growth in advertiser count or user engagement.
2.3 Meta’s Share of Global Advertising Spend
Meta’s advertising engine continues to capture incremental share of global advertising budgets due to its ability to demonstrate measurable outcomes across a wide range of objectives. Performance-driven spend tends to consolidate toward platforms that offer scale, measurement, and rapid iteration.
This consolidation effect compounds over time. As more advertisers rely on Meta’s tools to manage acquisition, retention, and monetization, the platform becomes embedded in operating workflows rather than treated as a discretionary channel. Switching costs increase as campaign data, optimization history, and internal expertise accumulate.
By 2030, this positioning supports share stability and gradual expansion within the broader advertising market, even as new formats and channels emerge.
2.4 Advertising as Infrastructure Rather Than Media
The defining feature of Meta’s advertising engine is its role as infrastructure for commerce and engagement rather than as a distribution channel for content alone. Advertisers interact with the system as a performance layer that translates demand into outcomes at scale.
This infrastructure-like behavior explains the durability of revenue through macro cycles and shifts in user behavior. As long as businesses seek efficient ways to acquire customers and drive transactions, systems that compress the distance between intent and conversion retain economic relevance.
Under this framing, Meta’s advertising engine functions as a foundational layer in the digital economy. Subsequent sections build on this foundation by examining how AI and incremental execution surfaces alter the efficiency and reach of this system over time.
3. AI as Margin Architecture, Not a Replacement Business
This section addresses how AI changes the economics of Meta’s business without redefining its core. The focus is on internal deployment, system efficiency, and operating leverage rather than external product narratives. AI alters how value is produced inside the platform before it alters what the platform sells.
3.1 Internal AI as a Cost Suppression Engine
Meta Platforms deploys AI across ranking, targeting, content delivery, integrity, and infrastructure optimization. The most immediate economic impact of these systems appears in cost structure rather than revenue mix.
Automation reduces manual intervention across moderation, ad optimization, and product iteration. Model-driven systems replace incremental headcount in functions that previously scaled linearly with usage. This effect compounds as models improve and deployment broadens across internal workflows.
By the end of the decade, the relevance of AI inside Meta lies in its ability to support revenue growth without proportional growth in operating expense.
3.2 Operating Leverage and Labor Intensity Reduction
AI shifts Meta’s labor intensity by increasing output per employee across engineering, product, and go-to-market functions. Improvements in tooling, code generation, experimentation velocity, and decision automation compress development cycles and reduce coordination overhead.
This change reshapes operating leverage. Revenue growth no longer requires commensurate increases in personnel or support infrastructure. Fixed costs absorb a larger share of incremental revenue, lifting operating margins even in periods of moderate top-line growth.
The result is a margin profile that reflects system efficiency rather than cost cutting.
3.3 Revenue per Employee Expansion
Revenue per employee serves as a practical proxy for AI-driven productivity gains. As internal systems handle greater portions of optimization, experimentation, and execution, human capital shifts toward oversight and strategic design rather than manual execution.
This transition supports sustained expansion in revenue per employee over time. It also reduces sensitivity to labor market tightness and wage inflation, which historically acted as friction on margin expansion for large technology platforms.
By 2030, revenue per employee reflects accumulated efficiency rather than cyclical cost discipline.
3.4 AI as Margin Architecture Before Monetization
AI monetization outside the advertising stack develops on a different timeline than internal efficiency gains. The economic value of AI is therefore realized first through margin expansion and cost avoidance rather than through discrete product revenue.
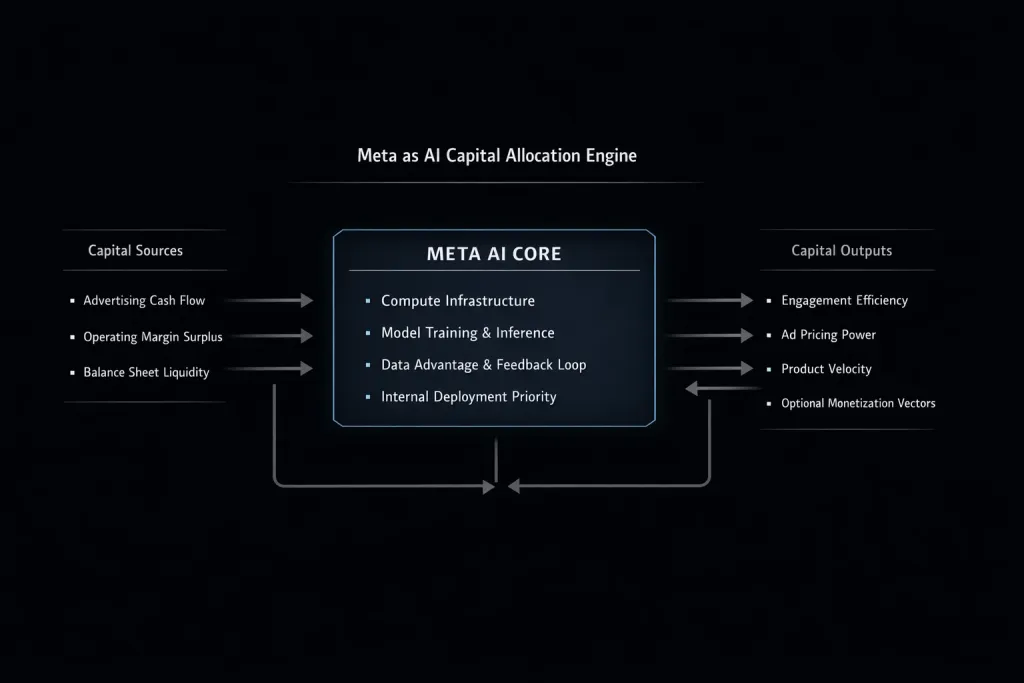
This sequencing matters. Margin architecture reshapes free cash flow durability and capital return capacity without requiring aggressive external pricing or rapid ecosystem shifts. External monetization layers can then be introduced selectively, supported by existing distribution and usage patterns.
Under this framework, AI strengthens Meta’s economic foundation before it expands the surface area of monetization.
4. Product Surface Expansion and Incremental Inventory Growth
Meta’s monetization capacity through 2030 is shaped primarily by inventory expansion inside surfaces it already controls. The company allows advertisers to purchase placements across Facebook, Instagram, Messenger, Threads, WhatsApp, and third-party applications through a unified ad system. This structure allows demand to flow dynamically toward whichever surfaces deliver the highest marginal return at any point in time.
In 2025, Meta generated $200.97B in total revenue. $198.76B came from the Family of Apps segment, while Reality Labs contributed $2.21B. The user base supporting this system reached 3.58B daily active people by the end of the year. Expansion therefore occurs inside an already scaled economic footprint rather than through the creation of new standalone platforms.
4.1 Threads as Incremental Attention and Monetization Surface
Threads contributes economic value through incremental impressions and additional placement optionality within Meta’s existing ad delivery system. It does not require a distinct monetization framework to matter financially. Instead, it expands the set of surfaces capable of absorbing advertiser demand.
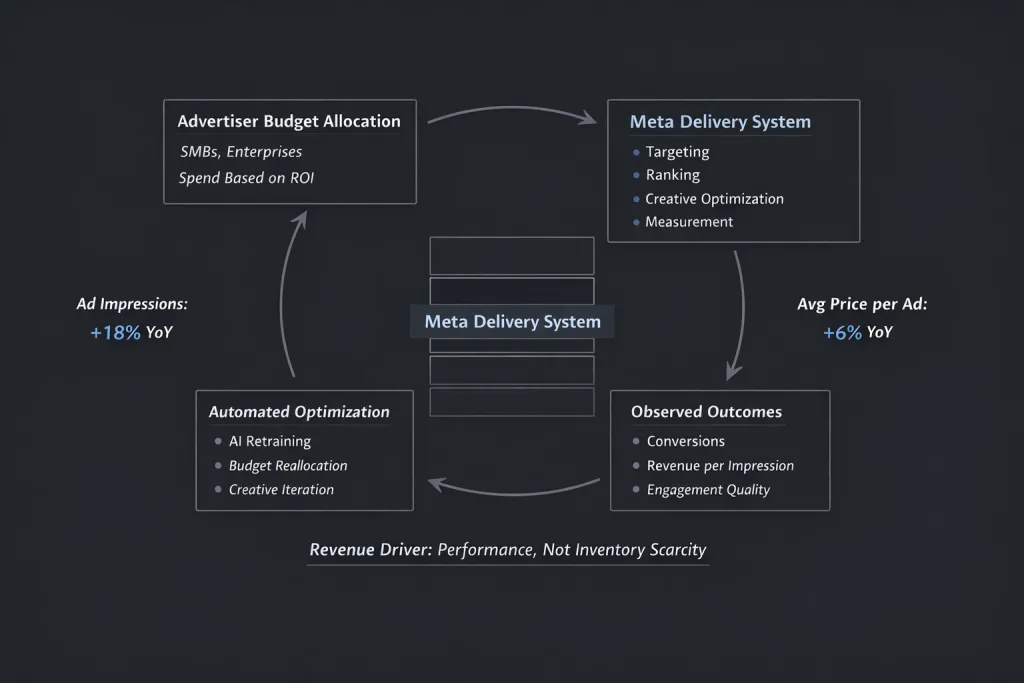
This dynamic is visible at the system level. In Q4 2025, Family of Apps ad revenue reached $58.1B. Ad impressions grew 18% year over year, while average price per ad increased 6%. Management attributed pricing improvement to stronger ad performance and demand rather than changes in ad load.
Threads feeds into this aggregate impression pool over time. As Meta introduces new surfaces, it increases the resilience of impression growth while allowing pricing gains to coexist with inventory expansion.
4.2 WhatsApp, Messaging, and Conversational Commerce
Messaging monetization is already contributing to reported results. In Q4 2025, Family of Apps other revenue totaled $801M, up 54% year over year, driven primarily by growth in WhatsApp paid messaging and Meta Verified subscriptions.
Messaging monetization scales differently than feed-based advertising. It relies on business-initiated conversations, paid messaging mechanics, and commerce-adjacent workflows that deepen monetization without materially increasing traditional ad density.
Because WhatsApp and Messenger sit inside the Family of Apps segment, this revenue integrates directly into Meta’s core economic engine. ARPP is calculated against this same revenue base, allowing messaging monetization to reinforce overall platform economics rather than operate as a separate business line.
4.3 Agentic Systems Embedded in Existing User Flows
Meta’s opportunity in agentic systems is grounded in distribution and interaction volume. The company operates platforms used daily by billions of people, providing a natural environment for automation, business tools, and execution-oriented workflows.
Product-level engagement improvements continue to expand this interaction base. In the US, Instagram Reels watch time increased more than 30% year over year. Facebook product optimizations drove a 7% increase in views of organic Feed and video posts, representing the largest quarterly revenue impact from Facebook product launches in the past 2 years.
These engagement gains increase the number of interactions that Meta’s systems can mediate. Over time, this creates additional surfaces for automation, commerce, and agent-assisted execution to emerge inside workflows users already understand.
4.4 Reality Labs as a Contained, Non-Core Variable
Reality Labs remains economically distinct from the Family of Apps segment. In 2025, the segment generated $2.21B in revenue and recorded an operating loss of $19.19B.
Spending within Reality Labs has become more focused. In 2026, Meta expects approximately 70% of Reality Labs operating expenses to be allocated to wearables initiatives, with the remaining 30% directed toward VR and Horizon initiatives.
From a modeling perspective, Reality Labs functions as a contained variable. In 2025, 82% of Meta’s total costs and expenses were recognized in Family of Apps and 18% in Reality Labs. As long as Family of Apps cash generation continues to scale, Reality Labs spending does not alter the core economic trajectory of the business.
5. Financial Trajectory Through 2030
This section connects Meta’s current financial base to the structural forces that shape its trajectory over the remainder of the decade. The objective is to explain how revenue durability, margin behavior, free cash flow generation, and share count dynamics interact over time, without introducing scenario outcomes or valuation conclusions ahead of their designated sections.
5.1 Revenue Growth Durability Across Cycles
Meta’s revenue base entering the second half of the decade is already large and diversified. In 2025, total revenue reached $200.97B, with $198.76B generated by the Family of Apps segment. This scale matters because it anchors growth in system behavior rather than in any single product surface.
Growth durability is supported by several reinforcing factors. Advertiser demand is distributed across millions of businesses globally. Performance-driven spend scales alongside return on investment rather than discretionary brand budgets. Inventory expansion across multiple surfaces allows demand to express itself without saturating any single feed.
At the system level, these dynamics were visible in late 2025, when ad impressions grew 18% year over year while average price per ad increased 6%. Revenue expansion therefore reflected both volume and efficiency, a pattern that supports persistence across economic environments.
5.2 Operating Margin Expansion Drivers
Operating margin behavior through 2030 is shaped less by cost cutting and more by structural efficiency gains. Internal AI deployment reduces labor intensity across ranking, moderation, experimentation, and infrastructure management. These changes flatten operating expense growth as revenue continues to scale.
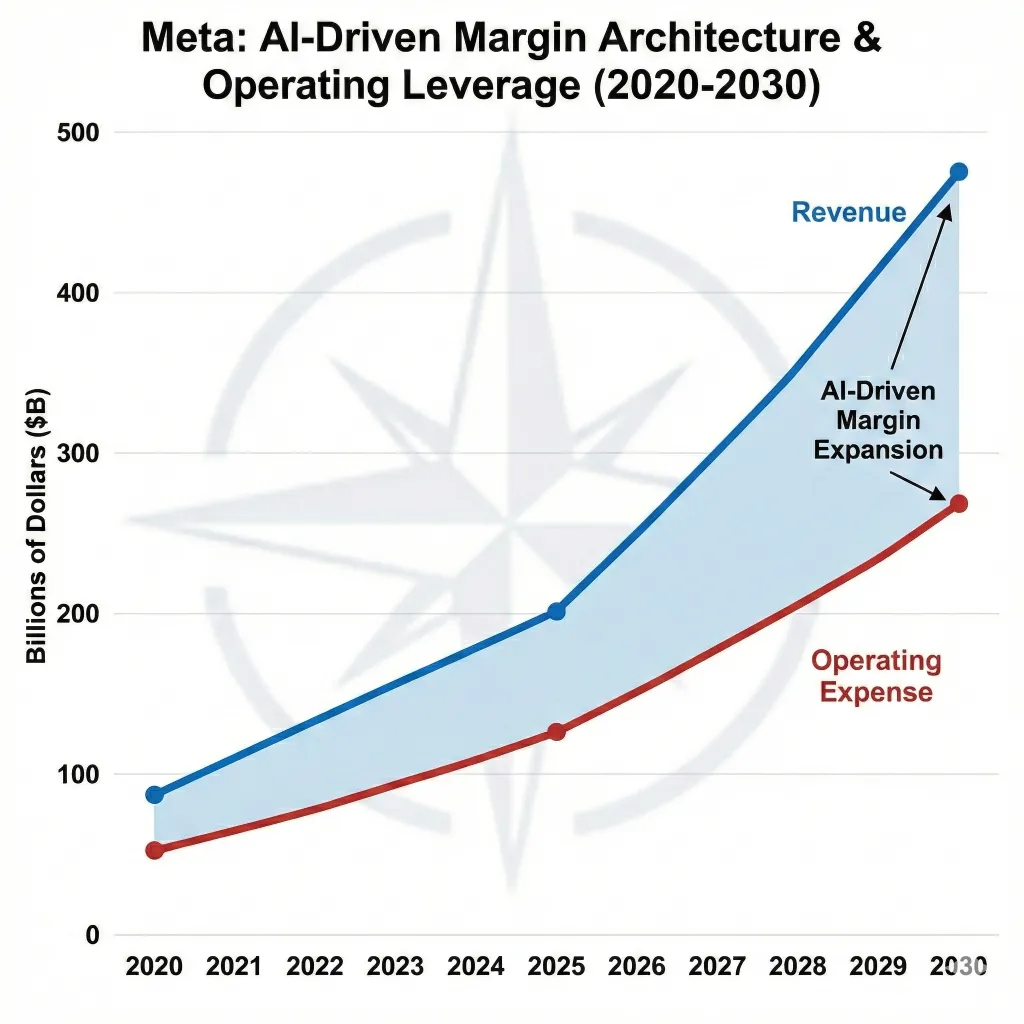
Margin expansion is also supported by the mix of incremental revenue. New monetization layers, including messaging and execution-oriented tools, sit on top of existing distribution and infrastructure. As a result, incremental revenue carries higher contribution margins than earlier generations of product expansion.
Reality Labs remains a drag on reported margins in the near term, but its expense profile is contained relative to the scale of the Family of Apps segment. In 2025, 82% of total costs and expenses were allocated to Family of Apps and 18% to Reality Labs, reinforcing the idea that margin outcomes are governed primarily by the core business.
5.3 Free Cash Flow Scaling and Visibility
Free cash flow serves as the central output of Meta’s economic system. Advertising revenue converts efficiently into cash due to low working capital requirements and limited inventory risk. As operating margins expand through system efficiency, free cash flow scales faster than revenue.
Visibility into this process improves over time as AI-driven automation reduces variability in cost structure and execution. Capital expenditures remain elevated due to infrastructure investment, but these investments are tied to long-lived assets that support both advertising efficiency and future execution layers.
By the end of the decade, free cash flow reflects accumulated operating leverage rather than short-term expense discipline.
5.4 Share Count Reduction as Structural EPS Support
Capital allocation policy interacts directly with free cash flow generation. Meta has demonstrated a preference for returning excess capital through share repurchases while maintaining investment capacity across infrastructure and product development.
Share count reduction acts as a structural support to per-share economics over long horizons. As free cash flow scales, repurchases amplify earnings per share growth without requiring incremental revenue acceleration. This dynamic compounds over time, particularly in periods where revenue growth moderates but cash generation remains strong.
The combined effect of durable revenue, expanding margins, and declining share count establishes the financial foundation on which the scenario analysis in the next section is built.
6. Scenario Framework and Valuation Outcomes
This section formalizes the scenario framework used to evaluate Meta through 2030. Each case begins from the same reported year-end 2025 financial base and diverges based on execution pace, regulatory friction, and the contribution of incremental monetization layers.
2025 baseline anchors the model:
- Revenue: $200.97B
- Family of Apps revenue: $198.76B
- Advertising-driven business with global scale
- AI already embedded across ranking, targeting, and infrastructure
- Free cash flow generation established and durable
All scenarios preserve this foundation. Differences emerge from growth rate, margin trajectory, and capital efficiency rather than from changes in business identity.
6.1 Bear Case: Politically Constrained, Still Compounding
The bear case reflects an environment where monetization expansion is slowed by regulatory friction and uneven geographic ARPU progression, while the core advertising system continues to function effectively.
Northwise Premium
Choose how to continue with Northwise
Join Northwise Premium
Unlock the rest of this report, its complete valuation, the downloadable model, portfolios, and action framework.
Join Northwise PremiumCreate a Free Account
Continue across Free Northwise research, follow companies, save reports, and receive updates.
Create a Free Account
Meta AI Spending: The Customer Is Already Here
Can Meta turn AI spending into shareholder returns? We model advertising, Muse, hardware, capital costs and cash flow through 2030, with a full valuation.

Celsius Stock Analysis: The Shelf Reset and the Second Growth Curve
Celsius stock analysis of the shelf reset, Alani growth, Pepsi economics and cash flow, with a 2030 model and a Premium valuation and entry-price framework.

IREN Stock Dilution: Can the Build Reach Shareholders?
IREN stock analysis of AI growth, funding and dilution through 2030. Read our full valuation, 27 scenarios and price zones free. Excel model is Premium.
Northwise Portfolios
See how the research becomes real decisions
Reader discussion
Discuss the research
Premium access is required to join this report's discussion.
Join Northwise Premium
No comments yet. Start a thoughtful discussion.