
Celsius Stock Analysis: The Shelf Reset and the Second Growth Curve
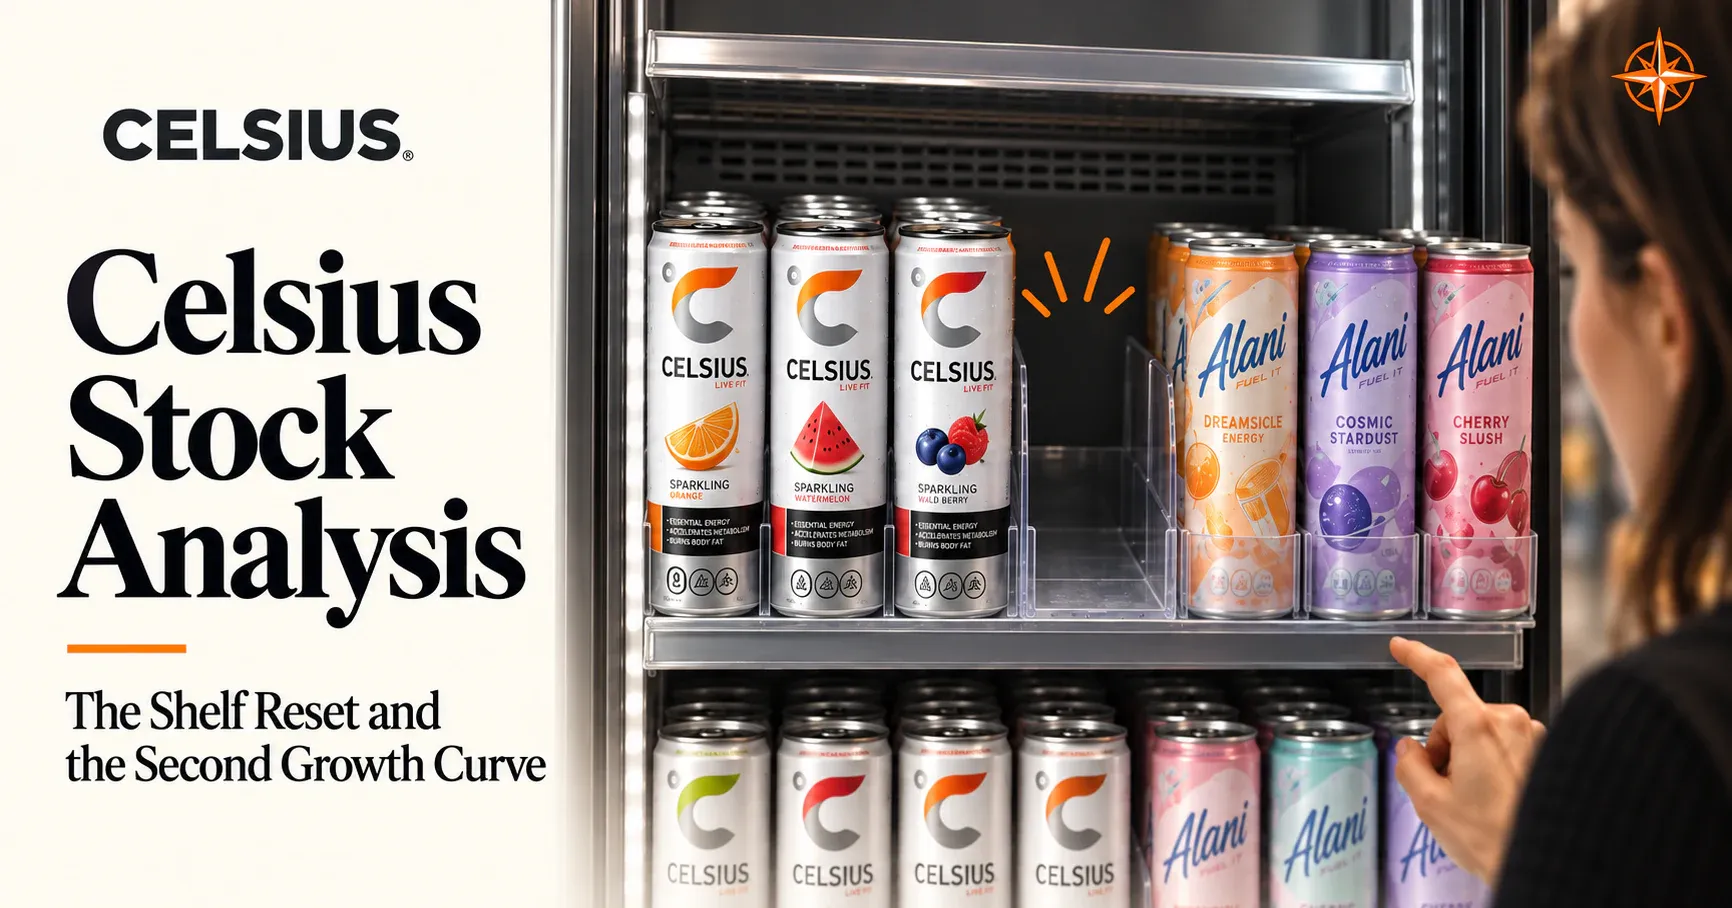
Celsius stock analysis of the shelf reset, Alani growth, Pepsi economics and cash flow, with a 2030 model and a Premium valuation and entry-price framework.
In this article
Celsius cut too deep into its own shelf space in 2026, and investors are still trying to separate a fixable mistake from a fading brand. Our 2030 forecast rests on a repaired core, a much larger Alani, faster growth overseas, and an honest accounting of what Pepsi collects before common shareholders are paid.
An energy drink shopper who can't find a favorite flavor has an easy decision. There are a dozen other cans in the cooler.
The investor looking at that same missed sale has a much harder one. Did the shopper lose interest in Celsius, or did Celsius make itself harder to buy? Both produce the same disappointing number in a quarterly report, and they lead to very different companies by 2030.
Celsius Holdings has lived inside that question for most of 2026. The company pruned its assortment as it folded Alani Nu and Rockstar into a larger portfolio, and the new products and replacement shelf space it was counting on arrived late. By September, management acknowledged at the Barclays consumer conference that it had cut too deep.
The lost sales were real. How many of them come back is the argument underneath a stock that closed at $28.58 on October 9, 2026.
Two Readings of the Same Empty Slot
One camp has already reached its verdict. In this telling, Celsius was a fitness-flavored fad that rode a Pepsi distribution deal to national scale, and 2026 is simply what the fade looks like once the novelty wears off.
The supporting evidence is easy to assemble. Scanner data for the core brand has been falling, Costco sells a cheaper Kirkland alternative, and Monster is larger, more profitable, and growing faster.
A string of acquisitions also keeps consolidated revenue rising, which makes it harder to see what the original franchise is doing on its own.
The opposing camp treats the whole episode as a self-inflicted logistics error. Restore the flavors, rebuild the cooler space, and the old growth curve resumes. Alani's surge, for these investors, proves the company still knows how to build a brand.
Our read of the evidence lands closer to the second camp on diagnosis and closer to the first on what recovery will cost. The products Celsius kept on the shelf have continued to sell, which is difficult to square with a brand consumers have walked away from. We part ways with the optimists on the idea that the old growth rate is waiting on the other side of the reset. We doubt it is, and the investment case holds up without it.
The bigger shift is that Celsius Holdings has stopped being a single-brand bet. Alani Nu already generates roughly as much revenue as the Celsius brand itself, and in our forecast it pulls clearly ahead, reaching 58% of company revenue by 2030. International markets are small today, though they compound from a working base of distribution partners. Rockstar adds volume and retail relationships, and we would prefer to see it stabilized quietly than turned into a turnaround project.
Pepsi sits across all of it. Its distribution network is a large part of why the portfolio reaches stores at all, and its expanded partnership puts Celsius in charge of the energy portfolio's direction in the United States. Its preferred stock also takes a meaningful slice of the earnings before common shareholders see any of them, a step many per-share forecasts skip entirely.
We built this forecast brand by brand and region by region, keeping consumer purchases at the register separate from distributor orders and from the revenue Celsius actually books. Working this way lets us locate the 2026 damage, measure how much of the future rests on Alani, and show why the familiar comparison with Monster's margins overstates the gap. It produces a 2030 central case of $5.89 billion in revenue, $1.33 billion in normalized operating income, and $3.69 in normalized earnings per common share.
Getting there asks Celsius to repair what it broke, keep feeding what is working, and hold on to enough of the resulting profit. None of those three is guaranteed. All three can be tracked.
What Actually Broke in 2026
The second quarter gave neither camp a clean win.
Reported financial measure | Q2 2026 | First half 2026 |
|---|---|---|
Revenue | $817.9M | $1,600.5M |
Gross margin | 48.1% | 48.2% |
Adjusted EBITDA | $184.2M | $379.6M |
GAAP diluted EPS | $0.14 | $0.47 |
Company-adjusted diluted EPS | $0.36 | $0.77 |
Revenue grew 10.6%. Adjusted EBITDA fell from $210.3 million a year earlier, and adjusted EPS dropped from $0.47 to $0.36. A bigger company produced a smaller quarterly profit, according to the Q2 release.
Underneath the consolidated figures, the brands were moving in different directions. Alani was strong. The core Celsius brand was weak. International results varied by region, with Europe growing quickly and Asia Pacific shipments swinging hard from quarter to quarter.
Reading those results properly requires three different measurements, and most of the confusion around Celsius comes from blending them.
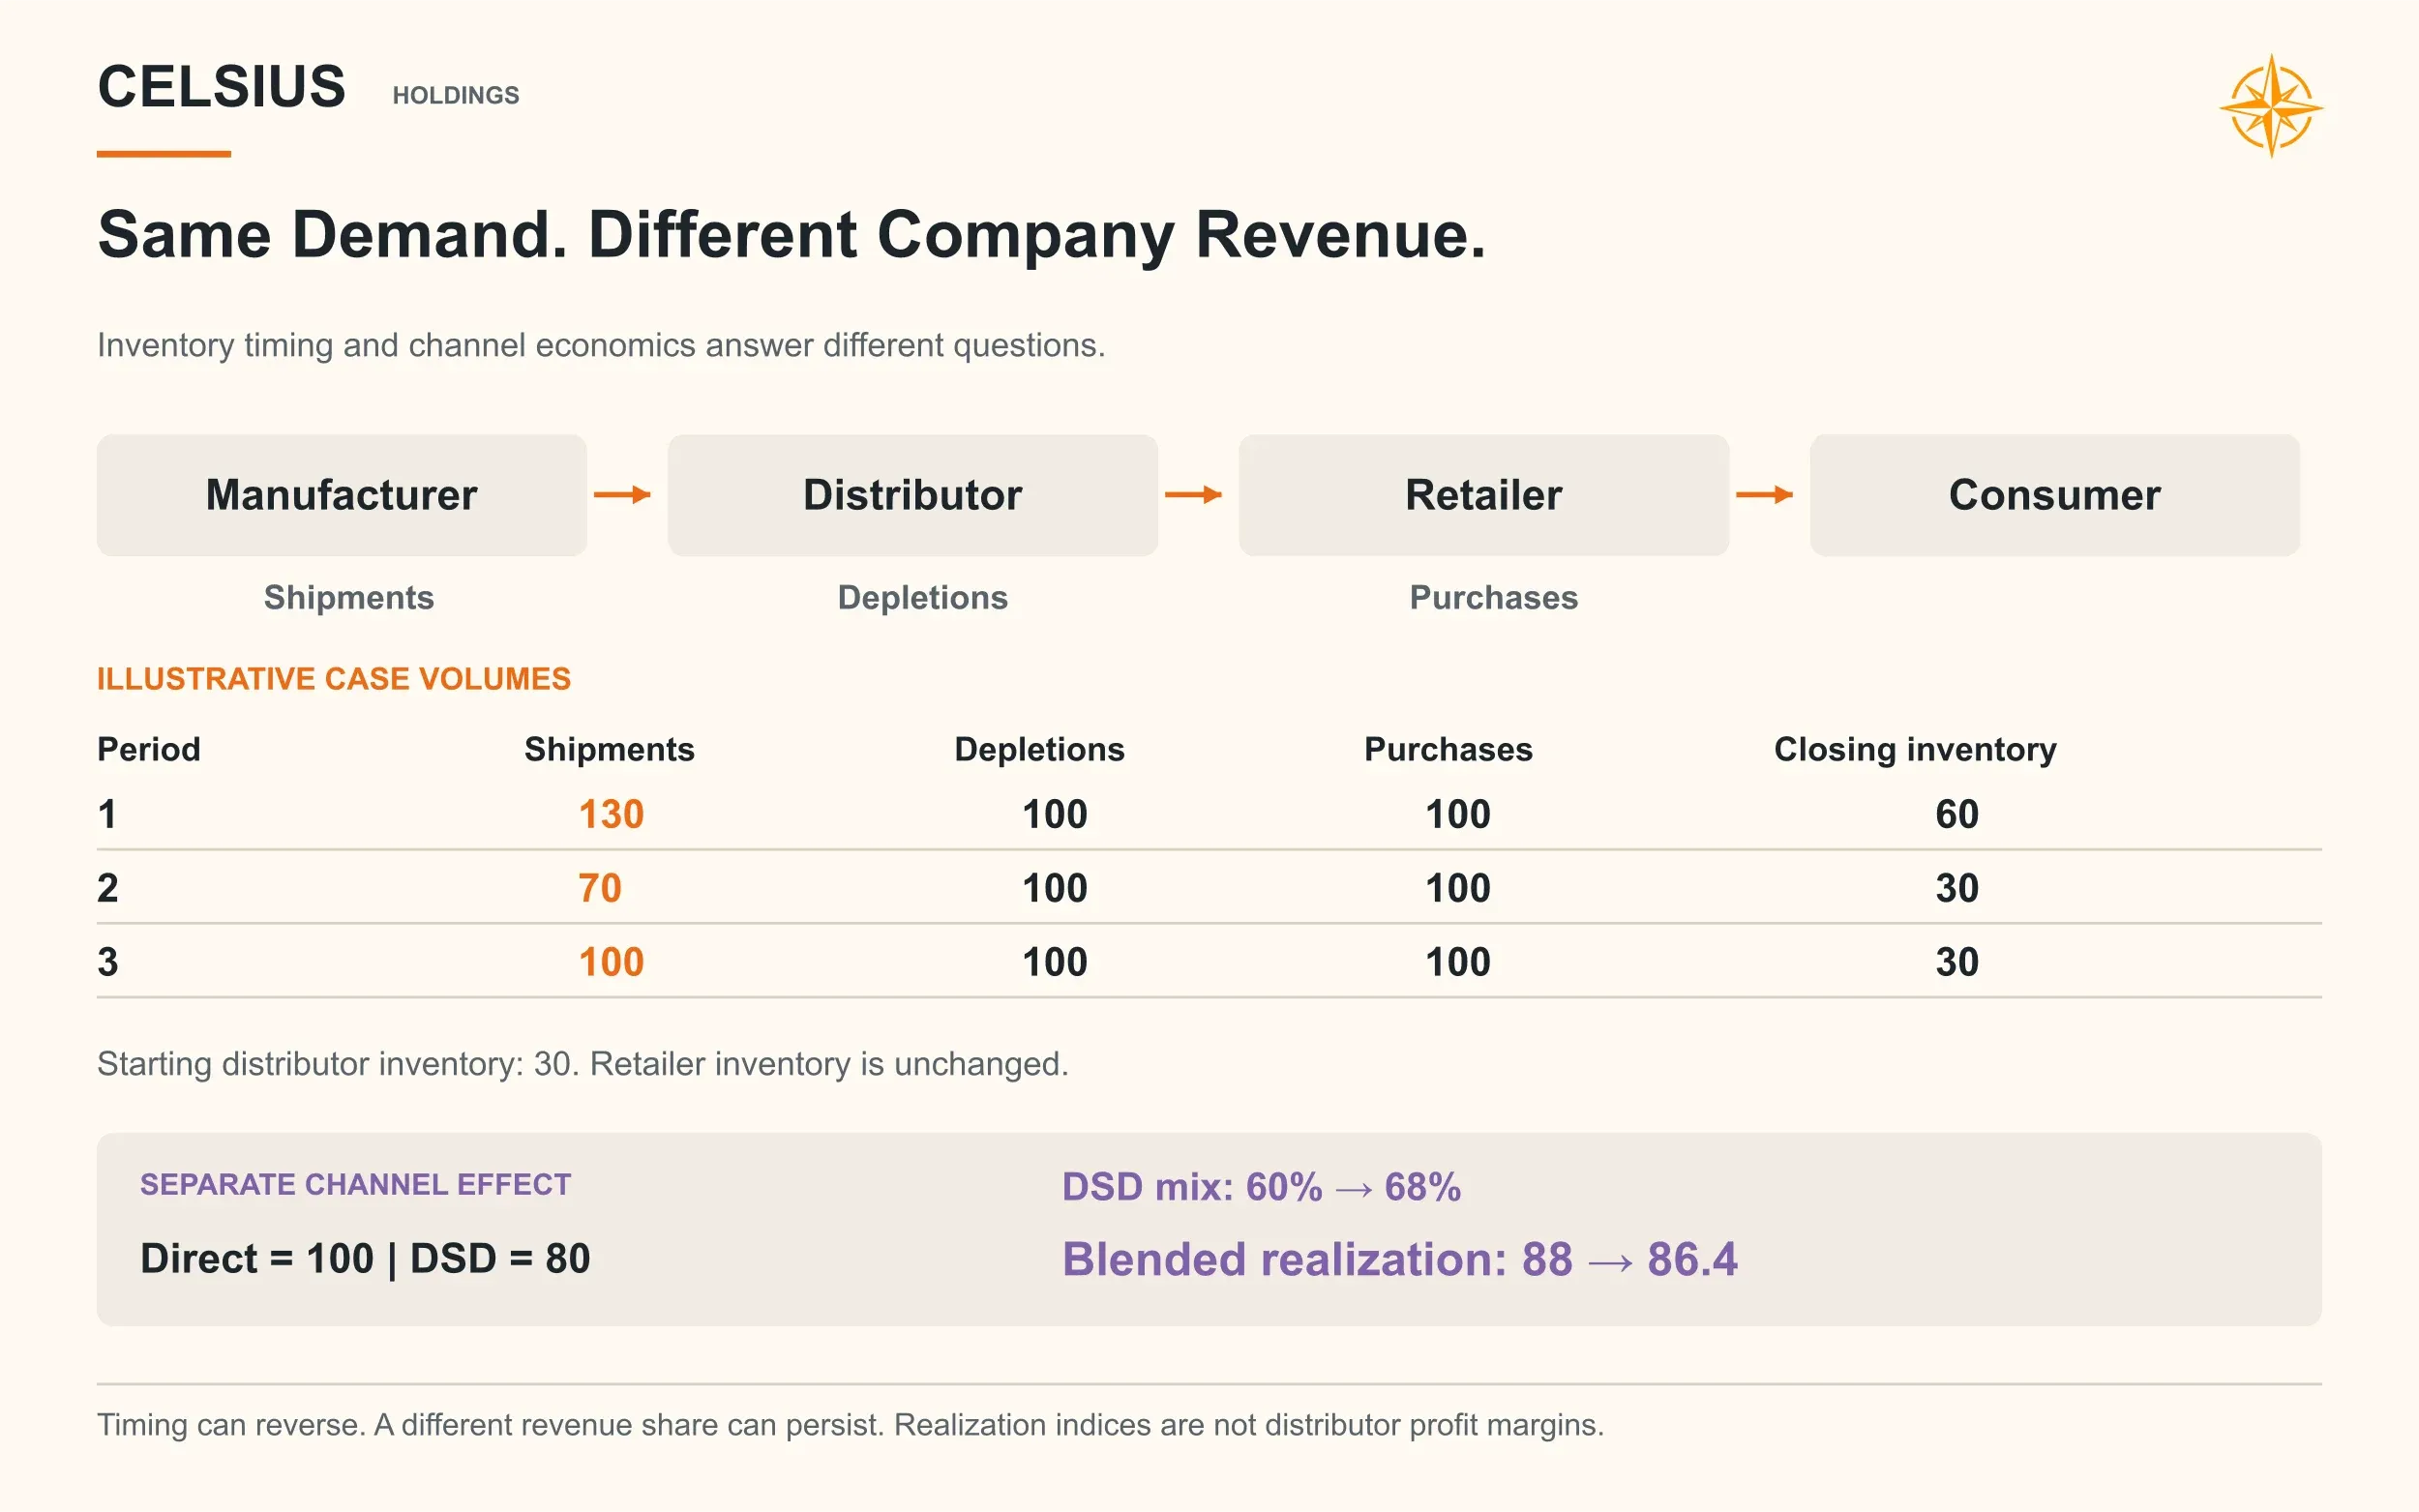
Scanner data captures what shoppers buy at the register. Depletions capture product moving out of distributor warehouses toward retailers. Reported revenue captures what Celsius itself sells, after promotional deductions and contract accounting. Over a full year the three should tell a similar story, though in any given quarter they can diverge sharply.
A distributor working down its inventory makes revenue look worse than consumer demand. A big initial stocking order does the opposite. A shift in who distributes the product can change how much of the same shopper's dollar Celsius keeps. Management walked through these timing gaps in September, which helps in reading the data without excusing the weakness.
Our forecast is built in the same order. It starts with distribution, assortment, velocity, and price for each brand, then follows those drivers into the revenue Celsius reports.
Repairing the Core Celsius Brand
The strongest evidence for a recovery comes from the products that never left the shelf.
In its June investor presentation, Celsius disclosed 11% growth in core 12-ounce singles in convenience stores over the 13 weeks ending May 17. That is a narrow slice of the business. It is also hard to reconcile with a consumer base that has broadly given up on the brand.
The broader picture stayed mixed. Tracked retail sales for the total Celsius brand fell 2% in the second quarter. Dollars per distribution point rose 16% sequentially, though on roughly 7% fewer distribution points, and removing weak products mechanically lifts the average for those that remain.
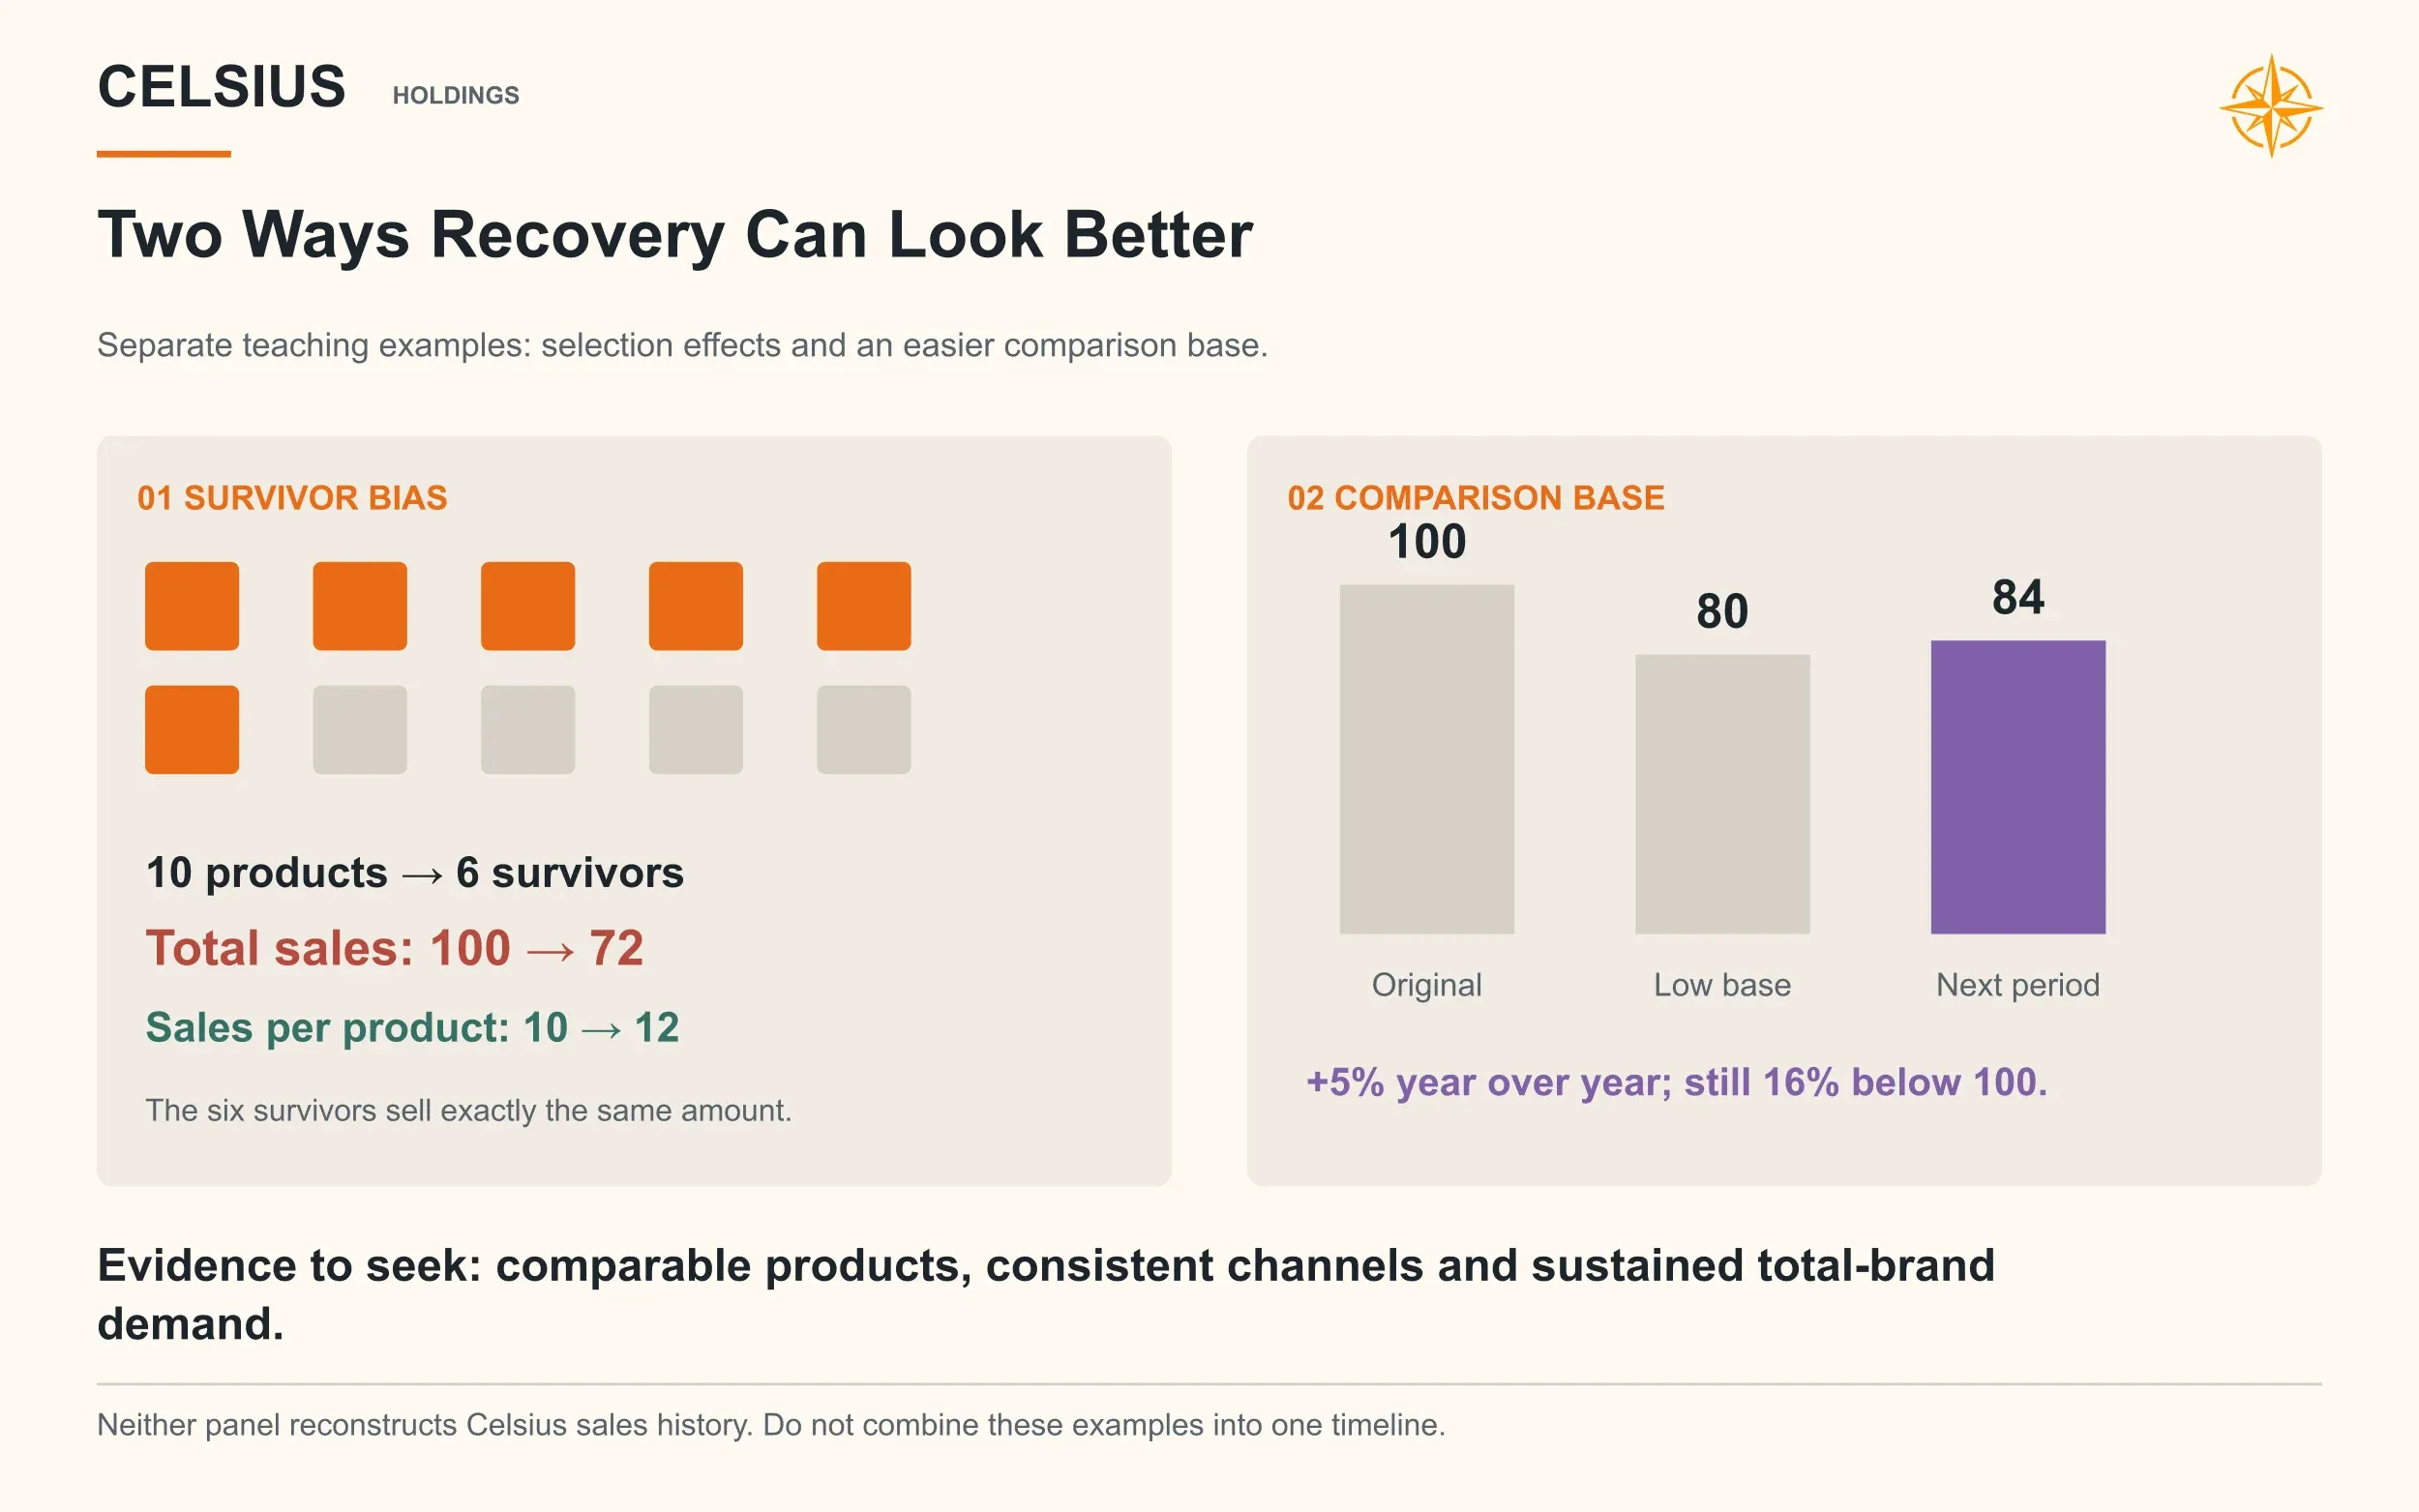
By September, management described total-brand scanner declines of roughly 5% to 10%, with the surviving singles still growing at a double-digit rate. Much of the innovation and retail reset work was pushed into 2027. The products that stayed were healthy. The franchise as a whole had not yet recovered.
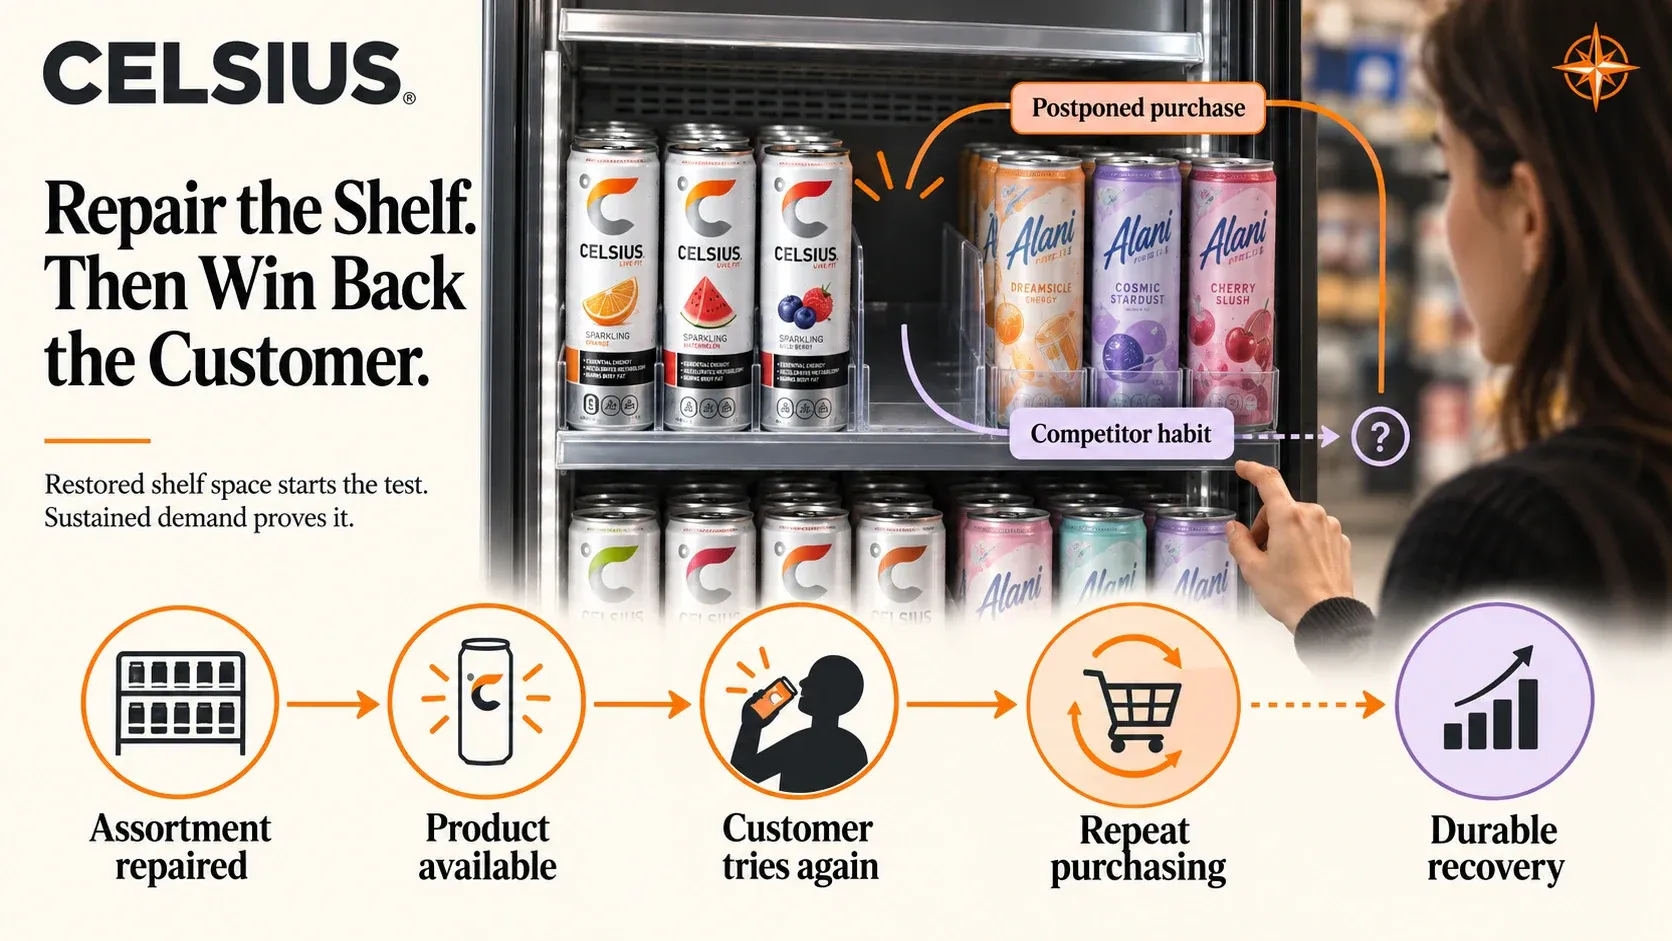
We read this as a commercial failure more than a consumer one. Celsius removed products before their replacements were ready, so shoppers saw fewer choices right away. Some of the planned gains required new cooler installations, retailer coordination, and field labor that simply took longer than expected. The sequence leaves a credible route back, and it also gave competitors a window to keep the shoppers who switched.
The company has reorganized around the problem. Tyler Bohannon became chief commercial officer, with responsibility for field sales, retailer accounts, direct-store-delivery operations, and revenue management. Tony Guilfoyle moved into a business transformation role and Eric Hanson departed, per the August announcement. Those are precisely the functions that decide whether the reset works.
We give the reorganization itself no earnings credit, and expect any benefit to show up later as better availability and steadier pricing.
For the established North American business, our central case assumes distribution repair adds 3% in 2027 alongside 1% velocity growth and 1% net pricing. Distribution adds another 1% in 2028, after which the repair benefit is largely spent. From there, legacy velocity grows about 3% a year with pricing of 1.5%.
Those are the growth rates of a mature brand earning repeat purchases. They make no attempt to recreate the surge that put Celsius on the map.
New products sit on top of that base. Energy+ Hydration, a noncarbonated 16-ounce line aimed at convenience stores, is scheduled to begin reaching retailers in early 2027, according to Beverage Industry. The format widens the drinking occasion, though nothing yet tells us how much shoppers will buy.
We forecast $75 million of gross sales for the new line in 2027, rising to $230 million by 2030, and assume 35% of it comes out of existing Celsius purchases. Net of that cannibalization, the line adds roughly $49 million and $150 million of revenue in those two years. We charge the new product its own manufacturing and freight costs, remove the costs tied to the legacy sales it displaces, and keep the marketing support in the expense base.
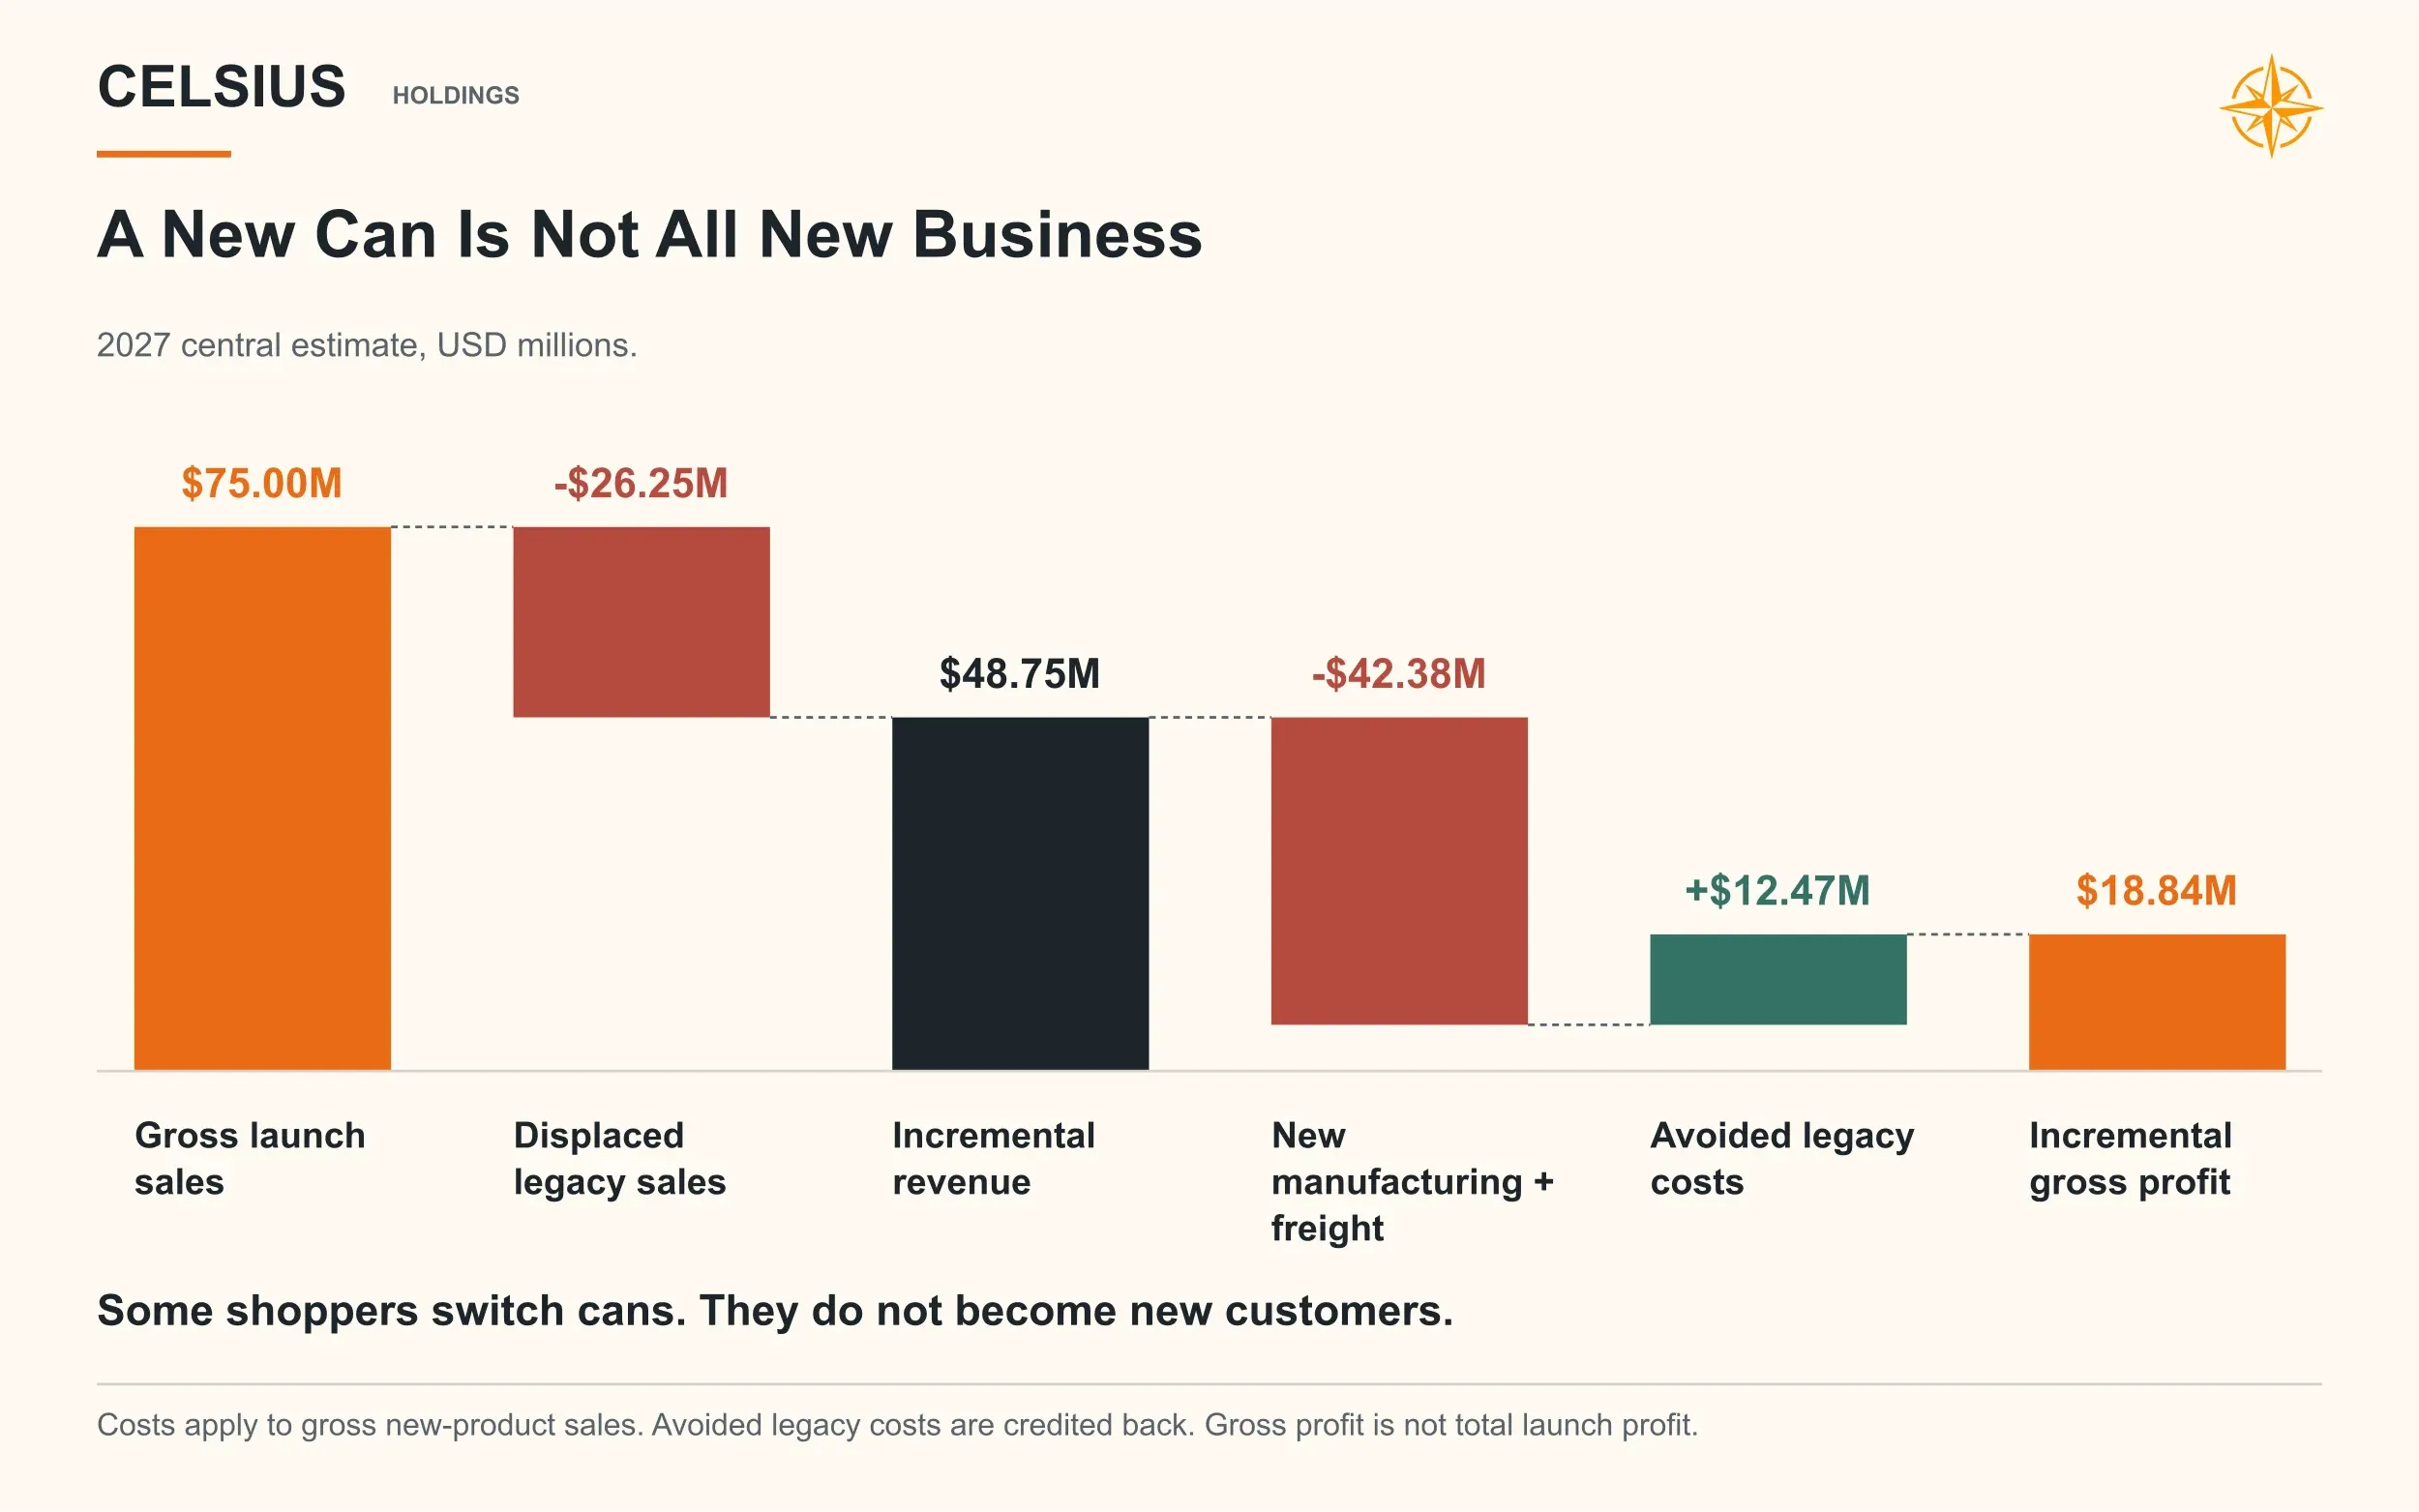
Put together, Celsius North America grows from $1.38 billion in 2026 to $1.82 billion in 2030, a compound rate of about 7.2%. Part of that is repair, part is innovation, and the rest is an established brand holding its customers.
We assign 70% odds to a durable recovery of this kind. The outcome is more likely than persistent erosion in our judgment, and it is not yet proven.
Alani Is Where Most of the Growth Lives
Alani Nu is the single largest source of new revenue in our forecast, and the gap between its two headline numbers explains a great deal about how to model it.
Tracked retail sales for Alani rose 55.7% in the second quarter. Reported Alani revenue rose about 21%, to $364.4 million. Investors on both sides tend to pick whichever figure supports their conclusion, and each one is answering a different question.
Retail growth shows how much more shoppers are buying. Reported revenue shows how much of that activity reaches Celsius's income statement. A large part of the difference comes from the shift to direct-store-delivery partners, who take a share of each retail dollar in exchange for getting product into more coolers. We assume the DSD share of Alani volume rises from about 60% today to 68% by 2030, with Celsius keeping roughly 80% of the revenue per unit it would earn selling direct.
The more important question for 2030 is what happens once the first wave of new distribution is complete.
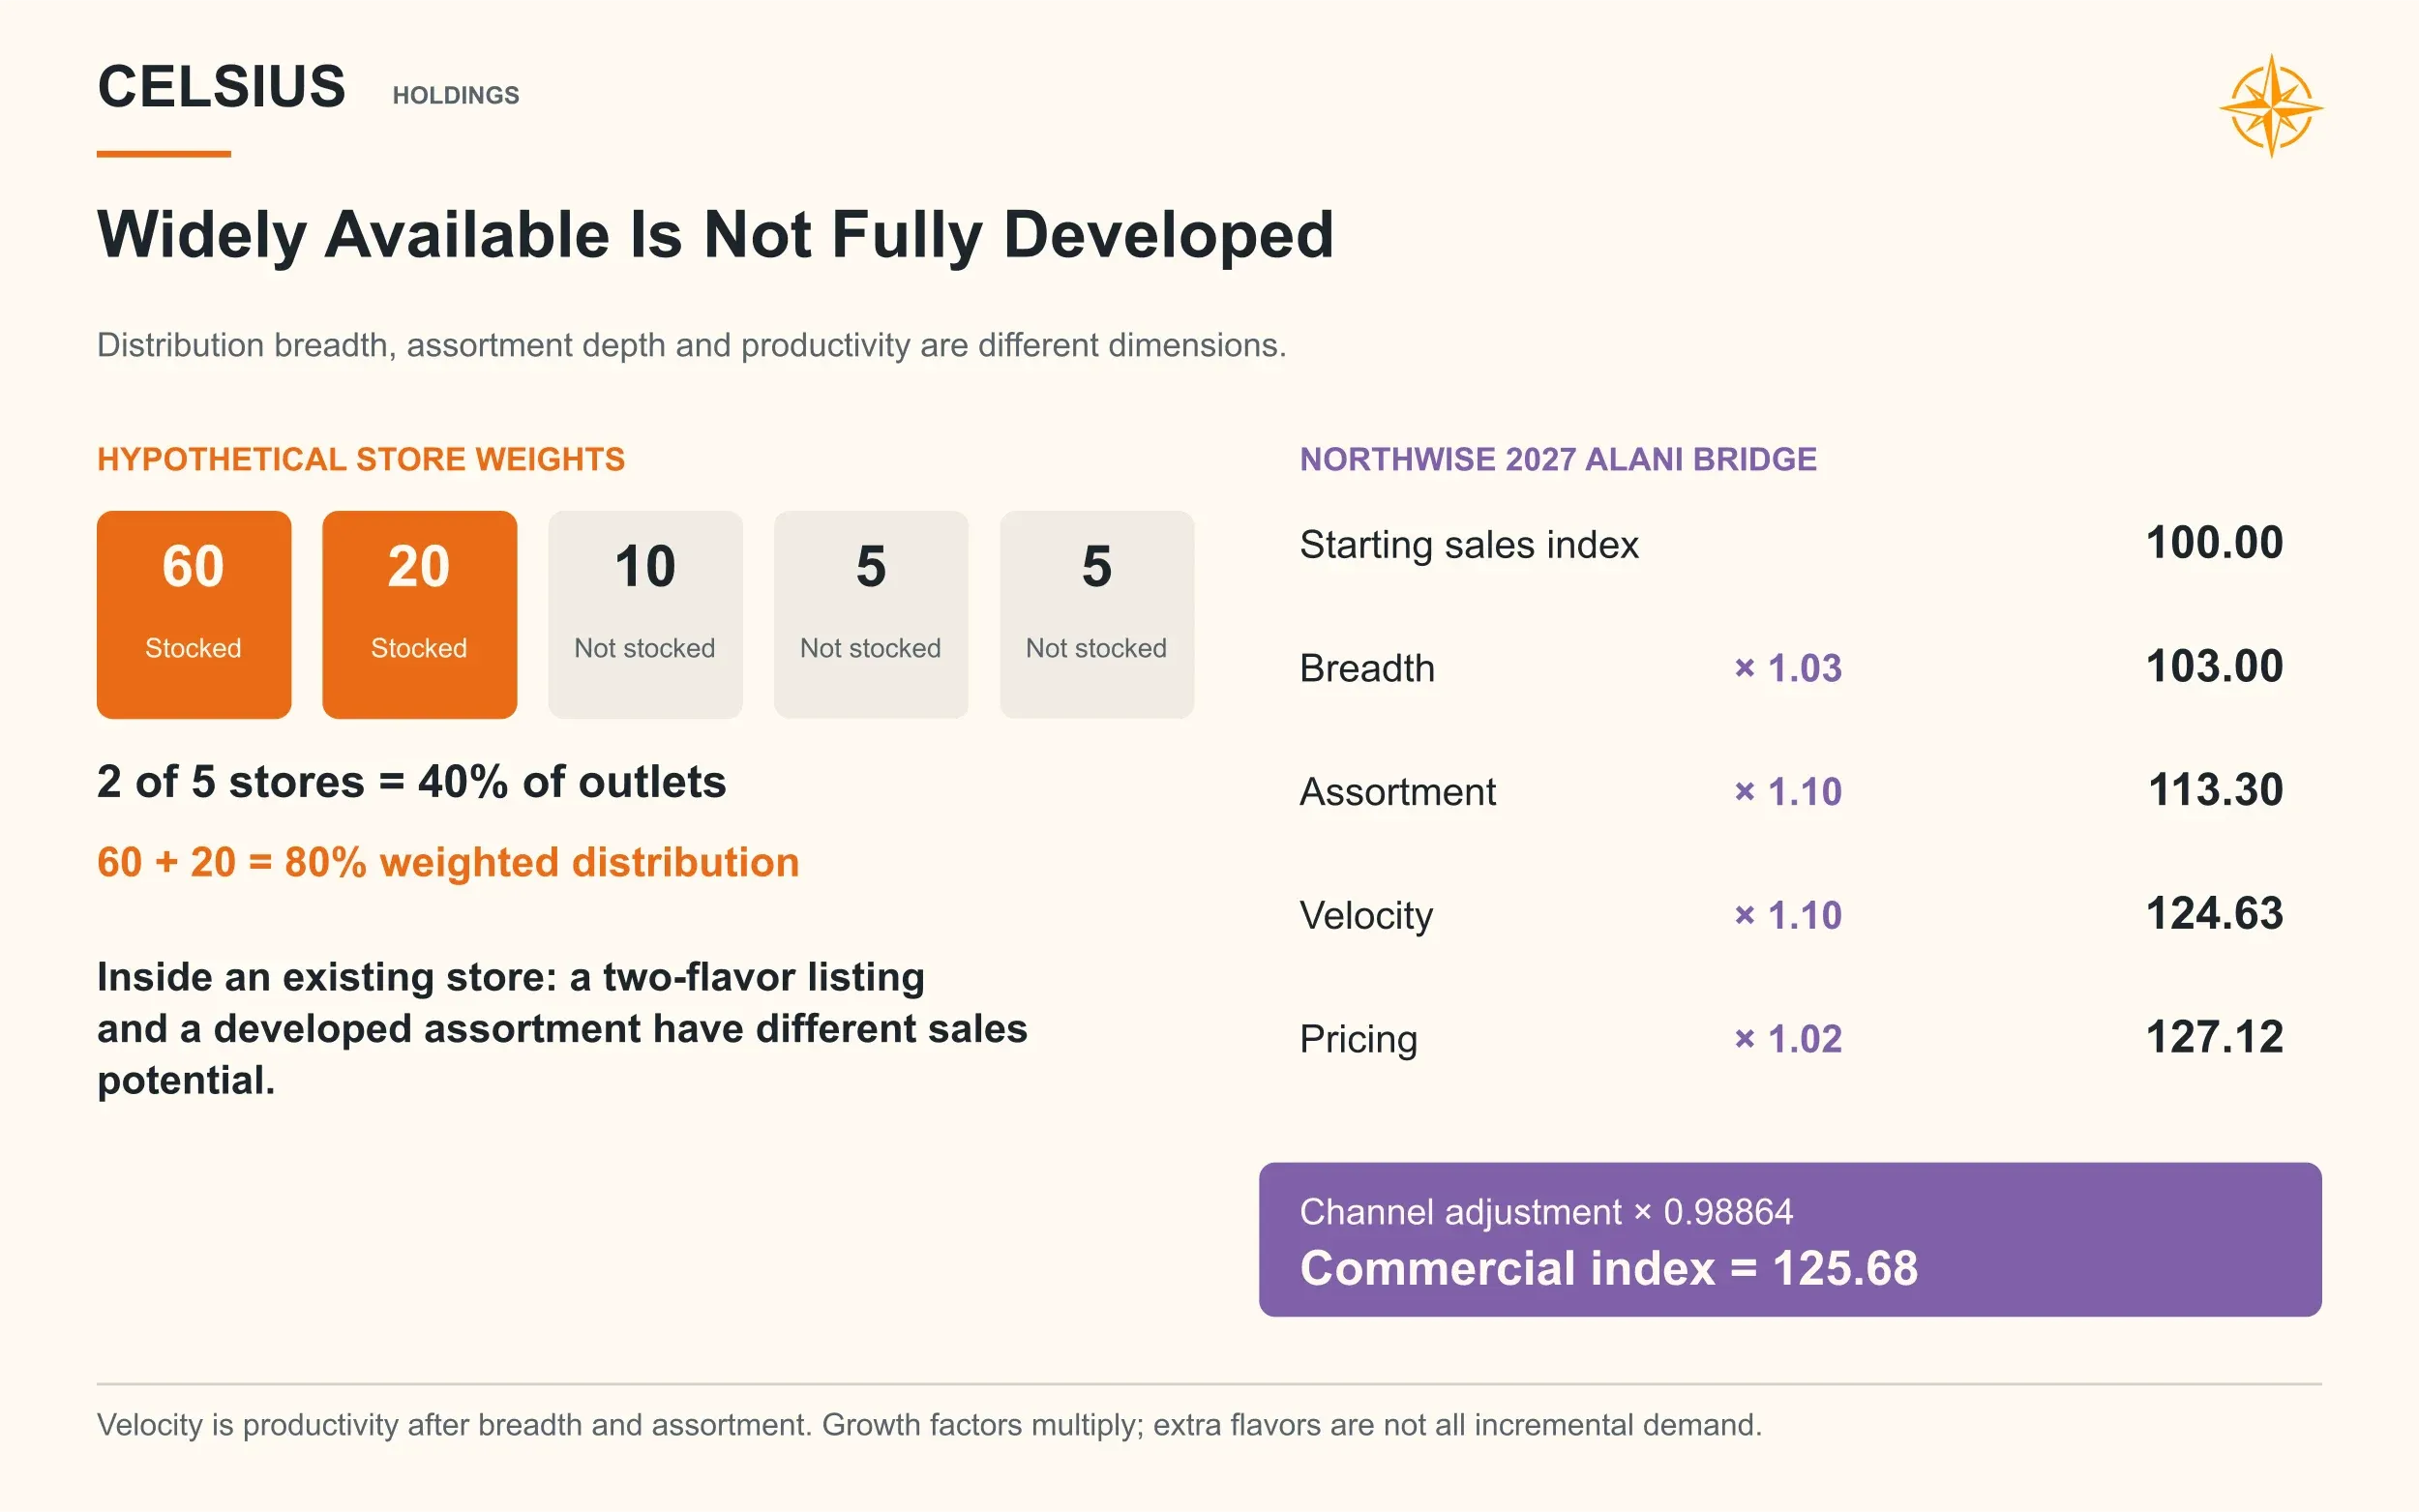
Alani's weighted distribution in convenience reached about 91% in the June materials, up from 65%. The measure weights stores by their sales importance, though either way the easy gains from simply getting into more doors are mostly behind it.
A brand can be widely available and still have plenty of room to grow inside the stores that already carry it. One location might stock two flavors on a bottom shelf. Another might carry a dozen flavors, several pack sizes, and a dedicated cold slot. Both count as distribution, and their sales potential is nothing alike.
Our central Alani forecast separates those layers:
North American Alani assumption | 2027 | 2028 | 2029 | 2030 |
|---|---|---|---|---|
Distribution breadth growth | 3% | 2% | 1% | 0% |
Assortment depth growth | 10% | 8% | 6% | 4% |
Velocity growth | 10% | 9% | 8% | 7% |
Net pricing before channel mix | 2% | 2% | 1.5% | 1.5% |
The drivers compound on one another, and a separate channel schedule adjusts how much revenue Celsius retains as more volume moves through DSD partners. The result is roughly 26% revenue growth in 2027, slowing to 13% by 2030. Alani North America compounds at about 19.5% across the period and reaches $3.18 billion.
Alani supplies close to two-thirds of the company's incremental revenue between 2026 and 2030. Domestic Celsius, by comparison, supplies less than a fifth.
The forecast is demanding. New flavors have to broaden the franchise instead of reshuffling purchases among existing ones. Permanent products have to stay relevant between seasonal drops. Promotional spending has to support demand without absorbing a growing share of the economics.
We find those conditions credible, and Alani's evidence is stronger today than the core brand's. Our confidence would fall if assortment kept expanding as sales per product declined, or if reported revenue required ever-larger trade concessions to keep the retail numbers climbing.
Skeptics who see Alani as an influencer brand that fades once distribution matures are underrating how much room remains inside the store. Enthusiasts who treat its popularity as proof of permanence are getting ahead of the repeat-purchase data. Our central case assumes a fast-growing cultural franchise matures into a durable beverage business, and that transition is the largest commercial assumption in the entire forecast.
International: A Small Base With Working Plumbing
The overseas opportunity begins with evidence that Celsius can travel.
Spain entered the footprint through an exclusive agreement with Suntory Beverage & Food Spain, with product on shelves from March 2026. A functioning route to market with a real assortment is a very different asset from a country chosen for an attractive population figure.
Established markets offer a second kind of proof. On the Q2 call, management cited record four-week consumer purchases of nearly 3.5 million units in Sweden and described selected international Alani launches beginning in 2027. The Swedish figure speaks to a mature local franchise. The Alani plans describe something much earlier, and we weight them accordingly.
International revenue, Northwise central case | 2026E | 2030E |
|---|---|---|
Celsius Europe | $112.3M | $316.9M |
Celsius Asia Pacific | $14.0M | $42.2M |
Celsius other international markets | $8.9M | $27.2M |
Alani international | $0.0M | $237.6M |
Total outside North America | $135.2M | $623.9M |
Existing Celsius international revenue compounds at about 30% a year in our central case. Alani adds a separate curve from a standing start.
Even at that pace, international reaches only 10.6% of company revenue by 2030. Overseas markets do not need to dominate the business to matter financially, and a fifth of the incremental revenue in our forecast comes from them.
One definitional point is easy to miss. Management has discussed an ambition for markets outside the United States to exceed 15% of revenue within five years. Our category is outside North America, which leaves Canada in the domestic figures, and our horizon ends in 2030, so the two numbers are not directly comparable.
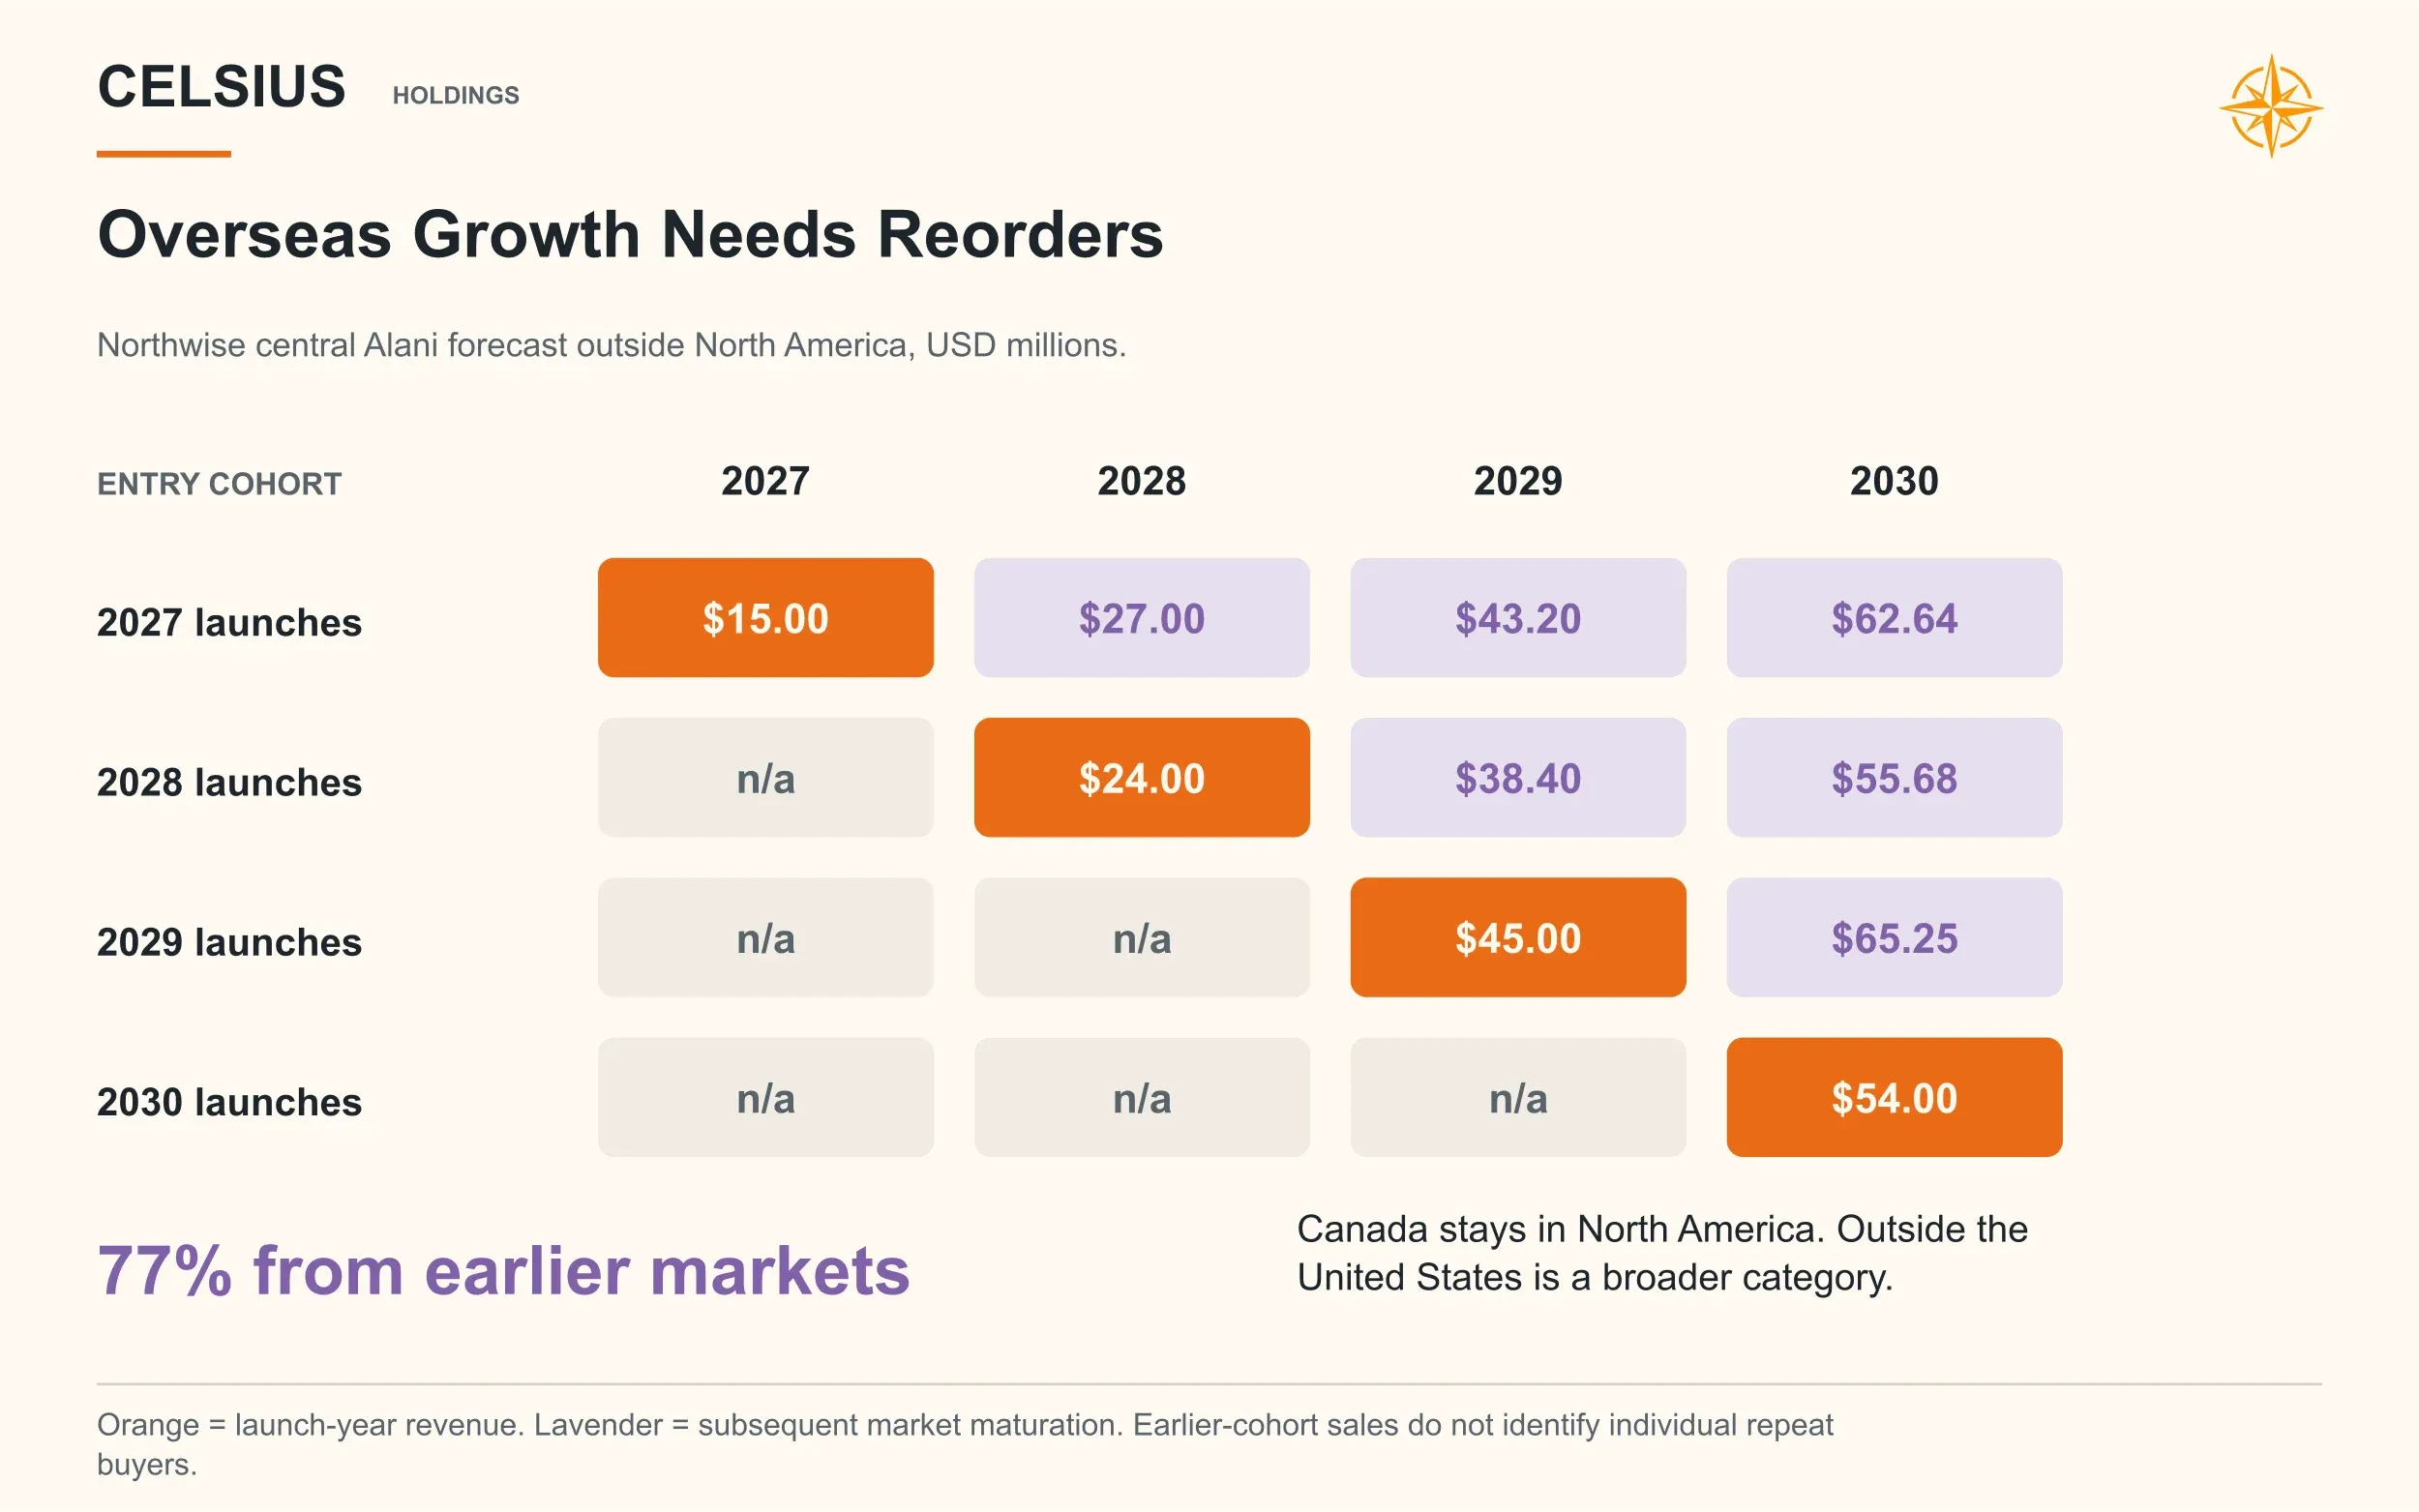
We model Alani's international expansion as a series of launch cohorts. The central case opens two market clusters in 2027, each contributing about $7.5 million of first-year revenue, and adds clusters in later years as earlier ones mature.
The cohort structure forces a distinction that headline launch announcements tend to blur. A first shipment fills a distributor's warehouse and can produce an encouraging revenue number before anyone knows whether local shoppers will come back. The evidence that counts arrives later, when the distributor reorders, retailers keep the assortment, and sales hold up without heavy promotional support.
Rockstar, Kirkland, and a Very Large Competitor
Rockstar generated about $66.5 million of revenue in the second quarter, with tracked retail sales down 13%. Celsius owns the brand in the United States and Canada, and Pepsi retains it everywhere else.
We see a useful but limited role. Rockstar serves shoppers who prefer traditional energy flavors and formats, and it adds volume to the purchasing and distribution system. Our central case carries North American revenue from about $260 million in 2026 to $268 million in 2030, which amounts to stabilization followed by very modest growth. New packaging signals renewed attention, though it says little yet about demand.
The risk we watch with Rockstar is less about its own numbers. A smaller brand in slow decline is manageable. A smaller brand that pulls management attention and marketing dollars away from two far more valuable franchises becomes a much larger problem.
Costco's Kirkland energy drink raises a fairer question for the bears: how much premium can a branded functional beverage hold when a trusted retailer sells a cheaper version beside it?
The honest answer depends on the shopper and the moment. Someone buying a large pack for the pantry is far more price sensitive than someone grabbing one cold can on the way to work. Taste, habit, availability, and identity all shape the decision, so an ingredient comparison alone understates the brand while loyalty alone overstates it. Celsius can lose share in club stores and remain highly productive in convenience.
We handle private label as pressure on volume and pricing inside each brand's drivers. Layering a separate competitive penalty on top of already weakened demand and margins would count the same problem three times. We would grow more concerned if club-channel weakness spread into convenience and grocery after availability is restored, and less concerned if it stays contained.
The category itself remains healthy. Monster grew second-quarter revenue 20.2% to $2.54 billion, with about 46% of sales coming from outside the United States, per its Q2 results. A growing category creates room for Celsius. A competitor executing at that level makes the room harder to claim.
The Margin Gap Is Smaller Than It Looks
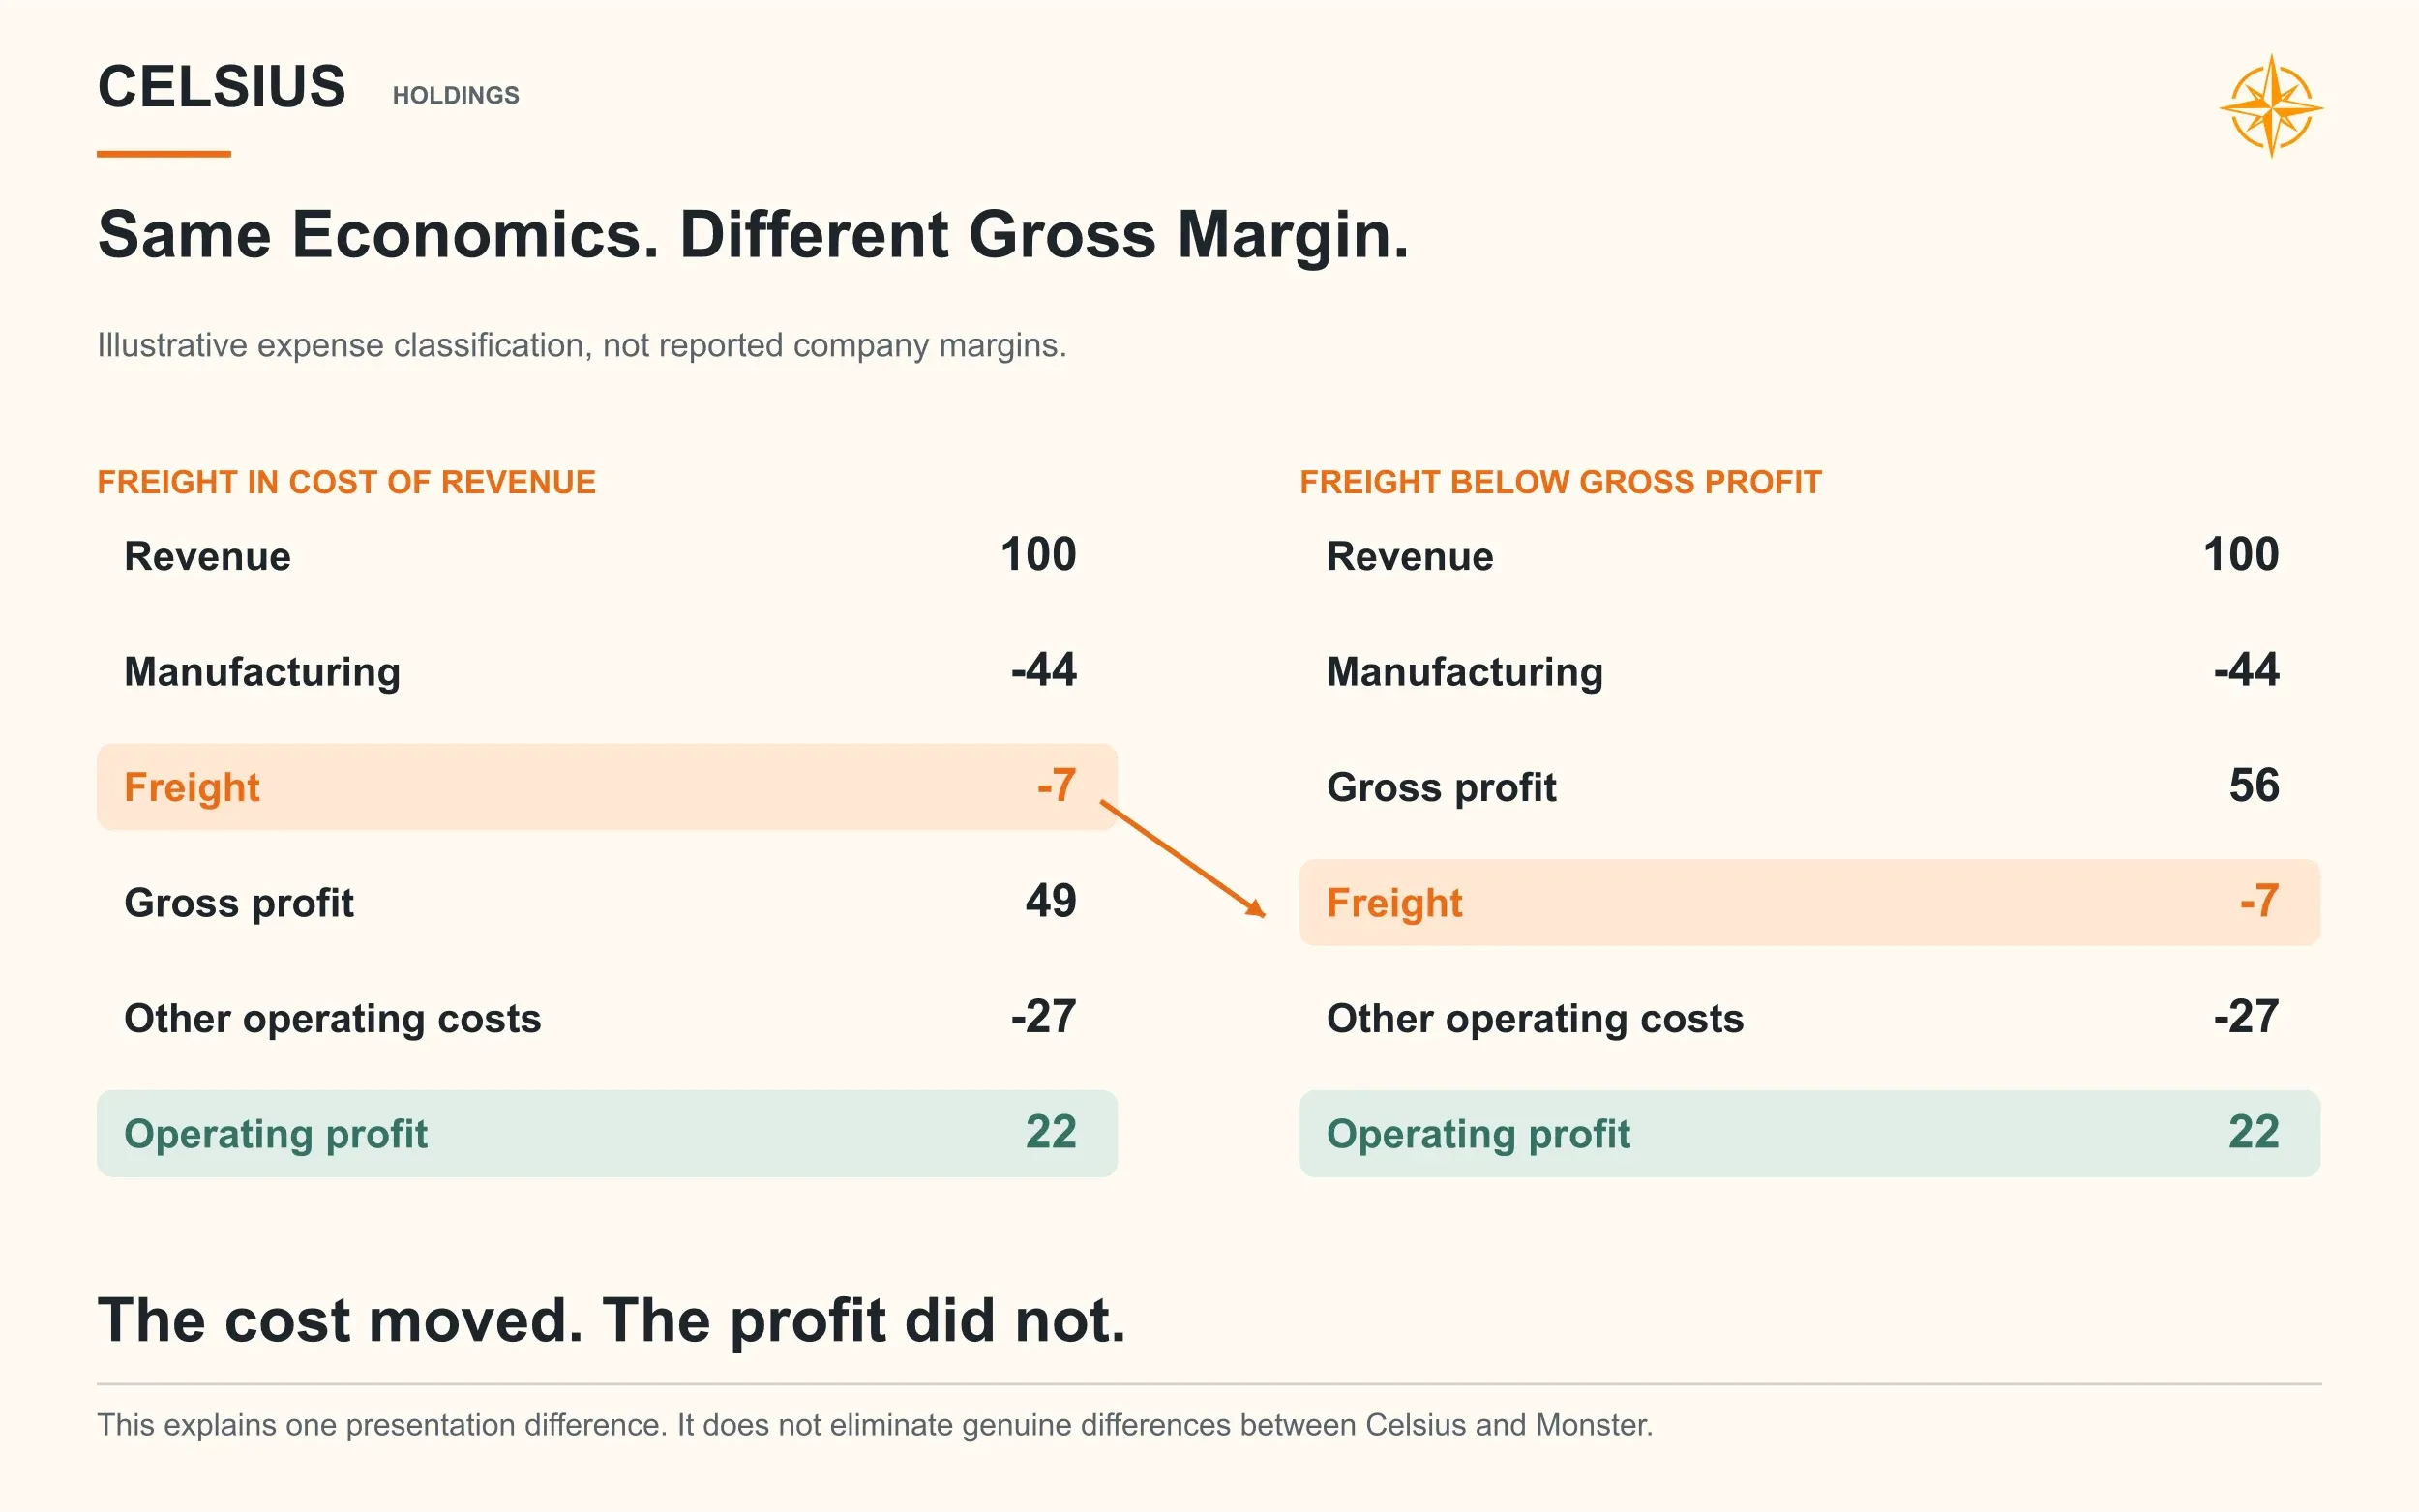
On reported numbers, Monster's 55.9% second-quarter gross margin sits nearly 8 points above Celsius's 48.1%. Bulls often treat that spread as a prize Celsius can capture through scale.
Part of the gap is presentation. Celsius records outbound freight inside cost of revenue, according to its 10-Q. Monster reports distribution expense below gross profit. Moving a cost from one line to another creates no profit, so our forecast gives Celsius no credit for closing a gap that is partly an accounting convention.
The improvement we do model comes from specific places. Coordinated purchasing across three brands should lower procurement costs, and the second production line in Charlotte should improve manufacturing economics. Freight routes and inventory locations can be rationalized now that the portfolio shares a network, and promotional spending should become more productive as brands and formats are planned together. Management discussed each of these at the Deutsche Bank conference in June, which supports the direction of the savings more than their size.
We also avoid booking the same synergy twice. The June presentation described the original $50 million annual synergy target as already captured, so it sits in the starting cost base and earns no second appearance as future savings.
Costs keep rising underneath those improvements. Our central case assumes manufacturing and freight inflation of 3% in 2027 and 2.5% a year after that. Gross margin improves from about 48.0% in 2026 to 49.1% in 2028, then eases back to 48.3% by 2030 as inflation and a heavier mix of launch products absorb part of the savings.
Earnings growth in our forecast does not depend on gross margin rising every year. The larger lever is operating leverage. Revenue grows faster than selling and corporate costs, interest expense disappears as debt is repaid, and the normalized operating margin climbs from 20.3% to 22.7%, still well short of Monster's 29.2%.
The forecast keeps paying to stay relevant. Sales and marketing expense rises from about $696 million in 2026 to $1.15 billion in 2030, slipping from 20.9% to 19.5% of revenue even as it grows by more than $450 million. Cash corporate overhead grows from roughly $148 million to $237 million. Marketing deals such as the multiyear ESPN College GameDay sponsorship widen the brand's reach on campuses, and the company has not disclosed what they cost or what they return.
A forecast that expected new products, international launches, sharper retail execution, and higher purchase frequency while cutting consumer support would be building a larger franchise on a smaller commercial foundation. We underwrite a more productive organization that still pays for cans, trucks, and shelf space.
The Operating Forecast Through 2030
Here is how the brand and regional work adds up.
Revenue, USD millions | 2026E | 2027E | 2028E | 2029E | 2030E |
|---|---|---|---|---|---|
Celsius North America | $1,376.6 | $1,495.7 | $1,619.1 | $1,721.3 | $1,820.1 |
Alani North America | $1,560.2 | $1,965.9 | $2,399.7 | $2,812.2 | $3,178.2 |
Rockstar North America | $260.2 | $260.2 | $262.8 | $265.5 | $268.1 |
Celsius outside North America | $135.2 | $183.8 | $244.9 | $314.3 | $386.4 |
Alani outside North America | $0.0 | $15.0 | $51.0 | $126.6 | $237.6 |
Total revenue | $3,332.1 | $3,920.6 | $4,577.6 | $5,239.9 | $5,890.4 |
The 2026 figure combines reported first-half results with our estimates of about $871.8 million for the third quarter and $859.8 million for the fourth.
Revenue compounds at about 15.3% a year from 2026 through 2030. Alani North America accounts for nearly two-thirds of the increase and international for about a fifth.
The mix changes how the forecast should be judged. Domestic Celsius remains strategically important, though it is no longer being asked to carry the company's growth. A slower namesake brand can coexist with a faster-growing parent, and a strong domestic recovery would not fully offset a serious stumble at Alani.
Central financial forecast | 2026E | 2027E | 2028E | 2029E | 2030E |
|---|---|---|---|---|---|
Revenue | $3,332M | $3,921M | $4,578M | $5,240M | $5,890M |
Gross margin | 48.0% | 48.6% | 49.1% | 48.8% | 48.3% |
Normalized operating income | $677M | $835M | $1,032M | $1,188M | $1,335M |
Normalized operating margin | 20.3% | 21.3% | 22.5% | 22.7% | 22.7% |
Normalized consolidated net income | $493M | $620M | $783M | $924M | $1,046M |
Normalized common EPS | $1.51 | $1.99 | $2.60 | $3.16 | $3.69 |
Operating cash flow less capital expenditure | $525M | $593M | $834M | $968M | $1,096M |
Closing unrestricted cash | $744M | $734M | $902M | $1,374M | $1,808M |
Closing debt principal | $691M | $351M | $0M | $0M | $0M |
Normalized common EPS compounds at about 25% a year, well ahead of revenue. Four forces drive the difference: revenue growth, a cost base that grows more slowly than sales, the elimination of interest expense, and a declining share count.
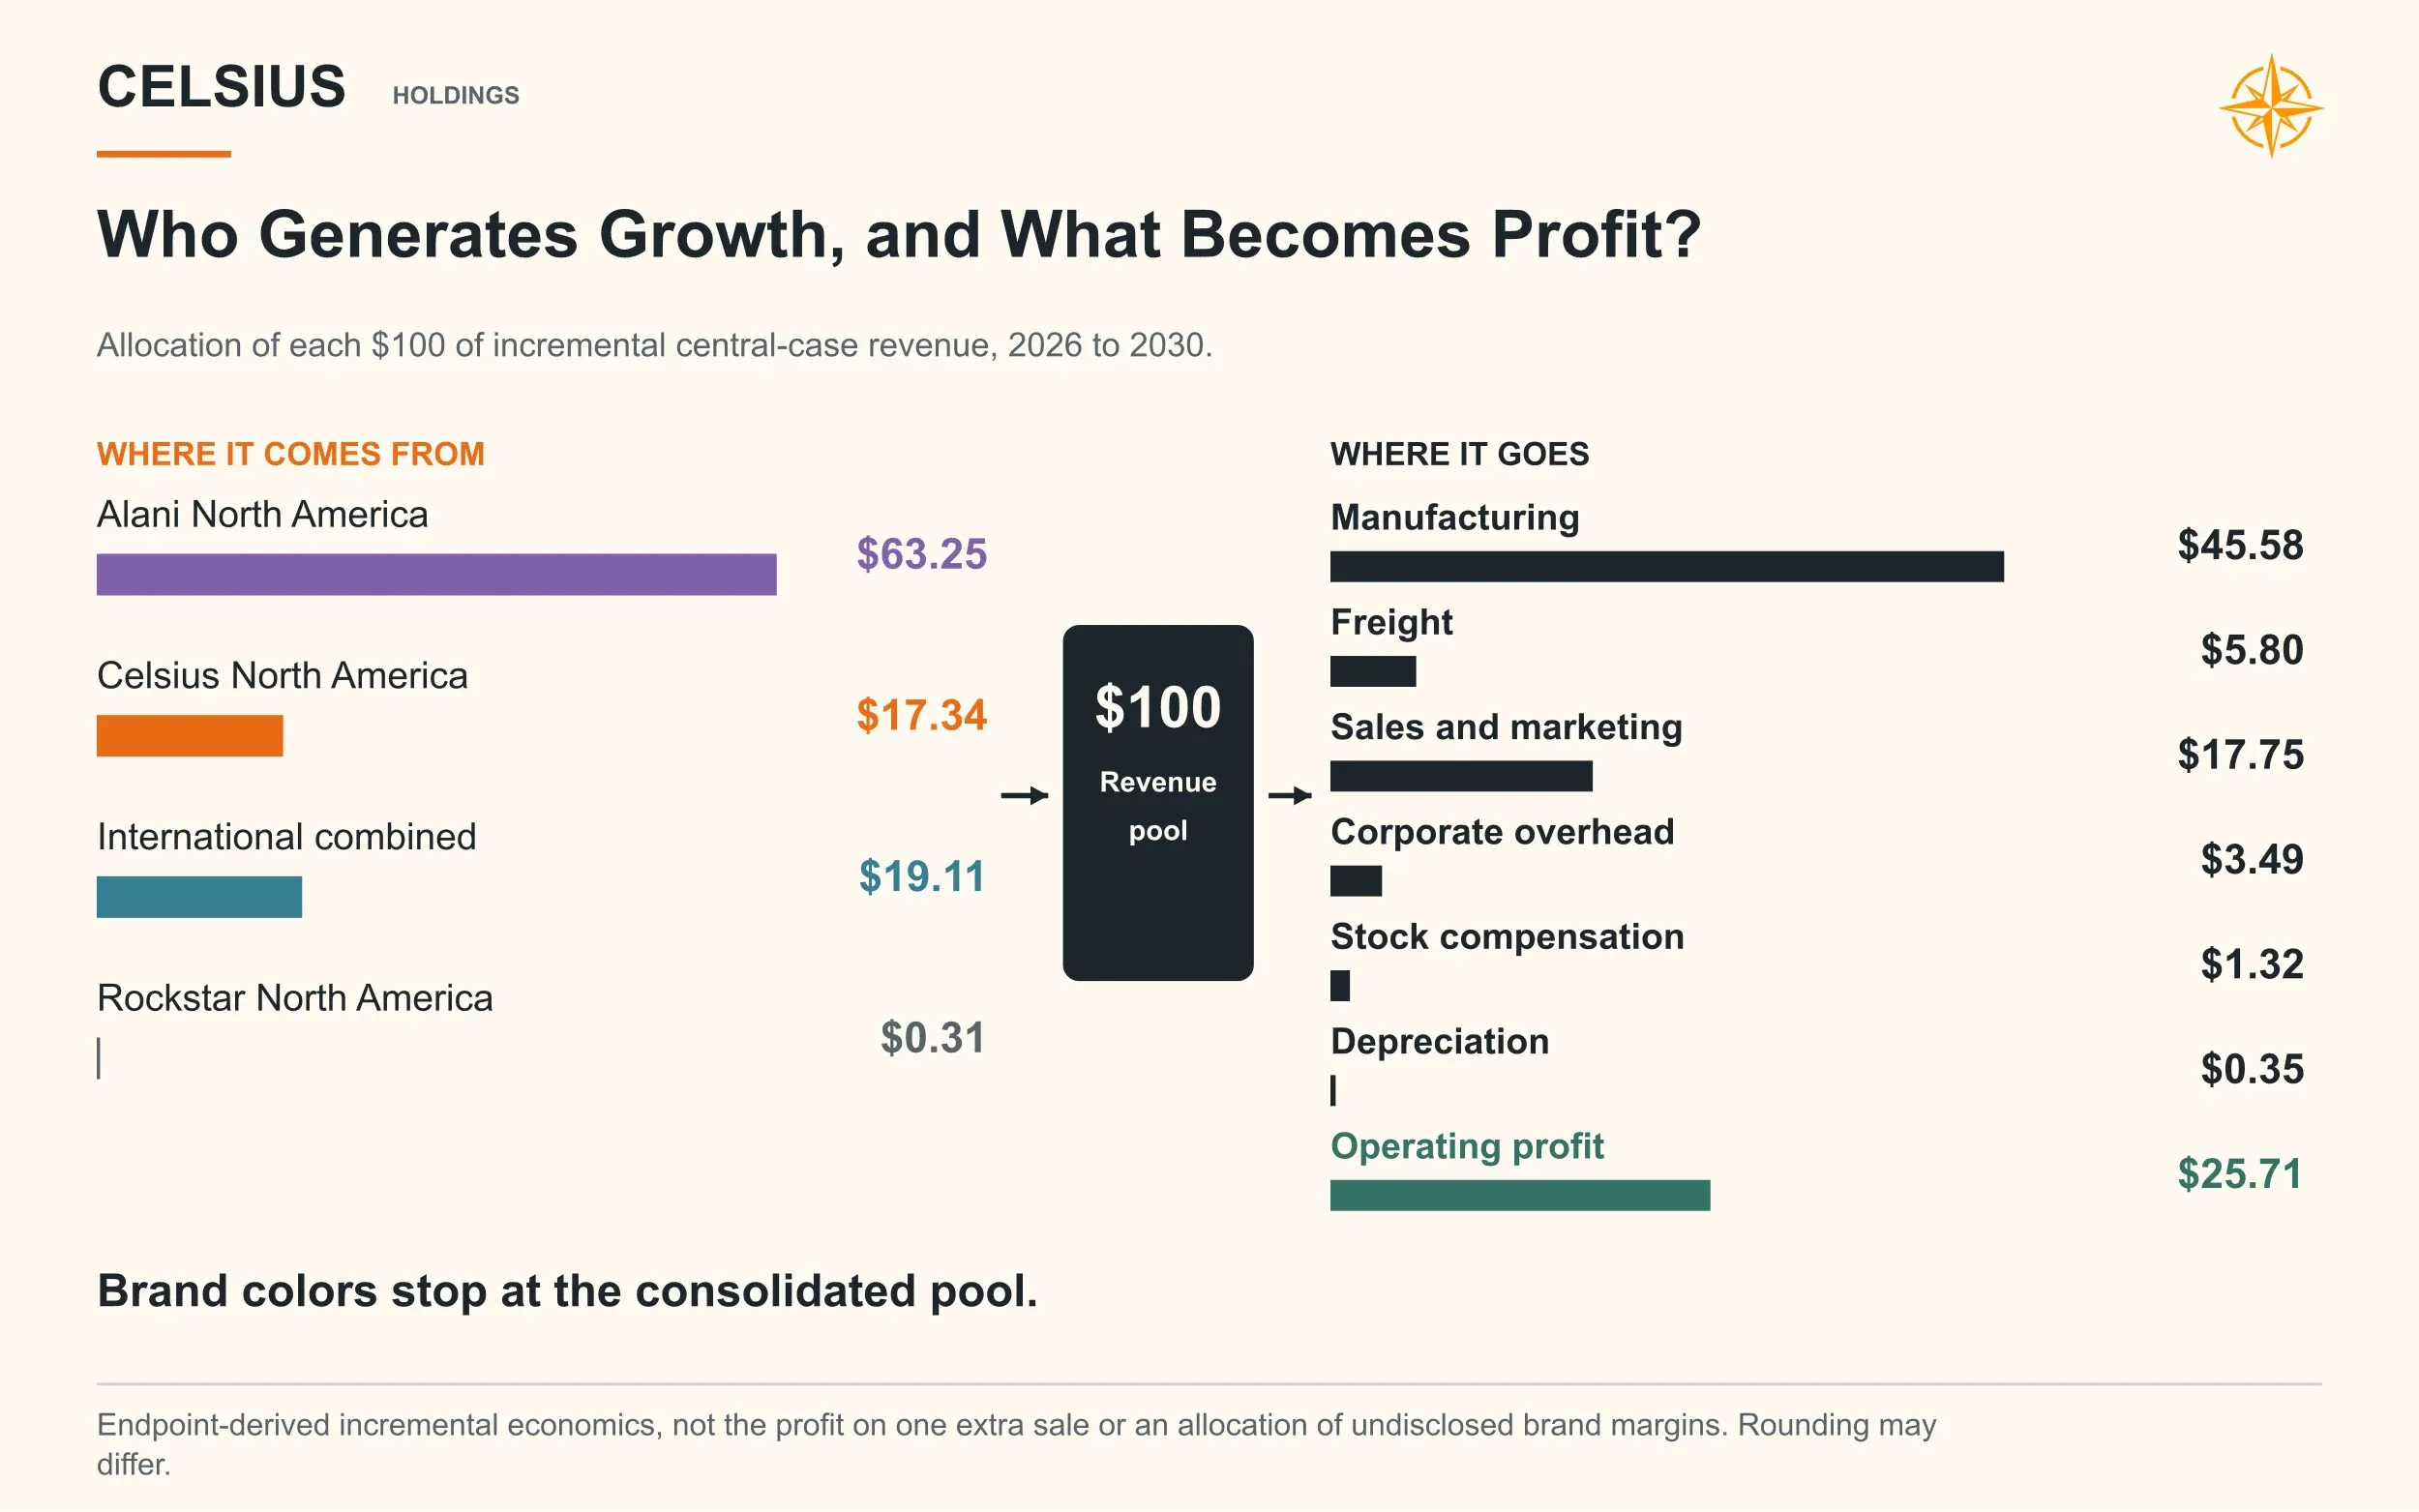
Our normalized earnings treat stock-based compensation as a real expense and apply a 24% tax rate, above this year's unusually low rate. About $122 million of 2026 distributor termination, integration, and litigation costs sit outside normalized earnings, though their cash cost stays in the forecast.
Cash, Debt, and the Bills Still in the Mail
Celsius can generate substantial cash without owning most of its manufacturing. Growth still has to be financed: inventory must be produced, retailers and distributors must pay, promotions must be settled, and new markets need working capital before they become dependable contributors.
The first half of 2026 shows why cash quality needs watching. Operating cash flow was about $296.3 million, and accrued promotional allowances rose by roughly $145.1 million over the same period. An unpaid promotional bill flatters cash flow until the day it is paid.
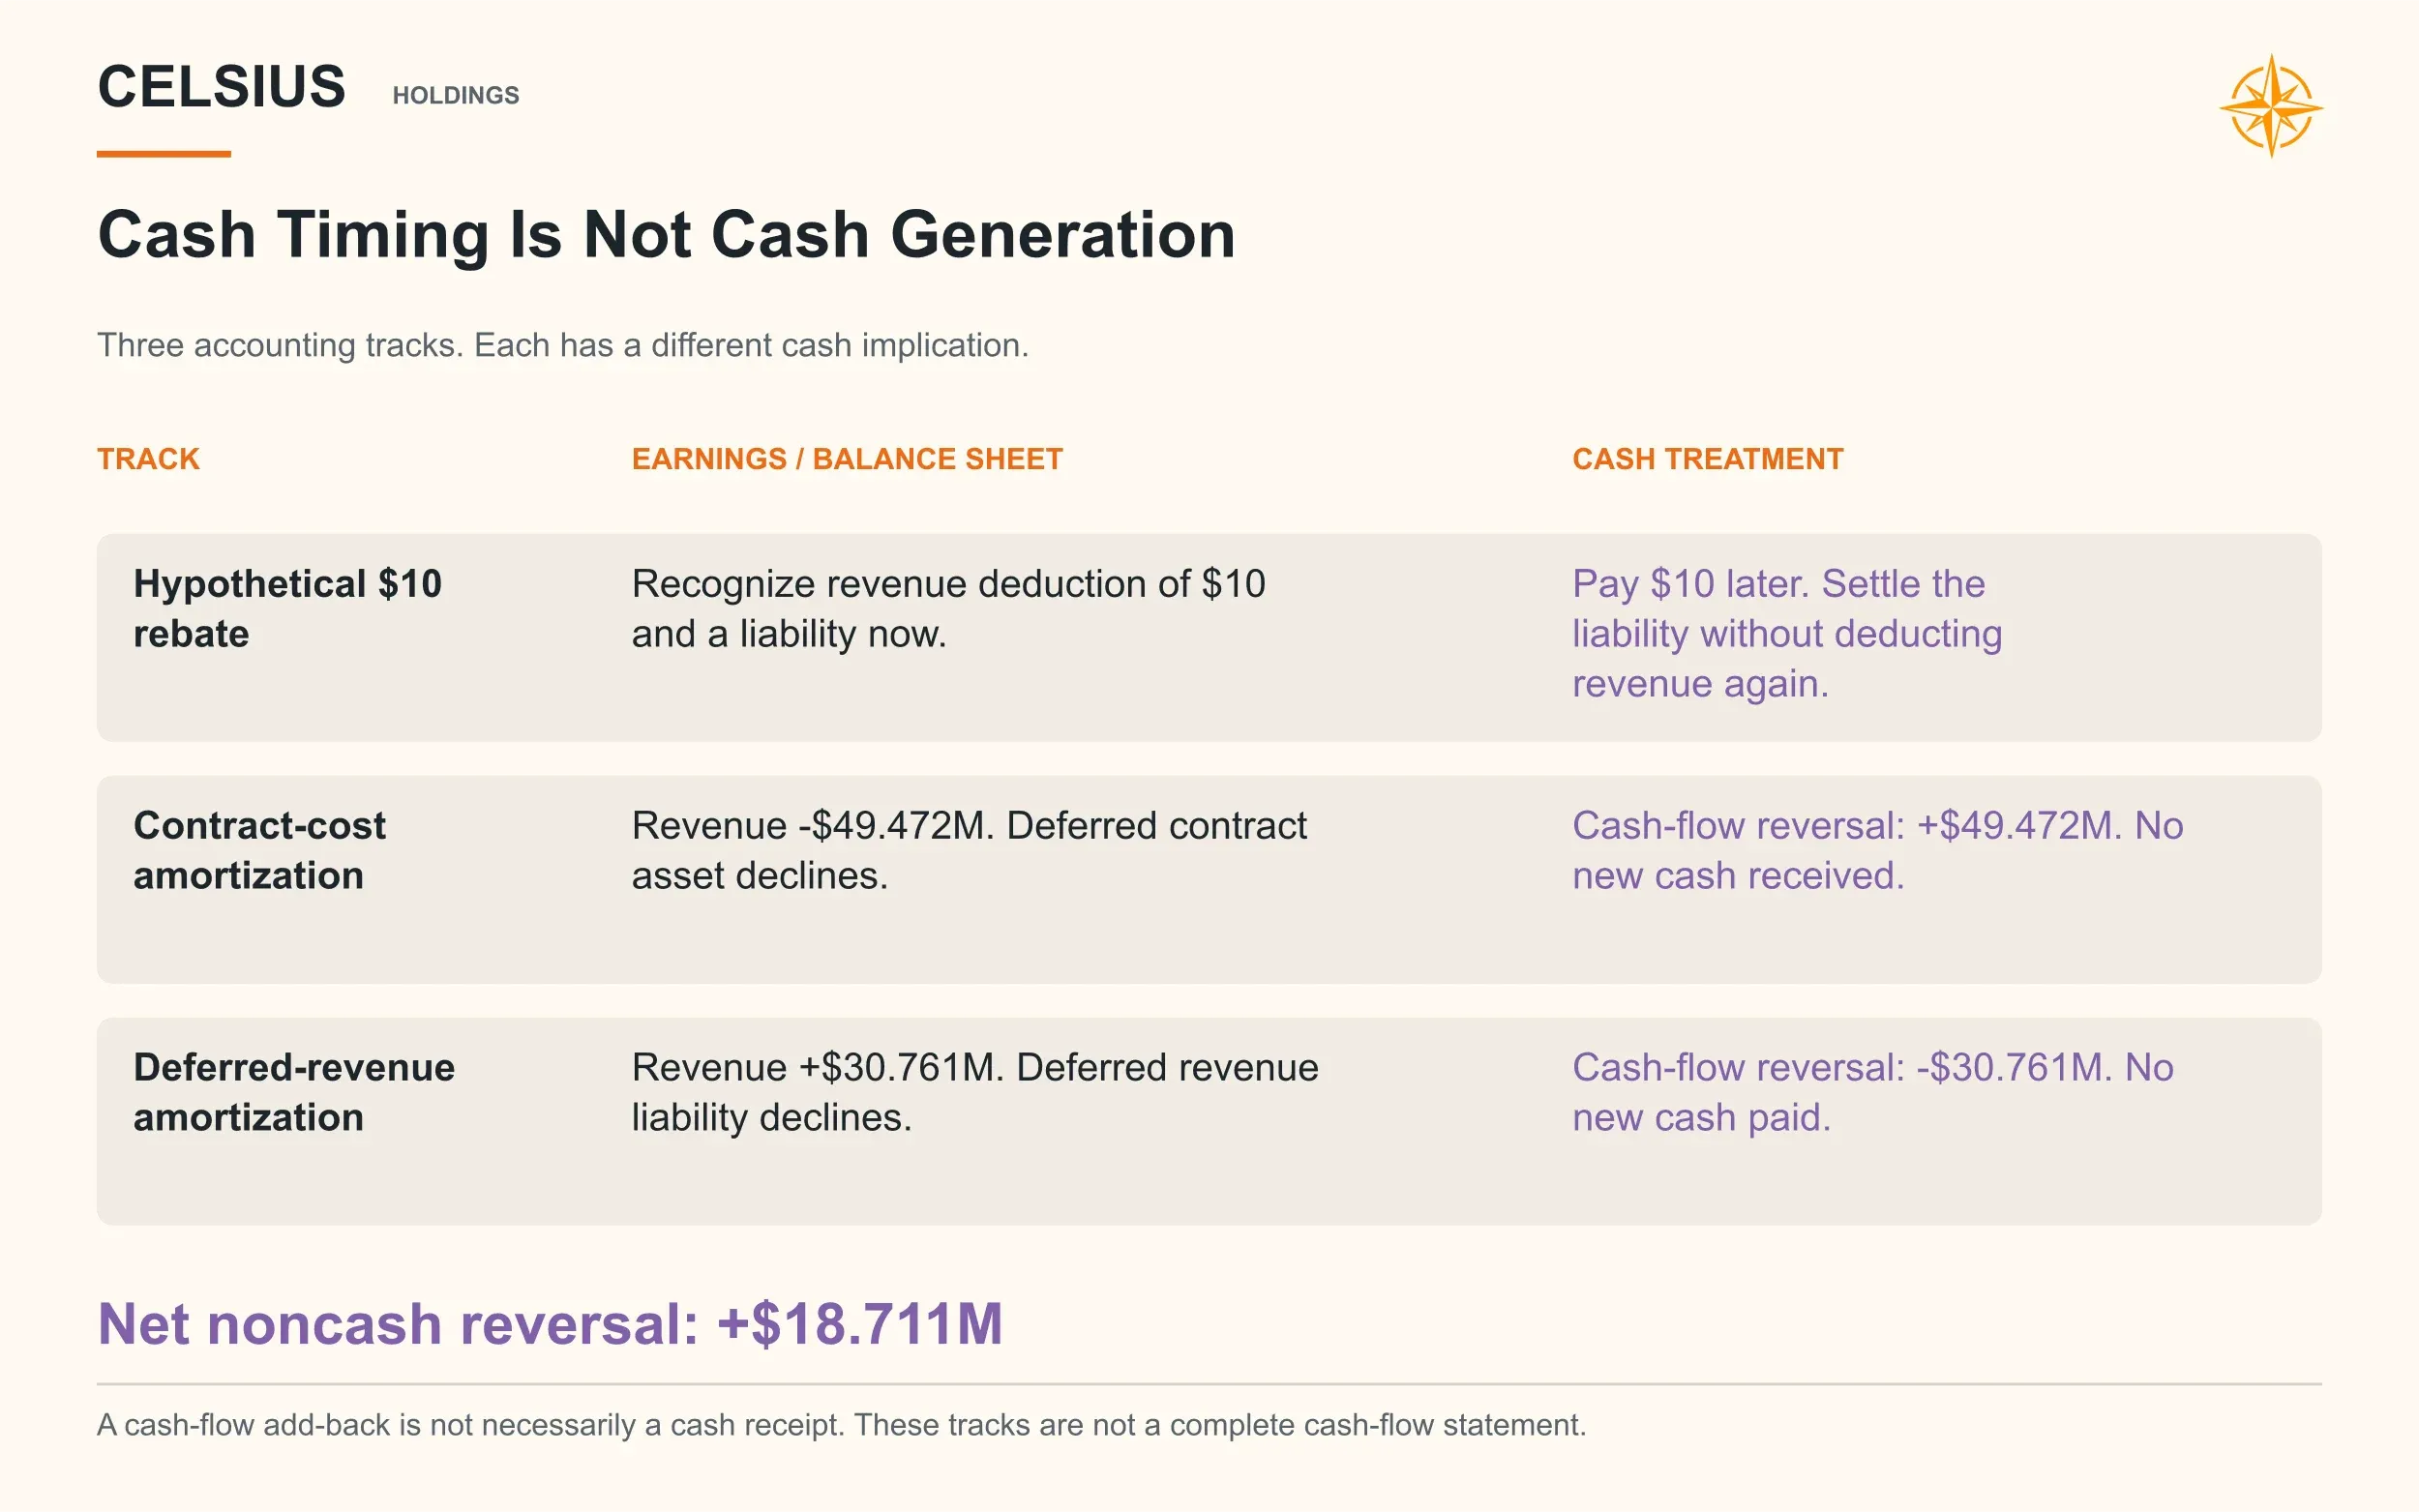
Our forecast models receivables, inventory, and promotional balances directly, and holds back an operating cash reserve equal to the greater of $300 million or 7.5% of annual revenue before anything flows to debt repayment or buybacks.
Capital expenditure rises from about $48 million in 2026 to $65 million in 2030. Working capital keeps absorbing cash as the business grows.
The forecast also includes an $85 million payment in 2027 against the existing litigation reserve. The amount matches the company's accrued estimate, against a disclosed range of $61.3 million to $106.6 million and an appealed judgment of $101.1 million. Since the amount is already accrued, it reduces cash without hitting earnings again.
After working capital, taxes, preferred dividends, and the legal payment, the central case still generates enough cash to retire debt quickly. We assume no large voluntary repayment in the second half of 2026, then direct part of each year's surplus toward the term loan, which is fully repaid during 2028. Free cash flow after preferred dividends grows from about $469 million in 2026 to $1.04 billion in 2030.
Pepsi Gets Paid First
The preferred stock Pepsi holds sits at the center of the common shareholder's math.
Pepsi's two preferred series carry about $1.135 billion of combined stated value, a 5% regular dividend, and roughly 33.3 million common-share equivalents, according to the 2025 10-K. The shares participate in earnings before any conversion takes place. Conversion provisions that begin in 2031 are conditional, so the securities do not simply disappear on a fixed date.
The regular dividend costs about $56.75 million a year in cash. On top of that, the preferred participates in retained earnings alongside common shareholders, which means consolidated net income overstates what belongs to the common stock.
In our 2030 central case, roughly $1.046 billion of normalized consolidated net income becomes about $866 million for common shareholders after the regular dividend and a participating allocation of about $123 million. Pepsi's preferred claims absorb about 17% of normalized net income. The result is $3.69 of normalized common EPS.
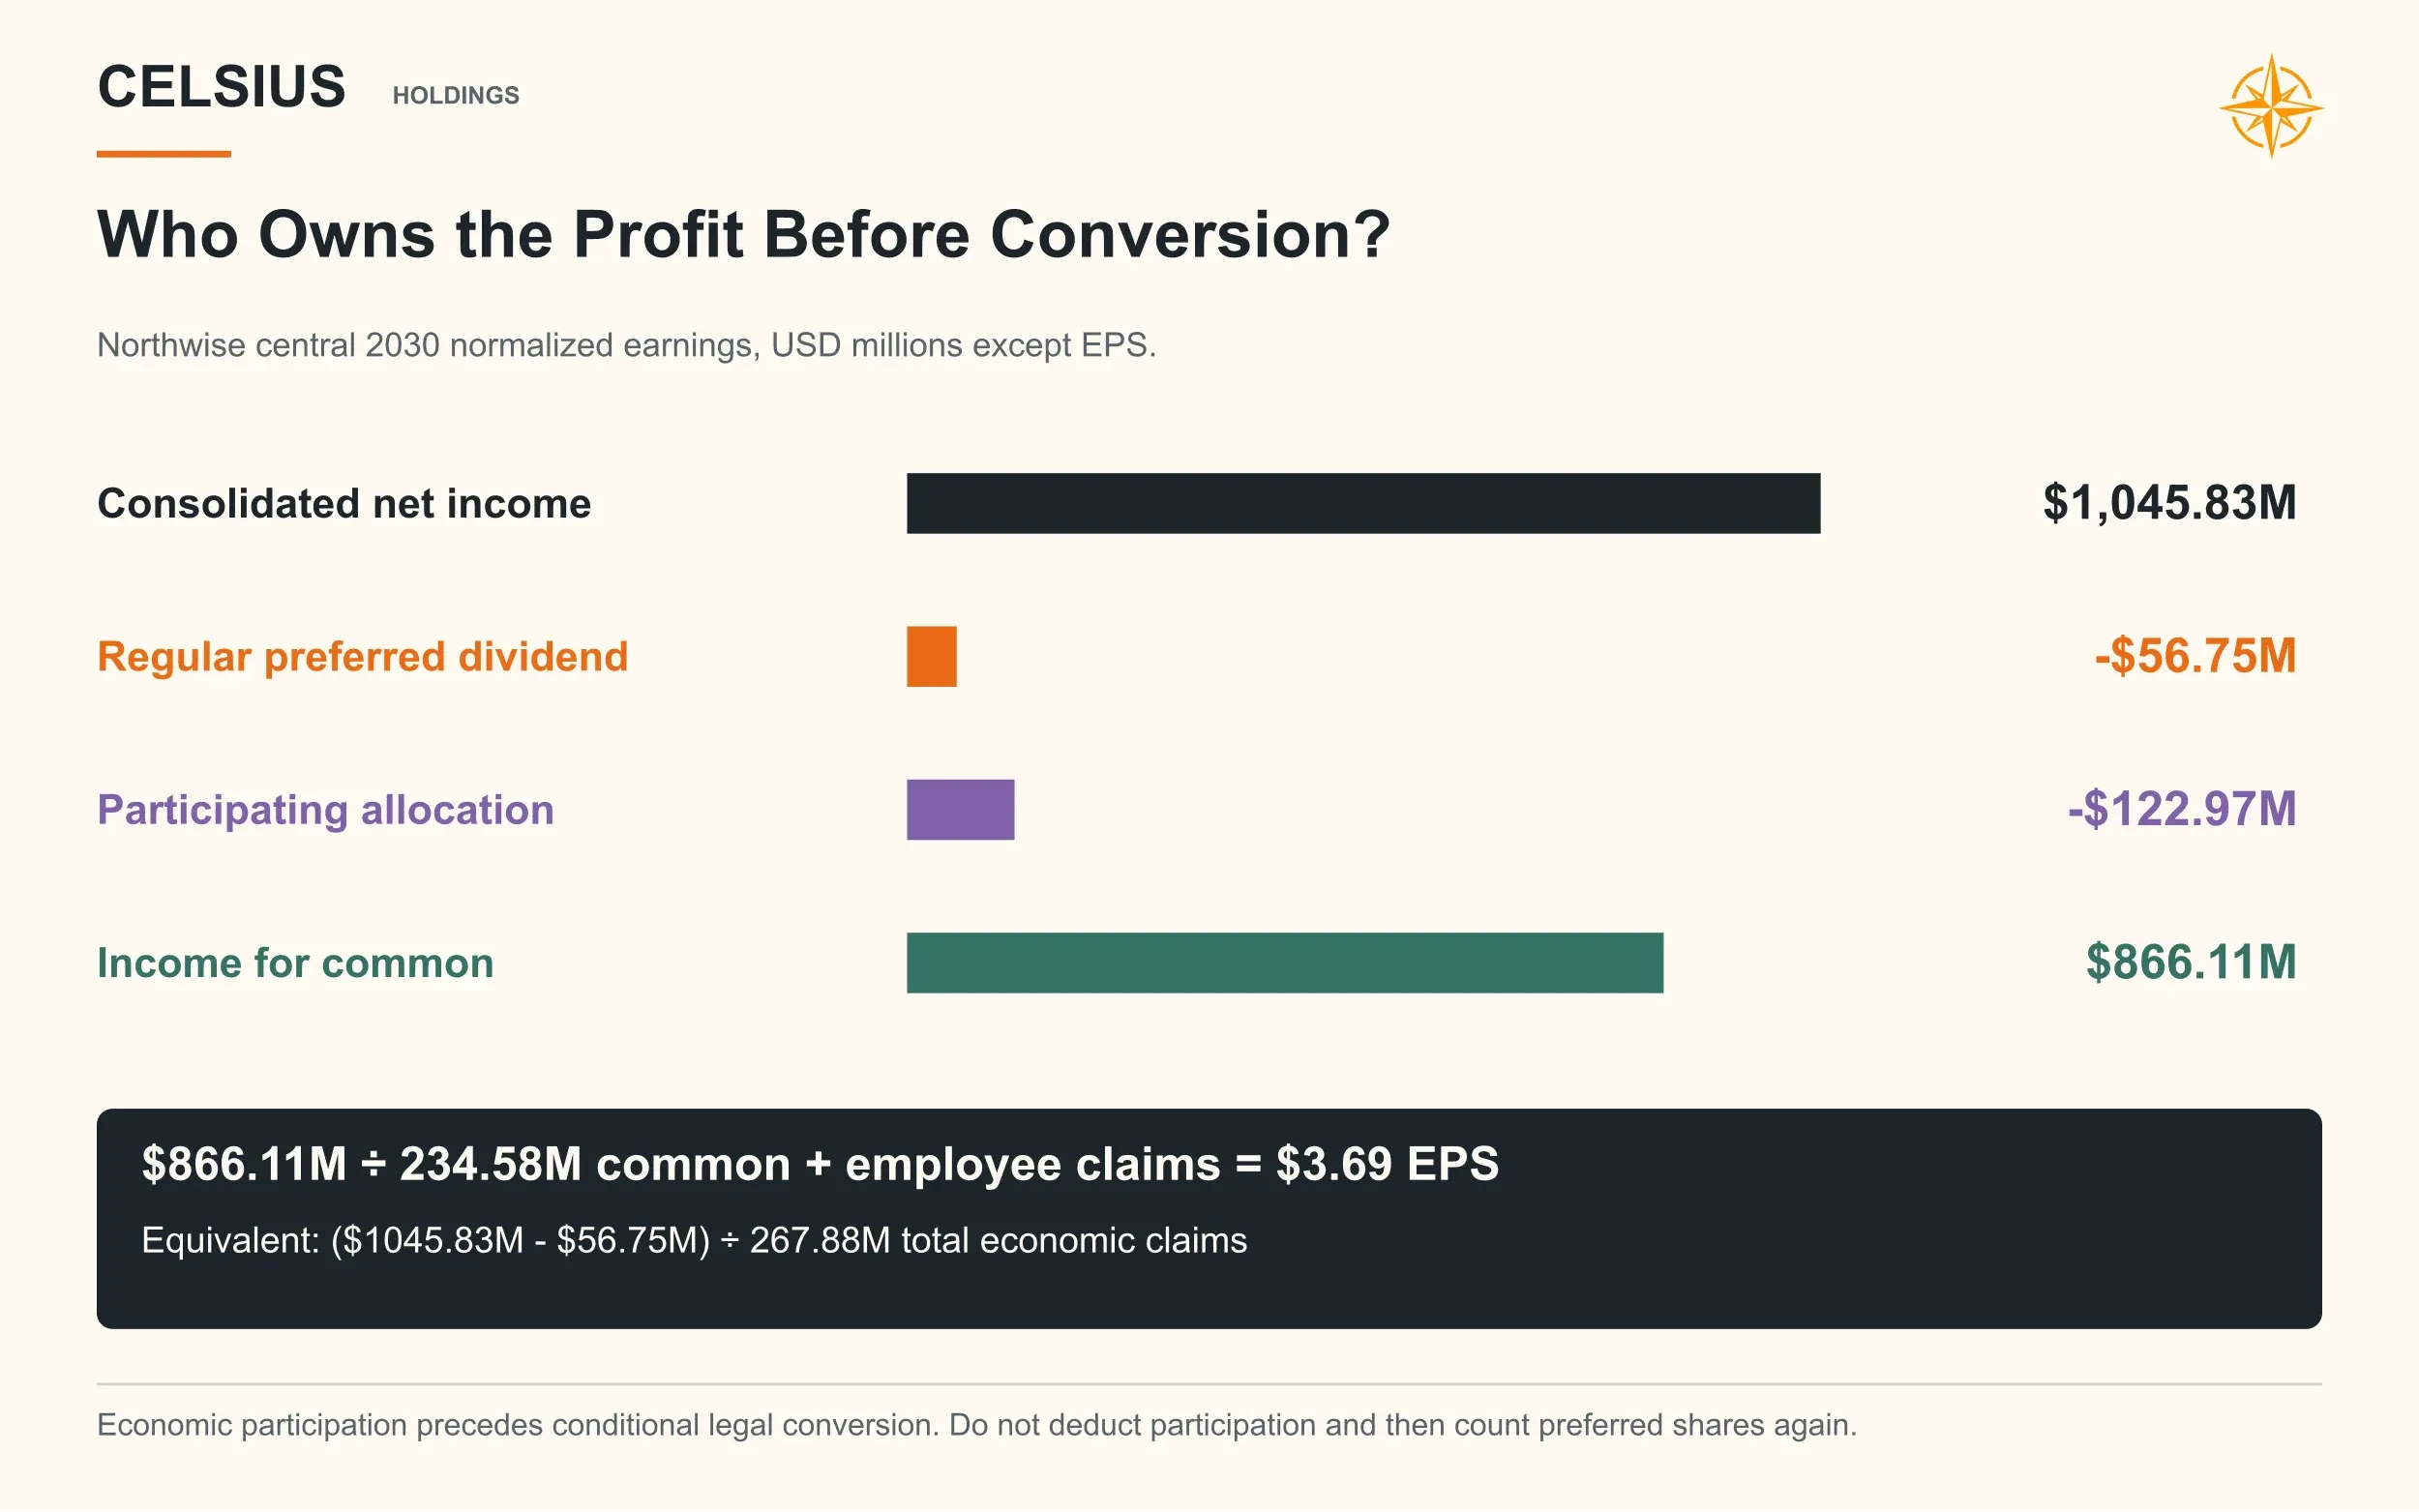
A forecast can get revenue and margins exactly right and still overstate per-share earnings by skipping this step. The claim on the business has to be modeled with the business.
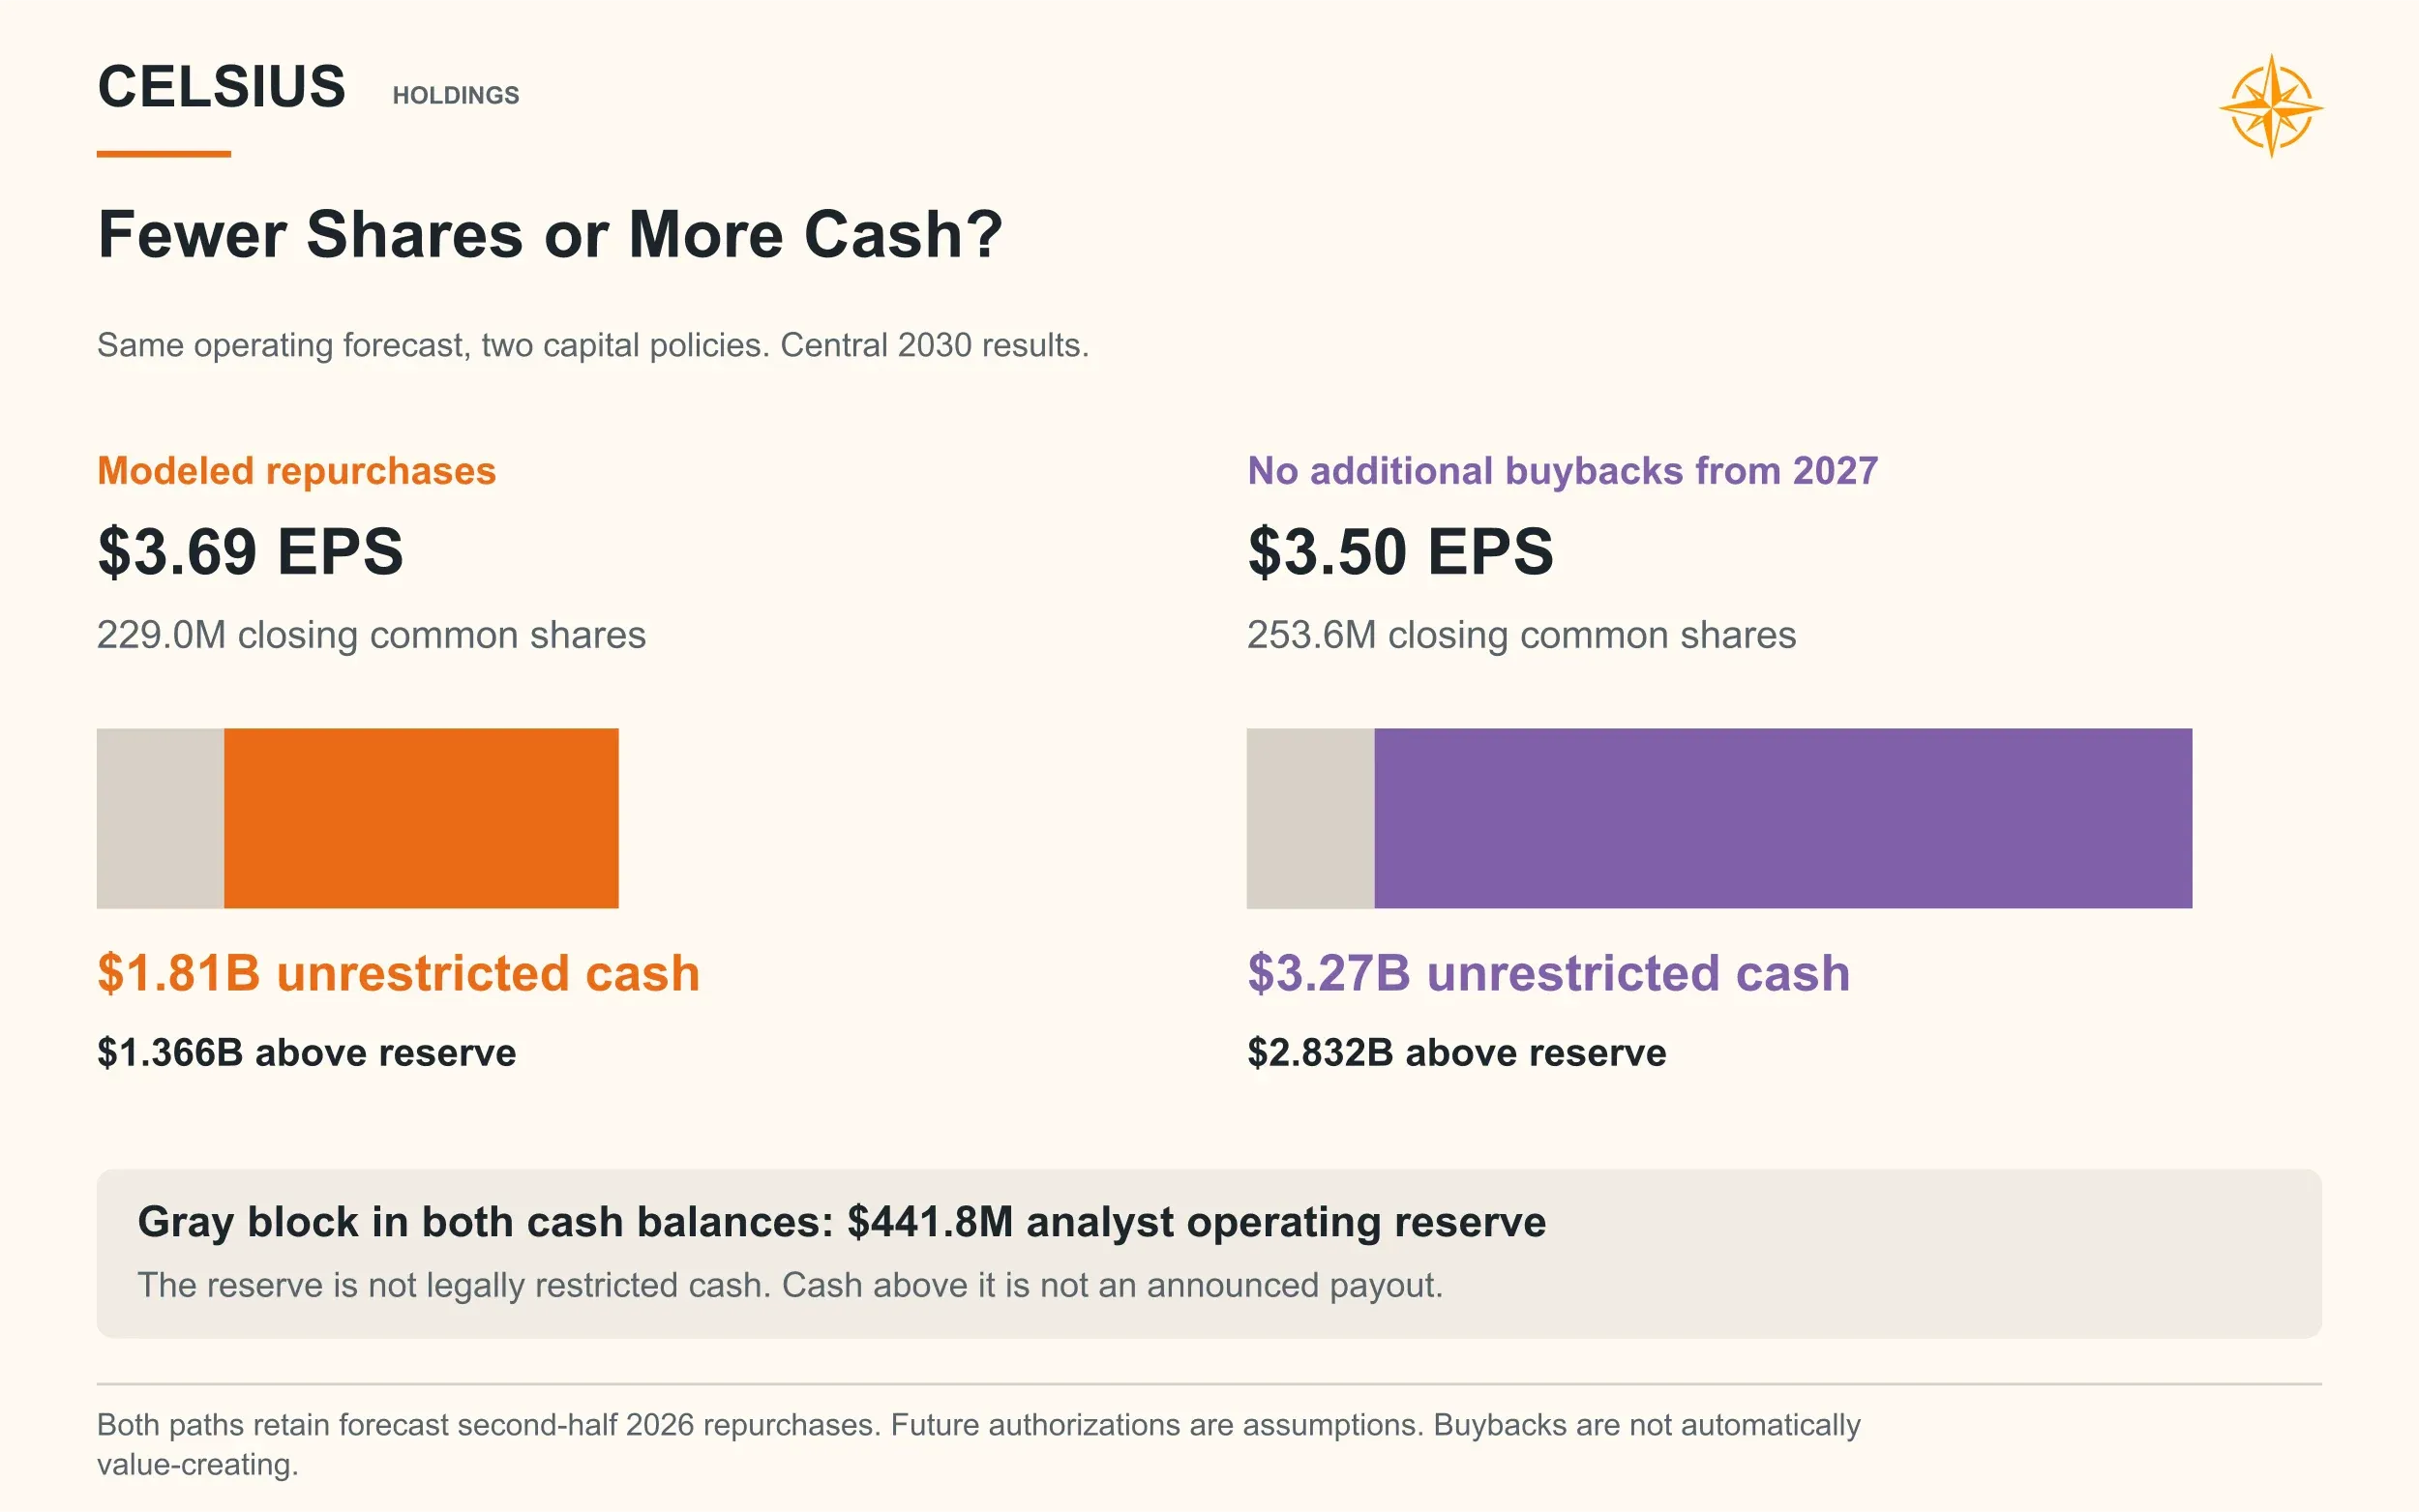
Buybacks add a second source of per-share growth, and they have to be paid for. Our capital policy directs part of the surplus to repurchases only after debt service and the liquidity reserve. Common shares fall from about 250.3 million at the end of 2026 to 229.0 million in 2030, with employee dilution included separately. Those buybacks require authorizations the board has not yet granted, so we also ran the central case with none after 2026.
Central 2030 result | Modeled repurchases | No new repurchases from 2027 |
|---|---|---|
Normalized common EPS | $3.69 | $3.50 |
Closing common shares | 229.0M | 253.6M |
Unrestricted cash | $1.81B | $3.27B |
Without later buybacks, EPS is about 5% lower and the company finishes 2030 holding $1.46 billion more cash. The earnings base is substantially larger either way. Buybacks change the form in which value reaches shareholders, and the operating business does the actual work.
Putting Odds on the Thesis
For domestic Celsius, we assign 30% to a delayed or incomplete recovery, 55% to an ordinary durable recovery, and 15% to a stronger recovery with better productivity. Together, the odds of a durable recovery come to 70%.
The evidence behind that judgment is the identifiable assortment mistake, the continued health of the products that remained, and a practical path to restoring availability. Restraining it are the continued total-brand declines and the absence of clean matched-store data showing lost shoppers returning after the reset.
Alani earns more confidence, supported by stronger current demand evidence. International earns meaningful confidence given functioning overseas franchises and established distribution partners.
Operating proposition | Definition | Probability |
|---|---|---|
Durable core Celsius recovery | Sustained consumer sales recovery by the end of 2027, followed by continued domestic compounding | 70.0% |
Sustained fast Alani growth | North American revenue compounds at 15% or more annually over 2026 to 2030 | 79.0% |
Faster international Celsius growth | Existing Celsius revenue outside North America compounds at 20% or more annually | 71.3% |
Complete three-part thesis | All three propositions hold together | 47.6% |
The three outcomes are linked. Alani has its own momentum, though a commercial organization still struggling with the core brand would weigh on it too. We give Alani an 85% chance of meeting its growth definition when the core recovers and 65% when it does not, which works out to 70% × 85% + 30% × 65%, or 79%. When both domestic propositions hold, international succeeds 80% of the time, so the complete thesis holds in 70% × 85% × 80%, or 47.6%, of outcomes.
The model then runs weaker, central, and stronger versions of each business, producing 27 complete operating paths. A weak Celsius recovery can sit alongside strong Alani growth. International can disappoint without dragging the domestic brands down with it. Several problems can also arrive at once.
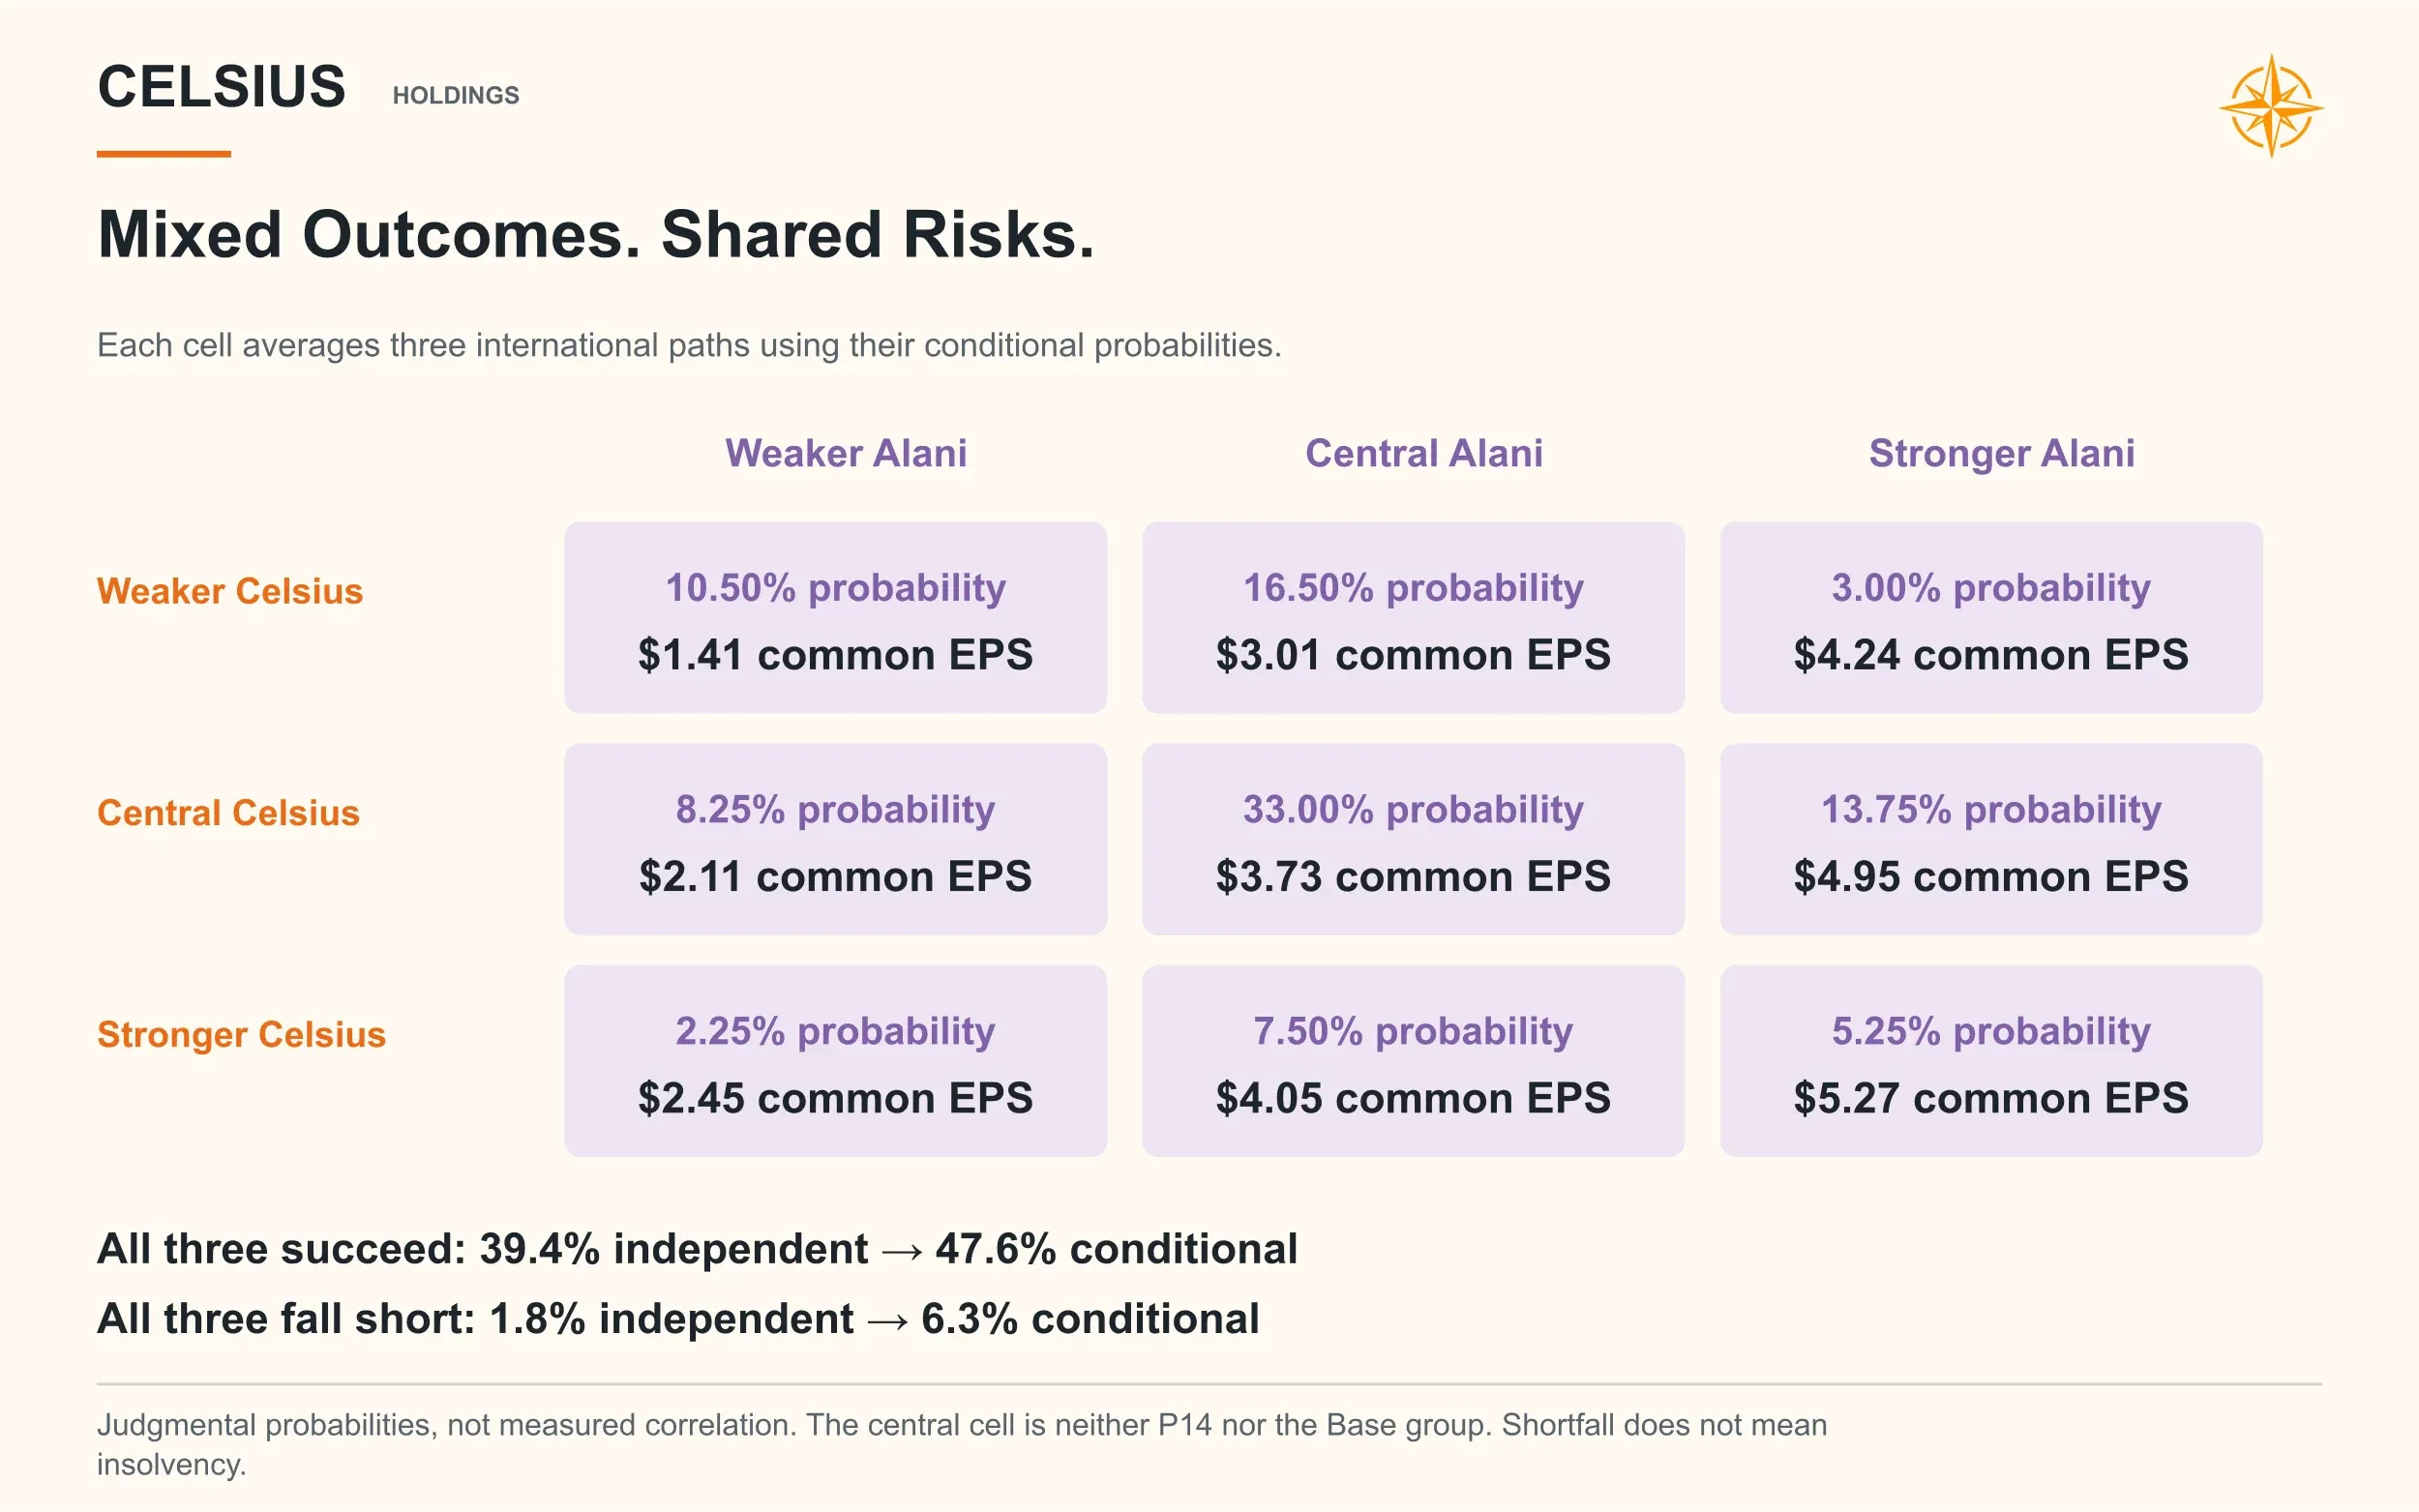
Each path is forecast in full before being grouped by its 2026 to 2030 revenue growth: Bear below 8% a year, Base from 8% to 18%, and Bull at 18% or more. The central case described above is the single most likely path, carrying about 18% of the total probability.
Operating outcome | Probability | 2030 revenue | Normalized operating margin | Normalized common EPS | Cash flow less capex |
|---|---|---|---|---|---|
Bear | 18.7% | $3.91B | 16.8% | $1.72 | $582M |
Base | 50.2% | $5.61B | 22.2% | $3.43 | $1.03B |
Bull | 31.1% | $7.12B | 23.5% | $4.66 | $1.34B |
Probability-weighted | 100.0% | $5.76B | 22.0% | $3.49 | $1.04B |
The Base group averages many mixed combinations, which is why its $5.61 billion of 2030 revenue sits below the $5.89 billion central case.
Scenario measure | 2026E | 2027E | 2028E | 2029E | 2030E |
|---|---|---|---|---|---|
Bear revenue | $3.27B | $3.41B | $3.57B | $3.73B | $3.91B |
Base revenue | $3.32B | $3.84B | $4.42B | $5.02B | $5.61B |
Bull revenue | $3.37B | $4.14B | $5.04B | $6.04B | $7.12B |
Bear common EPS | $1.43 | $1.47 | $1.59 | $1.66 | $1.72 |
Base common EPS | $1.49 | $1.90 | $2.45 | $2.96 | $3.43 |
Bull common EPS | $1.54 | $2.16 | $2.96 | $3.79 | $4.66 |
The Bear outcome is a slow grind more than a collapse. Revenue grows under 5% a year, operating income stays flat around $650 million as costs keep climbing, and common EPS barely moves for four years.
For a beverage company, that is the realistic way to disappoint. The cans keep selling, and the compounding never shows up.
What Would Change Our View
The clearest confirmation for the core brand would be sustained total-brand consumer growth after the 2027 resets, backed by comparable-product performance and visible in more than one channel. A recovery that came only from restocking would not prove durable demand. A recovery purchased with steadily deeper discounts would raise a different question about profitability.
For Alani, the test is whether the permanent lineup holds its productivity as new distribution stops doing the heavy lifting. We will watch revenue retained per unit alongside the retail growth figures, since strong demand that requires ever-larger commercial concessions is worth less than the headline suggests.
International confirmation comes from repeat orders and improving productivity in existing markets. New country announcements are encouraging, and the case strengthens most when established markets deepen.
Some risks sit outside ordinary commercial execution. Texas has announced an investigation into the marketing and representations of Celsius and Alani products. It could bring legal costs, labeling or marketing changes, and reputational damage, though no finding has been made and our forecast assumes no penalty.
The 27 operating paths also exclude recalls, severe product restrictions, loss of distribution, fraud, and insolvency, which we test separately in the valuation.
Our confidence would fall materially if several developments arrived together: continued core weakness after the commercial repair, falling Alani productivity despite a wider assortment, heavier promotional intensity, and overseas launches that produce first orders without reorders. The thesis can absorb an uneven quarter. What would break it is a list of temporary problems that keeps getting longer.
The operating conclusion is a favorable one. A modest domestic recovery, a durable Alani franchise, and faster overseas growth can produce a much larger and more profitable company without a Rockstar revival or Monster-level margins.
What that company is worth, and what price makes it worth owning today, is a separate question.
Northwise Premium
Everything above describes the business we expect Celsius to become and the odds we attach to getting there. The premium section turns that work into an investment decision: three valuation methods applied across all 27 operating paths, a full allocation of value to Pepsi's preferred stock, year-by-year value estimates, the sensitivities that move the answer most, the entry prices that meet our required returns, and the Northwise rating.
Premium members also receive the complete, editable CELH 2030 model behind every figure in this forecast.
For the research history, see our May 2026 CELH stock forecast. Find the model and all related coverage on the Celsius research page.
Northwise Premium
Choose how to continue with Northwise
Join Northwise Premium
Unlock the rest of this report, its complete valuation, the downloadable model, portfolios, and action framework.
Join Northwise PremiumCreate a Free Account
Continue across Free Northwise research, follow companies, save reports, and receive updates.
Create a Free Account
CELH Stock Forecast 2030
CELH Stock Forecast 2030 covering Celsius, Alani Nu, Rockstar, Pepsi distribution, Costco risk, and international growth model.

Meta AI Spending: The Customer Is Already Here
Can Meta turn AI spending into shareholder returns? We model advertising, Muse, hardware, capital costs and cash flow through 2030, with a full valuation.

IREN Stock Dilution: Can the Build Reach Shareholders?
IREN stock analysis of AI growth, funding and dilution through 2030. Read our full valuation, 27 scenarios and price zones free. Excel model is Premium.
Northwise Portfolios
See how the research becomes real decisions
Reader discussion
Discuss the research
Premium access is required to join this report's discussion.
Join Northwise Premium
No comments yet. Start a thoughtful discussion.