Meta AI Spending: The Customer Is Already Here

Can Meta turn AI spending into shareholder returns? We model advertising, Muse, hardware, capital costs and cash flow through 2030, with a full valuation.
In this article
October 9, 2026 · Northwise Research Team
Meta's AI spending presents investors with two facts that are difficult to reconcile. Advertising is growing rapidly, helped by better recommendations and ad matching. Yet the investment needed to support that growth is consuming much of the cash shareholders once received. Our forecast through 2030 follows both sides of that equation.
In the fall of 2022, Meta was losing more than $13 billion a year building a virtual world that almost nobody wanted to visit. The stock fell below $90. Shareholders who stuck around learned something expensive about Mark Zuckerberg: when he believes in an idea, he is willing to spend heavily before the returns are clear.
Four years later he believes in something again, and the capital budget is much larger.
We expect Meta to spend about $906 billion on data centers, servers and leases between 2026 and 2030. In the second quarter, revenue grew 28% while operating income fell. Capital spending left $13.17 billion of free cash flow in the first half of the year.
The comparison with 2022 is understandable. Once again, shareholders are financing a large expansion before knowing what it will earn.
The difference is that much of this spending serves an existing business. Consider a small shop owner who sells candles on Instagram.
She can measure whether $1,000 of advertising brings in enough orders to justify spending another $1,000. When Meta improves the match between her ads and potential buyers, her returns improve and she has a reason to spend more. Millions of businesses make that calculation every day.
Meta's advertising customers already pay for measurable results. Better AI can improve those results without requiring customers to adopt an entirely new product.
Growth, spending and shareholder returns
That distinction explains our interest in Meta, but it does not settle the valuation.
Revenue growth supports the case for investing in AI. Falling margins show how expensive that investment has become.
Both matter. Shareholders need to know how much cash remains after Meta pays for the expansion.
Northwise follows the chips, power, data centers and financing behind AI. Meta differs from the infrastructure providers in that it primarily uses the capacity itself. Its return must come through advertising, subscriptions, APIs and devices. We do not assume a separate business renting spare computing capacity.
That makes the capital and compensation schedules as important to the forecast as the product launches.
We value Meta at $1,460.91 a share at the end of 2030. Against the October 8 close of $720.89, that is 102.7% upside. The valuation section considers whether the annual return compensates for the spending, execution risk and time involved.
How Meta actually gets paid
Advertising still provides most of the revenue and profit.
Every time you open Instagram or Facebook, Meta runs an auction you never see. Thousands of advertisers are bidding to reach someone like you, and Meta's systems have a fraction of a second to decide which ad to show, predict whether you'll act on it, and set the price. Do that billions of times a day and, in our forecast, it produces about $245 billion of advertising revenue this year.
The arithmetic behind that number is simple. Revenue is the number of ads shown multiplied by the average price per ad. Meta reports both, and between them they tell you almost everything about how the business is doing.
How Apple changed the advertising business
To understand why Meta's AI spending is different from its metaverse spending, go back to 2021. That year Apple let iPhone users block apps from tracking what they did in other apps. For a company whose ads depended on knowing that you'd browsed hiking boots somewhere else, that was a direct hit. Meta told investors in early 2022 that the change would cost it around $10 billion of revenue that year. Apple tracking impact.
Meta's response was to stop leaning so hard on outside data and get far better at predicting from what it could see inside its own apps. That was AI work before the current consumer-agent boom. Advantage+, Meta's largely automated campaign product, came out of that rebuild, and it now runs at more than $75 billion a year.
Meta has been investing in these systems for years. The current agent business adds another use for that work.
Why price and volume rose together
Now look at the second quarter through that lens. Meta showed 14% more ads and charged 12% more for each one.
1.14 × 1.12 − 1 = 27.68%
That compounds to roughly the 28% growth Meta reported.
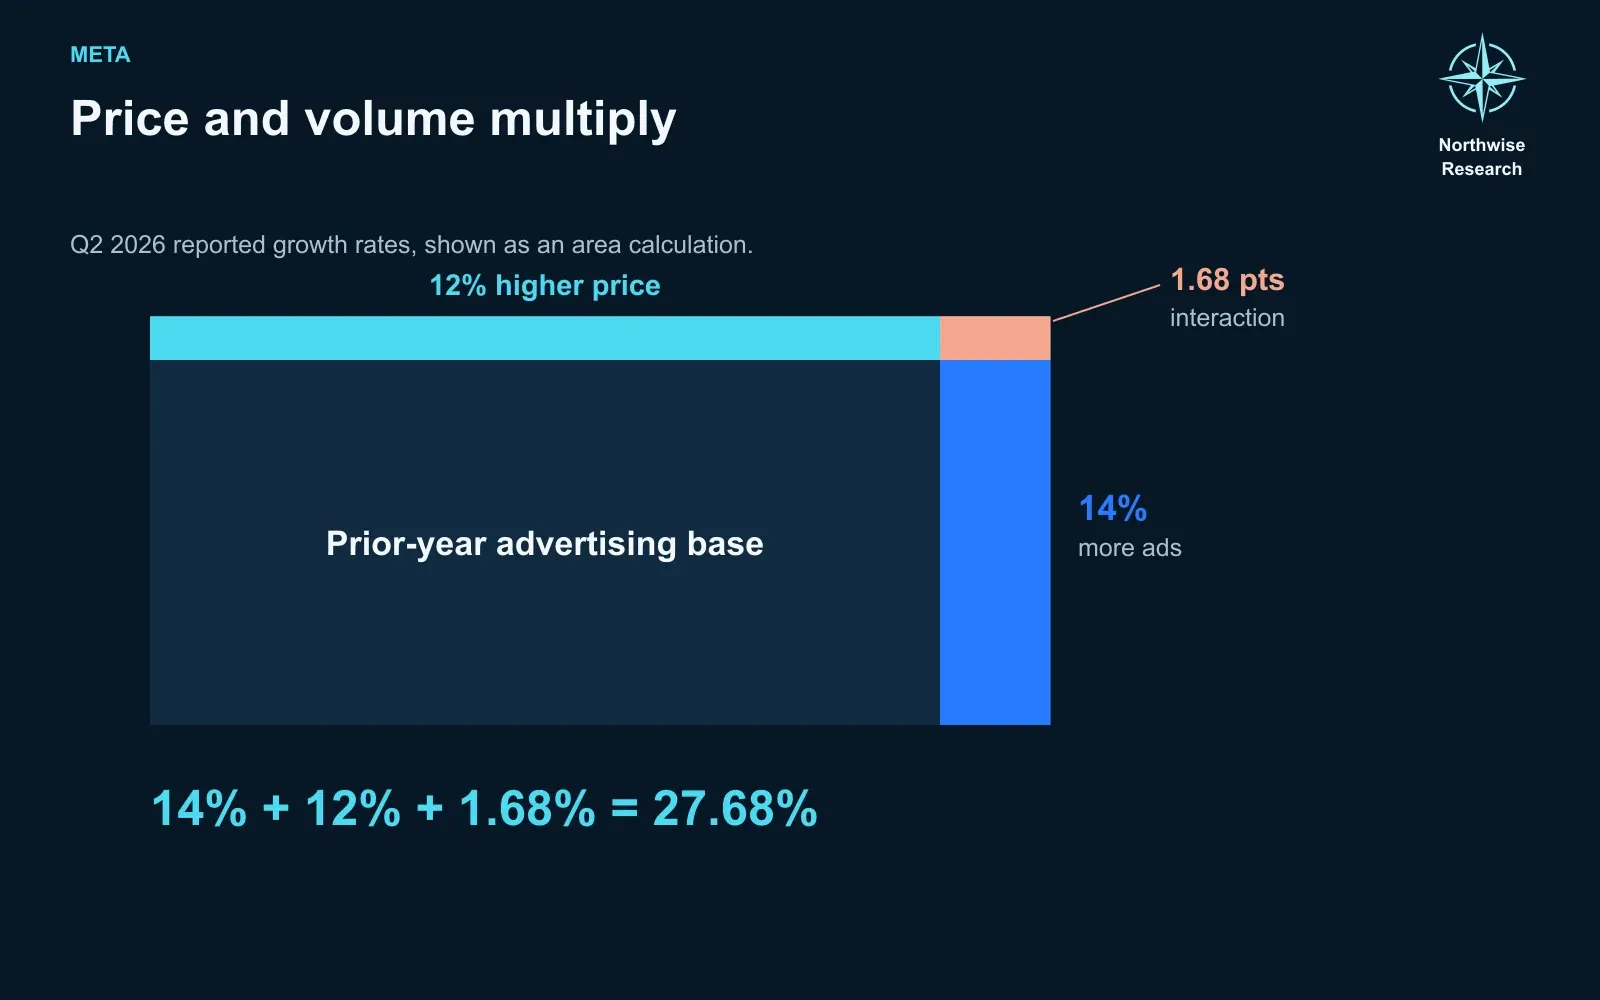
In almost any other market, flooding it with 14% more supply would push prices down. Meta added the supply and prices went up. That is consistent with advertisers getting more for their money as matching improves. It does not isolate AI as the cause: advertiser demand, geographic mix and currency also affect the reported result.
Meta has also put some numbers on the inside view. It credited specific improvements in understanding users and ranking ads with an 8.3% increase in Facebook ad clicks and a 15.7% improvement in conversions. A separate Instagram test lifted app-event conversions by 1%. Those are results from particular changes, so we don't stretch them across the whole company. They are still the fingerprints you'd expect to find. Meta Q2 earnings call.
The creative side is moving too. More than nine million small businesses have used at least one of Meta's AI tools to make ads. For our candle seller, that's the difference between testing three versions of an ad and testing thirty, and letting the auction tell her which one works.
The new models are already inside
Most people think of Muse, Meta's new AI model family, as a consumer app. The Muse that may matter more is the one nobody sees.
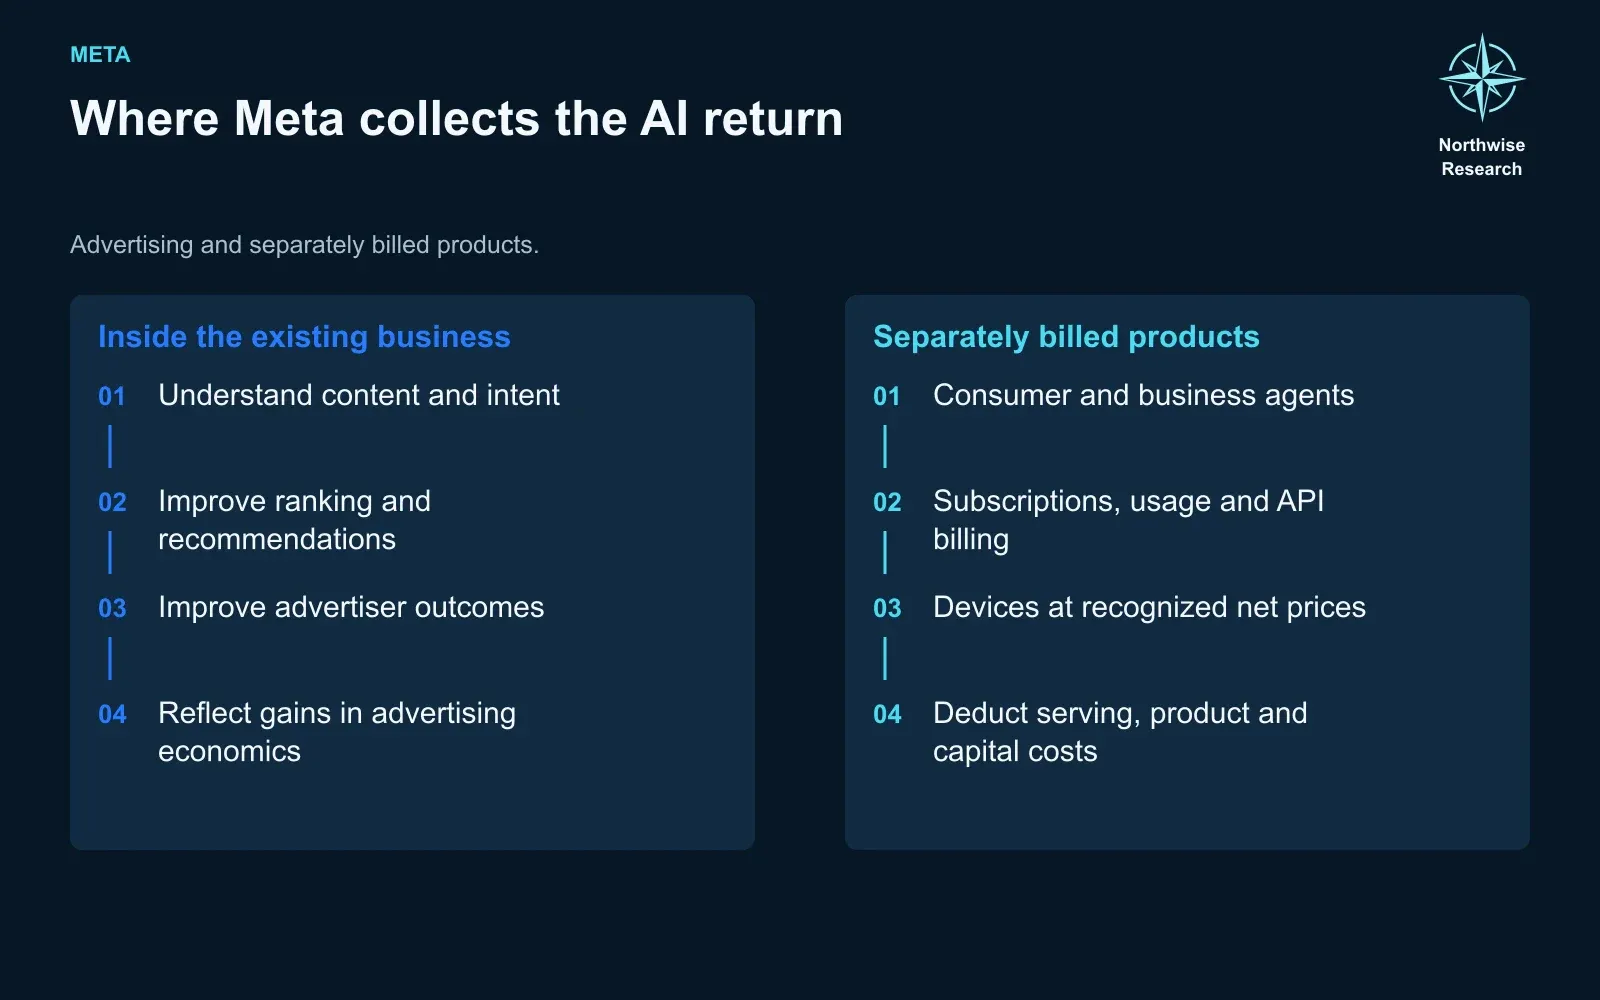
Meta now runs every public Instagram Feed and Reels post through a large language model so its systems understand what the content actually is. It uses Muse models to classify and summarize video. It's building recommendation systems that understand interests directly, instead of inferring them mostly from what you clicked before. And it's starting to use AI agents to help engineers design and evaluate experiments, which means more improvements can be tried without hiring an army to run them. Meta Q2 earnings call.
The internal gains appear in advertising revenue and operating costs. We reflect them in growth and efficiency assumptions. Meta also says private Muse conversations are kept out of its advertising systems.
Better targeting cannot remove economic risk. Advertisers still depend on consumer demand, and improvements may become harder to achieve as the systems mature.
Why second-quarter profit fell
If the ad machine works this well, why did profit fall? Here's the second quarter as reported.
Reported result | Q2 2025 | Q2 2026 |
|---|---|---|
Revenue | $47.52B | $60.80B |
Operating expenses | $27.08B | $42.03B |
Operating income | $20.44B | $18.78B |
Operating margin | 43.0% | 30.9% |
Net income | $18.34B | $15.85B |
Diluted EPS | $7.14 | $6.18 |
Revenue growth alone misses the increase in expenses.
Some of the damage was one-off. The quarter carried roughly $2.4 billion of legal charges and $1.18 billion of severance. Take those out and operating income was about $22.36 billion, up 9.4% from a year earlier, at a 36.8% margin. On that limited adjustment, operating profit grew. This is our two-item comparison, not a complete normalized earnings measure.
Even on that adjusted basis, operating profit grew much more slowly than revenue.
Depreciation, cloud bills, compensation and new product spending explain much of the gap. Our forecast keeps operating margins under pressure through 2028, with recovery beginning in 2029.
The cash statement tells the same story with less anesthetic. In the first six months of the year, Meta generated $64.09 billion of operating cash. Capital spending and lease payments took $50.92 billion of it, leaving $13.17 billion. Cash paid to cover employees' stock taxes and the dividend took most of the rest. What remained was about $1.77 billion. Meta Q2 results.
Meta can finance the expansion, but doing so leaves less cash for repurchases.
Where we were wrong
Our previous Meta report fell into the bull camp's trap. We went too quickly from "AI makes Meta better" to "margins expand and the share count shrinks." We were forecasting $460 to $490 billion of 2030 revenue, operating margins of 42% to 44%, and earnings of $62 to $68 a share.
We now expect more revenue, $539.55 billion, and less of almost everything else: a 34.5% operating margin and $57.44 of earnings per share. The opportunity turned out bigger than we thought. So did the bill.
The $459 billion bet
The advertising forecast has a much greater effect on valuation than any individual consumer device.
We expect ad revenue to grow from $245.24 billion in 2026 to $459.31 billion in 2030. That means nearly doubling the largest advertising business in the world in four years, which would take much more than one good product cycle. Meta has to keep winning in every region, year after year, and each region wins a different way.
Annual growth | 2027 ads shown | 2027 price per ad | 2030 ads shown | 2030 price per ad |
|---|---|---|---|---|
US and Canada | 9.0% | 11.0% | 6.0% | 8.0% |
Europe | 8.5% | 5.5% | 6.5% | 6.0% |
Asia-Pacific | 14.0% | 3.5% | 10.0% | 5.0% |
Rest of world | 11.5% | 10.0% | 8.5% | 8.0% |
North America has the highest ad prices, and we assume further annual increases of 8% to 11%. That requires sustained improvements in advertiser returns. Asia-Pacific provides more volume at lower prices. Europe grows more slowly as restrictions on personalized advertising affect monetization. We model the regions separately because those differences matter.
How big is too big?
Here's the reality check. PwC estimates the global internet ad market at $755.6 billion in 2025, growing 7.2% a year through 2030. On that path, our forecast would give Meta about 42.9% of the entire market by 2030. If the market grows 10% a year, the share falls to 37.7%. At 12%, it's 34.5%. The definitions don't line up perfectly, but the order of magnitude is right, and it's big. PwC advertising outlook.
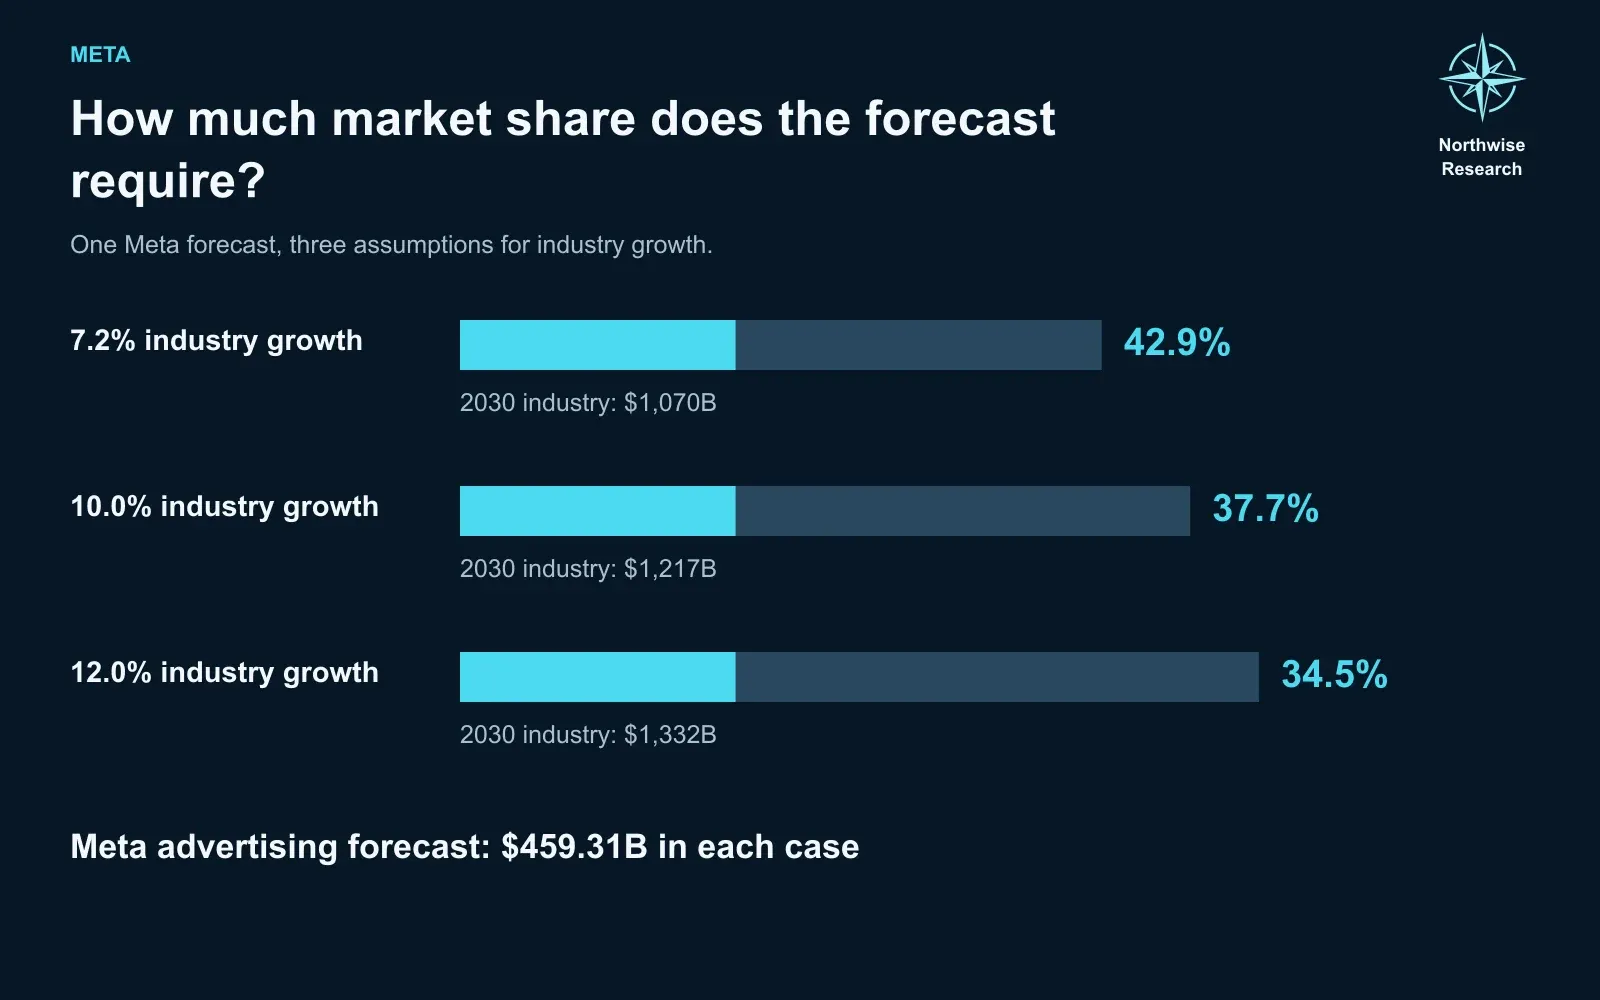
Taking more than 40% of the projected market is a demanding assumption. Better advertiser returns could expand total spending as well as shift share toward Meta.
We therefore use the industry forecast as a comparison rather than a ceiling. Our Base case still requires Meta to capture a large portion of incremental advertising spending for four years.
And the stakes are enormous. If the price per ad grows two percentage points slower each year than we expect, 2030 revenue falls to $506.36 billion and earnings drop to $46.63 a share. Two points faster, and revenue reaches $574.65 billion with earnings of $68.99. That $22 swing in earnings per share comes from a single assumption, and nothing else in the model comes close. If you want to disagree with us about Meta, disagree with us here.
Muse, the part you can see
Muse introduces a different business model, with recurring subscription revenue and a direct cost to serve each user.
The consumer version of Muse is not a chatbot in the usual sense. It's closer to hiring a very fast assistant. Each user gets a dedicated virtual computer that Muse operates on their behalf. It connects to the services you allow, works through tasks, and keeps going after you close the app. You decide what it can touch, and it asks before doing anything sensitive. That design makes it far more useful than something that just answers questions. It also makes it far more expensive to run, because an agent that works for you in the background is burning compute the whole time. Muse launch announcement.
The early adoption figures have grown. Reuters reported on October 6 that Citi counted more than 6.6 million downloads and 1.8 million daily active users. Those are encouraging figures, though they do not reveal how many users pay or renew. Reuters, October 6.
Citi projects more than $27 billion of Muse revenue in 2030, mainly from transactions. Our model takes a different approach: subscriptions generate the consumer revenue, and we assume no commission on purchases. Meta has not disclosed enough commercial terms for us to value that potential transaction stream.
In our Base case, 5% of new users start paying right away. Each month after that, 0.2% of the remaining free users upgrade and 3.5% of paying users cancel. The expensive $100 tier makes up 5% of subscribers in 2027, rising to 8% by 2030. Blend 8% at $100 with 92% at $20 and the average subscriber pays $26.40 a month. After promotions and discounts we assume Meta keeps 97% of that, or $25.61.
Personal Muse | 2026E | 2027E | 2028E | 2029E | 2030E |
|---|---|---|---|---|---|
Average organic monthly users | 3.71M | 136.00M | 315.00M | 490.00M | 700.00M |
Average paying users, incl. devices | 0.21M | 8.00M | 21.07M | 35.91M | 54.69M |
Revenue per payer per month | $21.73 | $23.28 | $24.06 | $24.83 | $25.61 |
Revenue | $0.05B | $2.24B | $6.08B | $10.70B | $16.81B |
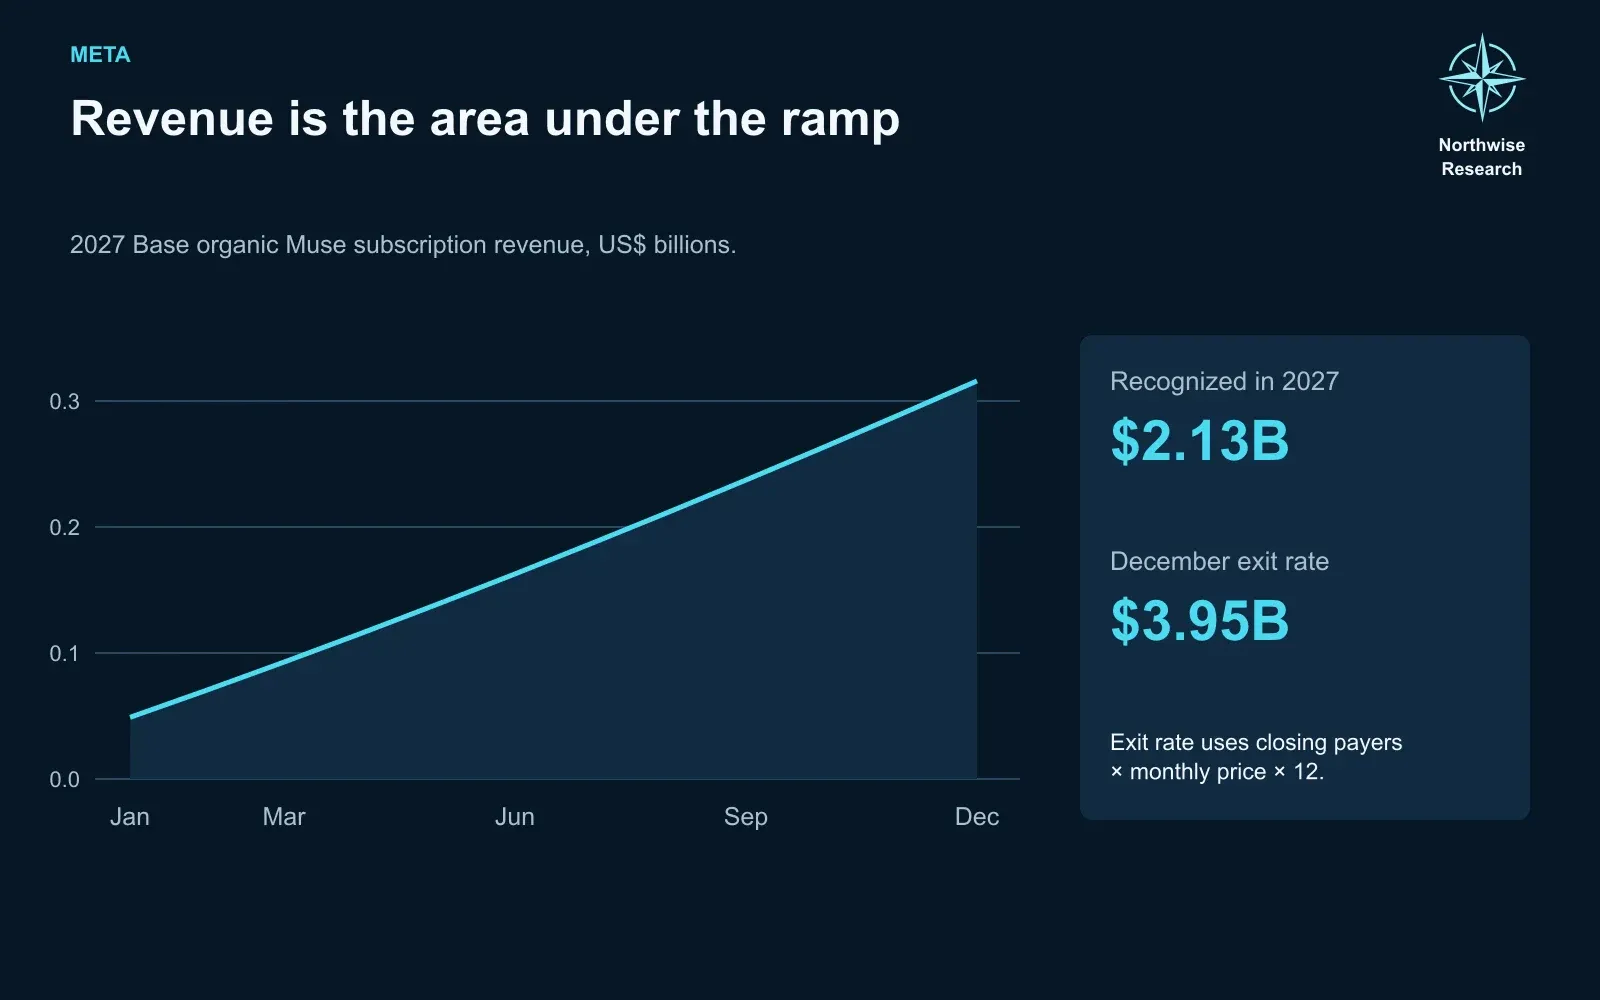
One thing trips up a lot of Muse forecasts: a business that's growing fast earns much less during a year than its year-end run rate suggests. We have Muse ending 2027 at an annual pace of $3.95 billion, but only booking about $2.13 billion during the year, because it spends all twelve months climbing toward that pace. Subscriptions sold alongside Meta's devices add $0.10 billion. By 2030, the app itself brings in $15.34 billion and device-linked subscriptions $1.46 billion.
The table shows organic monthly users. Including incremental device users brings average active users to 715.55 million in 2030. Subscriber and revenue totals include both groups.
Reaching 700 million organic monthly users in 2030 requires international adoption and sustained use well beyond the launch. Early downloads give us little evidence about retention several years out.
There's also a twist that surprises most people. If Muse signs up 30% fewer paying users than we expect, 2030 earnings dip only to $56.69 a share, and free cash flow actually rises slightly, to $98.70 billion, because Meta needs fewer servers to support it. That doesn't make weak adoption good news. It shows that for Meta right now, fast growth and near-term cash pull in opposite directions.
The business agent is the easier sale
The consumer app gets the headlines, but the business version may be the more natural fit.
A customer sees an ad, asks about a product in WhatsApp and places an order. An agent that can answer those questions and complete the sale has a clear use for the shop owner. More than one million businesses were using Meta's Business Agents by June. Meta extended its offering with Enterprise Platform on September 28 and Muse for Small Business on September 29. The latter connects to tools including Shopify, QuickBooks, Stripe and Canva. We expect revenue through subscriptions, messaging and agent usage, rather than a new fee for every tool a business connects. Meta Enterprise Platform.
Business revenue line | What we assume for 2030 | 2030 revenue |
|---|---|---|
Paid messaging | Continued growth in paid business conversations | $10.85B |
Meta One | 95M paid subscriptions at $11.25 a month | $12.83B |
Business-agent usage | 15M paying businesses at $760 a year | $11.40B |
APIs for developers | 9 quadrillion tokens at $1 per million | $9.00B |
We separate messaging, agent usage, subscriptions and API revenue so the same activity is not charged twice. Our forecast includes $11.40 billion of business-agent revenue and $9.00 billion of API revenue in 2030. The new enterprise organization gives Meta a clearer route to sell those services, but customer retention, usage and pricing will determine what it earns.
Glasses, headsets and a keychain
An agent is only as useful as it is easy to reach. If you have to unlock your phone, find the app and type, Muse is a tool you use occasionally. If it's in your glasses or your pocket, it has a chance to become a habit. That's the logic behind the hardware Meta showed at Connect.
Convenient access should help adoption. Sustained use is harder to establish than initial demand for a new device.
Meta is making three different bets here, and they shouldn't be lumped together.
The premium headset is the most striking. The part on your face weighs about 100 grams, because the computer, battery and storage live in a separate puck connected by an optical cable. It will sell for $1,299.99 in the US starting in spring 2027. Getting the weight off your head fixes the biggest complaint about VR. Whether people will put up with a cable and a puck instead is a question nobody can answer until it ships. Meta VR announcement.
Everyday glasses are the volume play. Camera glasses, audio glasses and display glasses sit at very different prices, and Meta just widened the lineup. Most of these are affordable accessories, not $1,300 purchases.
Charm is the wild card: a small pocket or keychain device whose only job is to give you Muse. Meta is aiming for December and hasn't said what it will cost, so our pricing is an estimate.
Hardware | 2026E | 2027E | 2028E | 2029E | 2030E |
|---|---|---|---|---|---|
Everyday glasses sold | 10.0M | 20.7M | 33.0M | 49.5M | 70.0M |
Premium headsets sold | 0.0M | 1.2M | 2.8M | 5.0M | 8.0M |
Headset revenue per unit | n/a | $1,100 | $1,050 | $995 | $950 |
Charm units sold | 0.15M | 2.0M | 5.0M | 9.0M | 14.0M |
Charm revenue per unit | $160 | $160 | $150 | $140 | $135 |
The 2030 glasses figure breaks down into 45 million camera pairs, 17 million audio pairs and 8 million with displays. For context, Meta's manufacturing partner sold more than seven million AI glasses in 2025. That tells you the category is real. It doesn't tell you it will be ten times bigger, and that's what we're assuming. We also assume the new headset eats into the old one, with a quarter of premium sales replacing $250 each of Quest revenue.
Add it all up and Reality Labs, the division that makes this hardware, brings in $19.37 billion in 2030: $9.18 billion from glasses, $7.60 billion from the premium headset, $1.89 billion from Charm and $0.70 billion from what remains of Quest.
One person, four devices, one customer
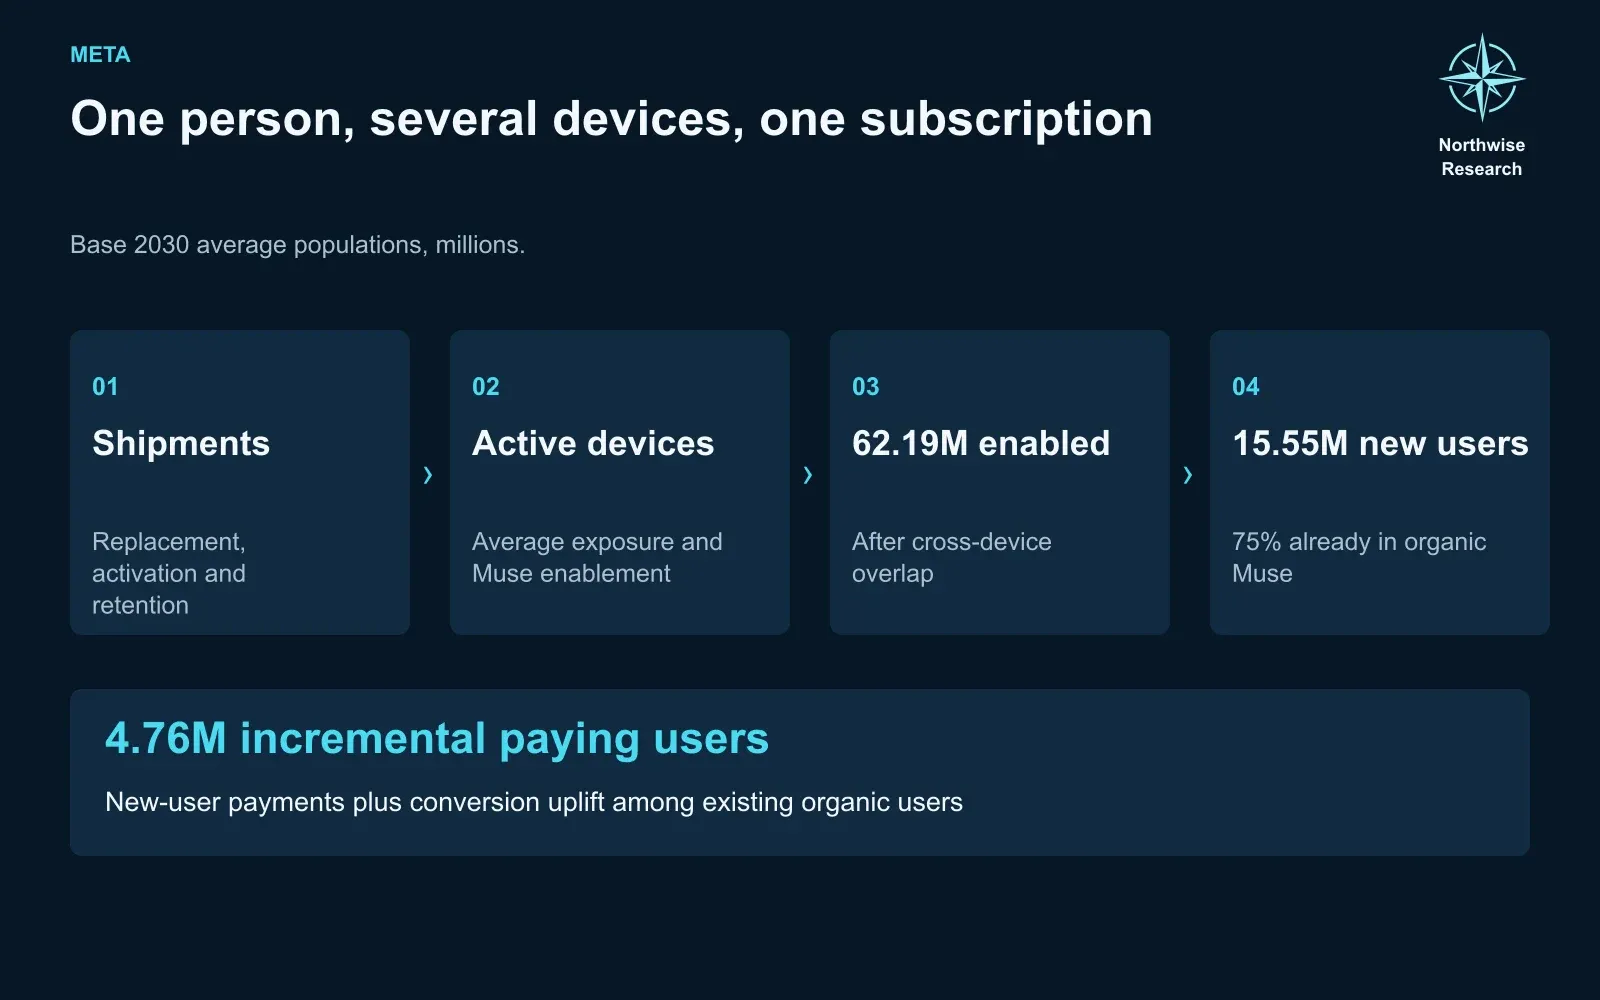
The same person may use Muse on a phone, in WhatsApp and through several devices. We count that person once.
So we don't treat every device as a new subscriber. We follow each batch of devices from shipment through activation and retention, and then assume 75% of those users were already Muse users anyway. The device only gets credit for nudging a few more of them into paying. On those rules, devices add 4.76 million paying subscribers by 2030, a useful boost rather than a second business.
The free tier matters more than the gadget
Running an agent costs money every month. We assume that by 2030 Meta spends about $5 a month to serve a standard subscriber, $26 for a premium subscriber and $0.18 for a free user, plus payment and distribution costs and extra expense for heavy voice use.
Eighteen cents sounds like nothing. Multiply it by roughly 660.9 million people using Muse for free in 2030 and it becomes one of the most important numbers in the consumer business. If free users cost just $1 more a month than we assume, Meta spends an extra $7.93 billion a year.
Including device users, we model 715.55 million active users and 54.69 million subscribers in 2030. If Charm never ships, earnings fall by $0.23 a share to $57.21. An extra dollar of monthly cost for free users reduces earnings by $2.71 to $54.73. Serving costs deserve much more attention than the contribution of one device.
Hardware is still hardware
We expect the premium headset's product margin to climb from 12% in 2027 to 26% in 2030, and Charm's from 15% to 32%. That's before paying the engineers, the designers, the support teams and the depreciation. After all of that, Reality Labs still loses $16.26 billion in 2030, and it loses money in every scenario we model.
New devices and subscriptions add about $18.83 billion to our 2030 revenue forecast but only about $1 billion to free cash flow. Manufacturing, inventory, support, staff and additional servers absorb most of the difference.
Who pays for all of this
Legal settlements, infrastructure and compensation each affect cash flow differently.
Bill one: the lawyers
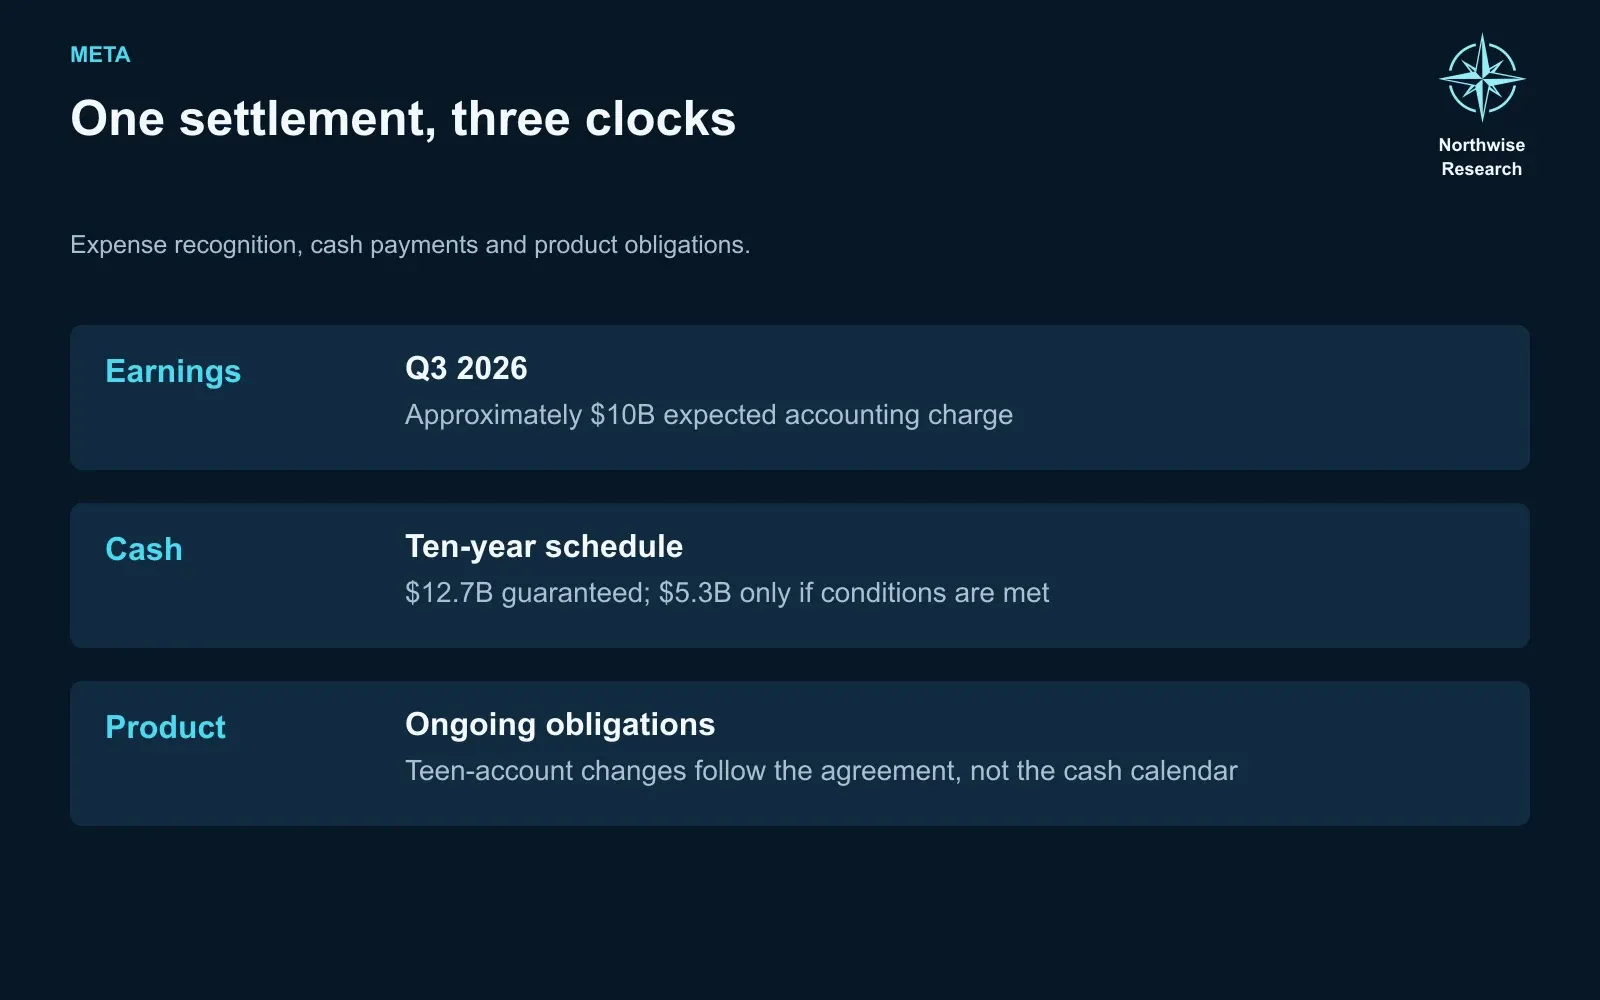
In August, Meta settled a large set of claims tied to how its apps treat young users. The headline numbers were confusing, and plenty of coverage added them together when it shouldn't have. There were roughly $12.7 billion of guaranteed payments and $5.3 billion of conditional payments spread over ten years, plus an expected $10 billion accounting charge in the third quarter. Those figures describe different pieces of one agreement, not three separate costs. Meta settlement announcement.
The practical translation: the charge hits reported earnings this year, and the cash goes out slowly. Our 2026 forecast includes $12.4 billion of major legal charges across the second and third quarters. We have Meta paying about $1.80 billion in cash in the second half of 2026 and about $1.27 billion a year from 2027 through 2030. We model the conditional payments as a separate possibility and keep a scenario for an entirely new legal problem, because this settlement closes one chapter, not the whole book.
The agreement also changes the product. Covered teenage users get default time limits and overnight restrictions, though direct messages are excluded. We estimate that trims US and Canada ad revenue by 0.48% in 2027. That's a rounding error for the business and a meaningful moment for the company's relationship with regulators.
The settlement makes part of the legal cost more predictable. Other legal exposure remains.
Bill two: the servers
AI runs on chips, power, networking and buildings, and Meta is buying all of it three ways at once. It owns data centers, which gives it control and potentially lower costs over time. It signs leases, which spread the funding out. And it rents cloud capacity from other companies, which is expensive but available now instead of in three years. Management has said its recent cloud deals are about near-term needs and admitted the picture beyond 2027 is less certain.
Rented capacity can meet demand before owned data centers are ready. The return depends on whether the workloads generate enough revenue to cover that cost.
The filings are enormous. As of June 30, Meta had $225.72 billion of property and equipment on its books, $278.99 billion of leases signed but not yet started, about $68 billion more signed in July, and $349.31 billion of purchase commitments it can't cancel. Some commentators stack all of those on top of each other and conclude Meta has committed to a trillion dollars of new obligations. That counts the same data center two or three times. What matters is the spending schedule.
Capital spending | 2026E | 2027E | 2028E | 2029E | 2030E |
|---|---|---|---|---|---|
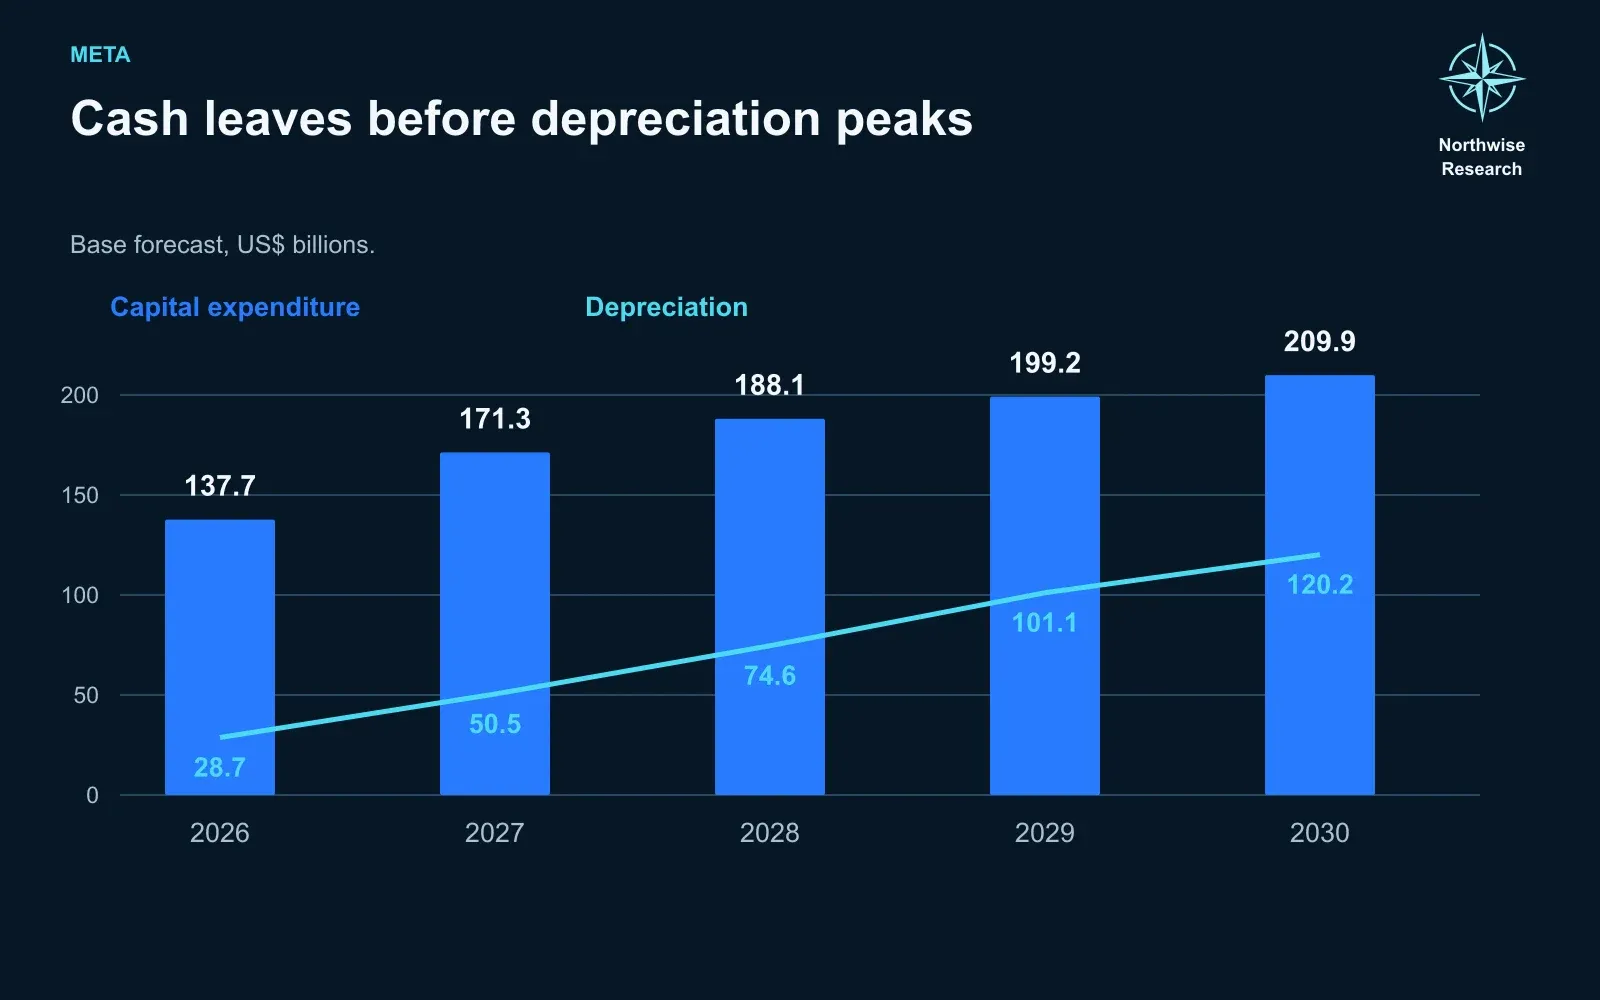
Capex, incl. finance-lease principal | $137.70B | $171.28B | $188.11B | $199.20B | $209.94B |
Depreciation | $28.75B | $50.49B | $74.64B | $101.14B | $120.18B |
Construction in progress, year-end | $80.45B | $96.35B | $108.18B | $116.09B | $122.76B |
Property and equipment, year-end | $300.11B | $425.58B | $543.52B | $644.40B | $735.93B |
That's $906.23 billion over five years. But the row to stare at is depreciation, which more than quadruples. That is the profit squeeze in a single line. Meta pays cash for servers today, the accountants spread that cost over the next five and a half years, and the charges pile up on top of each other as each year's purchases arrive. Profit can't keep up with revenue until that pile stops growing so fast, with operating margins bottoming in 2028 before recovering in 2029.
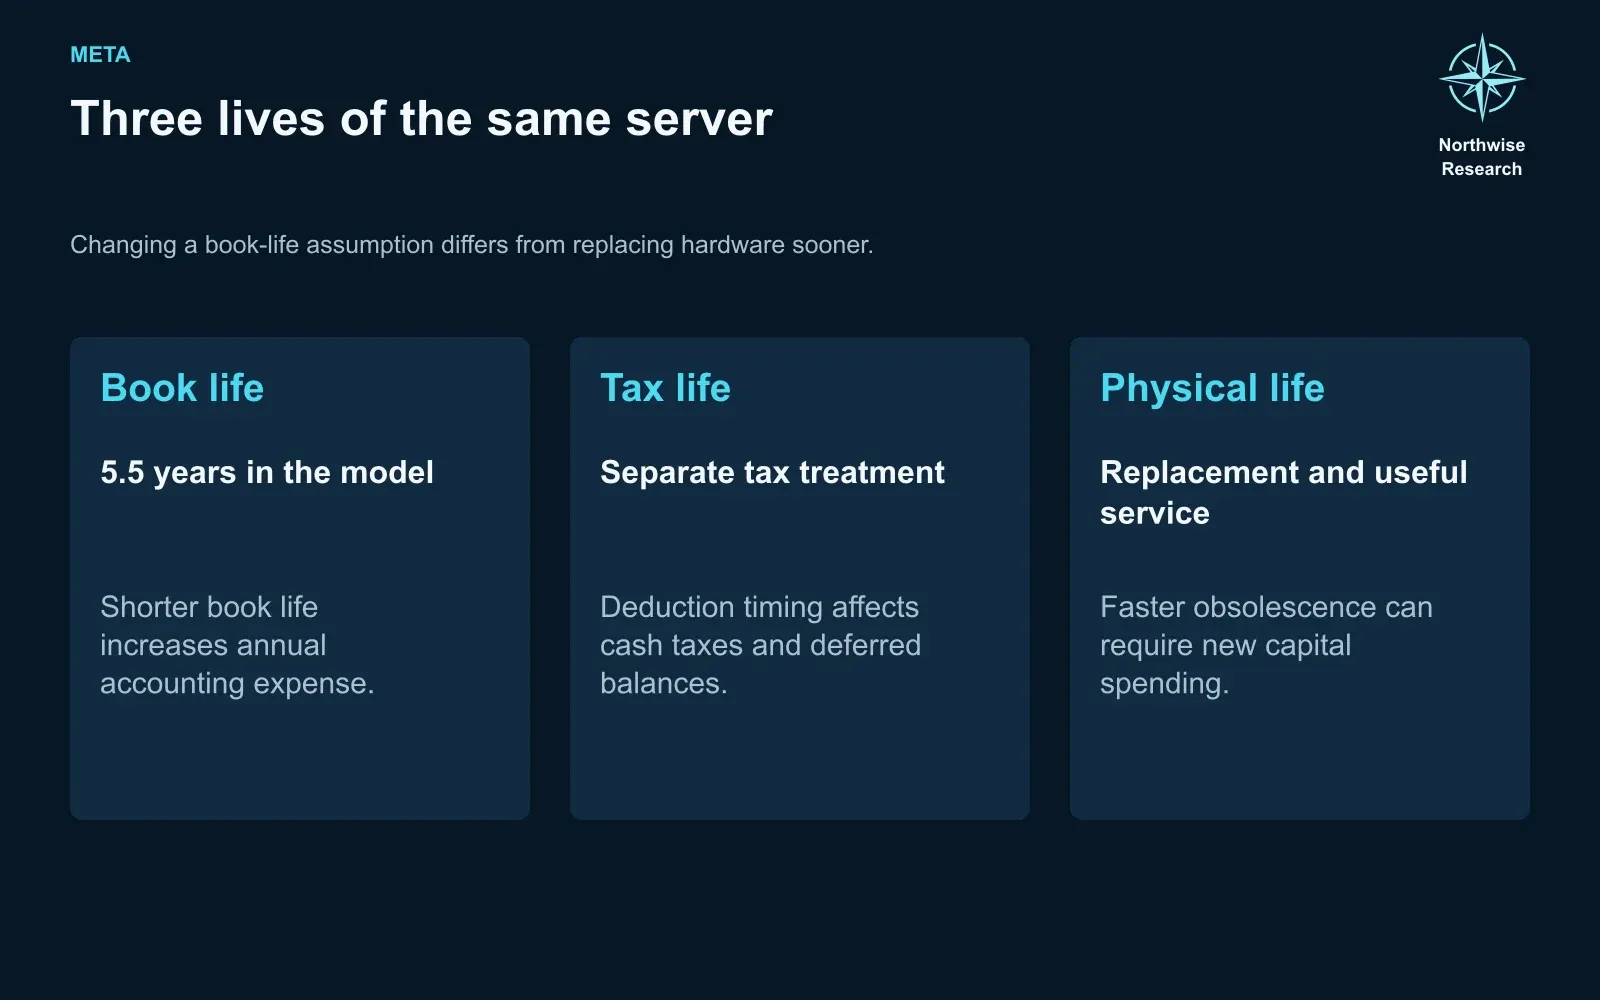
We depreciate servers over 5.5 years. A shorter accounting life would recognize expense sooner. Faster physical replacement would require additional capital spending. The distinction matters when assessing the risk to cash flow.
This is the risk that bites hardest. If core infrastructure spending runs 20% above our plan, 2030 earnings fall to $49.34 a share and free cash flow nearly halves, to $52.49 billion. In the scenarios carrying about 7.46% of our probability weight, that bigger plan can't be funded within sensible borrowing limits. That doesn't mean Meta goes broke. It means management would be forced to slow down, and in real life it would.
Bill three: the people
AI might make engineers more productive. It hasn't made the people who build AI cheap.
We expect Meta's cash pay to rise from $36.06 billion in 2026 to $50.67 billion in 2030. Stock-based pay peaks at $45.10 billion in 2028 before easing to $41.25 billion. Meta also has about $79.79 billion of stock awards already granted that will flow through earnings in the years ahead.
Stock pay is where Meta's story has changed most for shareholders. For years, the company bought back so much stock that the share count fell steadily, and investors came to treat that as a law of nature. It isn't. When an employee's shares vest, Meta typically holds back some of them and pays the employee's tax bill in cash. That cash payment reaches $33.58 billion in 2029. It keeps new shares off the market, but it's not the same as a buyback, and it uses up cash that would otherwise go to shareholders.
With the build-out consuming most of the cash, buybacks pause. In our Base case the diluted share count rises, to about 2.69 billion in 2029, before easing to 2.68 billion in 2030. The shrinking-share-count tailwind that powered Meta's earnings per share for years is gone until the spending slows down.
Putting it all together
Our Base case produces a larger business, with margins recovering only after several years of pressure.
Revenue | 2026E | 2027E | 2028E | 2029E | 2030E |
|---|---|---|---|---|---|
Advertising | $245.24B | $291.49B | $343.63B | $400.40B | $459.31B |
Paid messaging | $3.18B | $4.77B | $6.68B | $8.68B | $10.85B |
Meta One | $1.60B | $2.77B | $5.16B | $8.58B | $12.83B |
Business-agent usage | $0.12B | $0.90B | $2.93B | $6.30B | $11.40B |
Personal Muse | $0.05B | $2.24B | $6.08B | $10.70B | $16.81B |
Developer APIs | $0.12B | $1.35B | $3.64B | $6.33B | $9.00B |
Reality Labs | $2.21B | $4.83B | $8.28B | $13.06B | $19.37B |
Total revenue | $252.52B | $308.34B | $376.39B | $454.05B | $539.55B |
Revenue compounds at about 20.9% a year, and even after all the new products, advertising is still about 85% of the total in 2030. Anyone pitching Meta as a subscription company is getting ahead of the numbers. What we're forecasting is a much larger ad business with several meaningful side businesses attached.
Income statement | 2026E | 2027E | 2028E | 2029E | 2030E |
|---|---|---|---|---|---|
Revenue | $252.52B | $308.34B | $376.39B | $454.05B | $539.55B |
Cash compensation | $(36.06)B | $(39.41)B | $(42.44)B | $(46.48)B | $(50.67)B |
Stock compensation | $(31.81)B | $(39.70)B | $(45.10)B | $(45.05)B | $(41.25)B |
Data center operations | $(7.50)B | $(10.26)B | $(13.71)B | $(17.17)B | $(20.00)B |
Rent | $(5.50)B | $(8.00)B | $(11.50)B | $(15.00)B | $(18.00)B |
Third-party cloud | $(24.00)B | $(34.00)B | $(37.00)B | $(38.00)B | $(38.00)B |
App product costs | $(0.71)B | $(3.18)B | $(7.17)B | $(11.63)B | $(16.58)B |
Other Reality Labs costs | $(10.63)B | $(12.51)B | $(14.63)B | $(17.54)B | $(21.47)B |
Other operating costs | $(18.61)B | $(20.66)B | $(22.80)B | $(24.97)B | $(27.08)B |
Depreciation | $(28.75)B | $(50.49)B | $(74.64)B | $(101.14)B | $(120.18)B |
Legal and severance charges | $(13.58)B | n/a | n/a | n/a | n/a |
Operating income | $75.38B | $90.12B | $107.40B | $137.08B | $186.33B |
Operating margin | 29.8% | 29.2% | 28.5% | 30.2% | 34.5% |
Interest and other | $(1.32)B | $(2.38)B | $(3.93)B | $(3.62)B | $(2.62)B |
Income tax | $(4.05)B | $(14.04)B | $(16.56)B | $(21.35)B | $(29.39)B |
Net income | $70.00B | $73.70B | $86.92B | $112.10B | $154.32B |
Earnings per share | $27.22 | $28.23 | $32.76 | $41.81 | $57.44 |
Operating margin falls to 28.5% in 2028 before recovering. Earnings per share barely change from 2026 to 2027. Excluding the specified one-off charges and tax effects, 2026 earnings would be $29.30 a share, slightly above the 2027 forecast.
The core apps generate about $202.58 billion of operating profit in 2030. They continue to finance the consumer businesses.
Where the cash goes
Cash flow | 2026E | 2027E | 2028E | 2029E | 2030E |
|---|---|---|---|---|---|
Operating cash flow | $131.28B | $161.66B | $202.83B | $252.72B | $308.61B |
Capex, incl. finance-lease principal | $(137.70)B | $(171.28)B | $(188.11)B | $(199.20)B | $(209.94)B |
Free cash flow | $(6.42)B | $(9.61)B | $14.73B | $53.52B | $98.67B |
Employee stock taxes paid | $(16.65)B | $(21.45)B | $(28.31)B | $(33.58)B | $(28.85)B |
Dividends | $(5.38)B | $(5.58)B | $(5.84)B | $(6.09)B | $(6.32)B |
Investments and acquisitions | $(5.66)B | $(5.00)B | $(5.00)B | $(4.00)B | $(3.00)B |
Restricted cash released | $0.00B | $0.00B | $3.60B | $3.60B | $3.60B |
New borrowing | $24.91B | $37.36B | $23.33B | $0.00B | $0.00B |
Debt repaid | $0.00B | $(2.75)B | $(1.50)B | $(3.85)B | $(19.94)B |
Share buybacks | $0.00B | $0.00B | $0.00B | $(6.84)B | $(35.85)B |
Debt, year-end | $83.66B | $118.27B | $140.11B | $136.26B | $116.32B |
Cash and securities, year-end | $58.04B | $51.00B | $52.02B | $54.77B | $63.08B |
The cash-flow forecast shows why the timing of the return matters.
For two years, Meta spends more than it makes, and borrows to cover the gap and keep paying its dividend. Debt climbs to $140 billion by 2028 at an assumed 5.8% on new bonds. Buybacks disappear until 2029. For shareholders who owned Meta for its relentless buybacks, that's a different company.
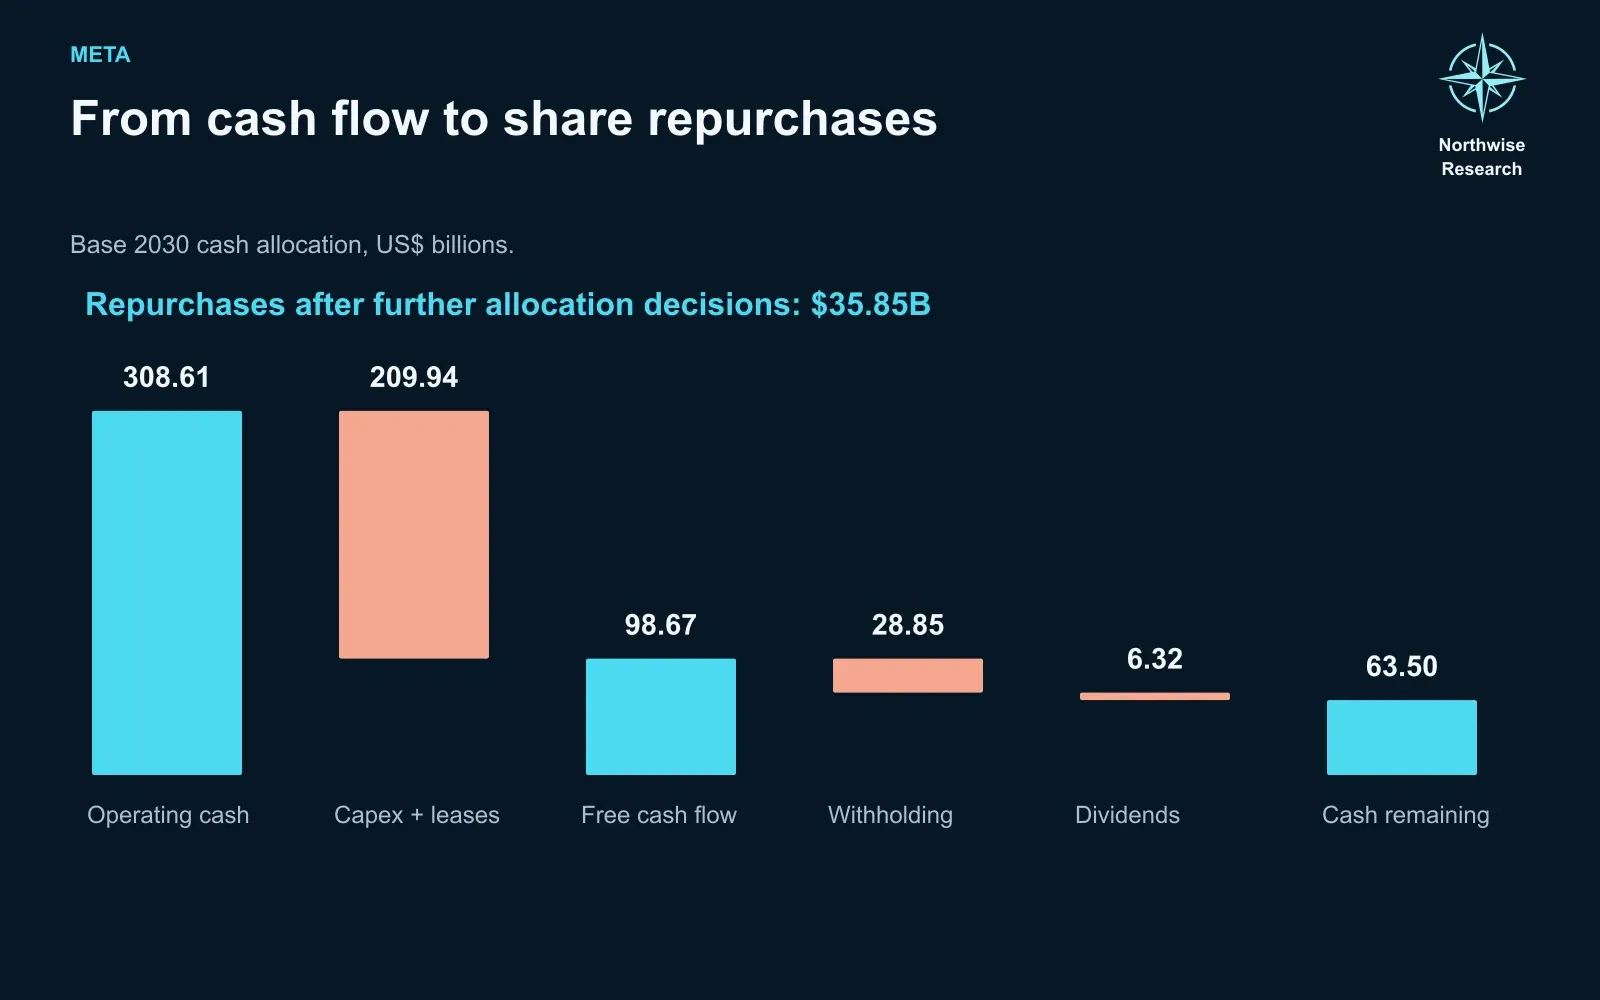
Then the build-out matures and the cash comes roaring back. By 2030, free cash flow is nearly $100 billion, debt is falling and Meta is buying back $35.85 billion of stock again. Even then, walk the 2030 cash down the page: $308.61 billion from operations becomes $98.67 billion after capex, and $63.50 billion after employee stock taxes and the dividend. That residual is about a fifth of operating cash flow, and it still has to cover investment contributions, debt repayment and retained liquidity. Repurchases come to $35.85 billion after those decisions.
How it goes wrong without anything collapsing
The bear case for Meta doesn't need Instagram to die. It just needs a few things to go a bit worse at the same time: smaller AI gains in advertising, slower paid adoption, less efficient data centers, an ad recession and another big legal bill. In that world, Meta also cuts its spending as the opportunity shrinks.
Bear case | 2026E | 2027E | 2028E | 2029E | 2030E |
|---|---|---|---|---|---|
Revenue | $252.46B | $269.65B | $305.03B | $343.77B | $382.08B |
Operating income | $75.37B | $55.70B | $30.22B | $50.67B | $66.18B |
Earnings per share | $27.21 | $17.03 | $7.21 | $13.77 | $18.39 |
Free cash flow | $(6.42)B | $(29.91)B | $(14.21)B | $13.76B | $40.66B |
Debt, year-end | $83.66B | $135.99B | $181.21B | $200.50B | $193.83B |
Diluted shares, year-end | 2.5872B | 2.6237B | 2.6625B | 2.6944B | 2.7175B |
The Bear case includes a hypothetical $20 billion legal charge in 2028. Excluding it, earnings that year would be $14.17 a share. Revenue grows about 51% over the forecast period, but earnings per share finish below their starting point.
How it goes right, and why that's expensive too
In the bull case, the ad gains are stronger, subscribers sign up faster and the data centers run more efficiently. Meta responds by spending even more, because the opportunity is bigger, and it ends up paying the conditional settlement installments too.
Bull case | 2026E | 2027E | 2028E | 2029E | 2030E |
|---|---|---|---|---|---|
Revenue | $252.64B | $329.99B | $429.21B | $548.53B | $688.00B |
Operating income | $75.41B | $102.96B | $133.06B | $192.12B | $273.05B |
Earnings per share | $27.23 | $32.24 | $40.32 | $58.32 | $83.52 |
Free cash flow | $(6.43)B | $(15.52)B | $2.42B | $45.01B | $106.70B |
Debt, year-end | $83.66B | $126.08B | $164.73B | $169.56B | $150.36B |
Diluted shares, year-end | 2.5872B | 2.6407B | 2.6775B | 2.6999B | 2.6973B |
Bull-case net income in 2030 is about 46% above Base, while free cash flow is only 8% higher. Capital spending reaches $290.34 billion that year. Stronger demand brings a larger investment requirement.
Why we don't just pick one future
The bear and bull cases are illustrations, not predictions. To get to a value, we ran 432 different combinations of seven factors: internal AI gains, business adoption, consumer adoption, infrastructure efficiency, an ad recession, a new legal event and conditional settlement payments.
The drivers are linked in the way you'd expect. If the core AI turns out strong, both businesses and consumers are more likely to adopt the paid products, but they don't have to move in lockstep.
If AI gains are... | Chance | Business adoption: slow / solid / rapid | Consumer adoption: slow / solid / rapid | Chance of efficient data centers |
|---|---|---|---|---|
Limited | 20% | 60% / 32% / 8% | 60% / 32% / 8% | 45% |
Sustained | 50% | 25% / 50% / 25% | 25% / 50% / 25% | 70% |
Strong | 30% | 10% / 40% / 50% | 10% / 40% / 50% | 85% |
On top of that we give a 25% chance to an ad recession, 12% to another major legal event and 30% to the conditional settlement payments being triggered. These are judgment calls, and we'd rather show them than hide them.
Each combination runs through the whole financial model before we decide what to call it. If earnings grow less than 10% a year, or free cash flow after stock pay turns negative, it's a bear outcome. If earnings grow more than 20% a year with healthy cash flow, good returns on new spending and manageable debt, it's a bull outcome. Everything in between is Base. The final split is 21.18% bear, 43.10% base and 35.72% bull.
The balance favors better outcomes, but the probabilities remain our judgments.
What would change our mind
The most useful evidence will come from advertiser returns, paid retention and the cost of serving demand.
We will track four areas.
First and most important, the price per ad, region by region. A strong consolidated growth number can hide a weakening mix underneath it. If North American pricing keeps climbing while Meta shows more ads, the machine is still getting better, and nothing else in this report matters as much.
For Muse, we want to see who keeps paying. Downloads prove curiosity. Renewals, the share of subscribers on the $100 tier and what it costs Meta to finish a useful task will tell us whether this is a business.
For hardware, we'll ignore preorders and watch units actually delivered, returns and how many people are still wearing the things six months later. We'll also be waiting on Charm's price and how quickly Meta can make it.
And for the company as a whole, we'll be tracking whether new data center capacity starts showing up as profit, and how fast. Meta is heading toward more than $700 billion of property and equipment. That pile has to earn its keep.
We're positive on Meta because it has more ways to turn better AI into money than almost anyone, and the biggest of them already works at a scale nobody else can match. We're less willing to assume every new product earns software margins, that the build-out pays for itself without strain, or that the share count will go back to shrinking on its own.
The customer is already here. The question is how much Meta can earn by serving her better, and how much of that ends up with each share.
Keep reading with Northwise Premium
Continue to the valuation, scenario returns and entry-price analysis.
What is Meta stock worth, and what should you pay for it today?
Premium includes the DCF, earnings valuation, sensitivity analysis and editable workbook. We calculate returns from the October 8 close and show the entry price that meets our 20% annual hurdle.
Unlock the full valuation and our entry price with Northwise Premium.
Northwise Premium
Choose how to continue with Northwise
Join Northwise Premium
Unlock the rest of this report, its complete valuation, the downloadable model, portfolios, and action framework.
Join Northwise PremiumCreate a Free Account
Continue across Free Northwise research, follow companies, save reports, and receive updates.
Create a Free Account
Meta Stock Forecast 2030
A long-term Meta stock forecast 2030 analyzing ad monetization, AI-driven margin expansion, scenario valuations, price targets & buy zones.

IREN Stock Dilution: Can the Build Reach Shareholders?
IREN stock analysis of AI growth, funding and dilution through 2030. Read our full valuation, 27 scenarios and price zones free. Excel model is Premium.

SoFi Stock Analysis: The Bank Behind the Everything App
Our SoFi stock analysis tests lending, deposits, credit losses and dilution across 162 scenarios, with a detailed valuation and editable investment model.
Northwise Portfolios
See how the research becomes real decisions
Reader discussion
Discuss the research
Premium access is required to join this report's discussion.
Join Northwise Premium
No comments yet. Start a thoughtful discussion.