SoFi Stock Analysis: The Bank Behind the Everything App

Our SoFi stock analysis tests lending, deposits, credit losses and dilution across 162 scenarios, with a detailed valuation and editable investment model.
In this article
The stock has been cut in half during SoFi's best operating year. We rebuilt the bank one loan at a time to find out whether the market sees something the income statement hides.
Start with the offer that confuses everyone.
For $10 a month, SoFi Plus members earn a higher rate on their savings and a match on the money they invest. For anyone with a decent savings balance, the extra interest alone can be worth more than the fee. Anyone who owns the stock is left with an awkward question: why would a company pay people to be its customers?
There are two ways to answer, and they map neatly onto the two ways Wall Street sees SoFi.
If you think SoFi is a technology platform, the answer is customer acquisition. Win the savings account cheaply, and you get first shot at the credit card, the brokerage account, the personal loan, and eventually the mortgage. Selling another product to an existing customer can cost less than acquiring a new one. This camp points to 15.8 million members, stablecoin payments running over Mastercard's network, a growing set of AI tools, and a bank charter that lets SoFi fund itself with customer deposits.
If you think SoFi is a lender in a nice jacket, the answer is darker. A company that pays up for deposits and loyalty needs cheap money for a loan book that has never faced a real recession at its current size. This camp points to profits that lean on selling loans, fair value accounting that can flatter results, and a short seller who made exactly that case in March.
The $15.93 reference price used in this report is about 51% below its $32.73 52-week high. SoFi is in a year of record revenue and record loan volume, and it added 1.1 million members in a single quarter. That disconnect is the starting point for our SoFi stock analysis.
We think the label fight is mostly a distraction. Banks can grow fast, and apps do nothing to stop borrowers from defaulting. SoFi's value comes down to one test. The relationship it pays to win has to earn more than it costs, once you count the perks, the loan losses, the price of deposits, and the equity a bank must hold against everything it owns.
You can't settle that from the income statement, so we built SoFi from the loan up. Our model follows every quarter's loans from origination until they are repaid, written off, or partly recovered. It prices each dollar of deposits by where it came from. It holds capital at both the bank and the parent company and traces every stock award from grant to vesting. Then it runs the whole business through 162 combinations of economy, customer adoption, and credit timing.
In our Base case, SoFi reaches about 43 million members by 2030 and earns $4.42 billion of net income on $14.14 billion of revenue. That works out to $2.90 per share. That reference price is roughly 27 times our 2026 earnings estimate and 5.5 times that 2030 figure.
Both multiples can be true at once. SoFi looks expensive on what it earns today and cheap on what it could earn in four years. The price implies the market expects something to go wrong in between. The likeliest culprits are credit losses, deposit costs, share dilution, or the bill for all those customer perks, and those are where we spent our time.
We came out constructive, with conditions attached.
For the earlier valuation framework, see our SoFi stock forecast 2030. Our SoFi Q4 2025 earnings preview records the questions we were watching before that call. This report develops the current investment case through credit, funding, customer economics and ownership.
How the Machine Works
Almost every argument about SoFi is really an argument about one part of its engine, so it helps to see the whole thing before taking it apart.
The engine starts with a cheap front door. Savings accounts, direct deposit, investing, and free credit monitoring bring people into the app without SoFi having to catch them at the one moment they need to borrow. These products earn modest income on their own. Their bigger job is to put SoFi first in line when the member eventually wants a loan.
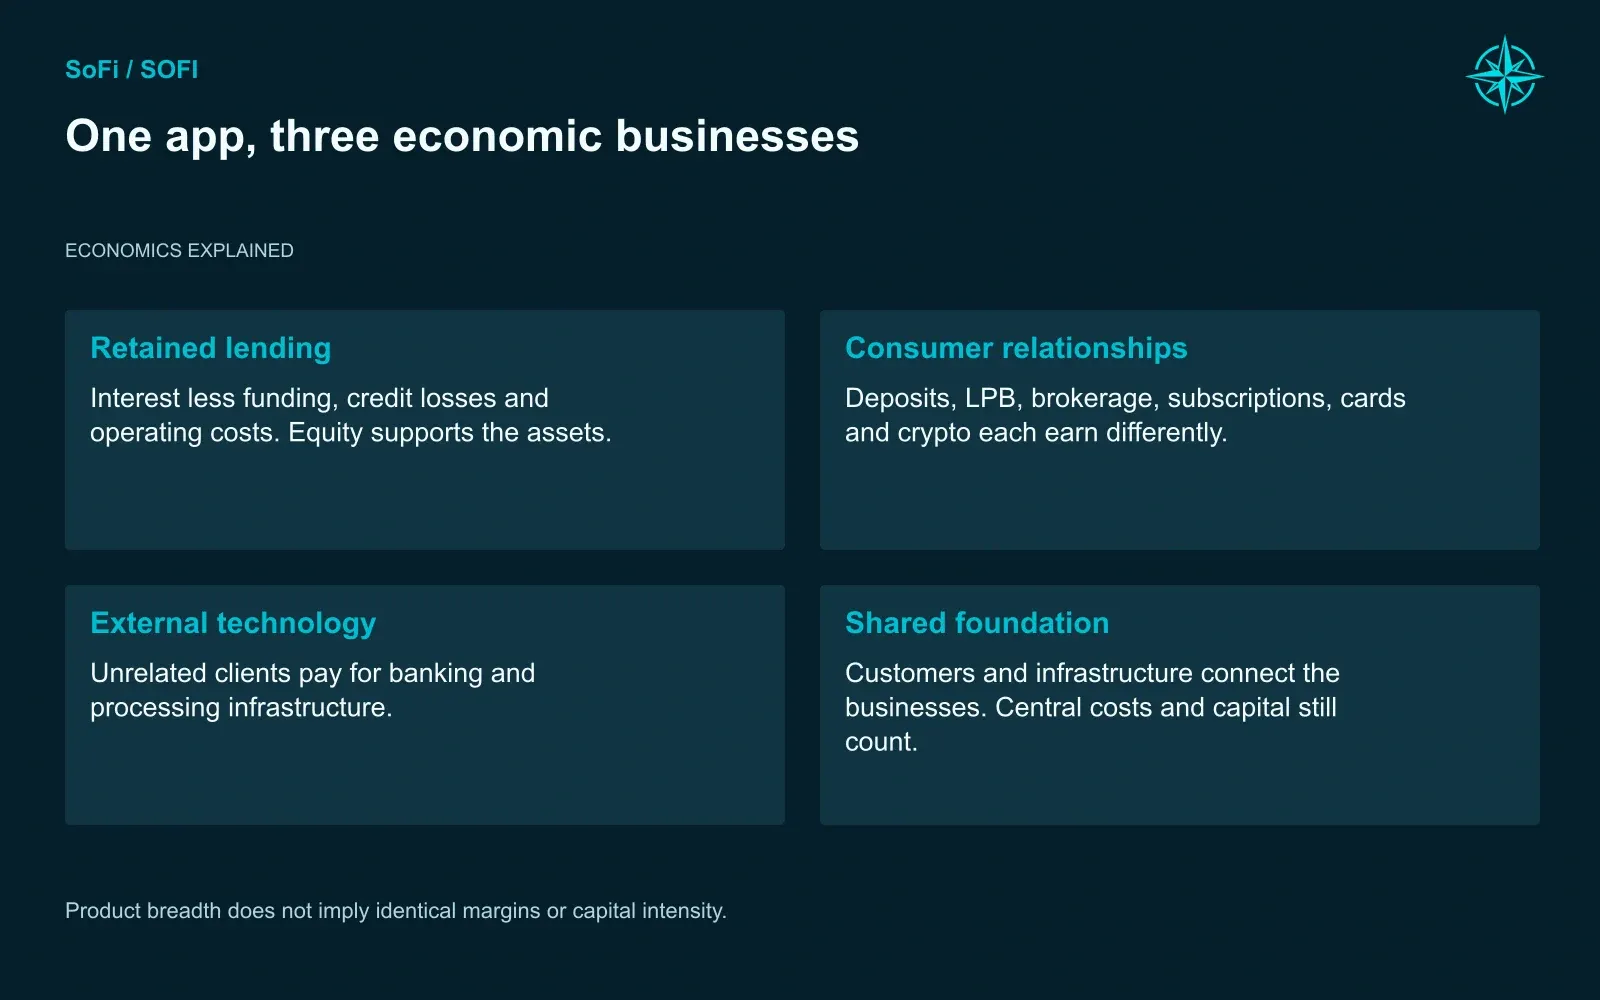
Product breadth does not imply identical margins or capital intensity.
Lending is where the money is made. When SoFi approves a personal loan, it reaches a fork. It can keep the loan, fund it with deposits, and collect interest for years. Or it can sell the loan to an outside investor, usually a private credit fund, take a fee up front, and get paid to keep servicing it. SoFi calls the second path its Loan Platform Business, or LPB.
Management's own figures show why keeping loans is tempting. A typical second-quarter personal loan carried a 12.9% interest rate. Funding it cost about 3.1%, and losses ran around 3.7% a year. That leaves roughly 6.1% before marketing, servicing, overhead, and taxes, which is a fat spread by any bank's standards.
The constraint is equity. Regulators require a bank to back every loan it keeps with a slice of shareholders' capital, and a fast-growing bank never has enough of it. Selling a loan trades potential future spread for earlier fees and lower balance-sheet needs. Which path earns more depends on funding, credit losses, partner pricing and required equity. Distribution lets SoFi serve more borrowers than its own balance sheet could carry.
That is the whole machine: a cheap front door, a lending engine, a keep-or-sell decision, deposits to fund what stays, and equity rationing all of it. Each section that follows asks how well one of those parts works and what happens when it gets more expensive.
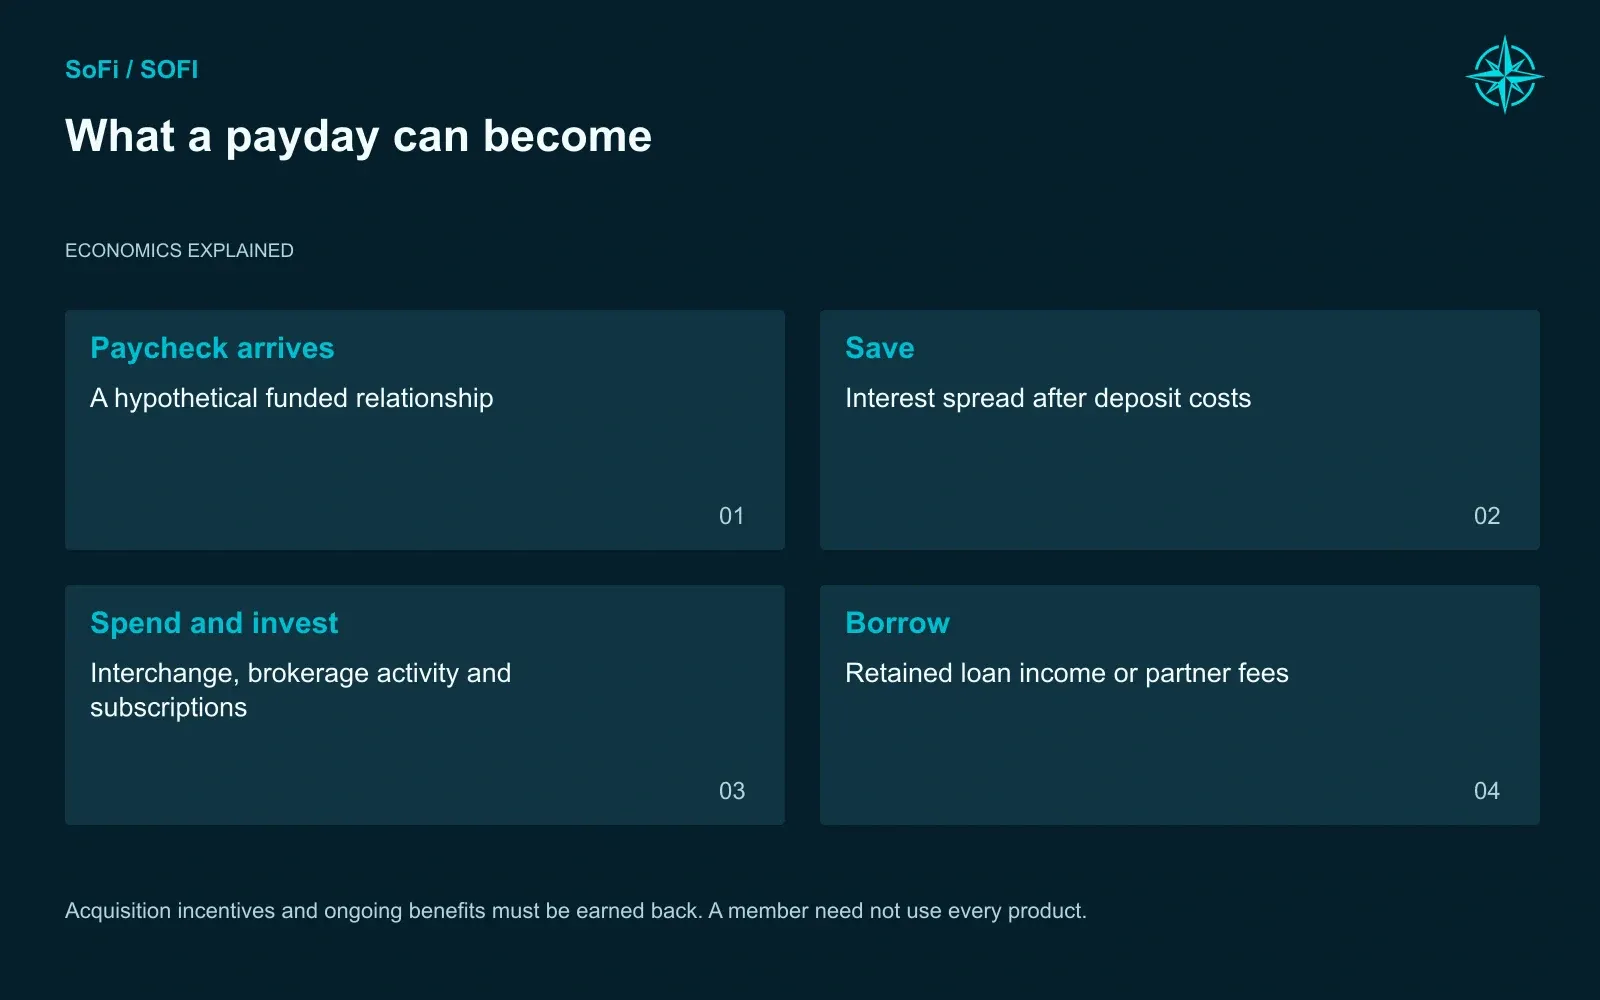
Acquisition incentives and ongoing benefits must be earned back. A member need not use every product.
A Record Quarter the Market Shrugged At
On paper, the second quarter should have ended the debate. SoFi reported $1.206 billion of adjusted revenue, $358 million of adjusted EBITDA, and $157 million of GAAP net income on about $14.8 billion of new loans. It was the best quarter in the company's history.
One layer down, the skeptics found what they were looking for. Revenue grew faster than profit, as marketing, product development, compensation, and taxes absorbed a large share of the new business. Management showed no sign of easing up on that spending.
We expect the second half to look similar, only bigger. Our full-year forecast is:
FY2026 forecast | Northwise | Management |
|---|---|---|
GAAP net revenue | $5.02 billion | n/a |
Adjusted net revenue | $4.99 billion | $4.75 to $4.85 billion |
Adjusted EBITDA | $1.64 billion | about $1.6 billion |
Net income | $798 million | n/a |
Adjusted net income | about $802 million | $825 million |
Our second half alone produces $2.70 billion of revenue and $474 million of profit. Our $4.99 billion adjusted revenue estimate puts us above management on a comparable basis, and slightly above it on EBITDA. After adding back the same items management adjusts for, we land below it on net income.
More revenue and a bit less profit is how we read SoFi's current posture. The company is choosing growth and paying for it. Our second half assumes a 34.9% EBITDA margin while expenses rise about 8.4% from the first half. That is real operating leverage without anyone freezing hiring. If SoFi misses it, the 2030 story runs into trouble long before 2030.
The Front Door Is Working
SoFi ended June with 15.8 million members holding 24.4 million products. The member count gets the headlines. The figure we care about more is where new products came from: existing members opened 51% of them in the second quarter, up from 35% a year earlier.
That jump means a growing share of SoFi's growth now comes from customers it already has. Selling a second product to someone already in the app can reduce acquisition costs, although the disclosed product counts do not quantify that saving. If the trend holds, acquisition costs should shrink relative to what each relationship earns. It is the strongest single piece of evidence for the platform camp.
It is also easy to oversell. SoFi counts anyone who has signed up for anything, from a loan to a free credit score, and members usually stay in the total unless they are removed. Plenty of them are barely active. The 51% figure describes where new products originated, which is different from how many members own several.
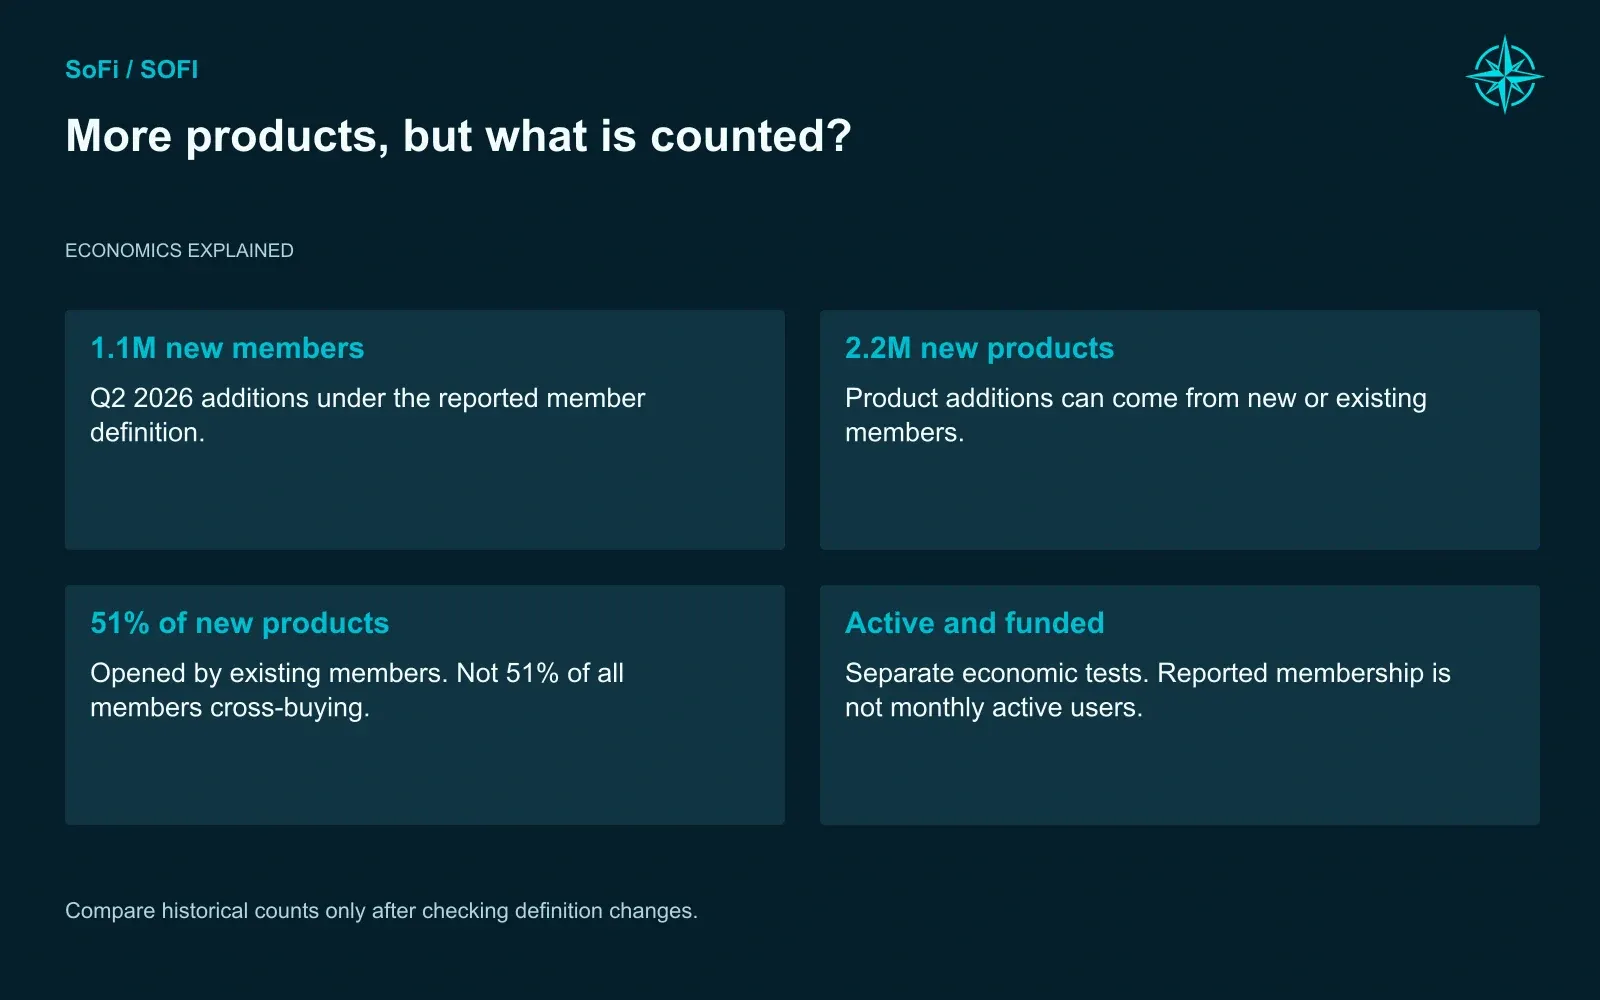
Compare historical counts only after checking definition changes.
Customers also owe SoFi no loyalty. Many people keep their paycheck at one bank, borrow from whoever quotes the lowest rate, and invest somewhere else entirely. SoFi has to make staying in one app worth more than the fraction of a point a customer could pick up by shopping around.
Our forecast therefore values what members do with their money, product by product:
- Deposits grow with funded balances.
- Investing grows with assets and contributions.
- Lending grows with approvals.
- Subscriptions grow with paying members and the perks they actually use.
Keeping these separate works as an early warning system. If members keep piling up while funded balances stall and incentive costs climb, SoFi is buying popularity. We would see it in the numbers well before the headline count turned.
Reported member and product definitions.
Keep It or Sell It
Personal loans remain the center of gravity. SoFi originated about $10.7 billion of them in the second quarter, and $3.1 billion of those went straight to LPB partners. The partner loans are already inside the $10.7 billion. Adding the two figures together, as some commentary does, invents growth that never happened.
We think the keep-or-sell decision is where SoFi's management earns or loses shareholders' money. A kept loan throws off that 6.1% spread year after year, with credit risk and a capital charge attached. A sold loan brings earlier fee income and frees capacity for the next borrower.
When loan demand outruns available capital, selling can be the better use of equity if partner fees compensate for the costs and obligations that remain. When deposits are cheap and capital is plentiful, SoFi should keep its best loans. A bank bragging about balance sheet growth and a platform bragging about partner volume can both be destroying value. We want to see SoFi choosing the higher return on each dollar of equity, one loan at a time.
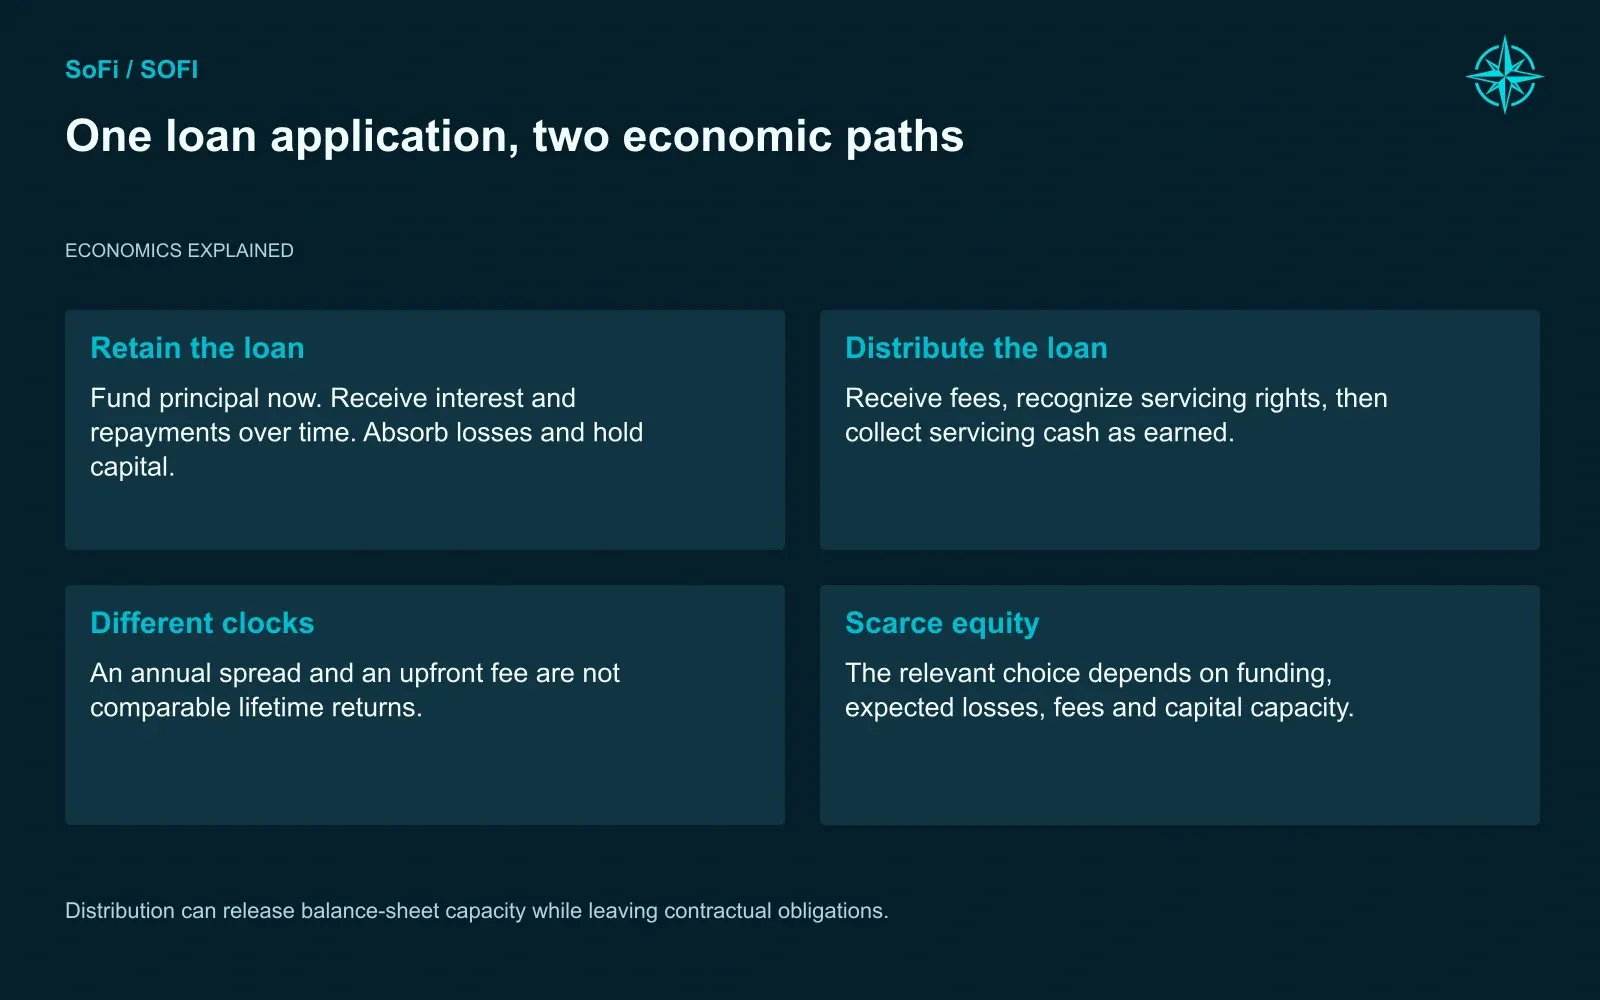
Distribution can release balance-sheet capacity while leaving contractual obligations.
Our Base case has SoFi relying more on the partner channel as it grows:
Personal loans | 2026 | 2030 |
|---|---|---|
Originations | $41 billion | $100.26 billion |
Sold through LPB | $55.80 billion | |
Kept on balance sheet | $44.45 billion |
By the end of 2030, SoFi owns about $62.45 billion of personal loans and services another $78.91 billion it has sold. Growth on that scale would be impossible to finance without partners.
The fees are where skeptics have a fair complaint. When SoFi sells a loan, part of the gain arrives as cash and part as a servicing asset, which is an accounting estimate of servicing income expected in future years. In one disclosed batch of second-quarter sales, SoFi booked $85.817 million of net fees and $21.427 million of servicing assets, for $107.244 million in total. About a fifth of those fees took the form of a servicing asset whose value depends on future collections.
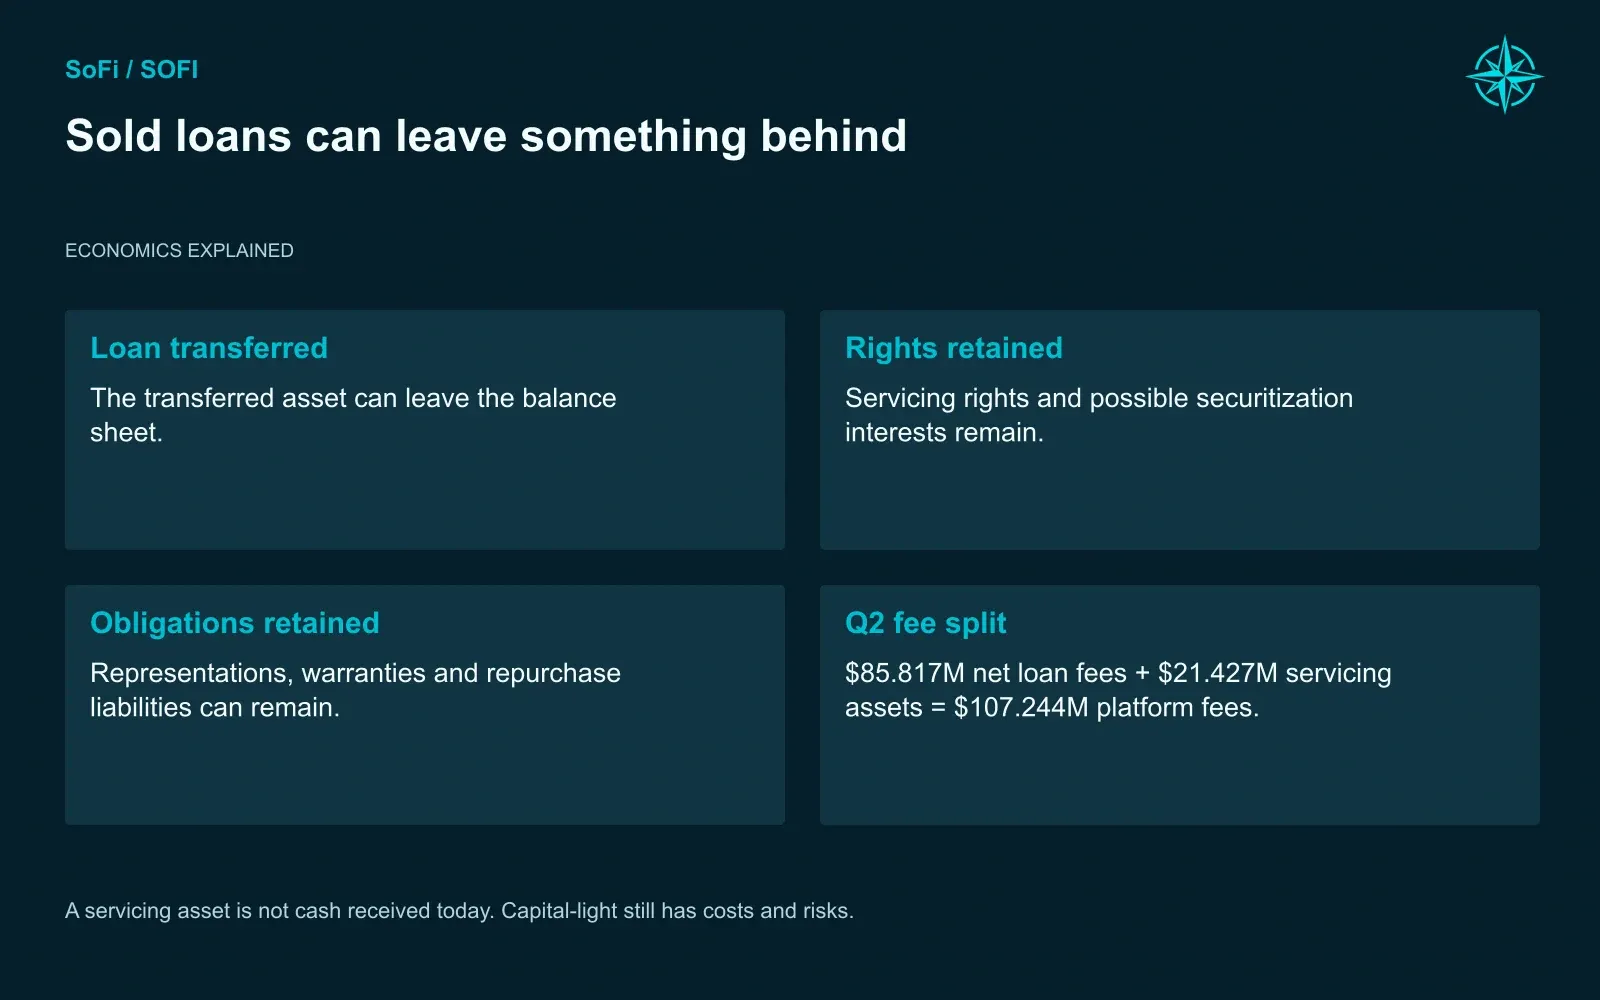
A servicing asset is not cash received today. Capital-light still has costs and risks.
Our model books the cash fee, 2.9% of principal sold, separately from the servicing asset, 0.7% of principal. It then collects servicing income only as it comes in. Those rates are our own assumptions, since SoFi doesn't disclose standard terms across partners.
For now, the buyers are there. Management said partner demand exceeded what SoFi chose to sell, and it announced three new arrangements:
- up to $1 billion of personal loan investment from Sixth Street
- a three-year, $3 billion small business program with BasePoint
- a new home equity partnership
Commitments are not revenue, though. A crowded private credit market will not pay today's prices forever.
The scale of the ambition is easy to lose track of. About $141 billion of owned and sold personal loans in 2030 would be roughly a third of the U.S. personal loan market. That assumes the $281 billion TransUnion counted in the second quarter grows 10% a year. The growth rate is our assumption and the comparison is rough. It still shows how large the ask is: our Base case needs SoFi to become one of the dominant names in consumer lending.
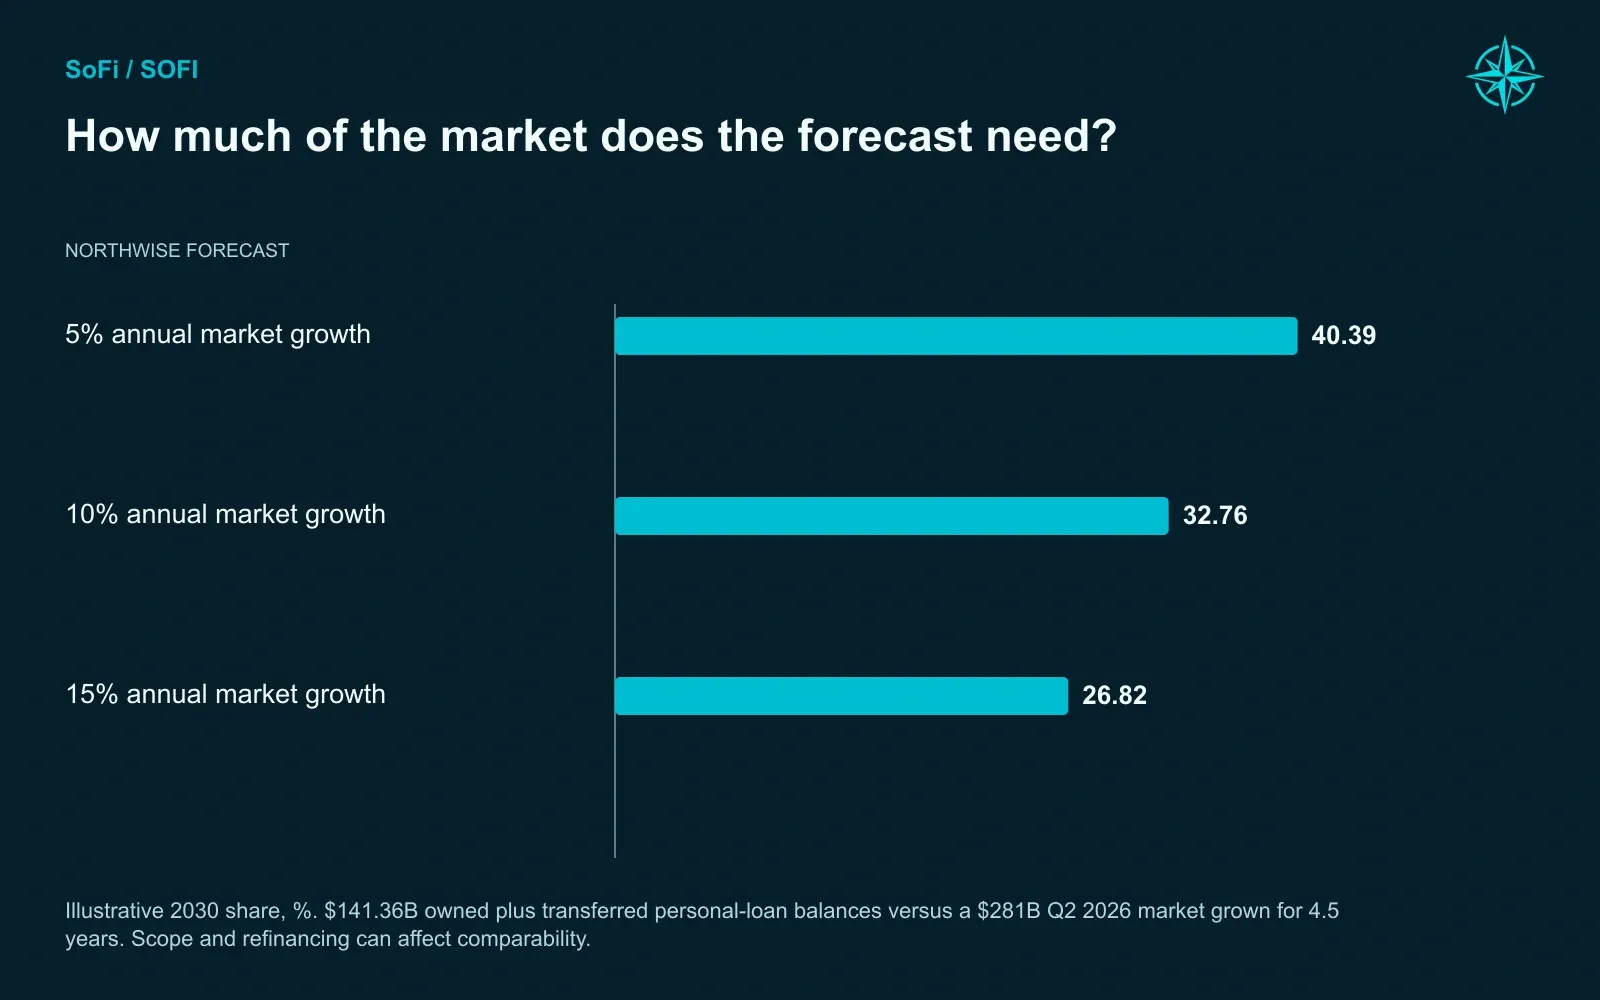
Illustrative 2030 share, %. $141.36B owned plus transferred personal-loan balances versus a $281B Q2 2026 market grown for 4.5 years. Scope and refinancing can affect comparability.
U.S. personal-loan market context.
The Credit Fight
Credit is where bulls and bears look at the same filing and see different companies. SoFi publishes three personal loan loss figures, and each side quotes the one it likes:
Personal loan loss measure | Rate |
|---|---|
Reported Q2 net charge-off rate | 2.62% |
Management's estimate without delinquent loan sales | about 3.7% |
Default assumption used to value loans still held | about 4.8% |
Bulls quote the 2.62%, and bears quote the 4.8% or add the three together. Both miss. The 2.62% is an accounting ratio improved by selling troubled loans before they are written off. The 3.7% is management's broader estimate of realized losses without the delinquent-loan-sale benefit; it remains dependent on the company's adjustment method. The 4.8% is a forward-looking estimate used to value the loans on the books, and stacking it on the others counts the same losses several times.
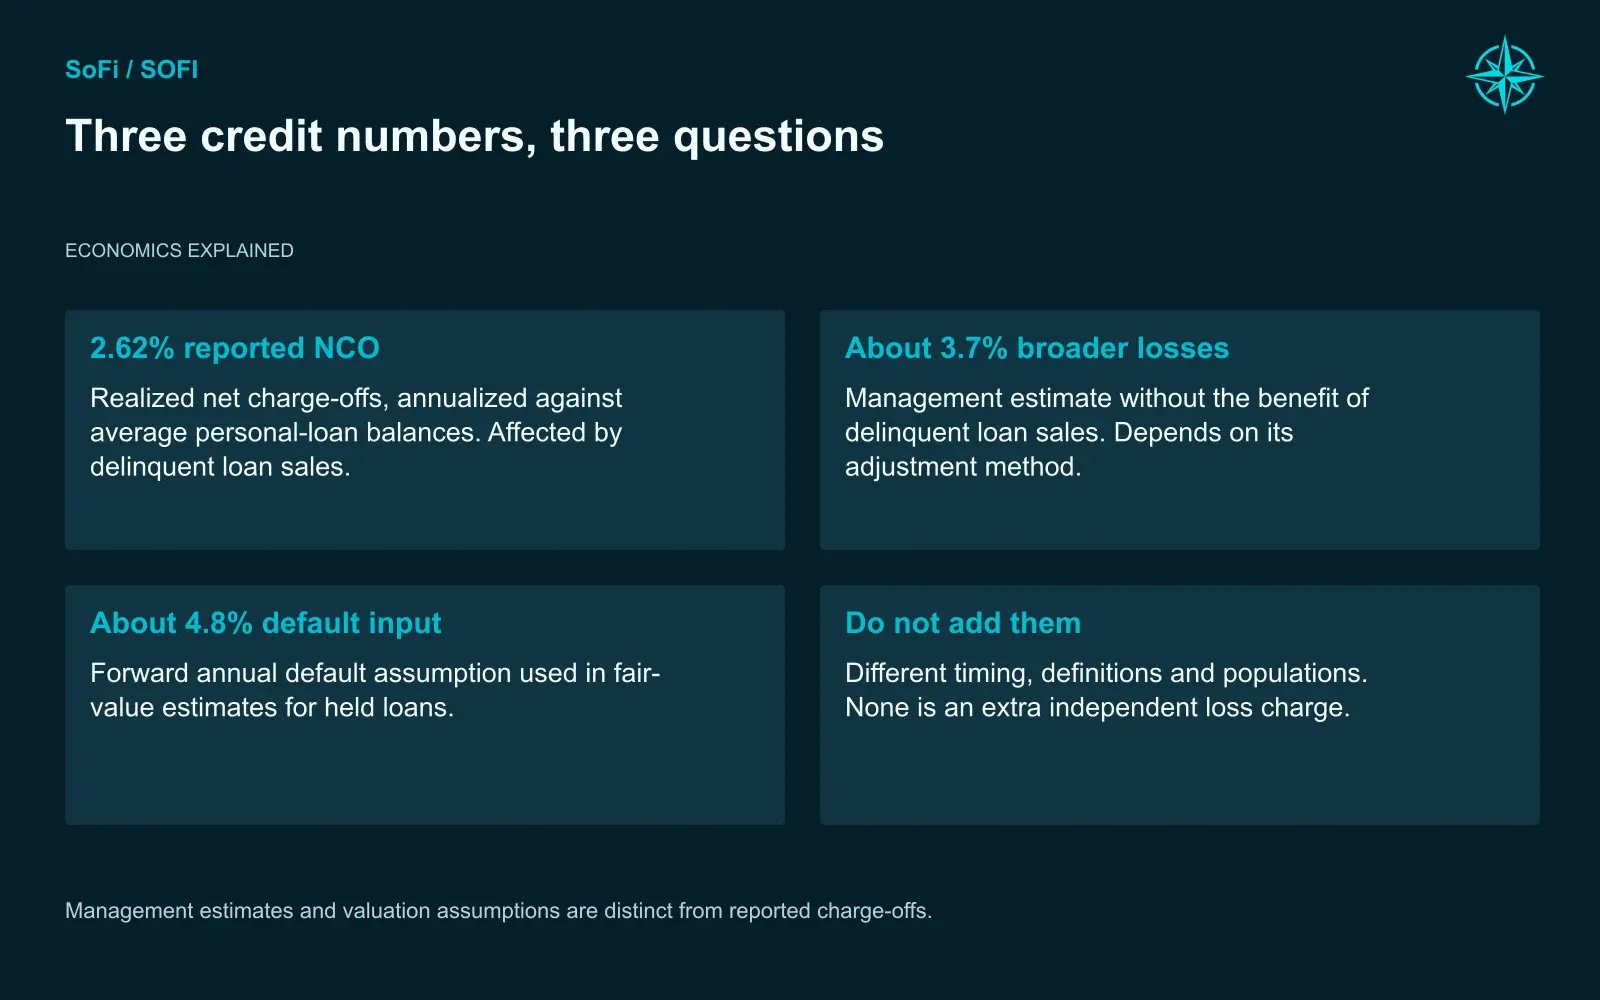
Management estimates and valuation assumptions are distinct from reported charge-offs.
Growth sets a second trap. Consumer loans tend to go bad most often in their second year or so, and a fast-growing book is full of loans too young to have reached that age. A low loss rate can mean strong underwriting. It can also mean the losses haven't arrived yet.
So we treat each quarter's loans as a separate group and let them age. The starting age mix is our estimate, since SoFi doesn't publish borrower-level history. Losses then appear roughly when they naturally would. Our starting annual loss assumptions, before adjusting for loan age and the economy, are:
Loan type | Annual loss | Recovered after charge-off |
|---|---|---|
Personal loans | 4.0% | 15% |
Student loans in repayment | 0.65% | 15% |
New in-school loans | 0.90% | 15% |
Home loans | 0.25% | 40% |
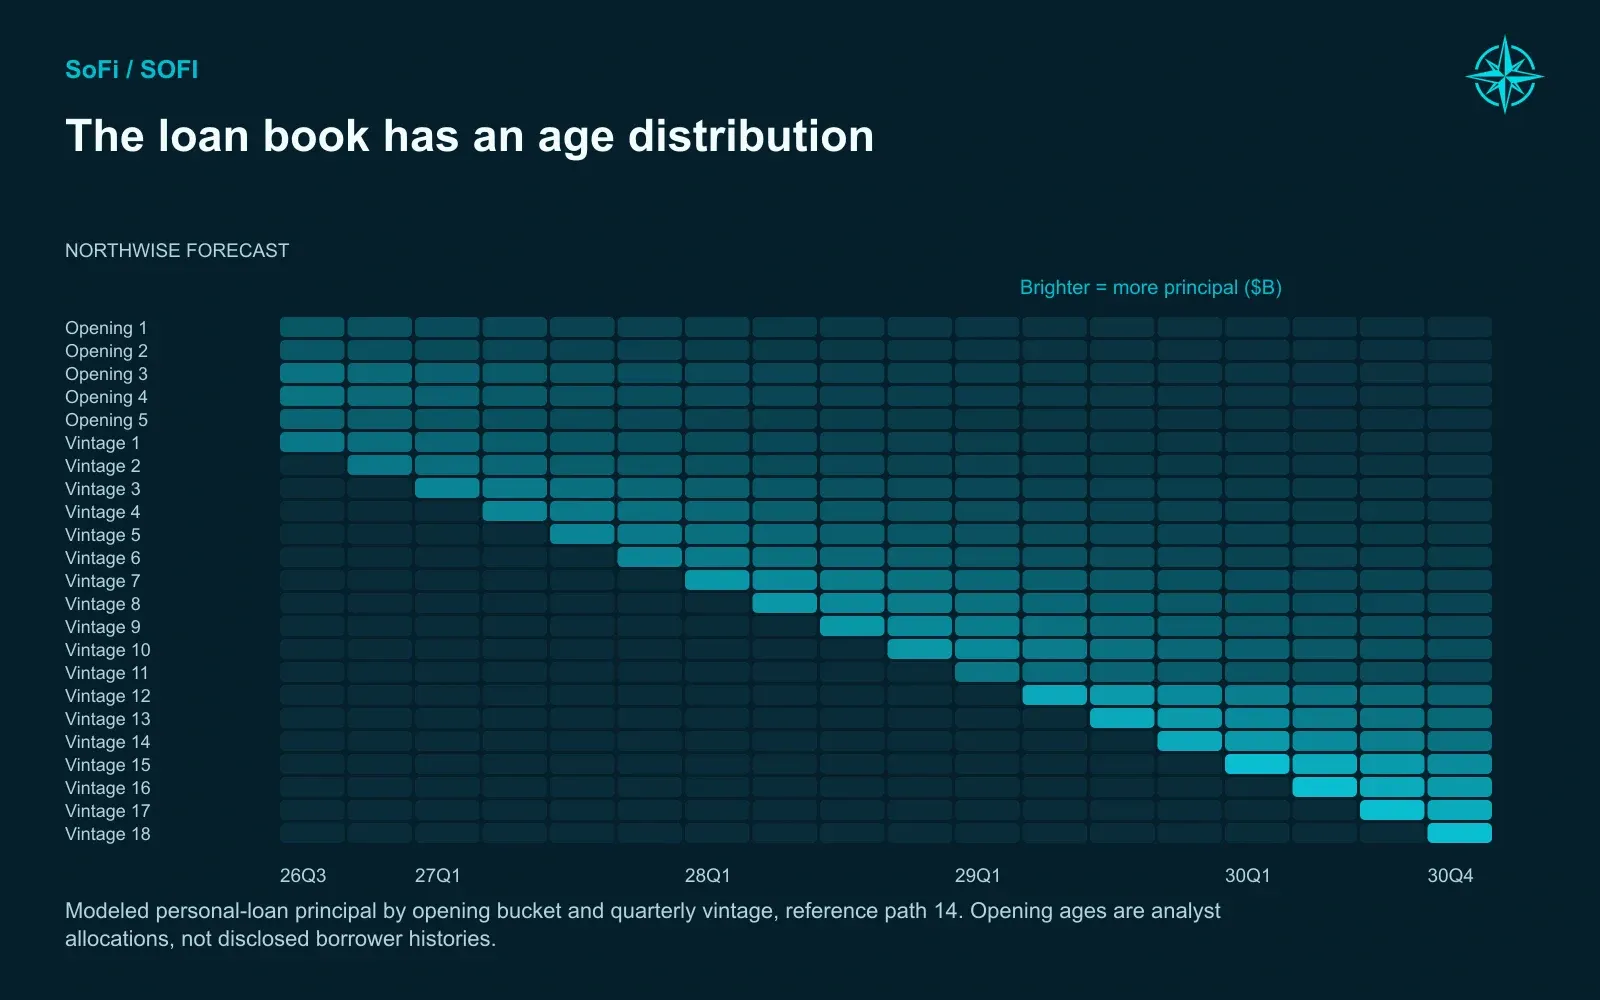
Modeled personal-loan principal by opening bucket and quarterly vintage, reference path 14. Opening ages are analyst allocations, not disclosed borrower histories.
Fair value accounting adds its own hazards. SoFi marks delinquent loans down before charging them off, so a model that takes the markdown and then the full charge-off counts the loss twice. Going the other way, dropping unfavorable marks while keeping the related hedge gains would make earnings look better than they are. We read the loan valuation, hedging, and write-off disclosures side by side to avoid both errors.
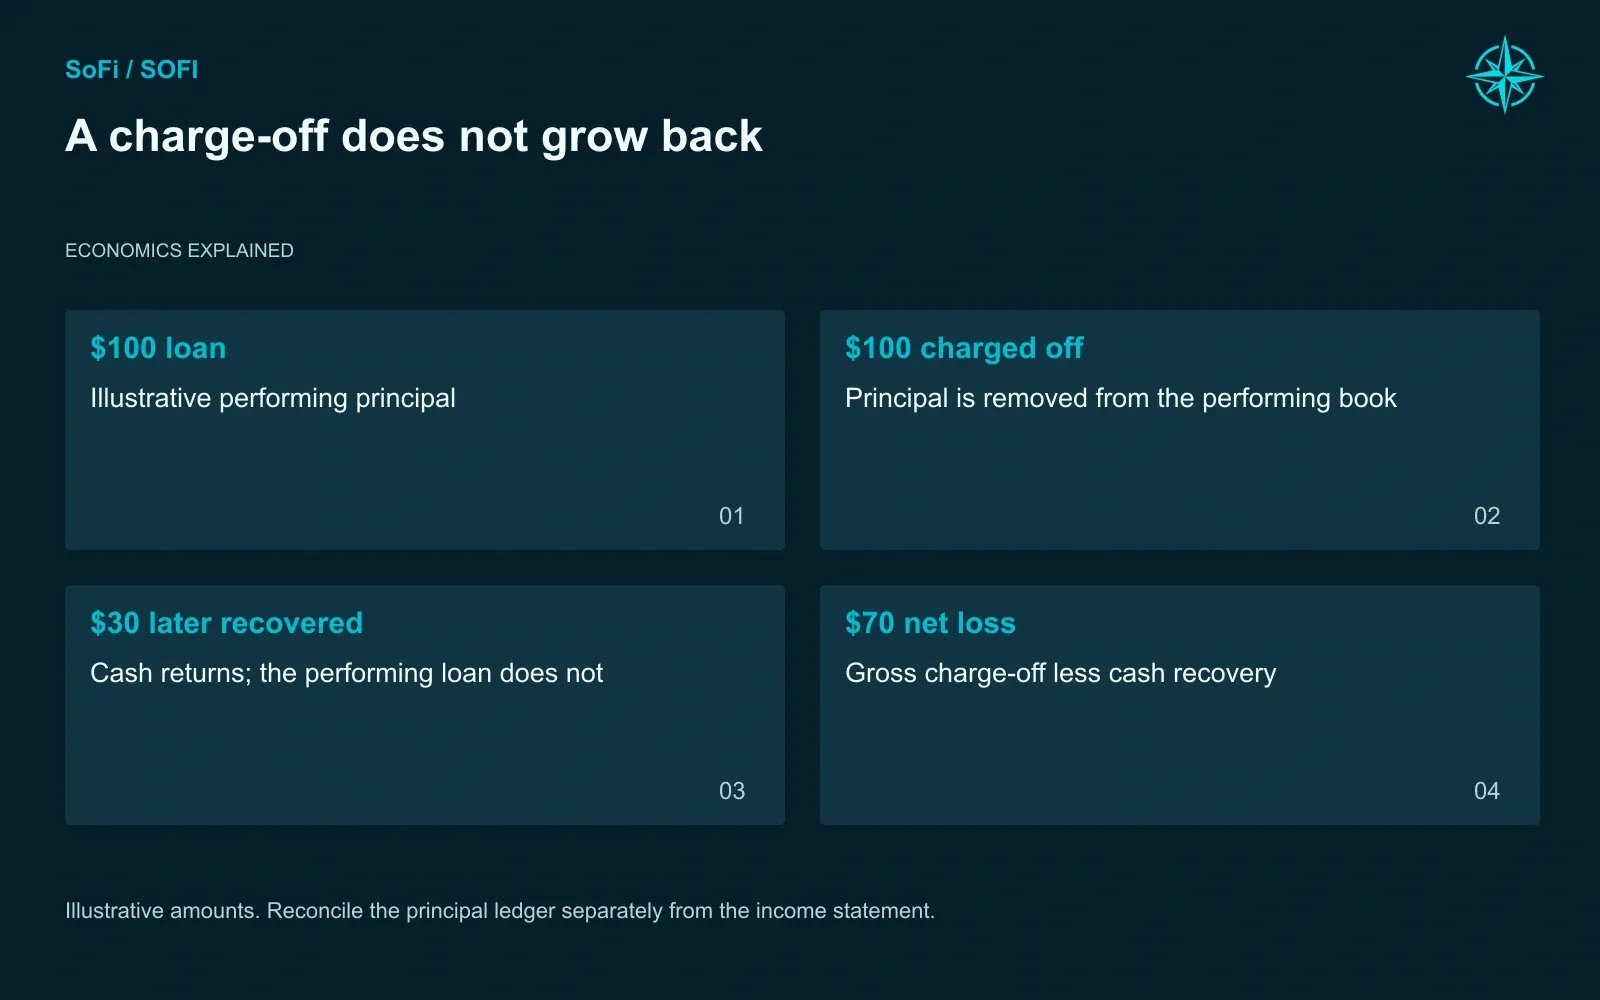
Illustrative amounts. Reconcile the principal ledger separately from the income statement.
Credit cards belong in a separate category. Roughly 45% of SoFi's card balances sit with borrowers below a 680 FICO score, and the card charge-off rate was 7.65% in the second quarter. Those are ordinary credit card numbers, a long way from the prime personal loan borrower SoFi is known for. We provision the card book on its own.
As for the short seller, SoFi rejected the allegations in March. A company rebuttal settles nothing by itself, and neither does a short report. The claims will stand or fall on how loan sales are accounted for, what exposure SoFi keeps, how borrowers perform, and whether the cash reconciles. Those are the questions our model is built to answer.
We remain positive on the lending business. The spread is attractive, and access to willing loan buyers is a strategic advantage, subject to their capacity and pricing. We would change our minds if the improving loss figures faded as the loans aged, or if results began to depend more on accounting choices than on borrowers paying.
Not Every Loan Runs on the Same Clock
Personal loans get the attention, while SoFi's other lending products quietly shape its cash and capital needs.
Student loan refinancing usually means taking on a graduate who is already making payments. New in-school lending works differently. SoFi funds tuition years before the borrower owes anything, and interest accumulates while very little cash comes back. We give in-school loans a 12-quarter deferral, a simplified version of real contract terms. By 2030 our Base has $30.83 billion of student originations, $2.19 billion of them in-school.
The student book has performed well so far, with a 0.61% net charge-off rate in the second quarter. About $3.67 billion of those loans carry financial guarantees. We don't import the problems of the broader federal student loan population, since SoFi's refinance borrowers are a hand-picked group of employed graduates.
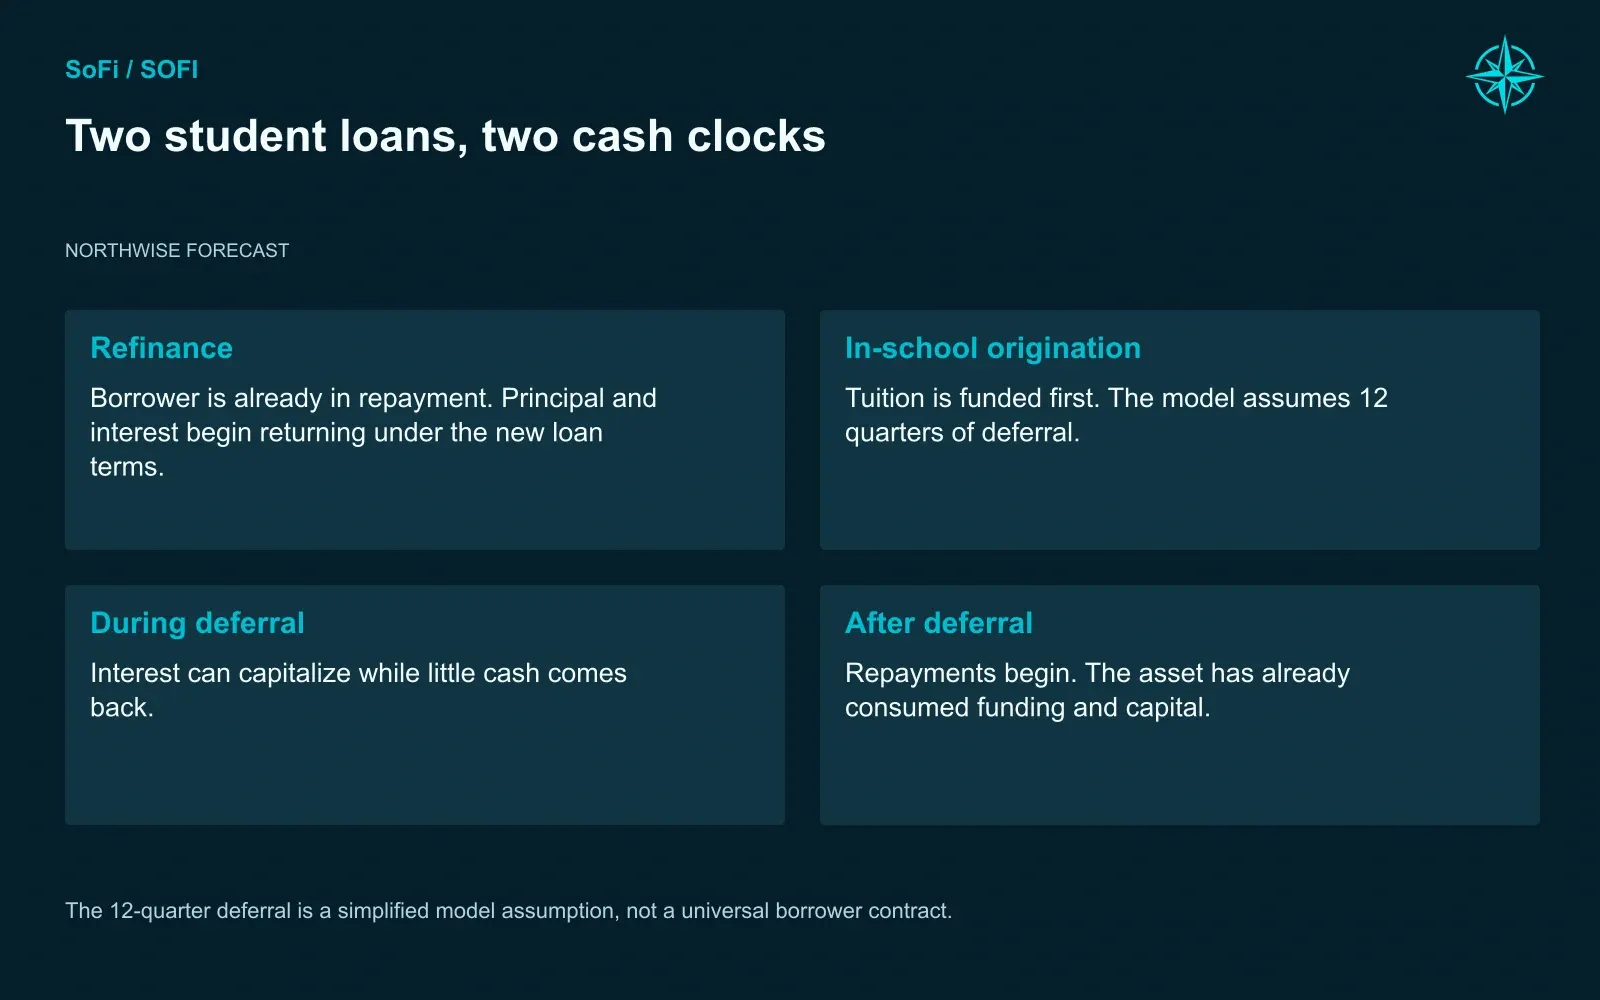
The 12-quarter deferral is a simplified model assumption, not a universal borrower contract.
Home equity may be the most underappreciated growth line. Millions of homeowners are sitting on low-rate mortgages they will never refinance, yet many want cash for a renovation or to pay down expensive debt. A home equity loan or credit line lets them borrow against the house without touching the first mortgage.
Those products were about one-third of SoFi's second-quarter home originations. Our Base grows total home lending from $6 billion in 2026 to $18.30 billion in 2030 without needing the housing market to recover.
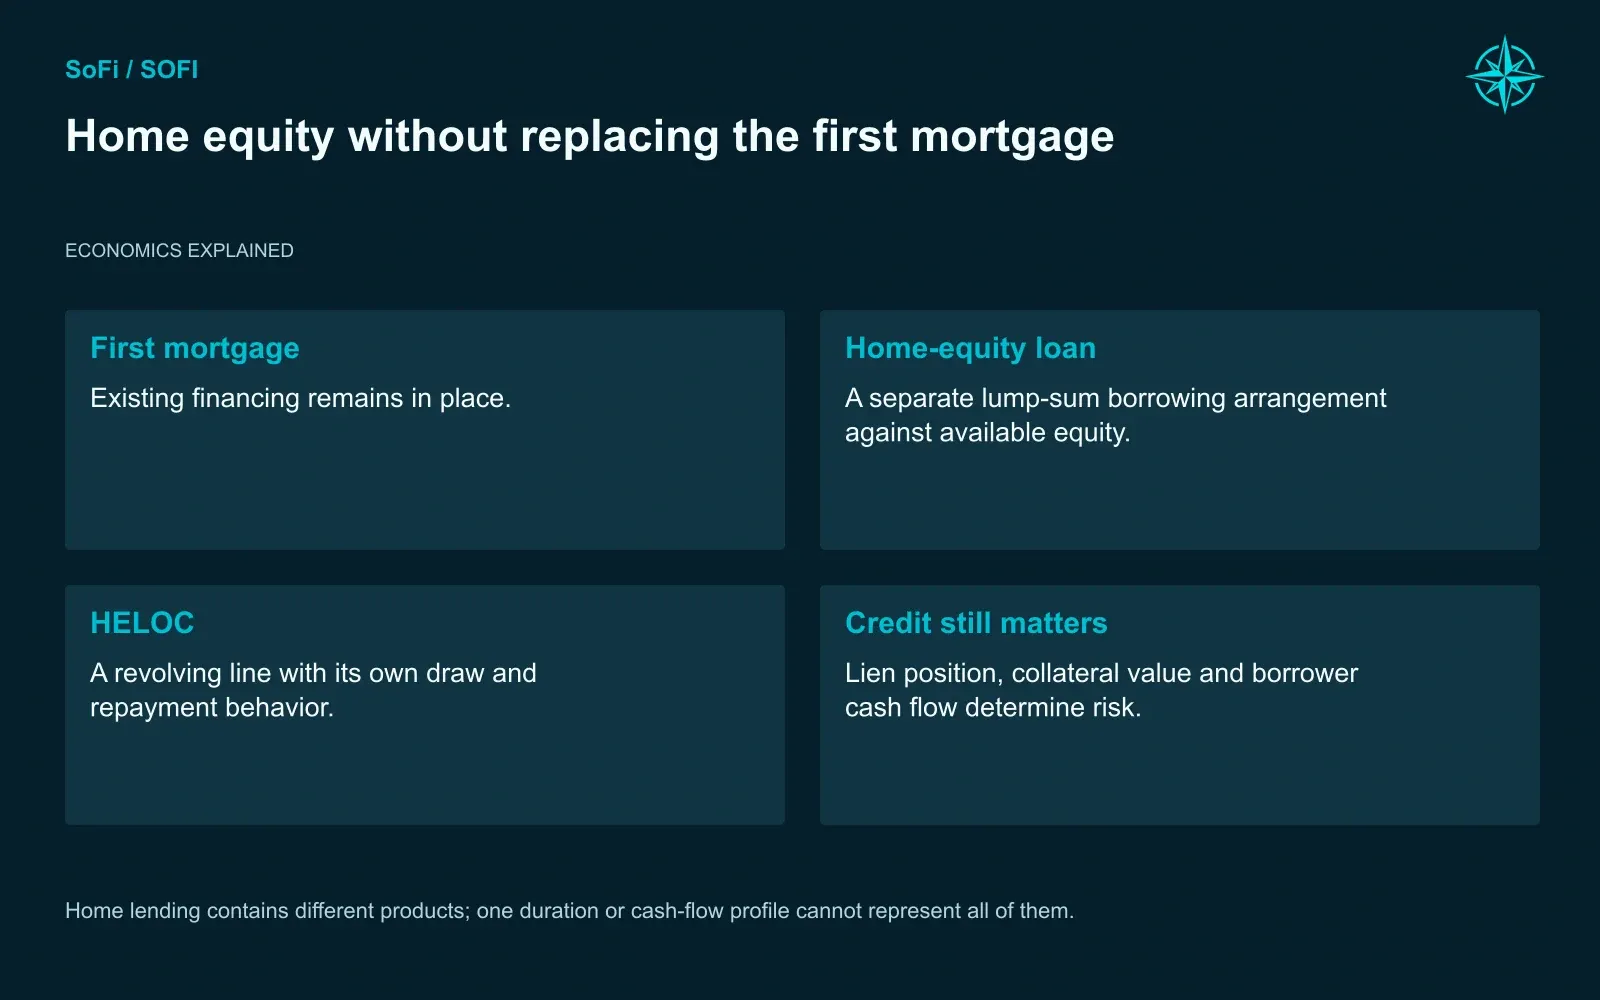
Home lending contains different products; one duration or cash-flow profile cannot represent all of them.
Small business lending starts entirely through partners, which lets SoFi learn the credit before risking its own balance sheet. We follow management's plan and route $4.12 billion of 2030 small business loans through LPB, with none kept on SoFi's books.
What a Deposit Really Costs
Every loan SoFi keeps has to be funded. For a bank, customer deposits are supposed to be the cheapest money available.
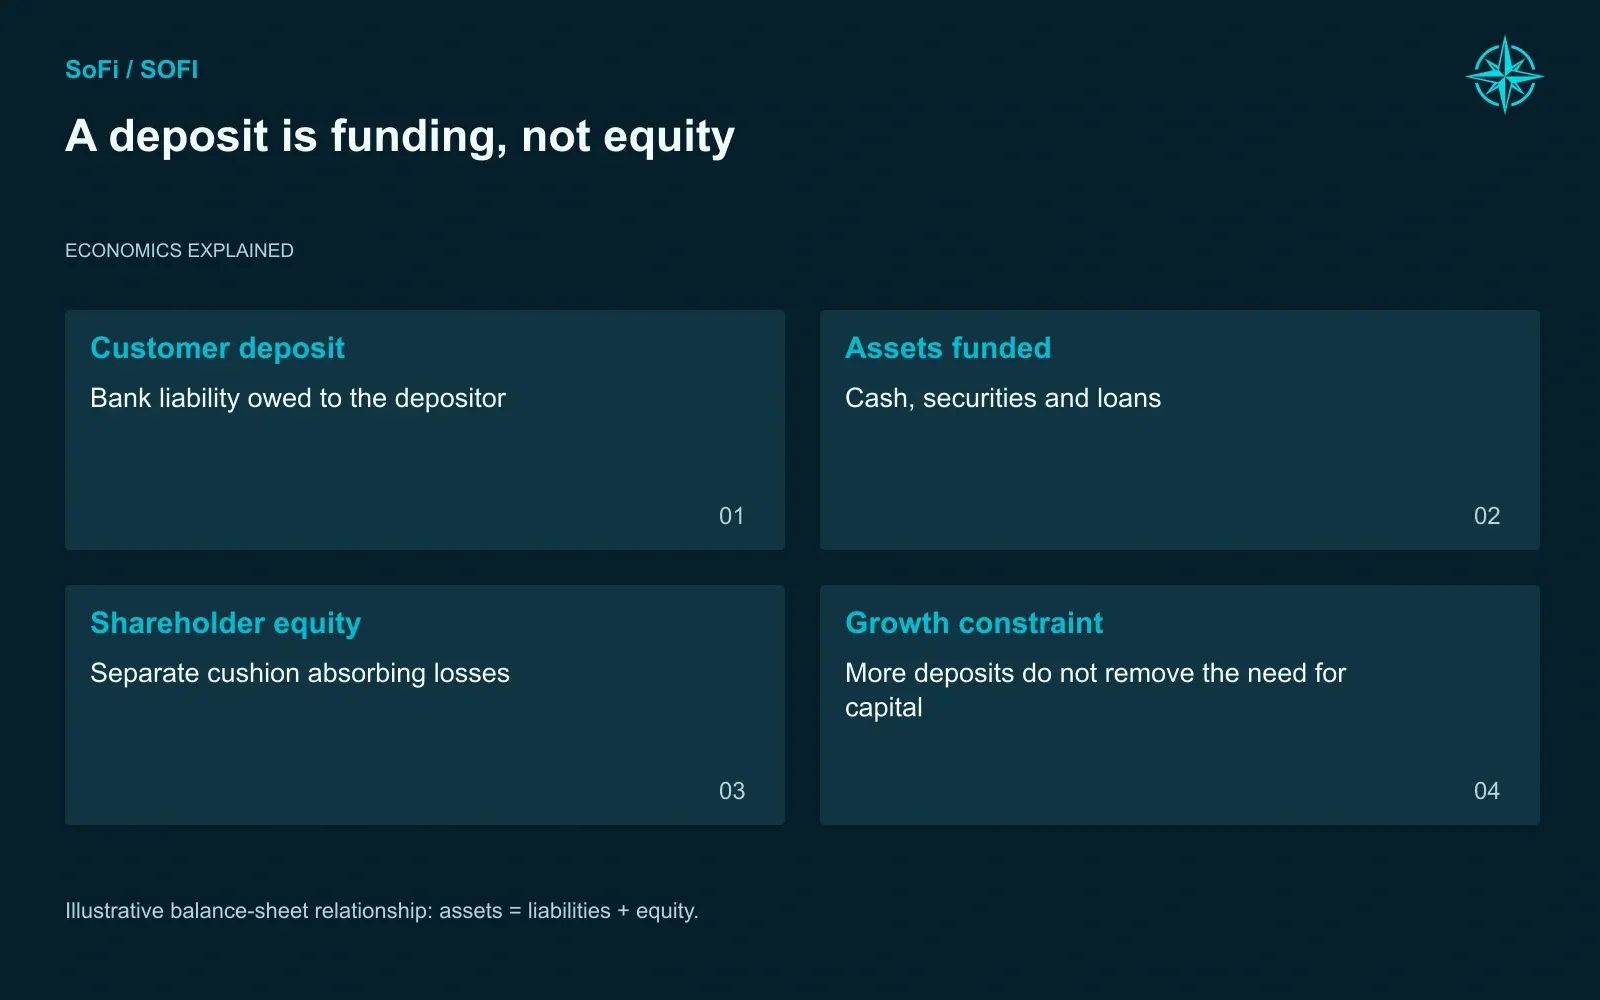
Illustrative balance-sheet relationship: assets = liabilities + equity.
SoFi grew deposits from $37.51 billion at the end of 2025 to $45.54 billion in June. Inside that growth is a detail the platform camp tends to skip. Brokered deposits, meaning money gathered through intermediaries who shop for the best rate, jumped from $1.40 billion to $4.53 billion. They supplied about 39% of the increase.
Brokered money is a standard banking tool. It also costs more and leaves faster than a paycheck landing in an account every two weeks. On its own the jump is no red flag. It does show SoFi reaching for funding to keep pace with its own loan demand, and it points to the assumption in our forecast that carries the most weight.
Our Base case reaches $160.99 billion of deposits by 2030:
- $145.04 billion from retail customers
- $10.36 billion from enterprise clients
- $5.60 billion brokered
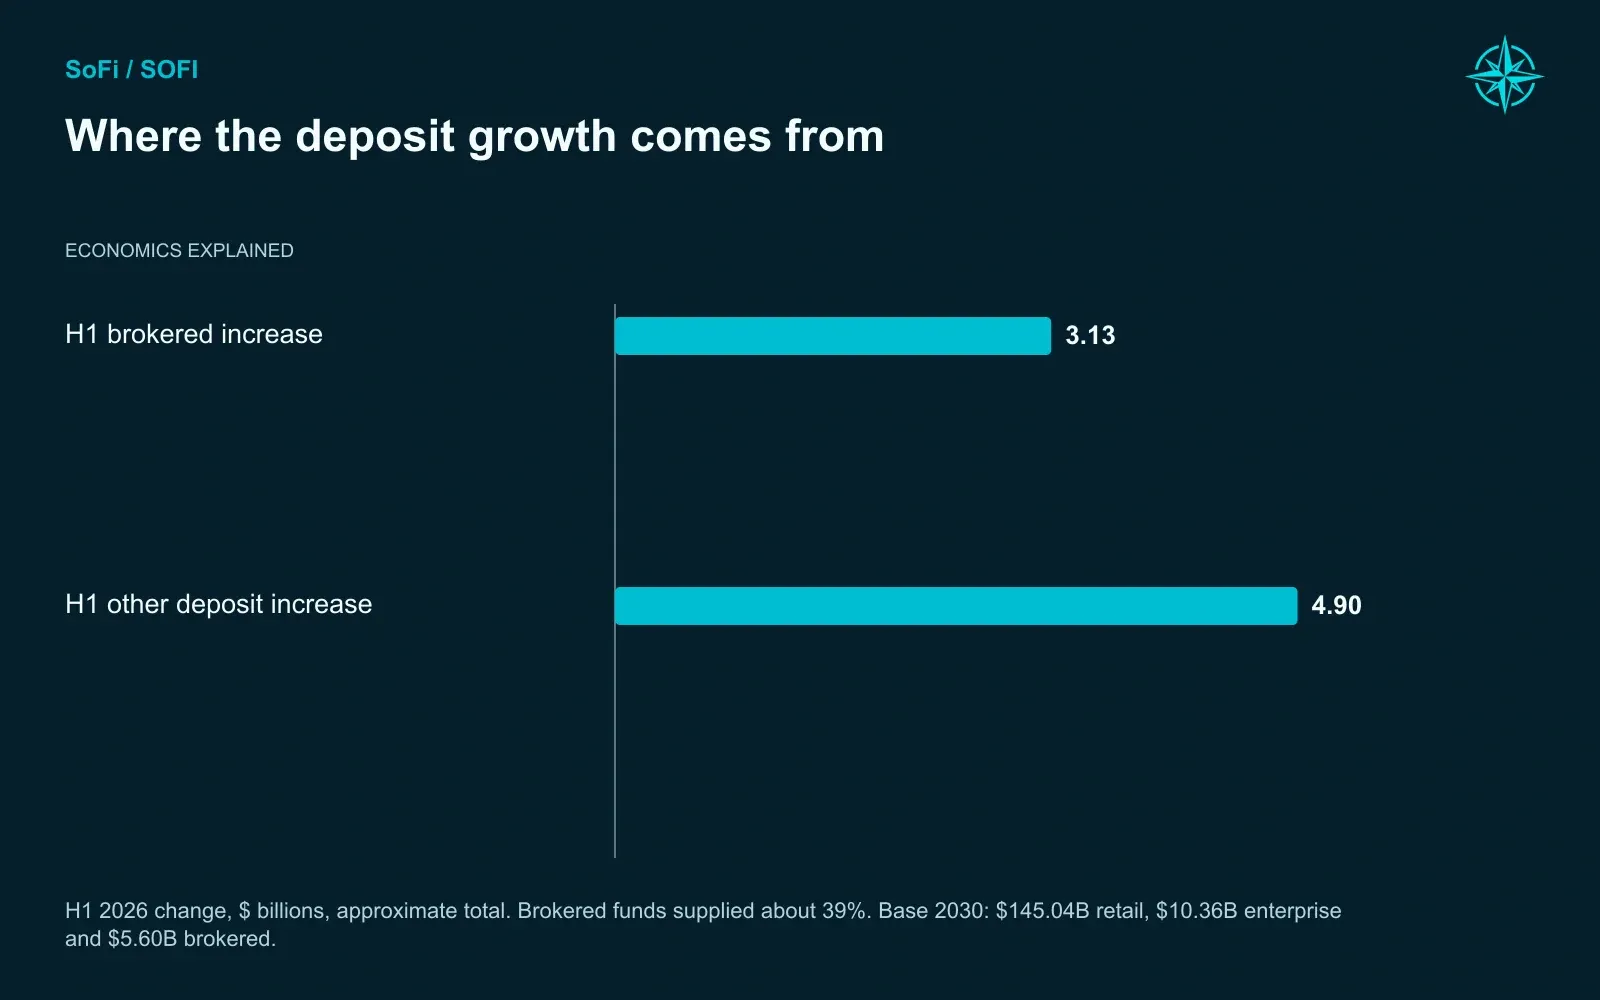
H1 2026 change, $ billions, approximate total. Brokered funds supplied about 39%. Base 2030: $145.04B retail, $10.36B enterprise and $5.60B brokered.
For that mix to hold, members have to move paychecks and primary balances into SoFi. A deposit base built on rate-chasers would make the same growth far more expensive.
SoFi is also more exposed to deposit competition than most investors assume. By the company's own estimate, an immediate one percentage point rise in rates would cut the next 12 months of net interest income by about $159 million. A one point fall would add about $161 million.
That disclosed rate shock includes changes across assets, liabilities and hedges. Deposit competition is a separate risk: paying more for funding without an offsetting increase in asset yields compresses the spread. We test it separately.
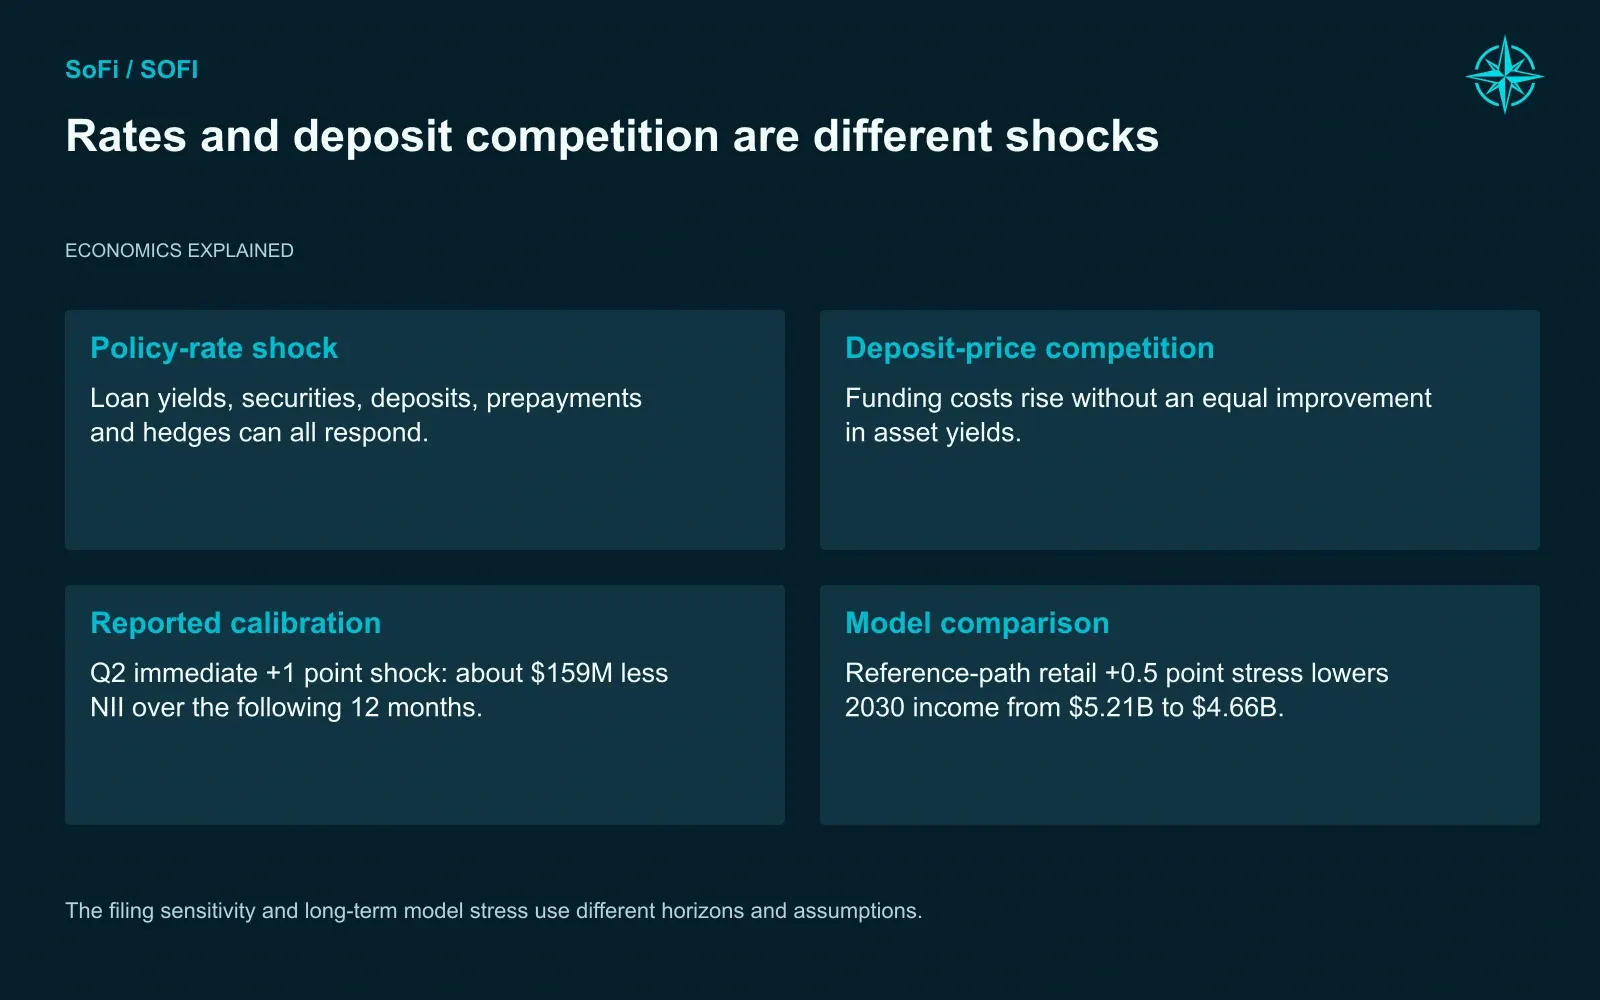
The filing sensitivity and long-term model stress use different horizons and assumptions.
The $10 Question
Which brings us back to Plus.
SoFi relaunched the membership in the second quarter and signed up more than 200,000 subscribers. About 85% were already SoFi customers, and 25% added another product after joining. For a program built to deepen relationships, those are the right early signs.
We ran it forward. Our Base has about 4.52 million subscribers by the end of 2030, averaging 3.86 million over the year as people join throughout it. At $120 each, that produces about $463 million of subscription revenue. Here is what the perks cost against it:
Plus economics in 2030, Base case | Amount |
|---|---|
Subscription revenue | $463 million |
Extra interest on subscribers' savings | $(417) million |
Investment matching | $(135) million |
Shortfall before follow-on business | $(89) million |
Those costs assume an average $8,000 of eligible savings earning a 1.40 point rate premium, plus $3,500 of qualifying yearly investment matched at 1%. SoFi's published Plus terms include a 4.50% APY tier on up to $20,000 in eligible savings. Rates and eligibility can change. We keep the forecast assumptions separate from promotional terms, and do not add a separate crypto-match expense.
The $89 million shortfall is a narrow subtotal before other relationship earnings and costs. It does not establish Plus's standalone operating profit or management's intent. The economic case depends on the deposit balances, loans, investing and card activity associated with those members earning enough to cover the benefits. Subscriber fees alone do not answer that question.
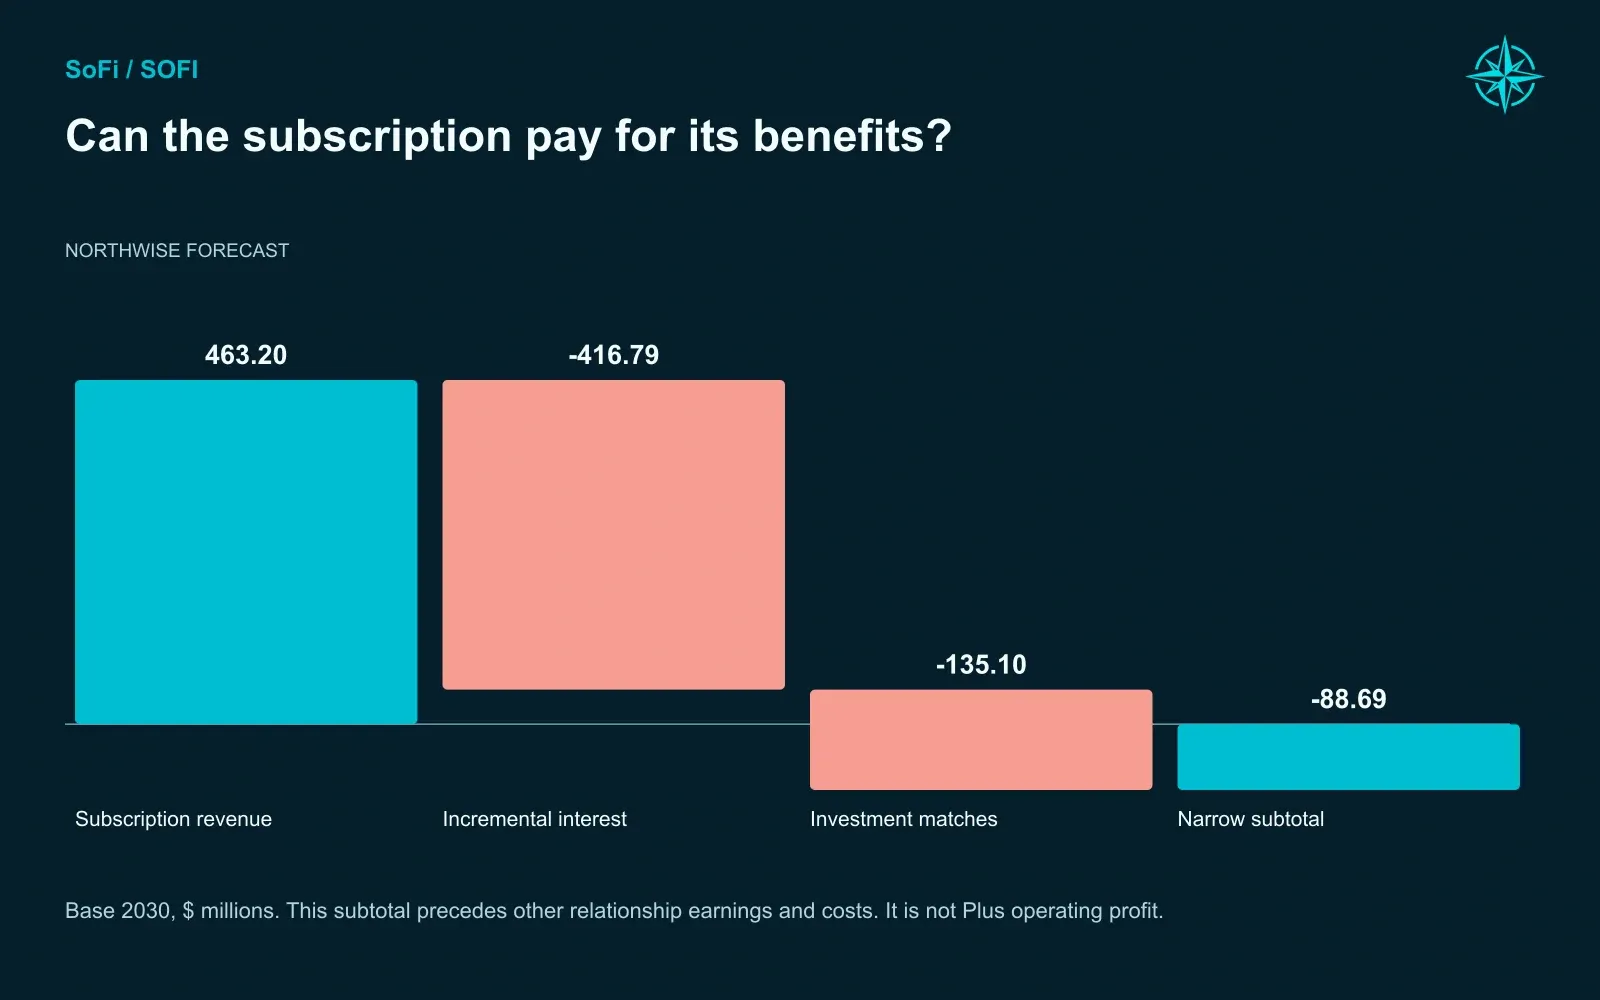
Base 2030, $ millions. This subtotal precedes other relationship earnings and costs. It is not Plus operating profit.
The figure to watch is funded balances and profitable products per Plus member. Subscriber milestones tell you far less.
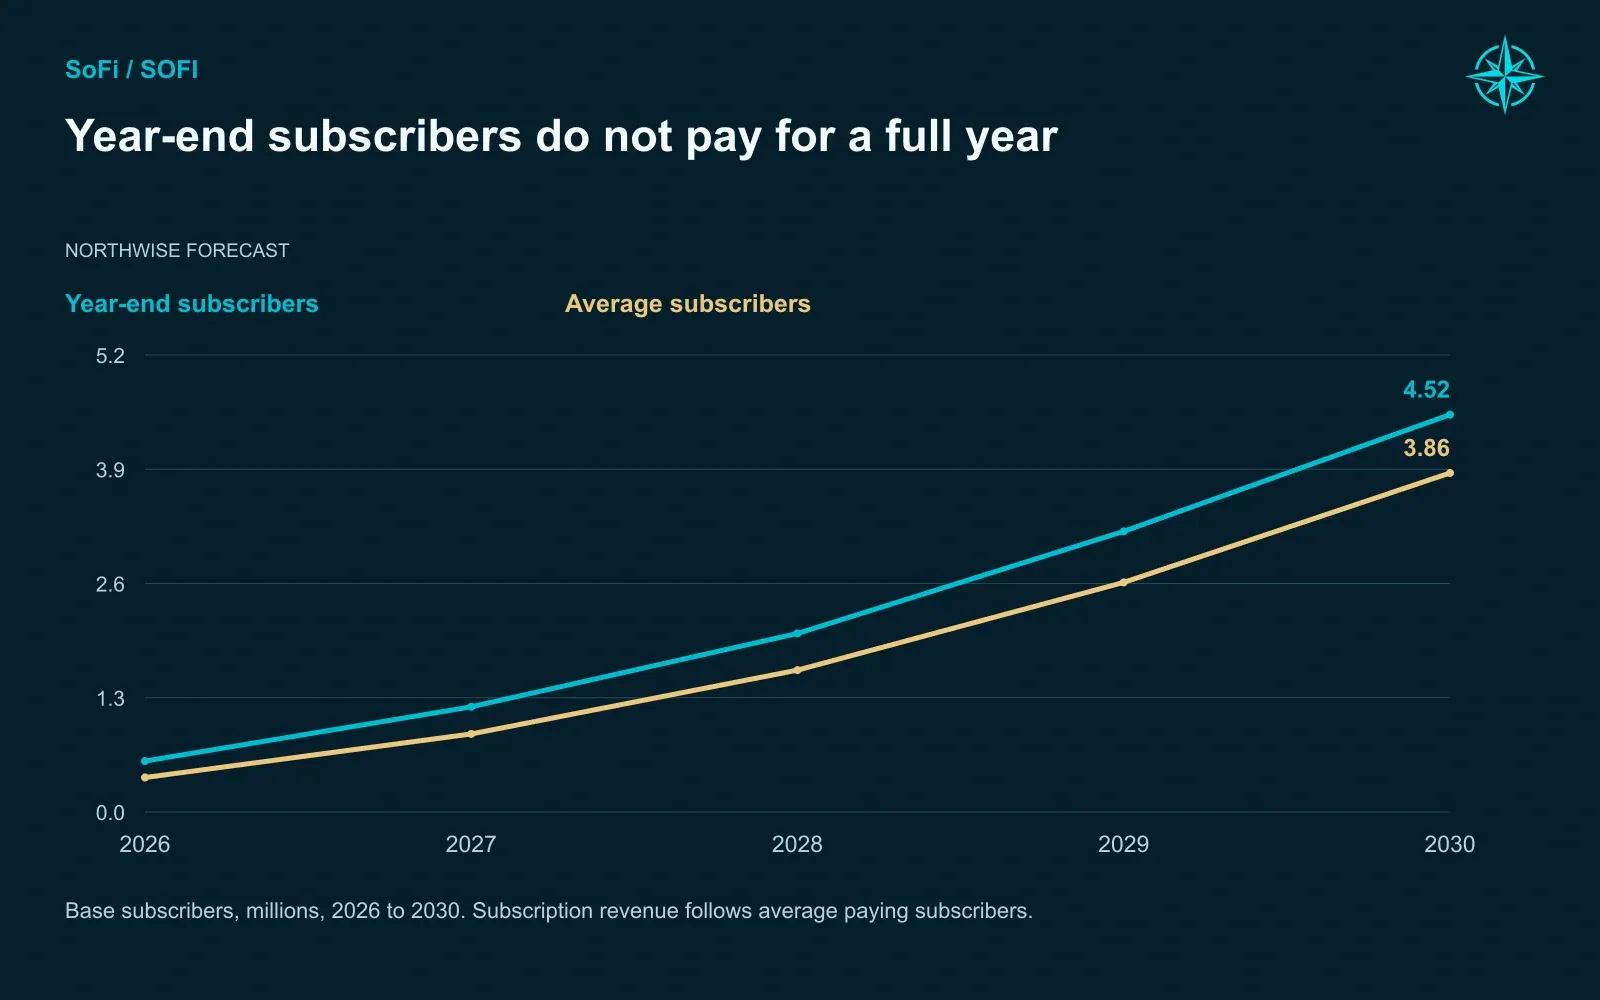
Base subscribers, millions, 2026 to 2030. Subscription revenue follows average paying subscribers.
Everything Else in the App
The platform camp's best exhibits live in SoFi's newer businesses. A few of them are real. Most are smaller than the attention they get.
Take Financial Services, the segment that holds SoFi Money, SoFi Invest, and the credit card. It reported $466.3 million of second-quarter revenue. About 84% came from two lines: $249.1 million of net interest income on deposits and $140.9 million of LPB fees. The segment that looks most like an app still earns most of its money from lending and funding.
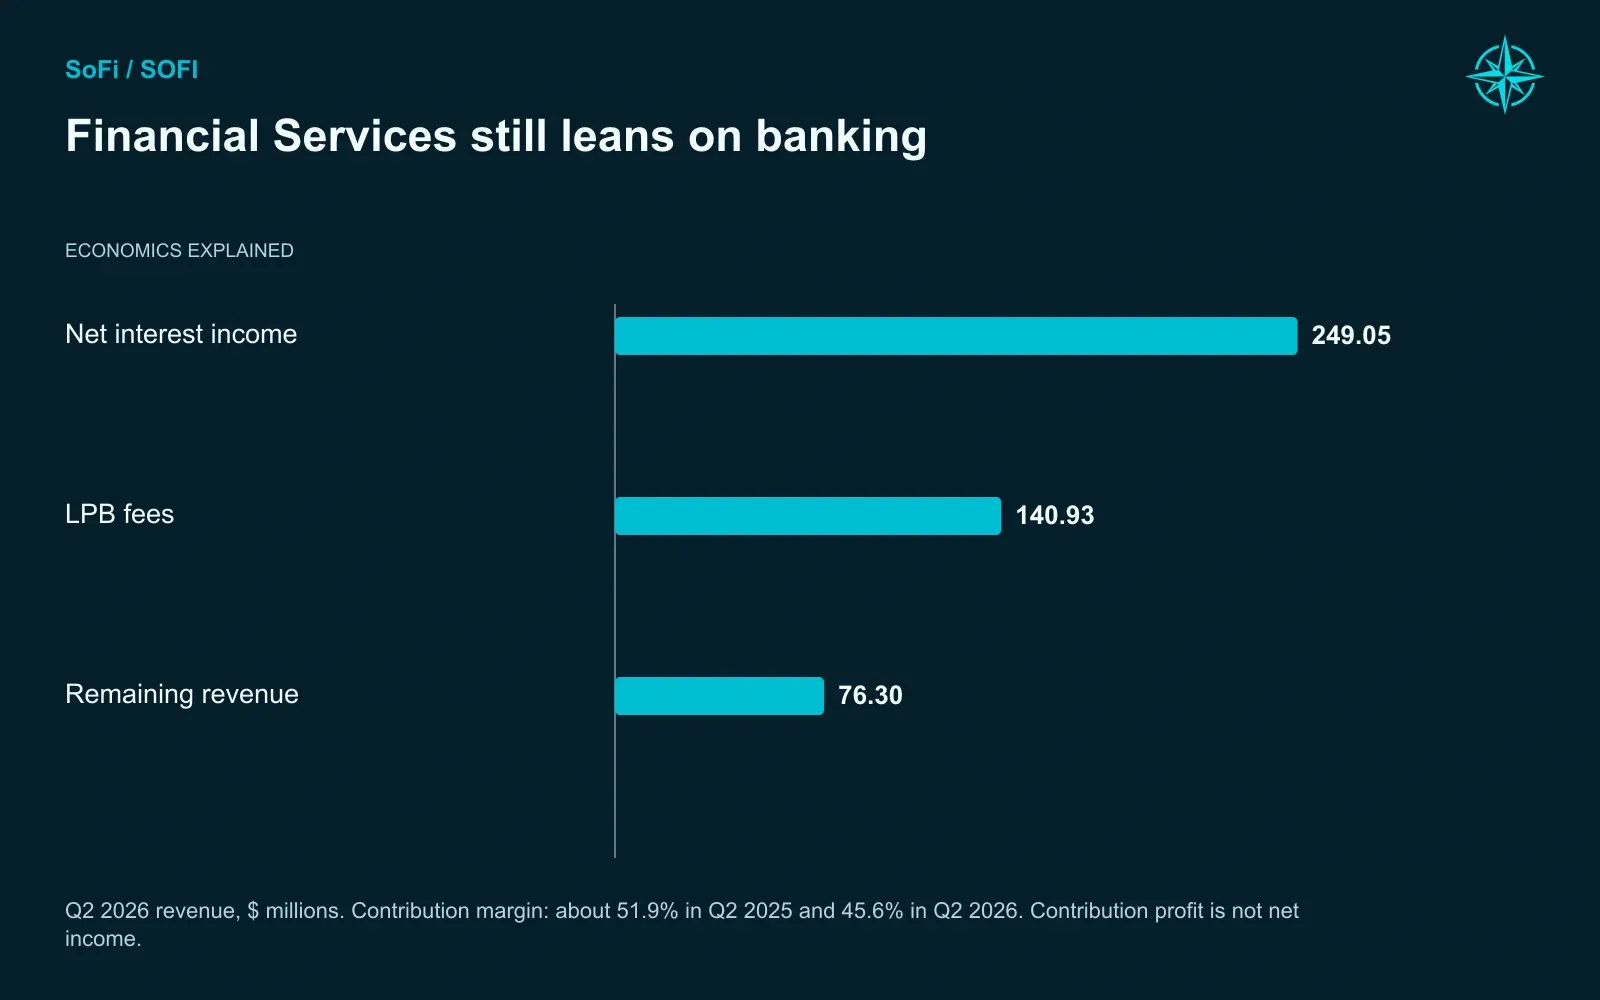
Q2 2026 revenue, $ millions. Contribution margin: about 51.9% in Q2 2025 and 45.6% in Q2 2026. Contribution profit is not net income.
The true fee lines are growing from a small base. Card interchange reached $41.1 million in the quarter, and brokerage revenue more than doubled to $18.1 million from $7.5 million. We take them to $593 million and $270 million by 2030.
Building them isn't free. Segment revenue grew about 29% while contribution profit grew about 13%, which pushed the contribution margin from roughly 51.9% to 45.6%. SoFi is investing ahead of the payoff.
SoFi's technology platform, which sells banking and card-processing infrastructure to other financial companies, had a harder year. Second-quarter revenue was about $84.5 million, but $27.8 million of that was SoFi billing itself. Outside customers paid roughly $56.7 million. The company attributed the year-over-year decline mainly to losing a large client.
There is a consolation. SoFi is moving its own banking onto the same cloud-native core, starting with Big Business Banking and the SoFi Money migration, which gives its sales team a working reference customer. Our Base still needs outsiders to pay, and it asks only that external technology revenue grow from $245 million in 2026 to $564 million in 2030. That is about 4% of total revenue, and the investment case works even if this business stays small.
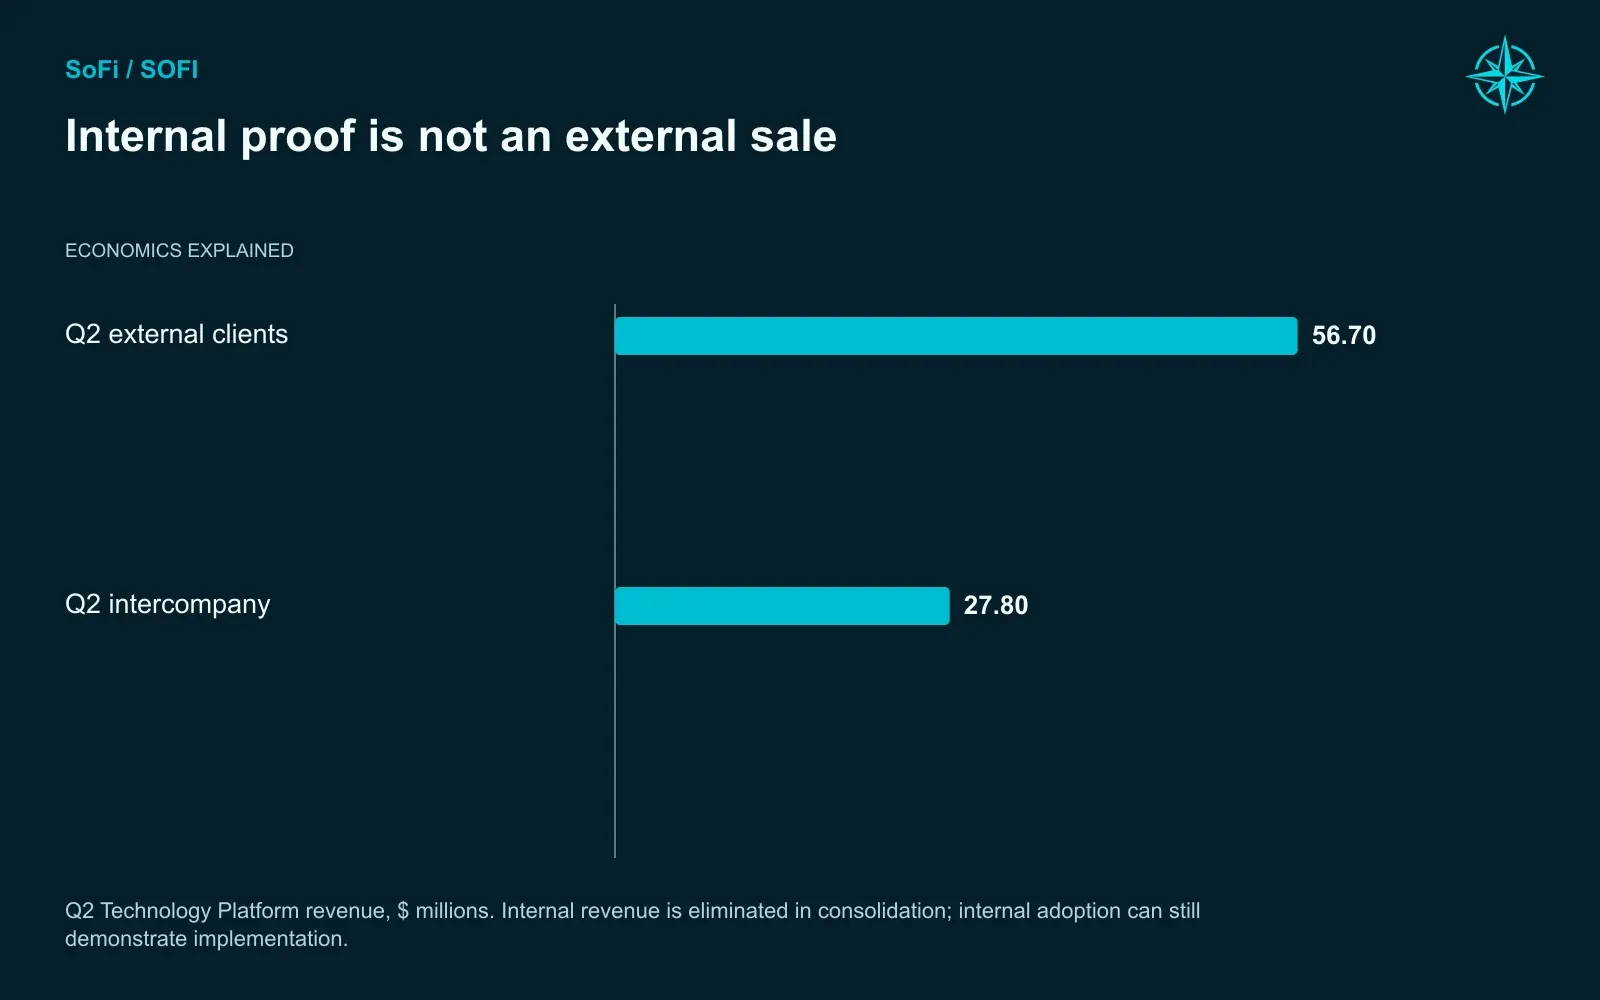
Q2 Technology Platform revenue, $ millions. Internal revenue is eliminated in consolidation; internal adoption can still demonstrate implementation.
AI gets similar treatment. The most promising product is Coach, which reads a member's linked accounts and offers personal financial guidance. Management reports nearly half a million early conversations and more than 90% positive feedback. The commercial logic is easy to follow: a member who discovers idle cash, forgotten subscriptions, or an expensive loan elsewhere has a reason to use another SoFi product.
The risk is just as easy to see, since advice that reads like a sales pitch gets ignored quickly. Two acquisitions fit the same pattern. Composer lets users build and automate investing strategies, and Peach adds loan servicing technology. We count all of this through product adoption and operating costs, with no separate AI revenue line.
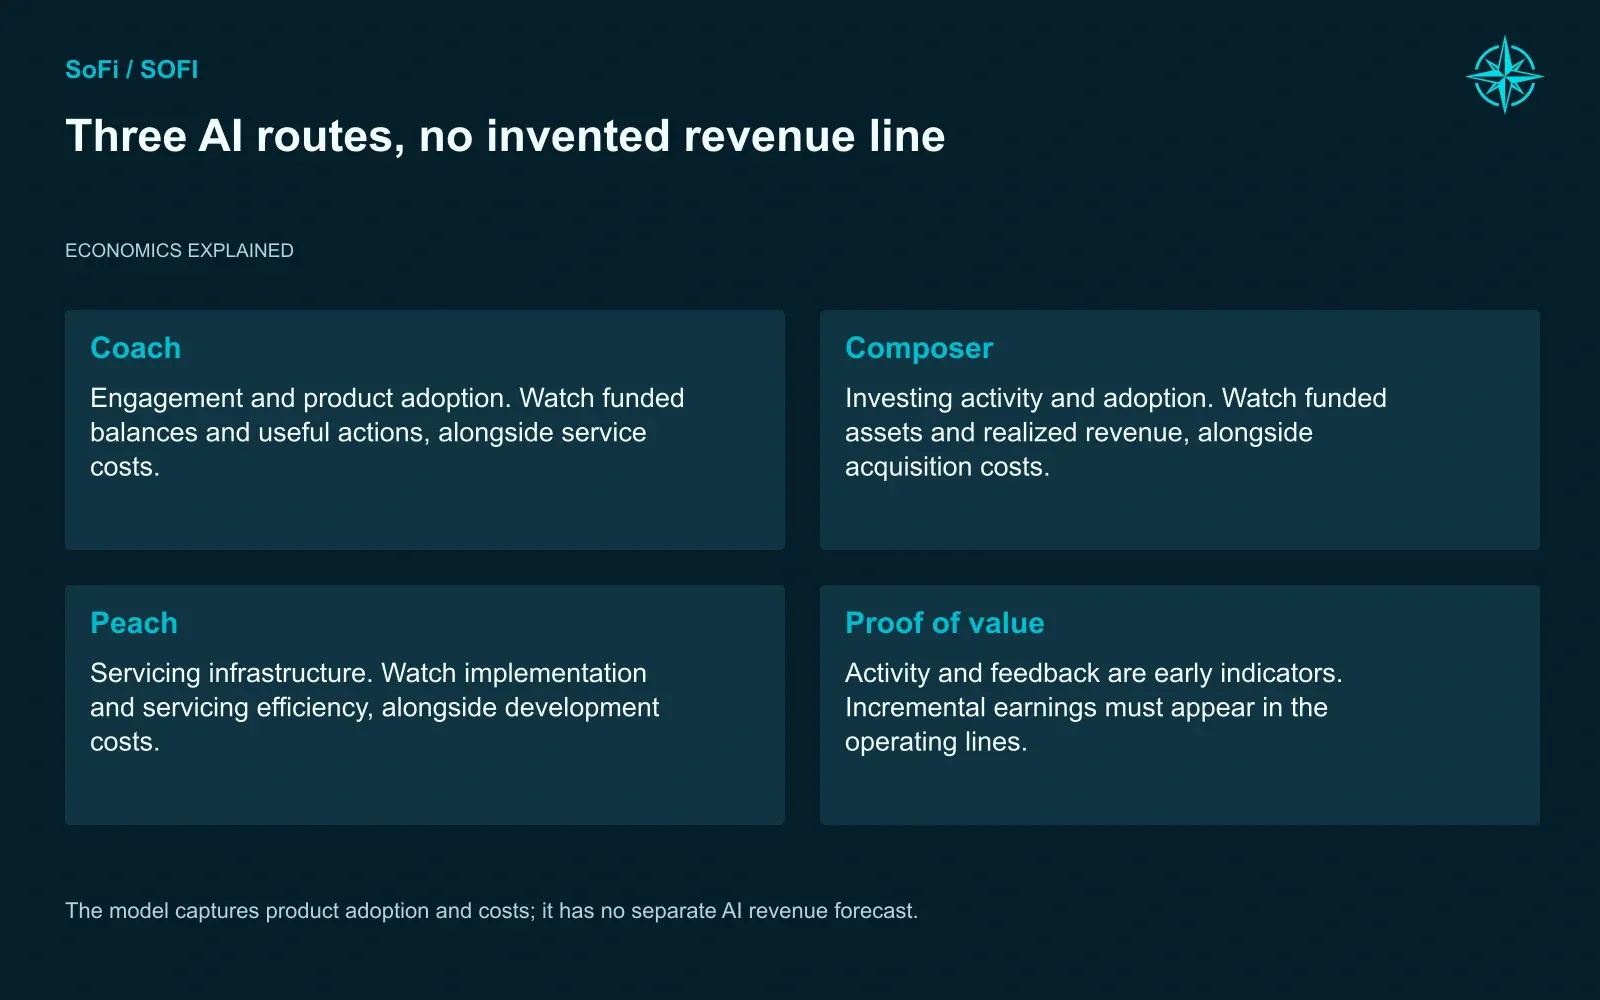
The model captures product adoption and costs; it has no separate AI revenue forecast.
Crypto produces the most misleading numbers in the filing. SoFi reported $134.3 million of gross crypto revenue in the second quarter, with $133.1 million of cost against it. Net crypto transaction revenue was about $1.18 million before other operating costs. Headlines quoting the gross figure are counting the money passing through the register.
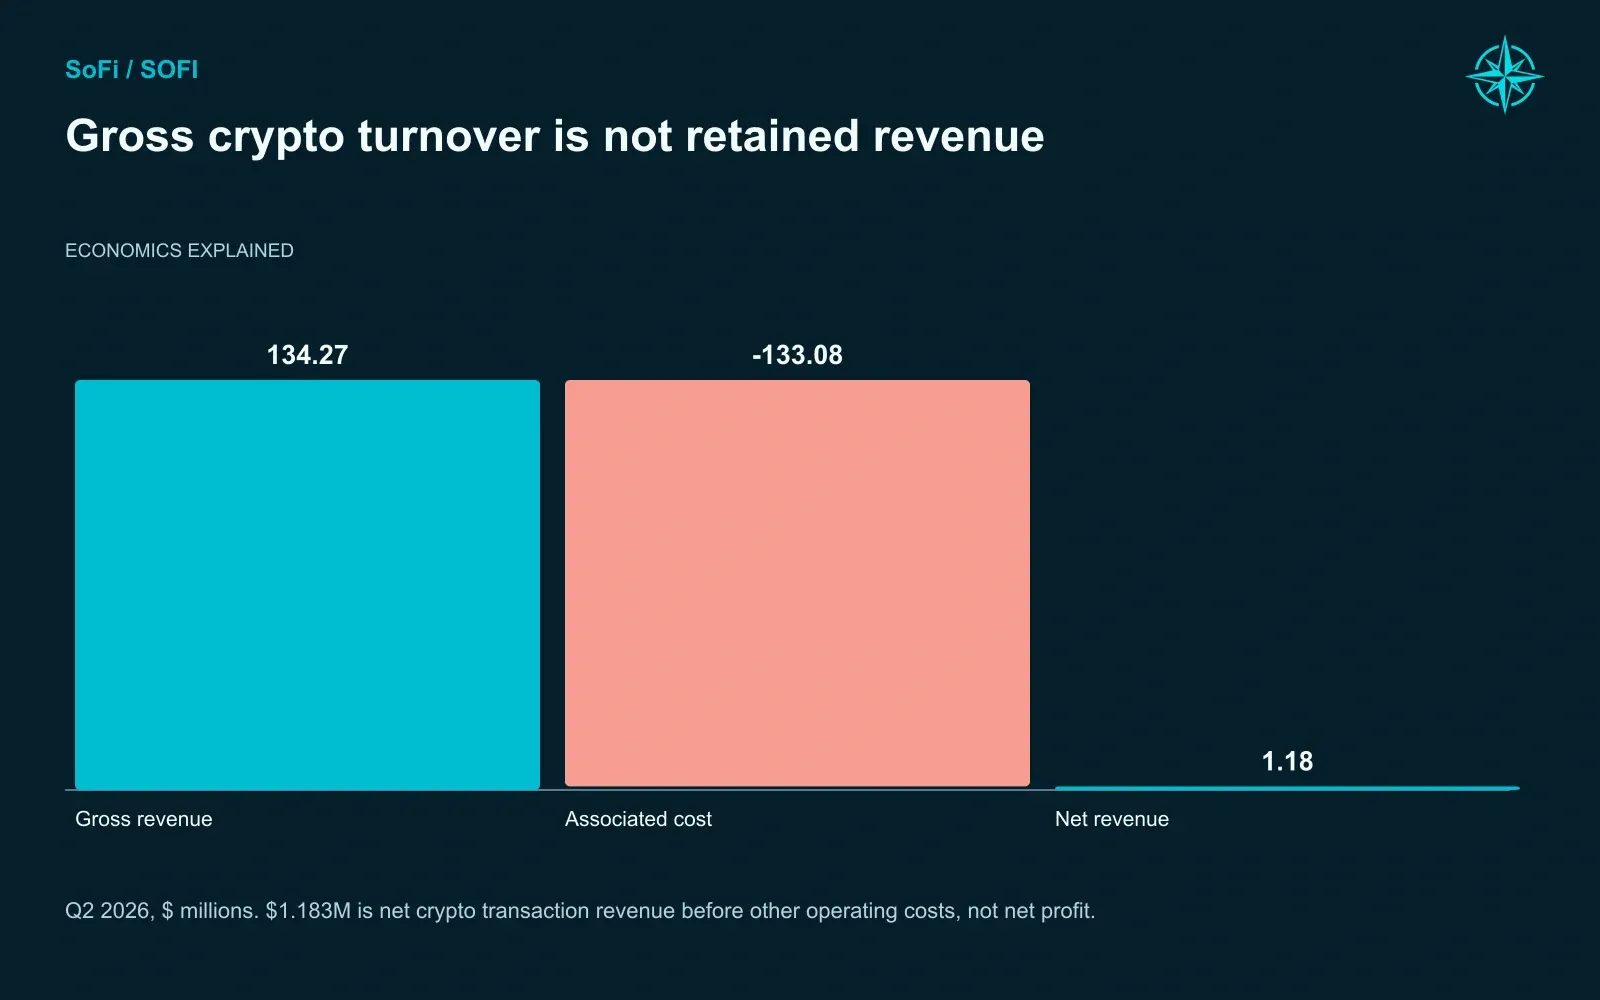
Q2 2026, $ millions. $1.183M is net crypto transaction revenue before other operating costs, not net profit.
The September deals matter more. On September 3, SoFi signed an agreement with Payward, Kraken's parent. It brings Kraken into the SoFi Exchange Network, distributes SoFi's dollar stablecoin, SoFiUSD, through Kraken, and taps Kraken Prime for trading liquidity. On September 22, SoFi and Mastercard switched on stablecoin settlement across SoFi's card program, expected to handle more than $25 billion of volume a year.
Most of that $25 billion is existing card spending settling through a new pipe, and SoFi advertised merchant settlement and withdrawals at zero cost. We charge no toll on it. What we do model are the balances and enterprise relationships the network can attract:
Stablecoin and enterprise, 2030 Base case | Amount |
|---|---|
Net crypto revenue | about $332 million |
Paid enterprise services | $102 million |
Enterprise deposits | $10.36 billion |
SoFiUSD in circulation | $8.45 billion |
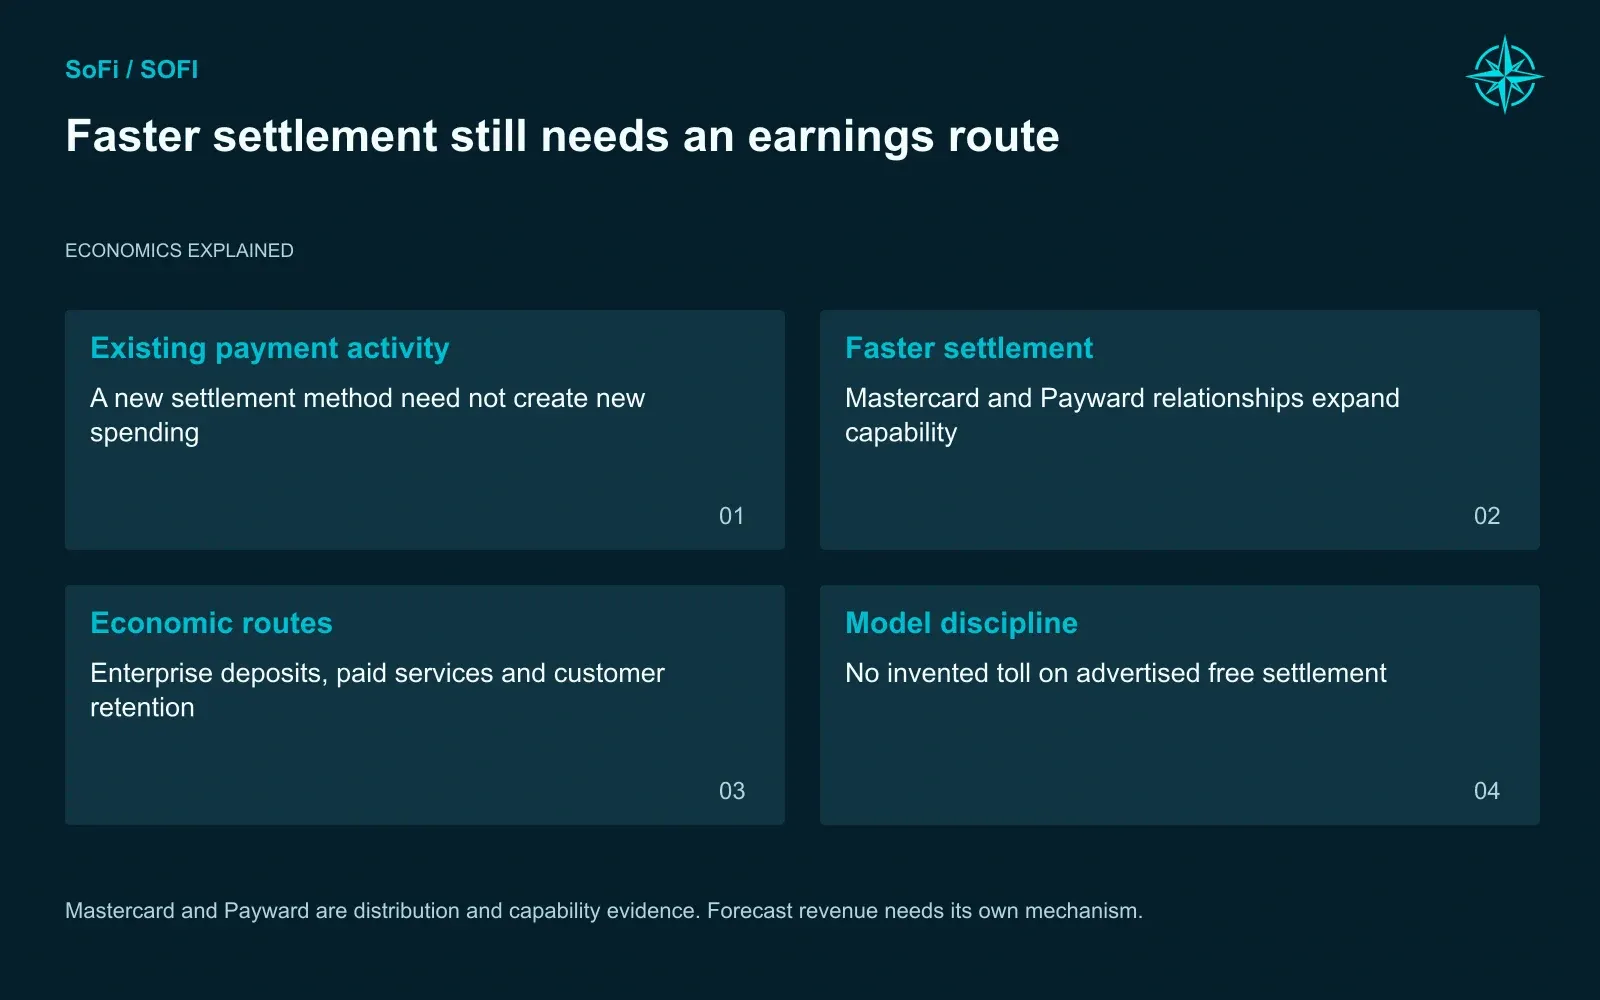
Mastercard and Payward are distribution and capability evidence. Forecast revenue needs its own mechanism.
The reserves behind the stablecoin are held apart from lending money. SoFiUSD itself is not a deposit and carries no FDIC or SIPC insurance.
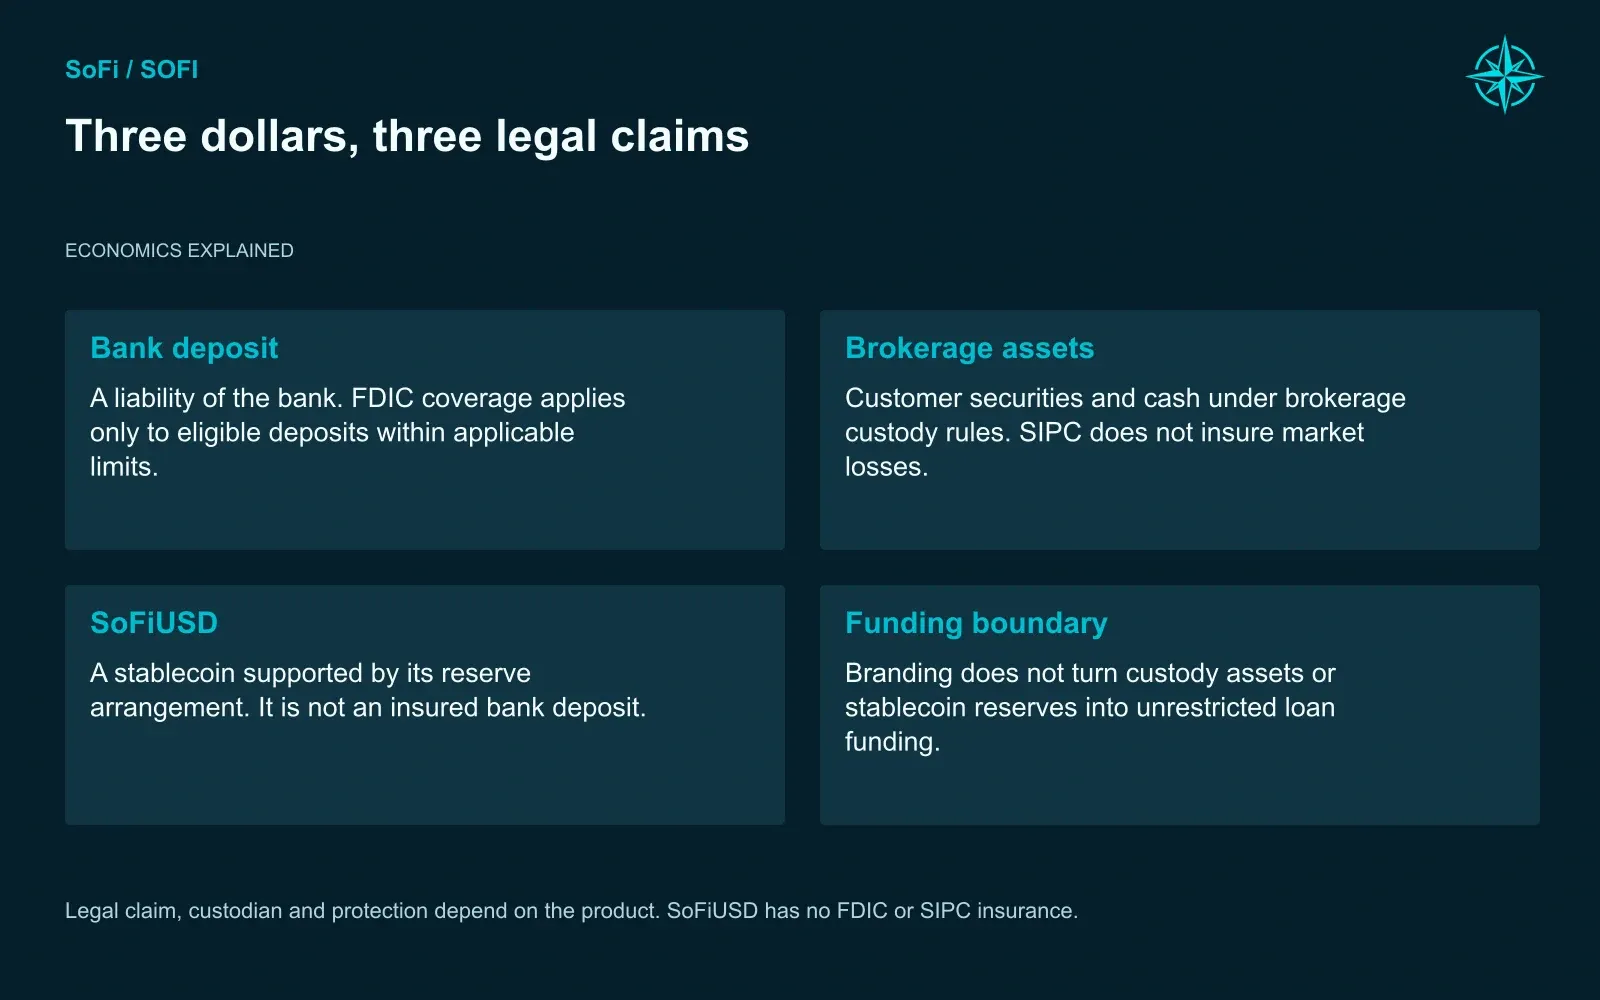
Legal claim, custodian and protection depend on the product. SoFiUSD has no FDIC or SIPC insurance.
Taken together, the newer businesses are a meaningful option and a modest share of our 2030 earnings. The investment case still lives or dies on lending, deposits, and relationships.
Payward partnership, Mastercard settlement launch, and SoFiUSD terms.
Where the Margin Comes From
Our Base produces a 31.3% net income margin by 2030, measured on average revenue and earnings. Management's own long-term target is 25% to 30%. We are asking for more than the company promises, so we owe an explanation.
The explanation is scale:
Base case | 2026 | 2030 |
|---|---|---|
Revenue | $5.02 billion | $14.14 billion |
Operating costs, excluding stock compensation and depreciation | $3.34 billion | $6.65 billion |
Revenue nearly triples while those costs roughly double. SoFi keeps spending heavily. Each new dollar of revenue simply costs less to earn when it comes from an existing member and runs through technology and servicing teams built before the demand arrived.
Some of that spending is harder to see than it looks. SoFi capitalizes the commissions it pays to open accounts and expenses them over time, so cash leaves before the cost shows up in earnings. The first half carried about $30.5 million of that amortization, and software development works the same way through capitalized salaries.
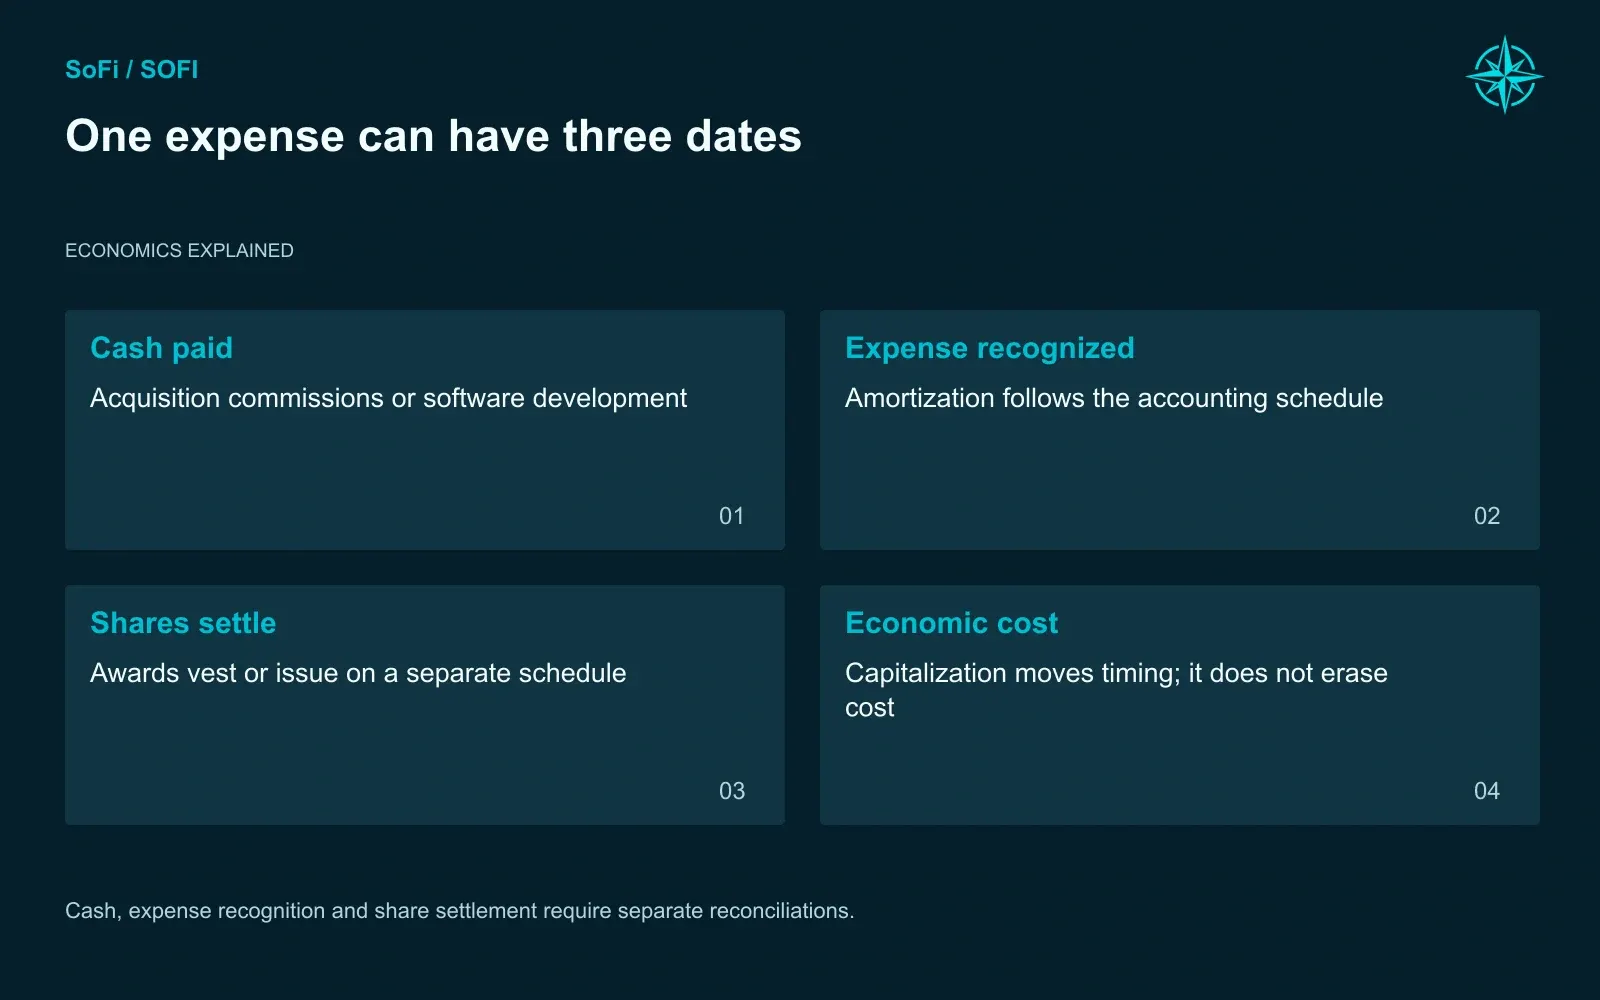
Cash, expense recognition and share settlement require separate reconciliations.
By 2030 our Base carries these costs:
Base case, 2030 | Amount |
|---|---|
Stock compensation expense | about $753 million |
Stock compensation, capitalized | $162 million |
Depreciation and amortization | $631 million |
Cash capital spending | $615 million |
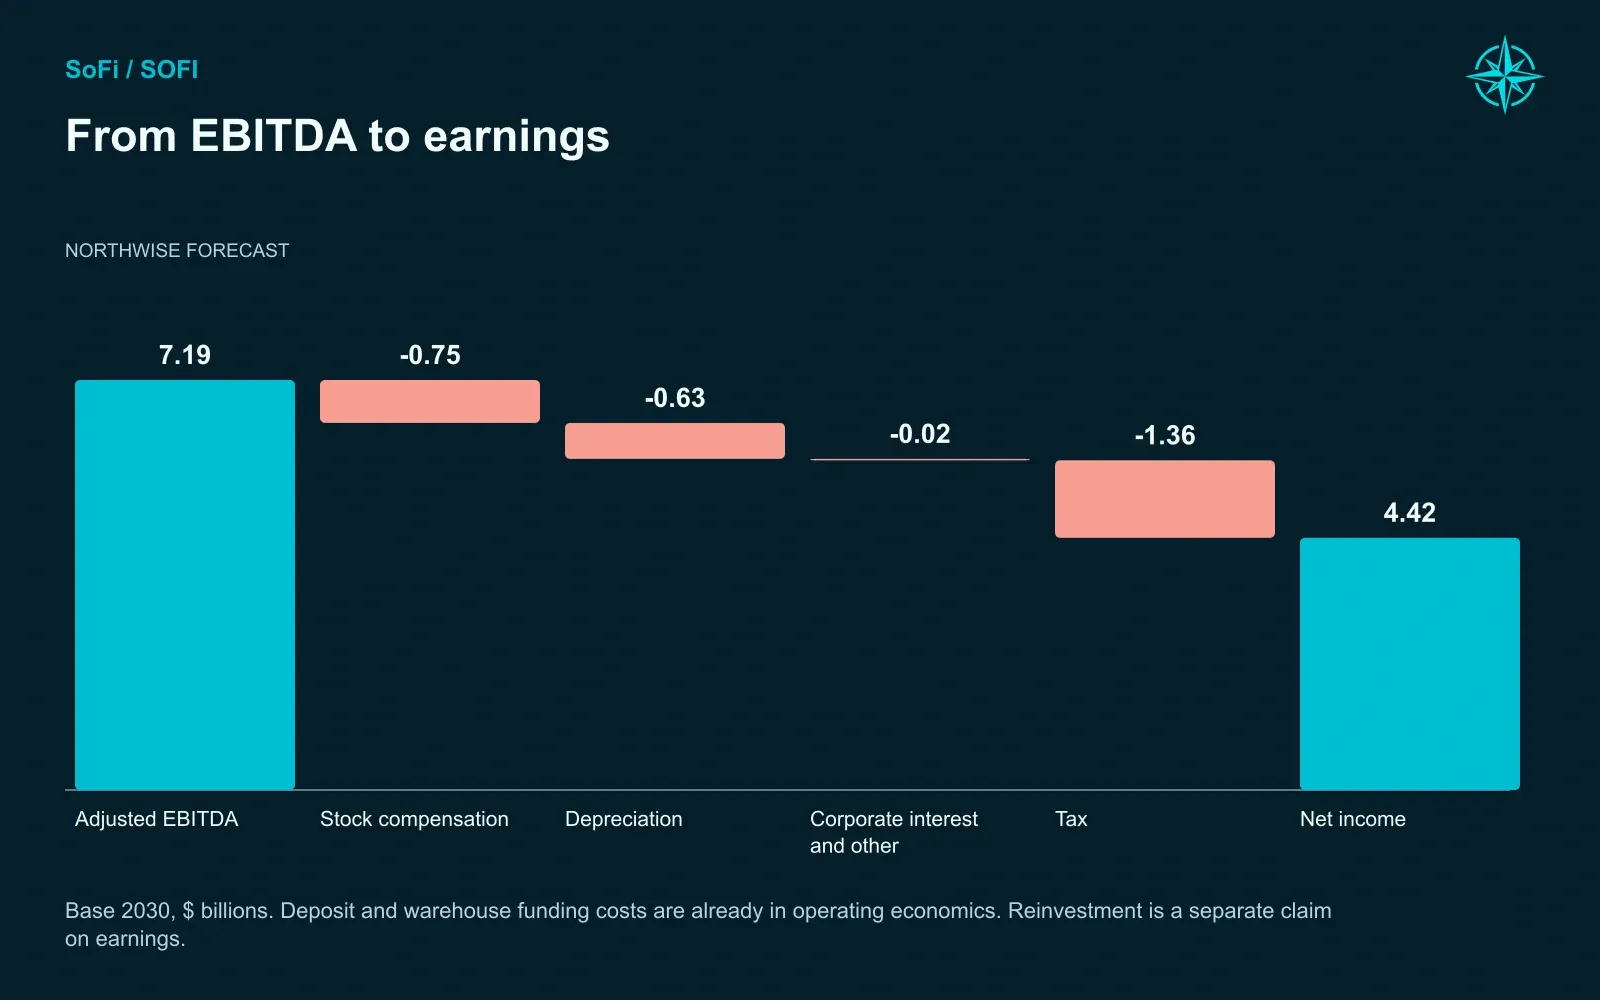
Base 2030, $ billions. Deposit and warehouse funding costs are already in operating economics. Reinvestment is a separate claim on earnings.
We apply a 23.5% tax rate in profitable years.
The margin has to be earned every year. A 5% cost overrun in 2030 alone would erase about $255 million of after-tax profit before any financing response.
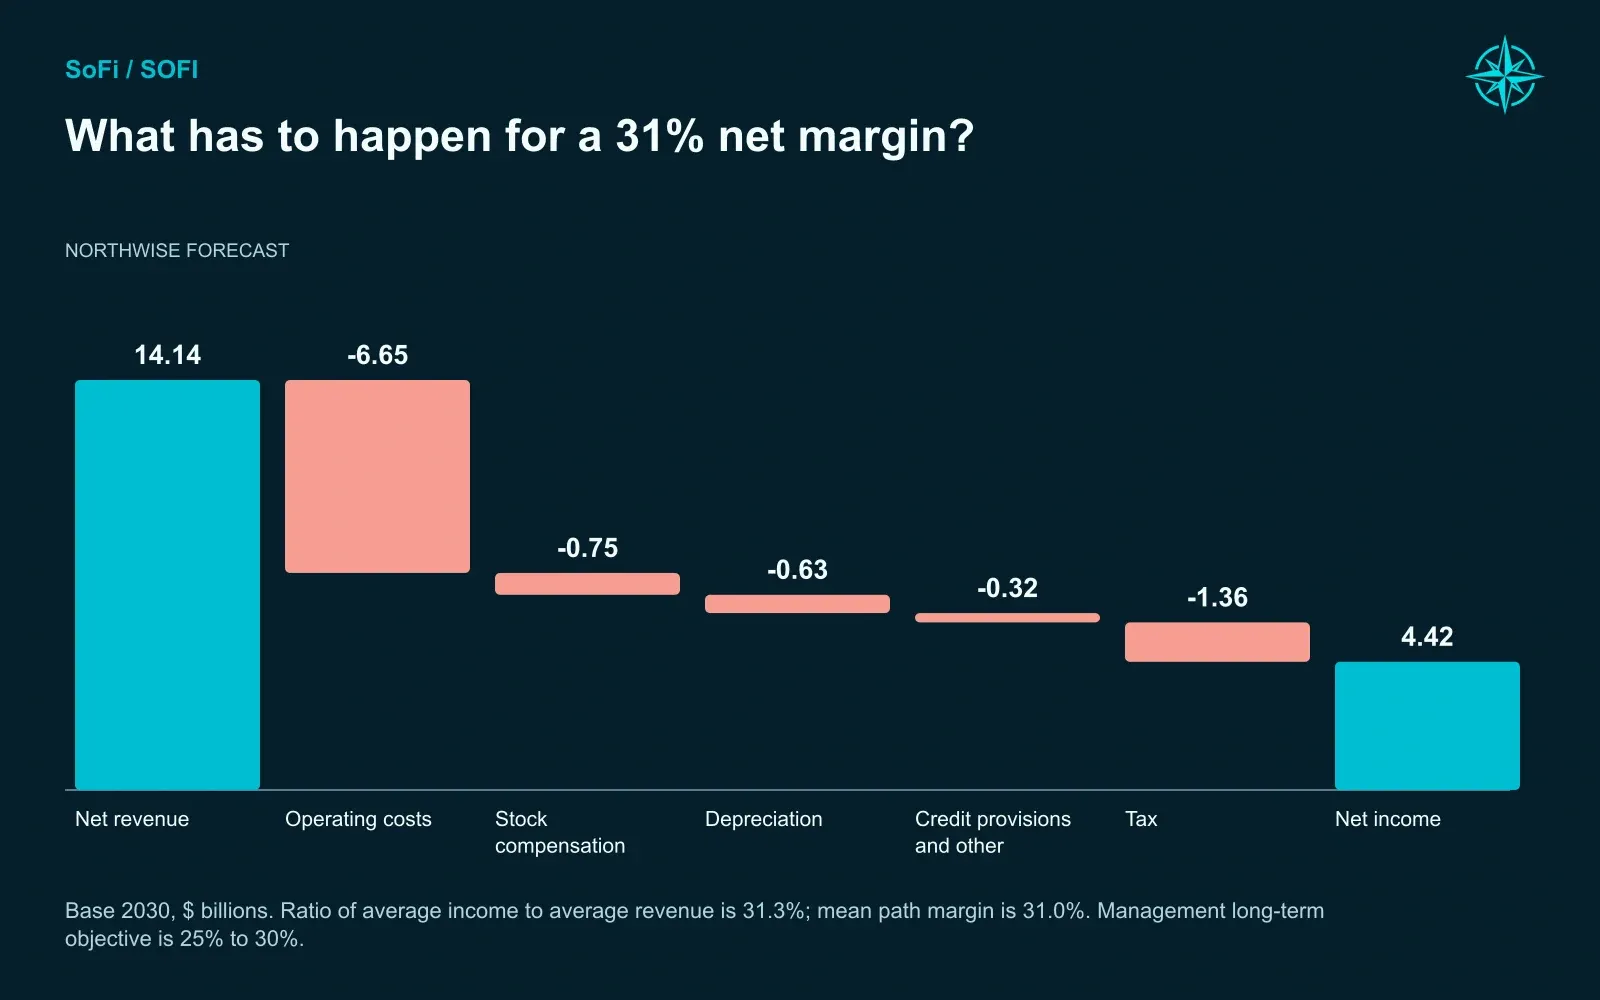
Base 2030, $ billions. Ratio of average income to average revenue is 31.3%; mean path margin is 31.0%. Management long-term objective is 25% to 30%.
The Base Case, Year by Year
Here is how the pieces combine in our Base case.
Base case | 2026 | 2027 | 2028 | 2029 | 2030 |
|---|---|---|---|---|---|
Members, millions | 18.15 | 22.72 | 28.23 | 34.91 | 42.96 |
Personal loan originations, $B | 41.00 | 51.72 | 64.29 | 80.00 | 100.26 |
Plus subscribers, millions | 0.58 | 1.20 | 2.03 | 3.20 | 4.52 |
Brokerage assets, $B | 18.00 | 23.91 | 31.33 | 41.86 | 56.35 |
Net interest income, $B | 3.234 | 4.322 | 5.559 | 6.836 | 8.574 |
LPB revenue, $B | 0.668 | 1.010 | 1.484 | 2.082 | 2.652 |
Lending noninterest income, $B | 0.509 | 0.028 | (0.464) | (0.149) | 0.492 |
Total revenue, $B | 5.021 | 6.217 | 7.798 | 10.518 | 14.139 |
Adjusted EBITDA, $B | 1.640 | 2.295 | 3.058 | 4.757 | 7.188 |
Net income, $B | 0.798 | 1.066 | 1.412 | 2.739 | 4.421 |
Diluted EPS | $0.59 | $0.76 | $0.98 | $1.85 | $2.90 |
Revenue compounds at about 29.5% a year from 2026 to 2030. Earnings compound faster as SoFi grows into costs it has already taken on. The inflection comes in 2029, when revenue jumps 35% while operating costs grow about 20% and EPS nearly doubles.
The dip into negative lending noninterest income in 2028 and 2029 can look alarming. That line mixes origination and servicing fees with credit losses and fair value changes, while the interest earned on the same loans sits separately in net interest income. The Base figures also average in paths where a recession lands in those years, which weighs on this line more than any other.
The Base is the middle of a wide range:
2030 outcome | Bear | Base | Bull |
|---|---|---|---|
Probability | 26.9% | 50.8% | 22.3% |
Revenue, $B | 9.70 | 14.14 | 19.18 |
Adjusted EBITDA, $B | 3.87 | 7.19 | 10.39 |
Net income, $B | 1.92 | 4.42 | 6.78 |
Diluted EPS | $1.26 | $2.90 | $4.49 |
Return on tangible common equity | 10.3% | 21.0% | 27.0% |
The Bear is still a large and growing bank, with revenue nearly doubling to $9.70 billion. Its problem is weak returns, and we think that is the most realistic way SoFi disappoints. The Bull combines faster adoption with better credit and cheaper funding. It gets no help from share buybacks to inflate earnings per share.
Capital Is the Speed Limit
A bank can't pay out everything it earns and keep growing. Regulators require it to hold a cushion of shareholder equity against its loans and other assets. The core measure of that cushion is common equity tier 1 capital, or CET1.
We hold SoFi to 13% CET1 at the parent company and 12.5% at the bank. Both targets sit comfortably above regulatory minimums. That requirement turns the balance sheet from a byproduct of the forecast into one of its main constraints.
Base balance sheet, $B | 2026 | 2028 | 2030 |
|---|---|---|---|
Loans | 57.90 | 95.73 | 147.46 |
Cash, including reserves | 3.33 | 8.58 | 27.66 |
Total assets | 70.94 | 118.26 | 197.81 |
Deposits | 53.42 | 93.07 | 160.99 |
Debt | 4.54 | 5.79 | 1.81 |
Shareholders' equity | 11.76 | 15.69 | 24.97 |
Tangible common equity | 10.18 | 14.22 | 23.55 |
The assets nearly triple and equity roughly doubles. Deposits do almost all of the funding, and debt shrinks. The $27.66 billion of 2030 cash looks like a war chest. Most of it is spoken for by stablecoin reserves, operating liquidity, restricted funds, and parent company needs.
Cash flow can mislead in both directions. SoFi's first-half cash flow statement showed more than $6 billion flowing out of operations while the company reported a profit, mostly the cost of funding new loans. Reading that as tech-company cash burn misunderstands the business. Treating every dollar of profit as money that could be returned to shareholders misunderstands it just as badly.
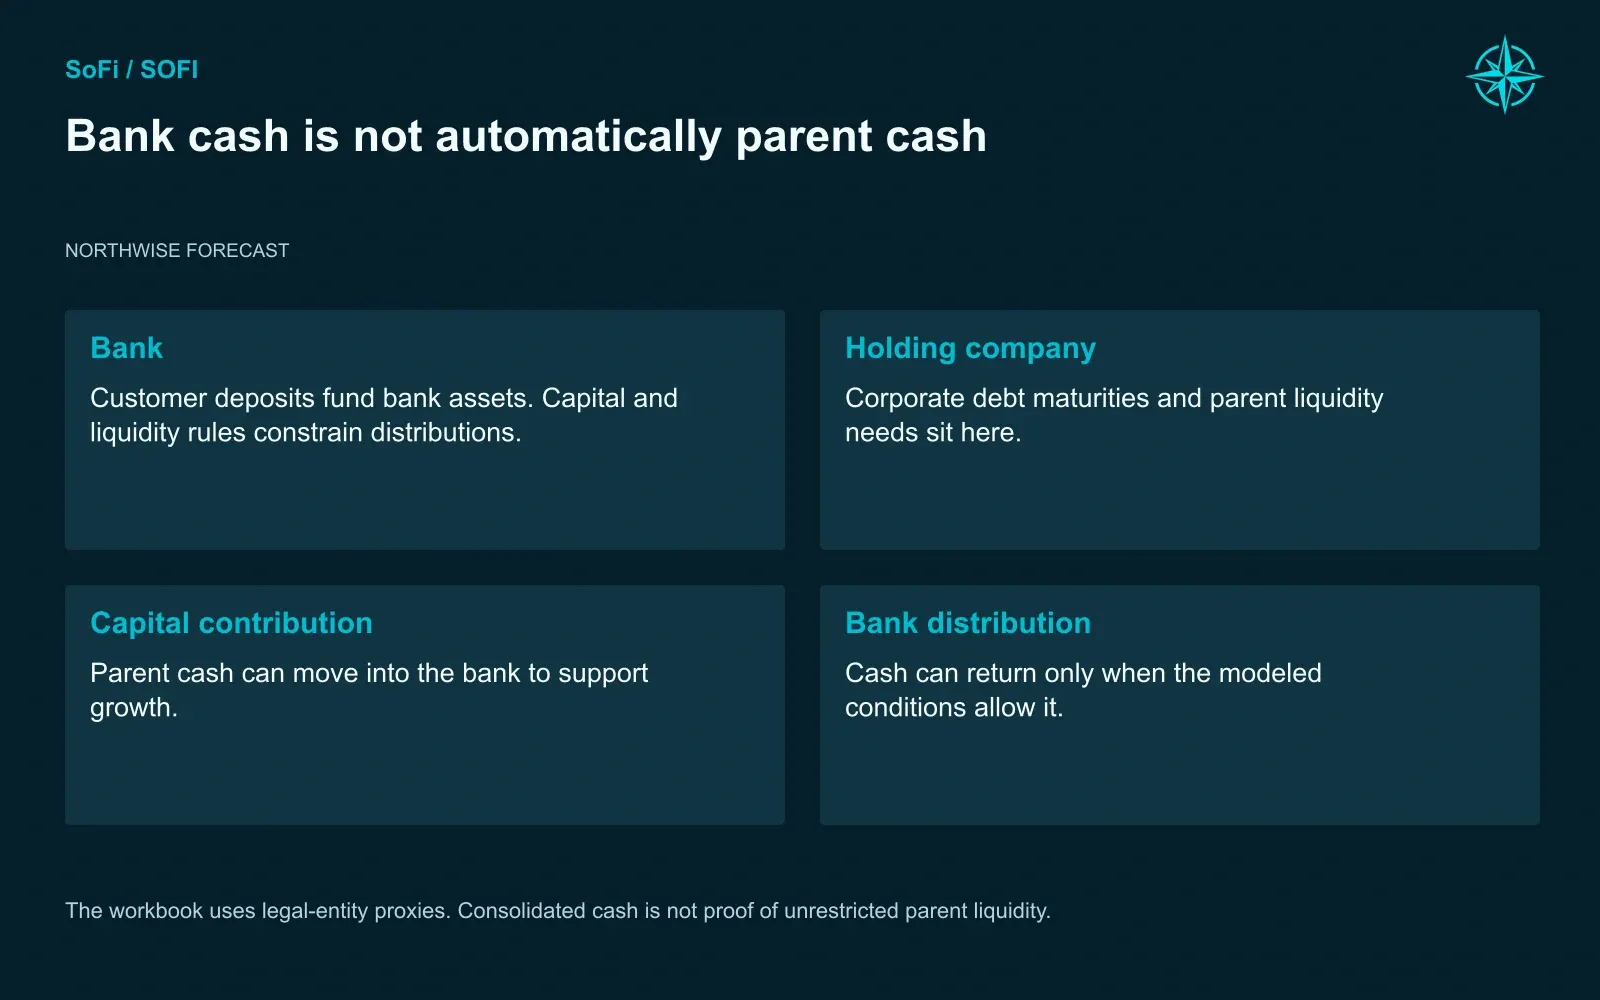
The workbook uses legal-entity proxies. Consolidated cash is not proof of unrestricted parent liquidity.
The financing plans incorporate more loan distribution where buyers exist, reduced optional retention, borrowing within assumed limits and finite equity issuance. These are fixed, editable schedules for each path. Changing an assumption does not automatically reoptimize them, so financing and capital checks must be reviewed again after an edit.
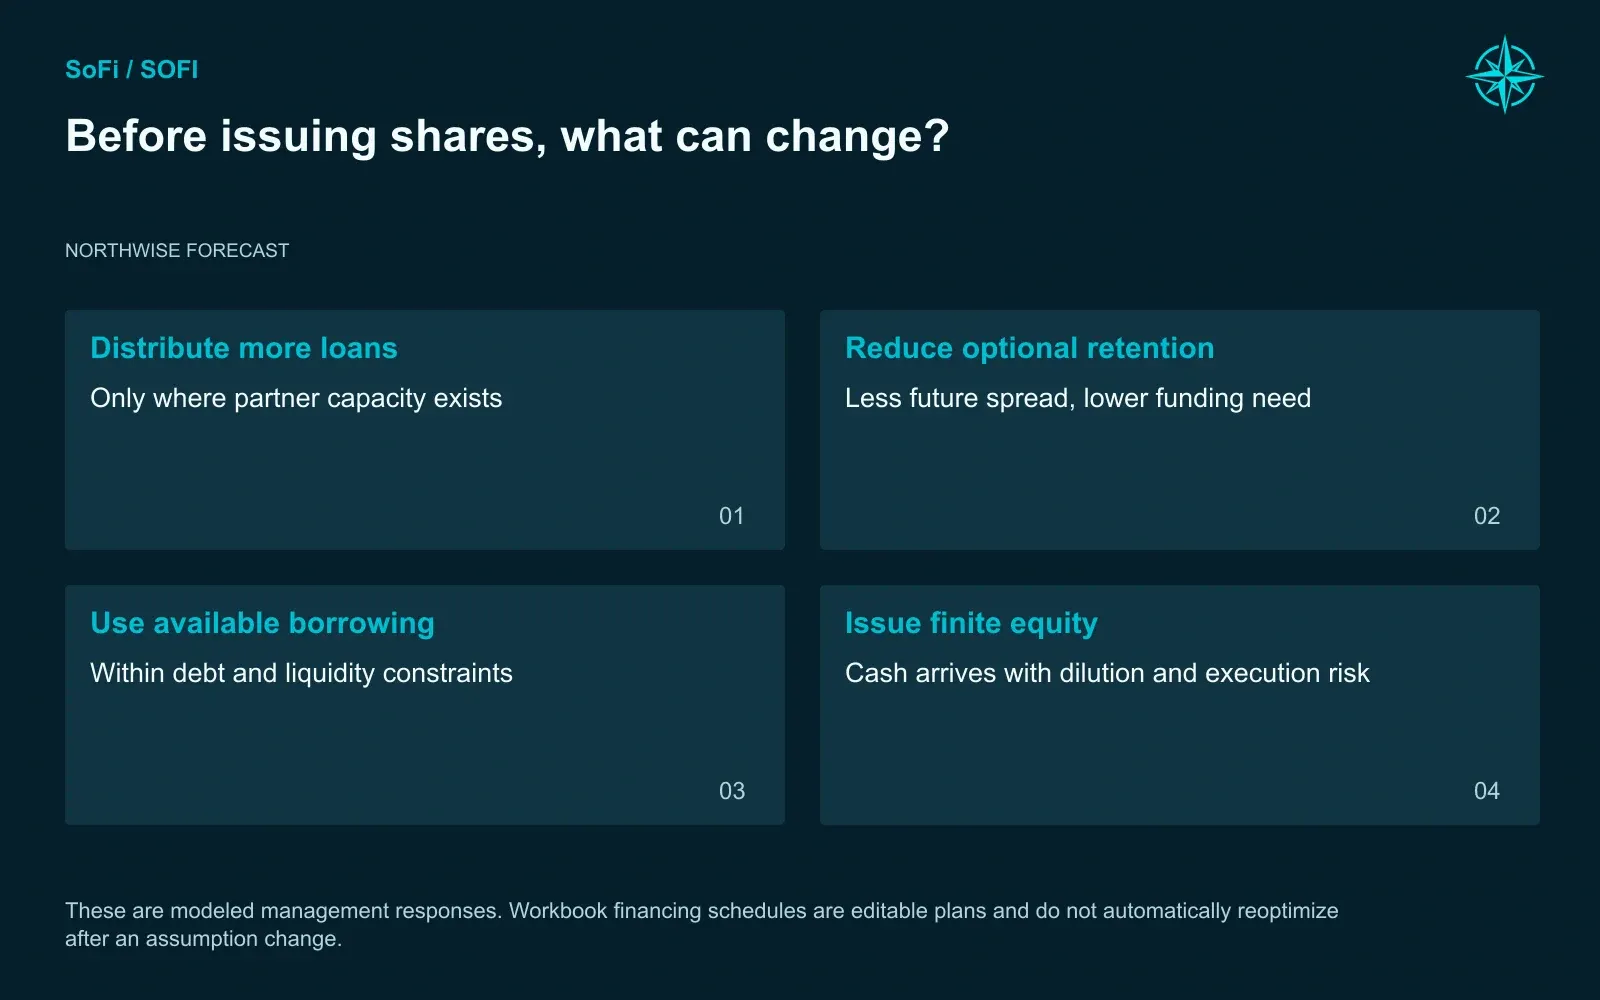
These are modeled management responses. Workbook financing schedules are editable plans and do not automatically reoptimize after an assumption change.
Even with those levers, all three scenarios need some new equity between 2027 and 2030:
Scenario | Additional equity, 2027 to 2030 |
|---|---|
Bear | about $793 million |
Base | $672 million |
Bull | $569 million |
SoFi has announced no such raises. Management says its current medium-term plan is self-funded, and our longer, more aggressive growth paths are a different plan with their own math.
The scenarios diverge most sharply on capital. The Bear ends 2030 with $6.84 billion of debt and a 10.3% return on equity. The Bull carries a much larger loan book, funds it with $229.03 billion of deposits and only $0.49 billion of debt, and earns 27.0%. The difference comes less from how many customers SoFi wins than from how cheaply their money funds the business.
Size brings its own costs. The Base passes $100 billion of assets at the end of 2028, a threshold where regulators begin to expect more of a bank. The exact timing of new rules depends on average assets and transition periods. We add scale-related costs and liquidity requirements anyway, and we give no credit for unused credit lines, which the relevant Federal Reserve liquidity rule excludes over horizons of 30 days or less.
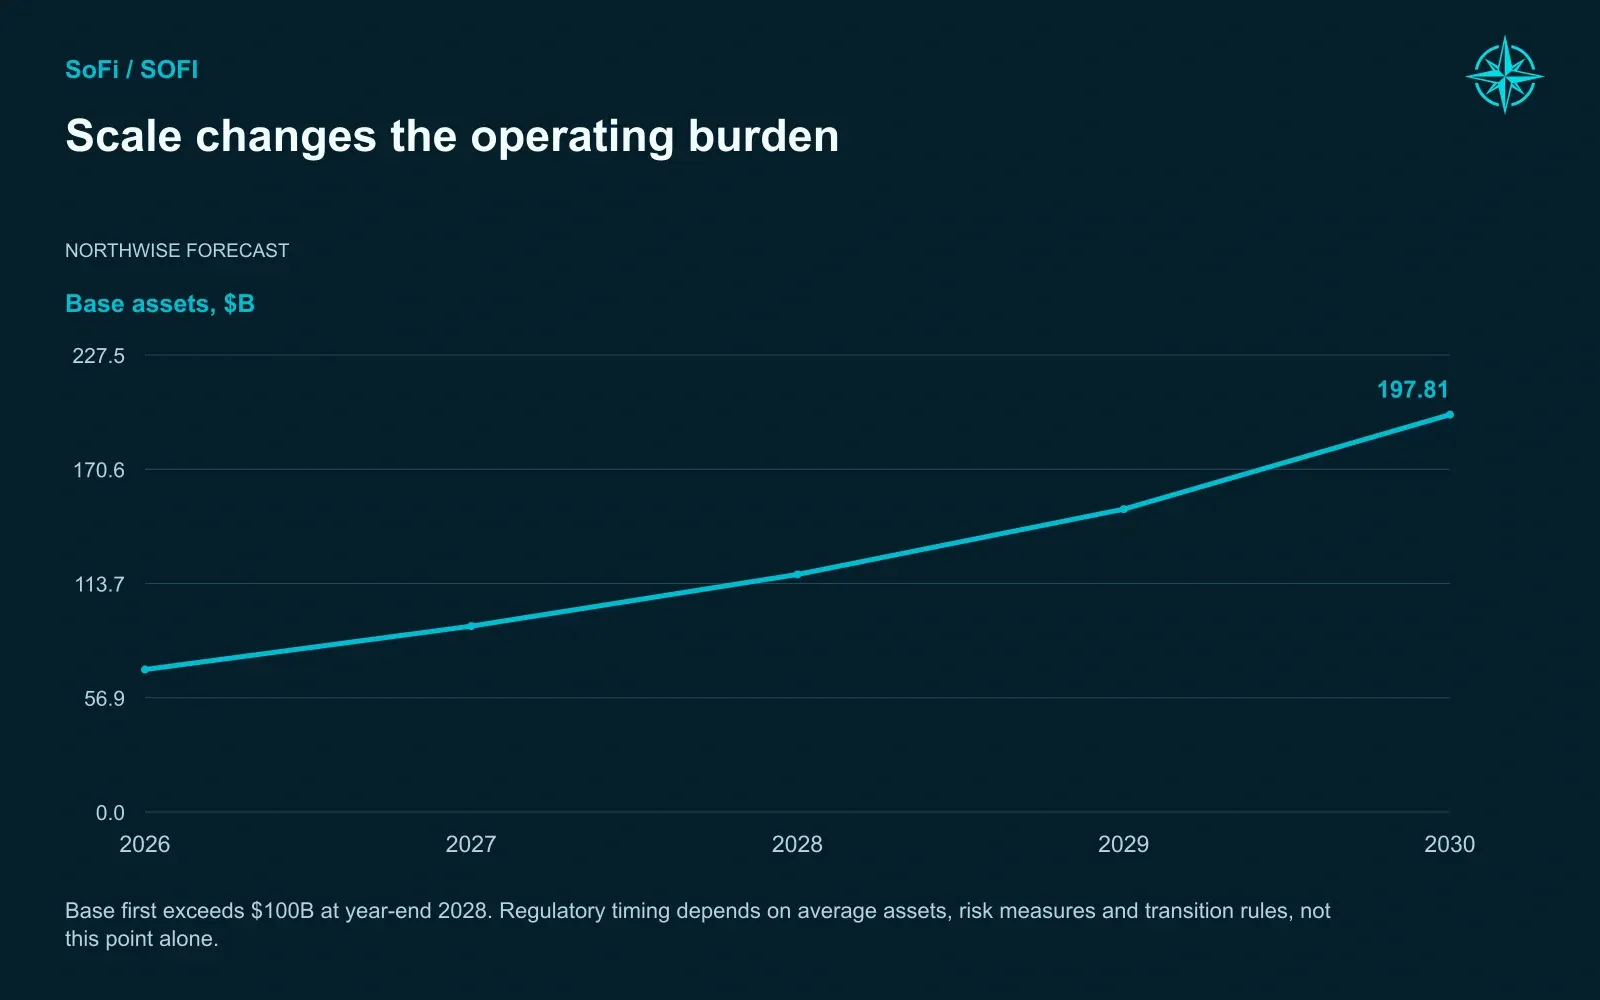
Base first exceeds $100B at year-end 2028. Regulatory timing depends on average assets, risk measures and transition rules, not this point alone.
Federal Reserve liquidity guidance.
Counting the Shares
The easiest way to flatter a growth forecast is to hold the share count still. SoFi's won't hold still.
Base ownership | 2026 | 2028 | 2030 |
|---|---|---|---|
Ordinary shares, billions | 1.305 | 1.396 | 1.525 |
Shares including award claims, billions | 1.369 | 1.456 | 1.580 |
Book value per share | $9.01 | $11.25 | $16.41 |
Tangible book value per share | $7.80 | $10.20 | $15.47 |
The ordinary share count grows about 17% over four years, roughly 4% a year. Stock compensation drives most of it. In the first half alone, SoFi granted 17.71 million restricted stock units at an average value of $18.01 and 2.09 million performance units at $20.76.
We assume $700 million of new awards each year and track each grant as it is expensed and as it vests. We also count employee purchase plans, options, stock issuance, and convertible bonds.
The convertibles need their own note. SoFi owes about $428 million of convertible principal in 2026 and $862.5 million in 2029, along with a $486 million credit facility due in 2028. We assume the convertible principal is repaid in cash and the facility is refinanced. Capped call contracts limit the dilution from conversion, though only up to certain share prices, and repaying principal in cash doesn't by itself mean zero new shares.
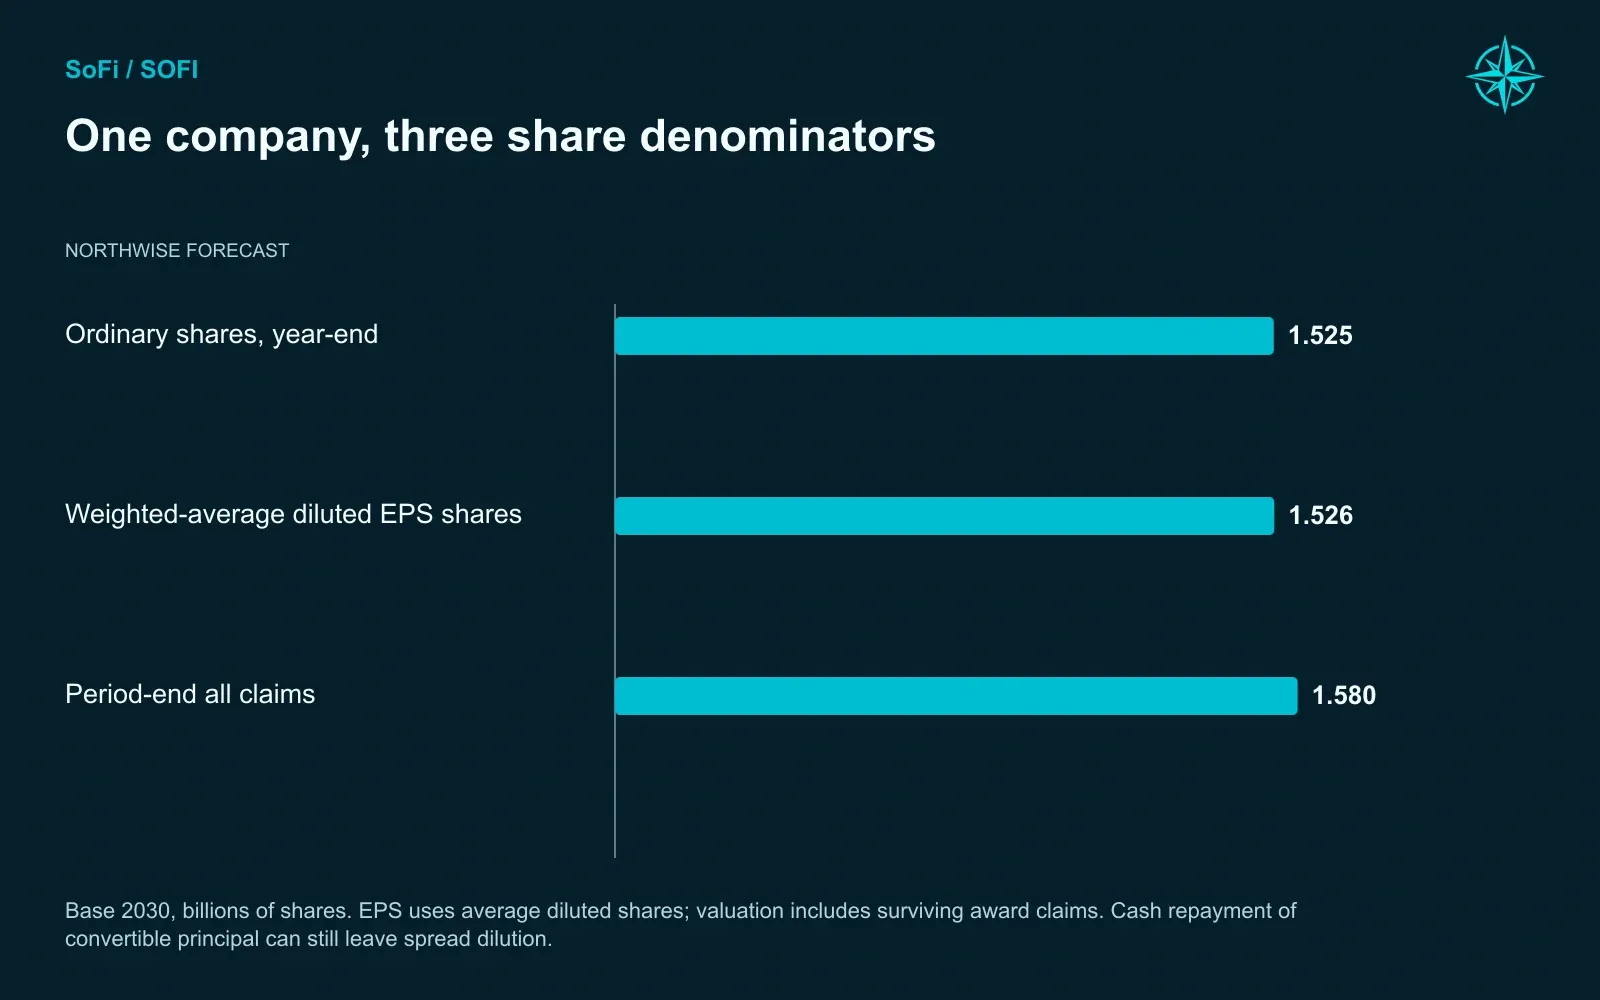
Base 2030, billions of shares. EPS uses average diluted shares; valuation includes surviving award claims. Cash repayment of convertible principal can still leave spread dilution.
We assume no dividends and no buybacks through 2030. Even so, book value per share nearly doubles, and it does so after absorbing all that dilution.
162 Futures
A single forecast can't capture a company whose results depend on both customer adoption and the timing of a credit cycle. We built a probability tree instead.
The top layer is the economy:
- a resilient economy gets 55% weight
- a recession gets 30%, split evenly across a 2027, 2028, 2029, or 2030 start
- persistent inflation with funding pressure gets 15%
Within each environment, SoFi's customer adoption can go slower, steady, or faster, with odds that shift depending on the economy:
Economy | Slower adoption | Sustained scaling | Breakout adoption |
|---|---|---|---|
Resilient | 16% | 56% | 28% |
Recession | 38% | 47% | 15% |
Inflation and funding pressure | 50% | 40% | 10% |
Technology revenue and digital adoption then vary depending on how strong the franchise is. That produces 162 complete versions of SoFi's next four years, each run through the full model. We then sort them into three groups:
Group | Paths | Probability | What defines it |
|---|---|---|---|
Bear | 61 | 26.9% | 2030 return on equity below 15%, or net income below $2 billion |
Base | 72 | 50.8% | Everything between Bear and Bull |
Bull | 29 | 22.3% | Return on equity of at least 25% with revenue growth of at least 30% a year |
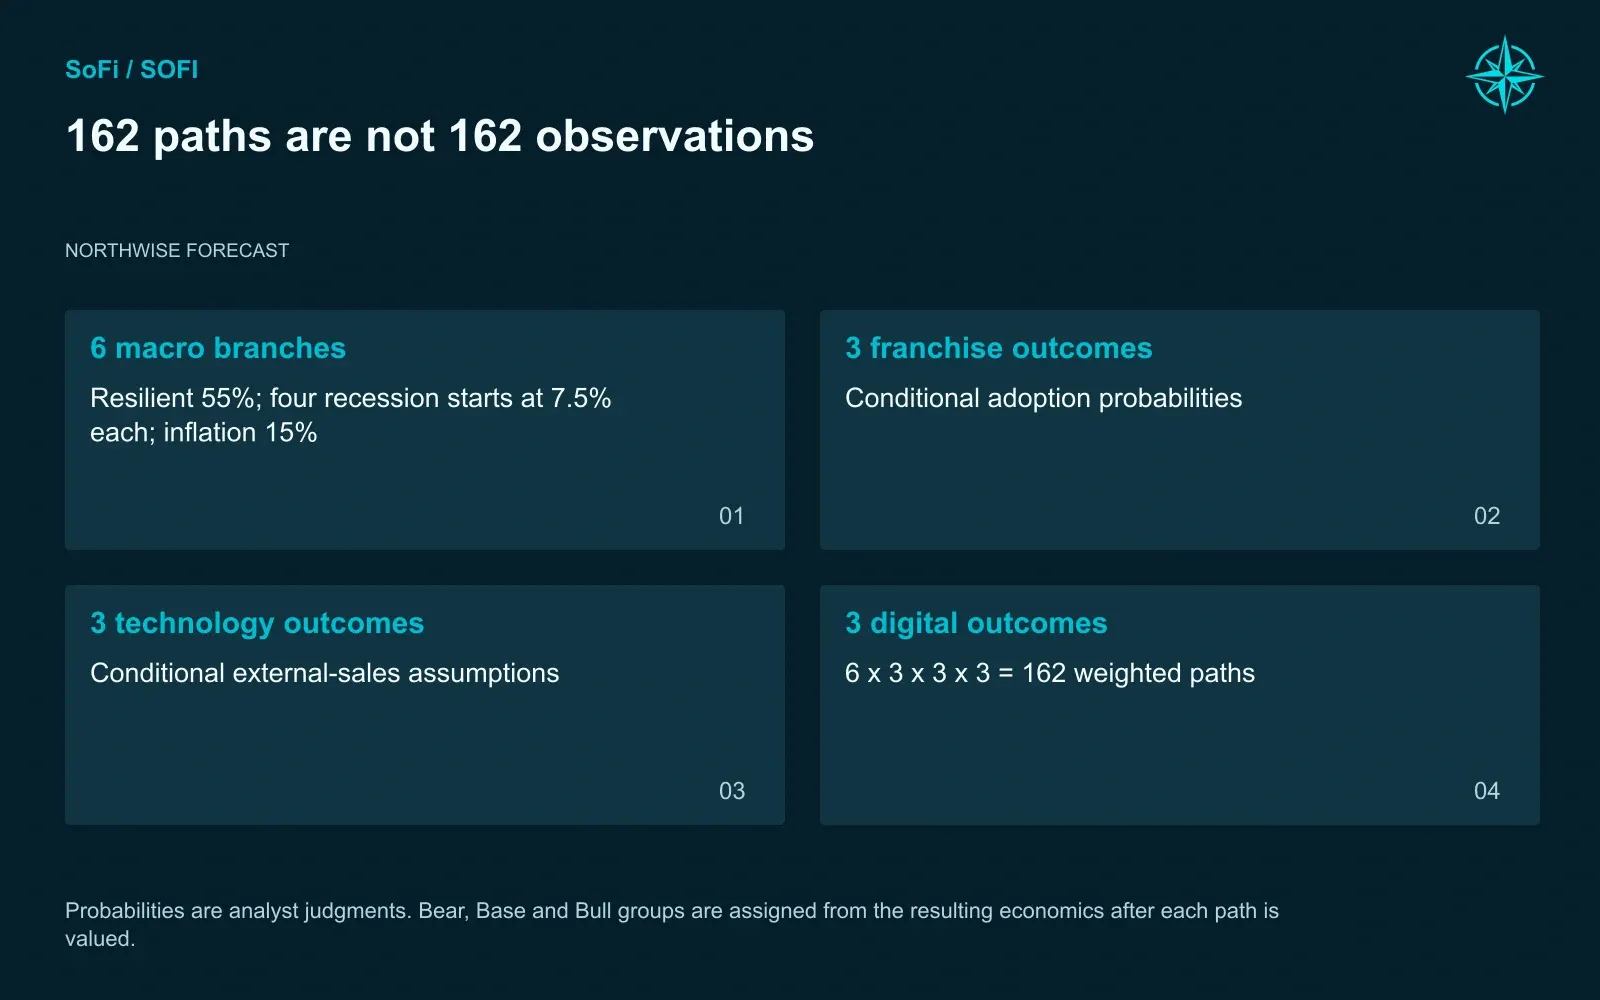
Probabilities are analyst judgments. Bear, Base and Bull groups are assigned from the resulting economics after each path is valued.
The math is exact, and the inputs are judgment calls. Every weight in the tree is our assessment of the evidence, and running more combinations doesn't turn opinions into statistics. We publish the weights so you can argue with them.
How It Breaks
A bank can grow into its forecast and still take a painful route getting there. The timing of losses changes how much profit gets retained, how much funding is needed, and how much stock must be sold before things improve.
To isolate each risk, we took one strong path and broke it in one place at a time. That path assumes a resilient economy with steady customer growth, and it earns $5.21 billion in 2030, above the Base average.
Stress test | 2030 net income | New equity needed through 2030 |
|---|---|---|
No stress | $5.21B | $0.32B |
Personal loan losses up 1 point | 4.59 | 0.68 |
Personal loan losses down 0.5 point | 5.53 | 0.00 |
Retail deposit rates up 0.5 point | 4.66 | 0.70 |
Retail deposit rates down 0.5 point | 5.78 | 0.00 |
LPB fees down 0.5 point | 4.96 | 0.55 |
Operating costs up 5% | 4.93 | 0.68 |
Member growth 5 points slower each year | 4.65 | 0.00 |
Technology revenue flat | 4.97 | 0.44 |
Several adverse conditions together | 3.87 | 2.46 |
Several favorable conditions together | 6.38 | 0.00 |
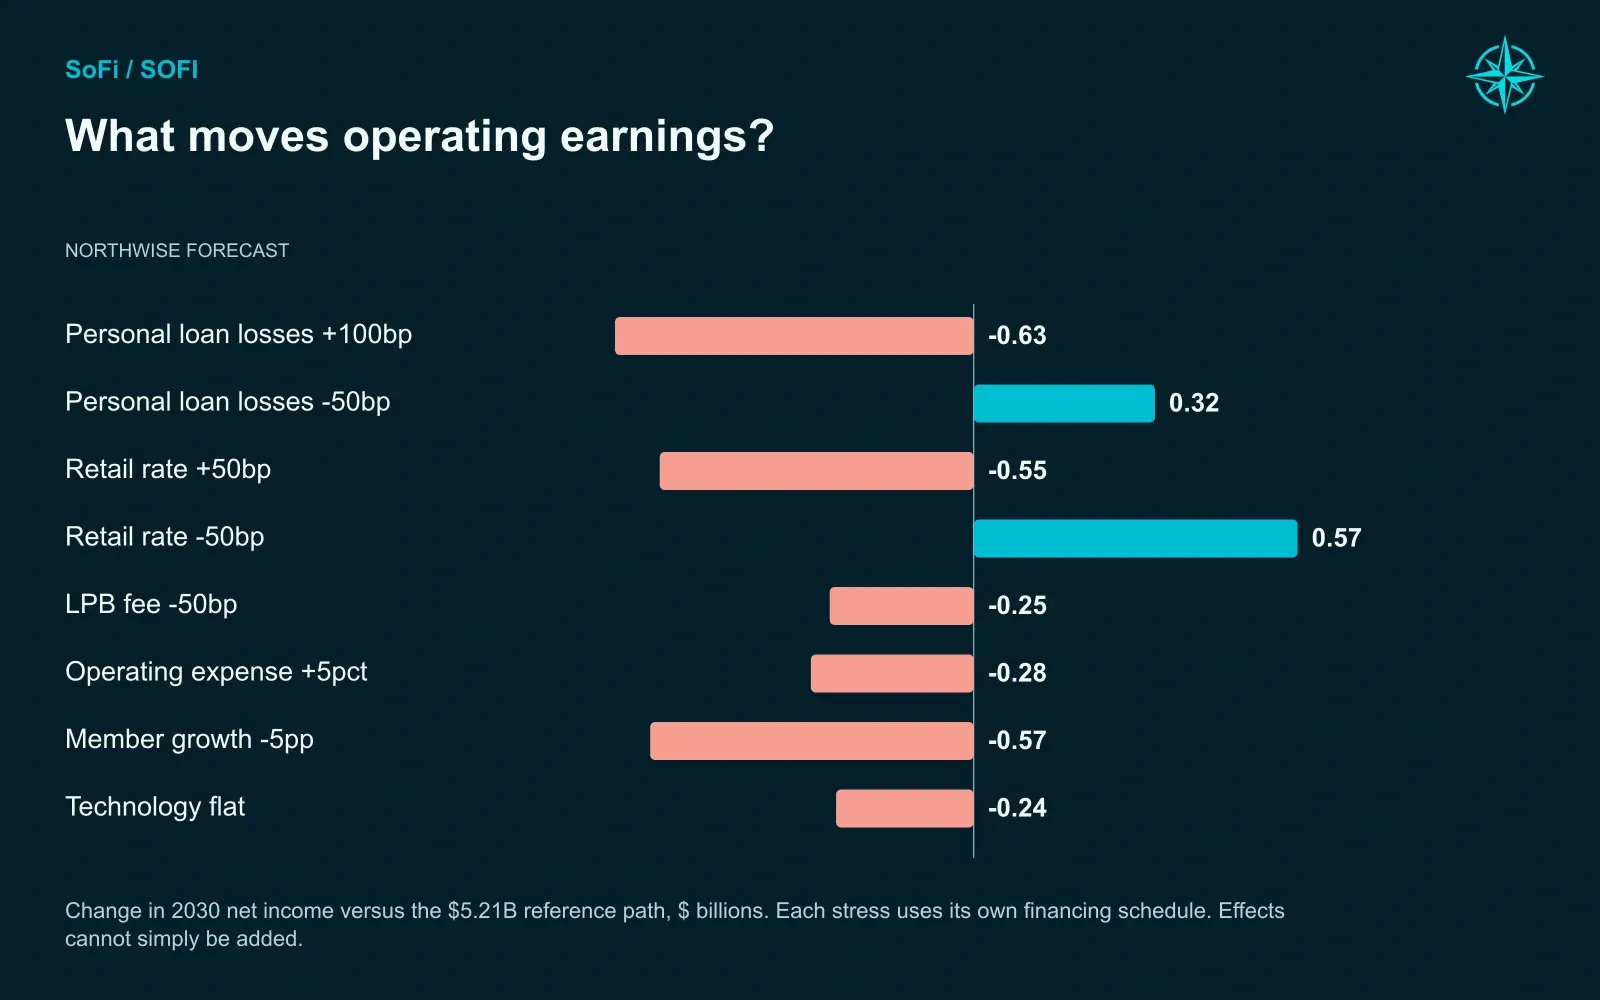
Change in 2030 net income versus the $5.21B reference path, $ billions. Each stress uses its own financing schedule. Effects cannot simply be added.
The damaging cases are ordinary ones. Slightly more expensive deposits, thinner loan sale fees, and some cost creep together remove about a quarter of 2030 earnings. They also push the need for new equity to $2.46 billion.
The upside is just as revealing. Better credit or cheaper deposits alone eliminate the need for new equity, with no help from faster customer growth.
Recession timing produces the widest swings. A downturn starting in 2027 still leaves $4.33 billion of 2030 earnings, while one starting in 2029 leaves only $1.73 billion. An early recession hits a smaller loan book and leaves time to recover. A late one lands on a much bigger book, just before the year we are valuing.
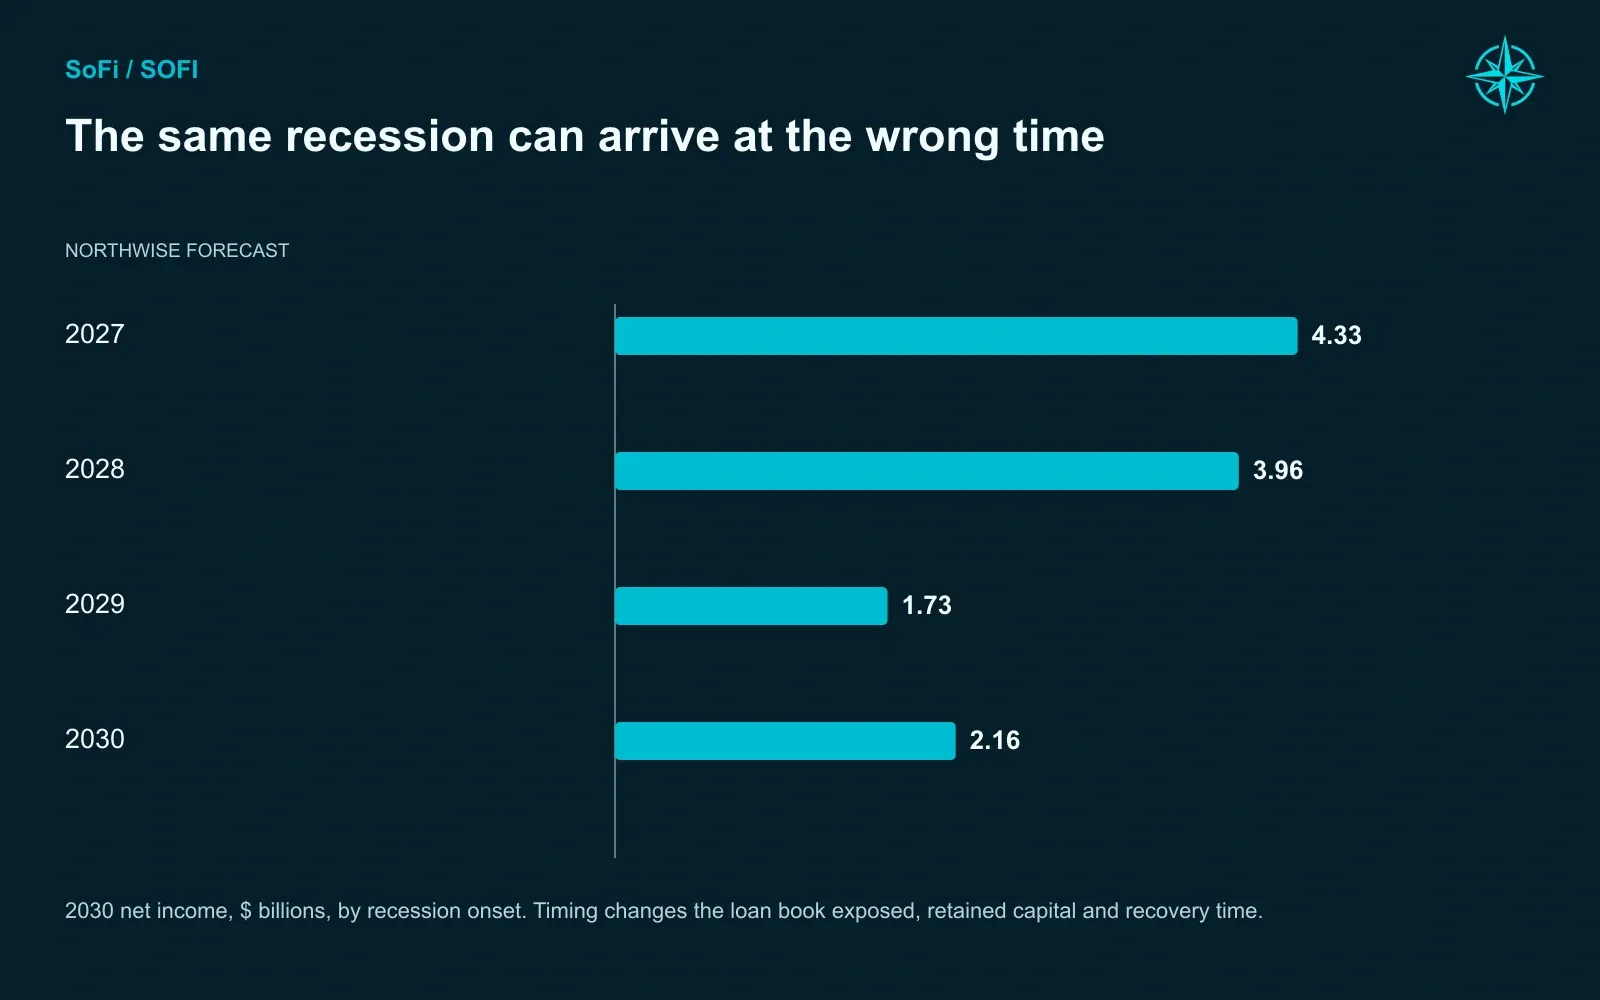
2030 net income, $ billions, by recession onset. Timing changes the loan book exposed, retained capital and recovery time.
The harshest test removes access to new stock sales entirely. SoFi then breaches its own capital or liquidity targets even after cutting lending, and a positive consolidated profit doesn't fix it. The company would need to shrink its balance sheet, change its capital policy, or find another source of funding. We don't assign an ordinary valuation to a plan that fails its own financing test.
What We're Watching
The bear case needs something to break, and it doesn't take a collapse for that to happen. Four developments would change our view:
- perks that buy activity without profit
- deposits that stay expensive
- loan buyers who step back
- dilution that outpaces earnings
The bull case needs four things to keep holding, and each one shows up in SoFi's quarterly reports:
- members bringing real balances
- losses that stay low as loans age
- partners that keep buying at good prices
- earnings that grow faster than the capital and share count behind them
We think SoFi has a credible path to becoming an unusually profitable bank. The evidence of the last year points that way. The path is also narrower than either camp admits, and it runs straight through the same banking economics the platform camp would rather skip.
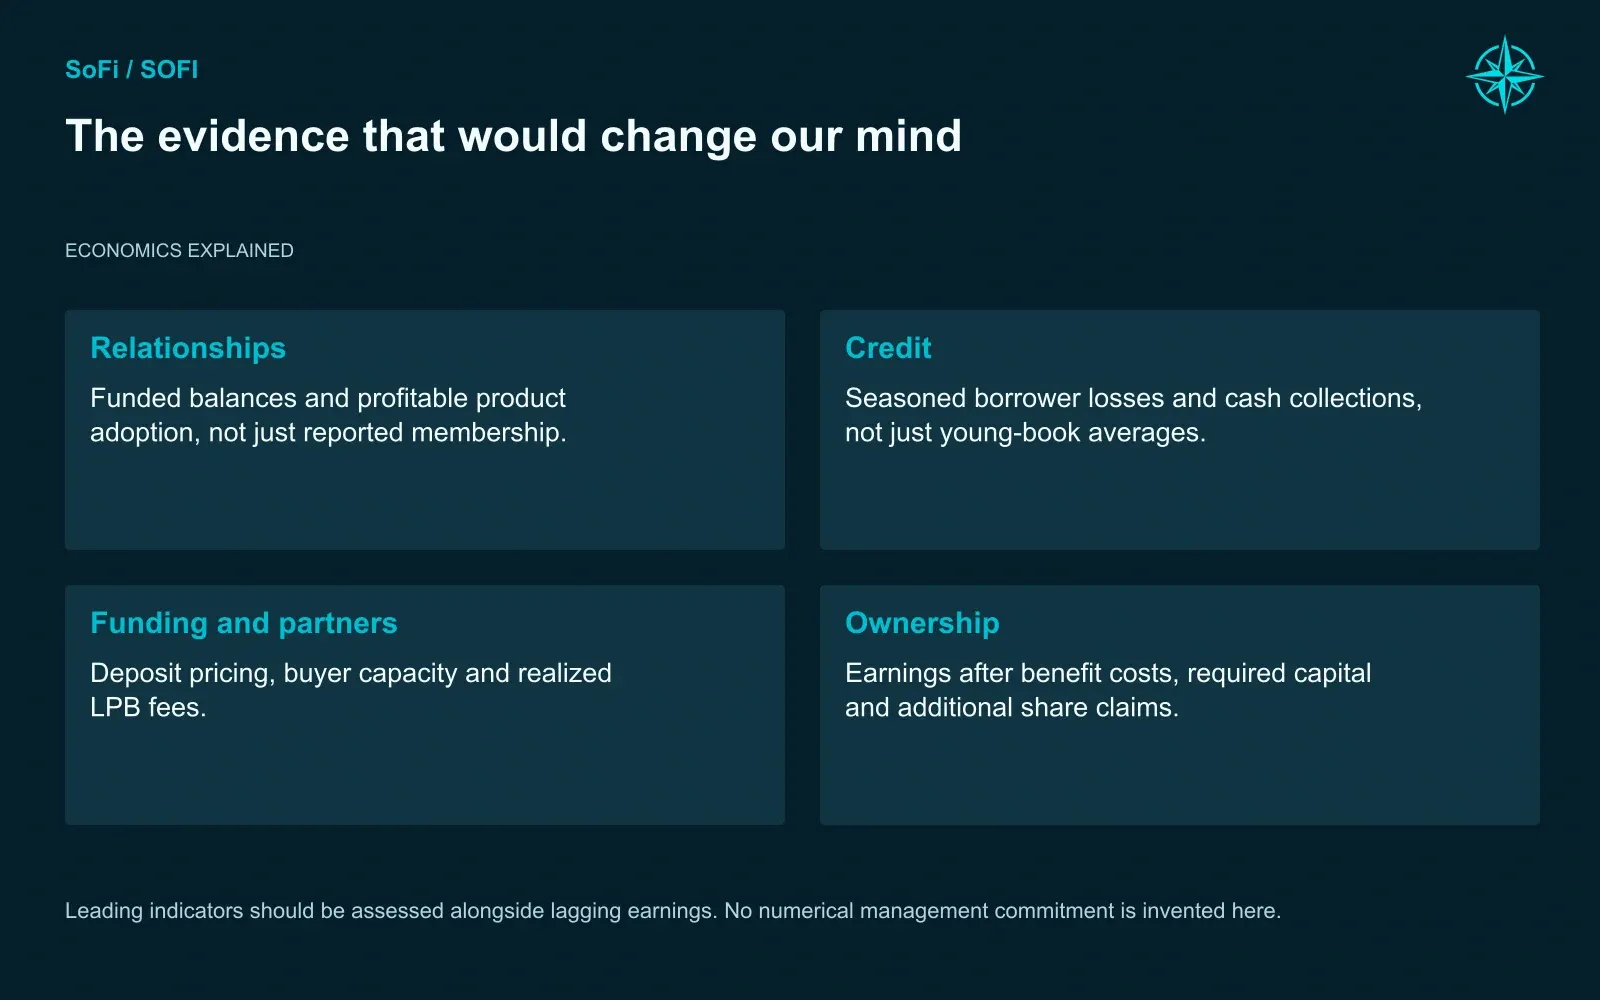
Leading indicators should be assessed alongside lagging earnings. No numerical management commitment is invented here.
Continue With Northwise Premium
Everything above explains how SoFi makes money, what it has to deliver by 2030, and where the story can fail. The premium section turns that into an investment decision. It sets out:
- what the business is worth once growth has taken its share of the capital
- why our three valuation methods disagree and what the gap reveals
- the full range of 2030 outcomes
- the most we would pay today for a defined annual return
Premium members also receive the complete editable model.
Northwise Premium
Choose how to continue with Northwise
Join Northwise Premium
Unlock the rest of this report, its complete valuation, the downloadable model, portfolios, and action framework.
Join Northwise PremiumCreate a Free Account
Continue across Free Northwise research, follow companies, save reports, and receive updates.
Create a Free Account
SoFi Stock Forecast 2030
SoFi stock forecast 2030 using book value, EPS, growth, margin, valuation, risk, and buy-zone analysis for long-term investors.

SOFI Q4 2025 Earnings
SOFI Q4 2025 earnings reports Friday premarket (Jan 30, 2026). We outline the key numbers, risks, and signals that matter heading into the call.
Sofi Stock Price Prediction
SoFi stock price prediction for 2026: why we believe this full-stack fintech could double as it builds a sticky, profitable platform. (Updated Dec 2025)
Northwise Portfolios
See how the research becomes real decisions
Reader discussion
Discuss the research
Premium access is required to join this report's discussion.
Join Northwise Premium
No comments yet. Start a thoughtful discussion.