IREN Stock Dilution: Can the Build Reach Shareholders?
IREN stock analysis of AI growth, funding and dilution through 2030. Read our full valuation, 27 scenarios and price zones free. Excel model is Premium.
In this article
We modeled every IREN site, contract, loan and share issuance month by month through 2030. The power is real and the demand is real. What remains open is how much of the company IREN is building will still belong to the people who own the stock today.
Two Analysts, One Filing
In the span of two weeks this September, two banks looked at the same IREN annual report and came away with very different answers. JPMorgan upgraded the stock with a $65 target, pointing to accelerating customer conversations and firmer pricing. Redburn initiated at Neutral with a $40 target and a revenue forecast well below our Base case.
The stock closed September at $40.88, almost exactly on Redburn's number. Eleven months earlier it traded at $76.87.
Something odd sits inside that decline. Over those same eleven months IREN signed the largest contracts in its history, began converting a 2 GW corridor in West Texas, and reported about $16.6B of contracted customer value. By almost any operating measure the company got stronger while the stock fell by nearly half.
The explanation lies in a question most coverage skips. Investors are not asking whether IREN can build. They are asking who will own the result once it is built, and on what terms.
We spent the past several weeks building a model to answer that question directly. It tracks each site, each deployment year, each type of customer, each loan and each share issuance from July 2026 through 2040, and we ran it across 27 combinations of delivery speed, commercial outcome and financing conditions. Some of what it found supports the bulls. Some of it supports Redburn. Most of it explains why both are partly right.
Sources: JPMorgan report, as reported by Blockspace, Redburn report, as reported by Blockspace.
The Company IREN Became
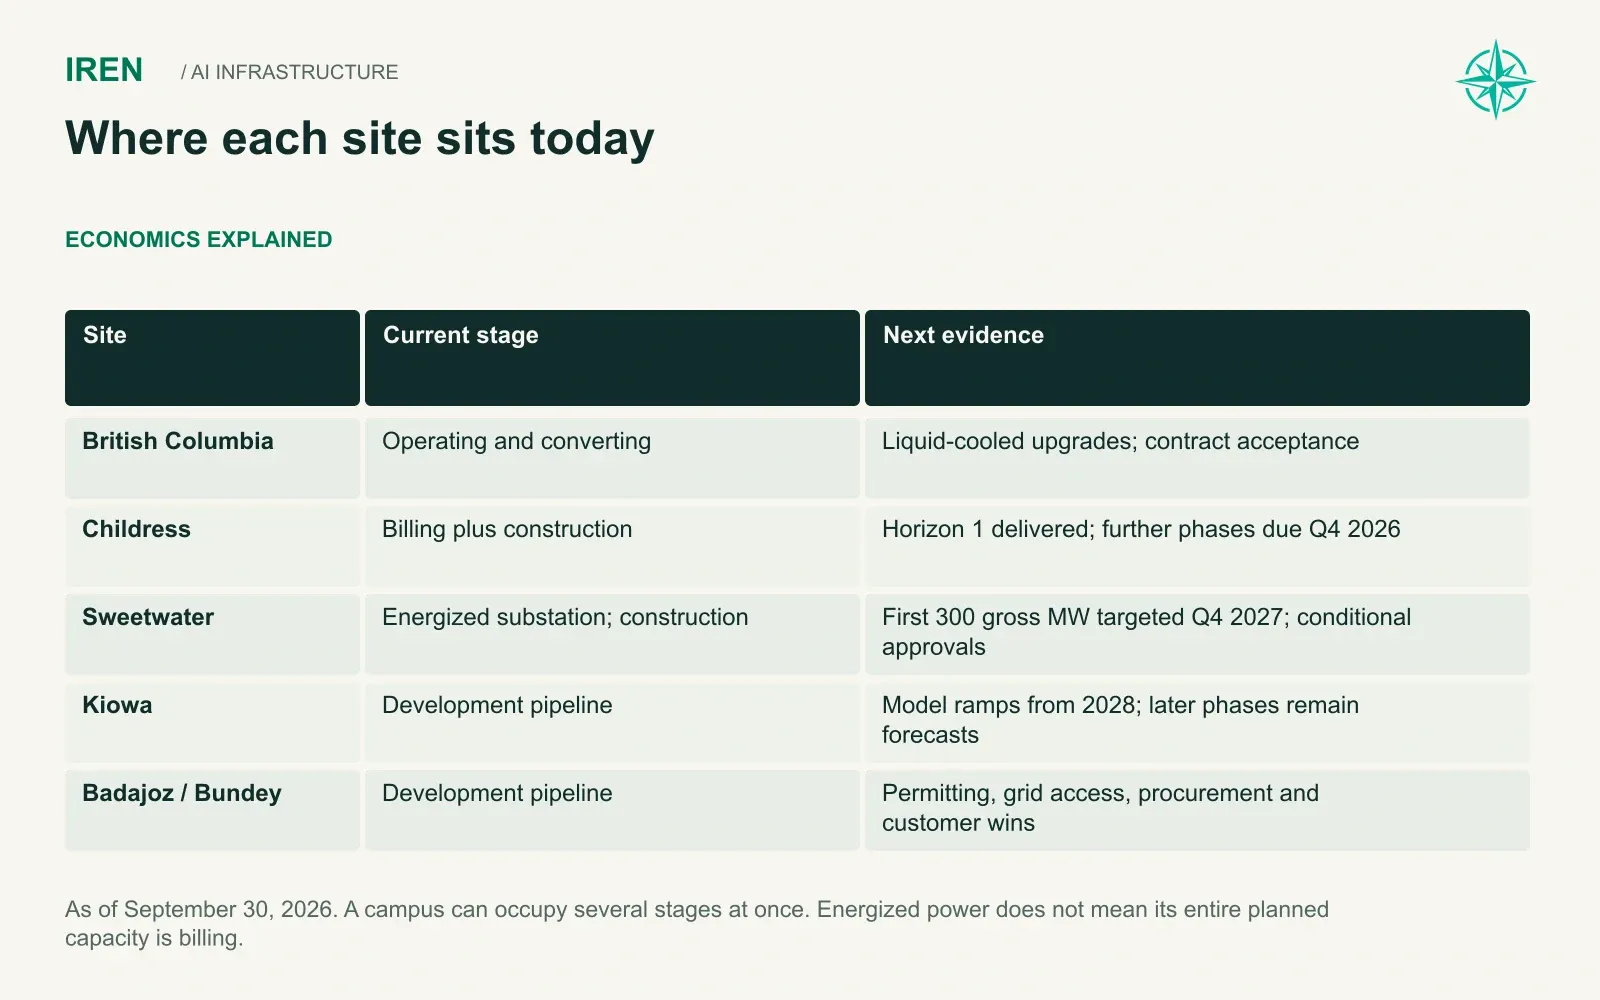
IREN started as a bitcoin miner in British Columbia, running machines on cheap hydro power. Mining taught the company three things that turned out to be worth far more than bitcoin: how to secure large grid connections, how to build data halls quickly, and how to operate them at scale.
Those skills now point at a different customer. Mining halls are converting to GPU clusters one site at a time, and in our Base case mining contributes almost nothing by 2027. In August, IREN acquired Mirantis, adding roughly 580 software and infrastructure engineers. With Mirantis, IREN can offer managed services on top of raw compute for the first time.
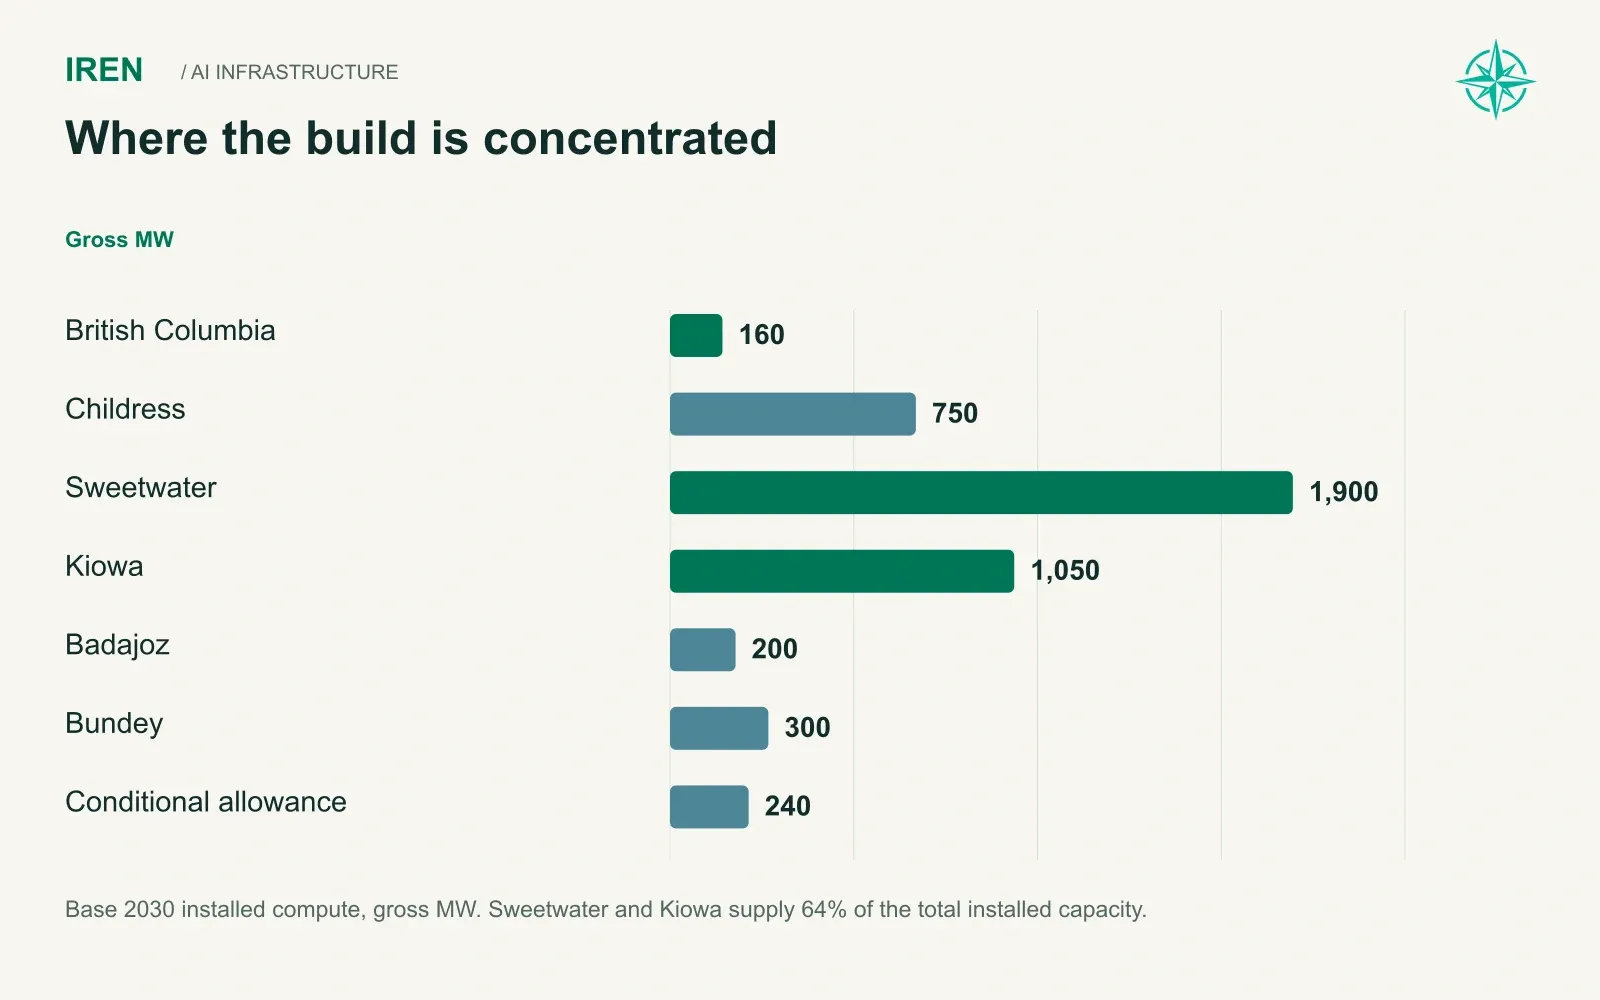
The asset base behind the story is unusually large for a company with a market value near $16.1B:
Site | Where it stands |
|---|---|
British Columbia | 160 MW of operating sites, including a liquid-cooled upgrade at Canal Flats |
Childress, Texas | 750 MW campus in phased conversion, anchored by Microsoft |
Sweetwater, Texas | 2 GW corridor, first 300 MW targeted for Q4 2027 |
Kiowa | Development scheduled from 2028 |
Badajoz, Spain | 300 MW identified in the August presentation |
Bundey | 800 MW announced, in permitting and procurement |
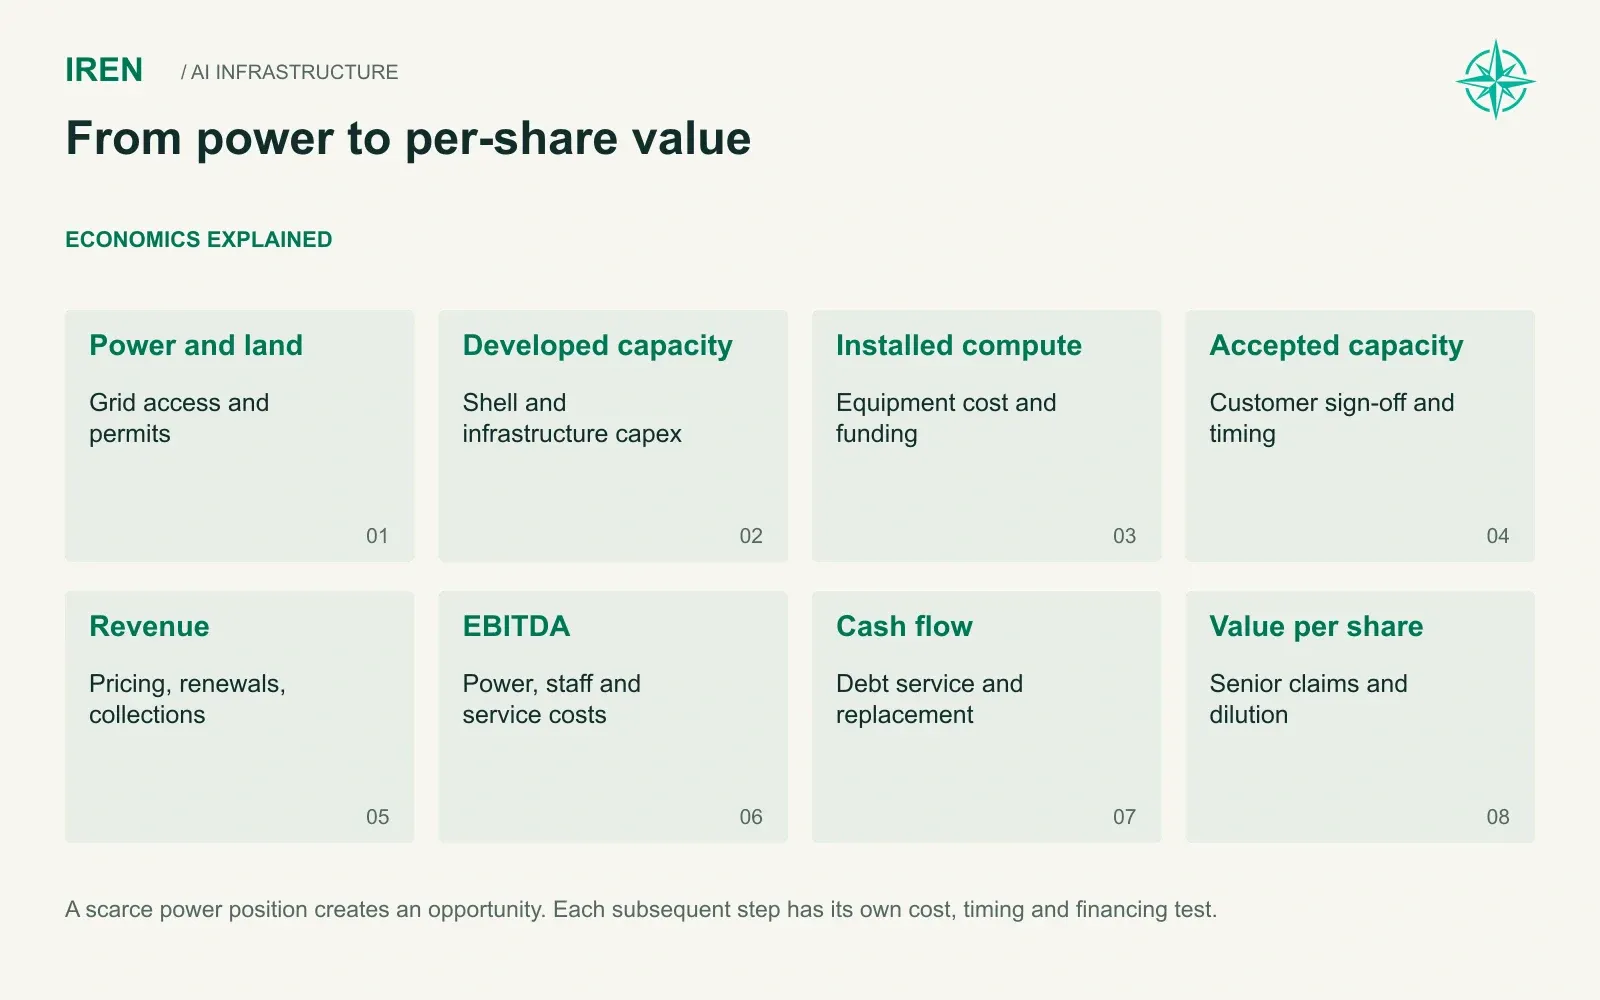
AI infrastructure has run into a power wall. Chips are expensive, but electricity and grid interconnection are scarcer, and the companies already holding energized land are the ones customers call first. IREN holds a lot of it.
Power on its own pays nothing, though. Before a single dollar of revenue arrives, it has to pass through two more stages, each more expensive than the one before.
Sources: IREN FY26 results, August 27, 2026, Sweetwater update, September 8, 2026.
Three Kinds of Megawatt
Picture a single data hall at Sweetwater. First the substation is energized and the shell goes up. Then GPUs are delivered, racked and powered on. Finally a customer runs acceptance tests, signs off and begins paying.
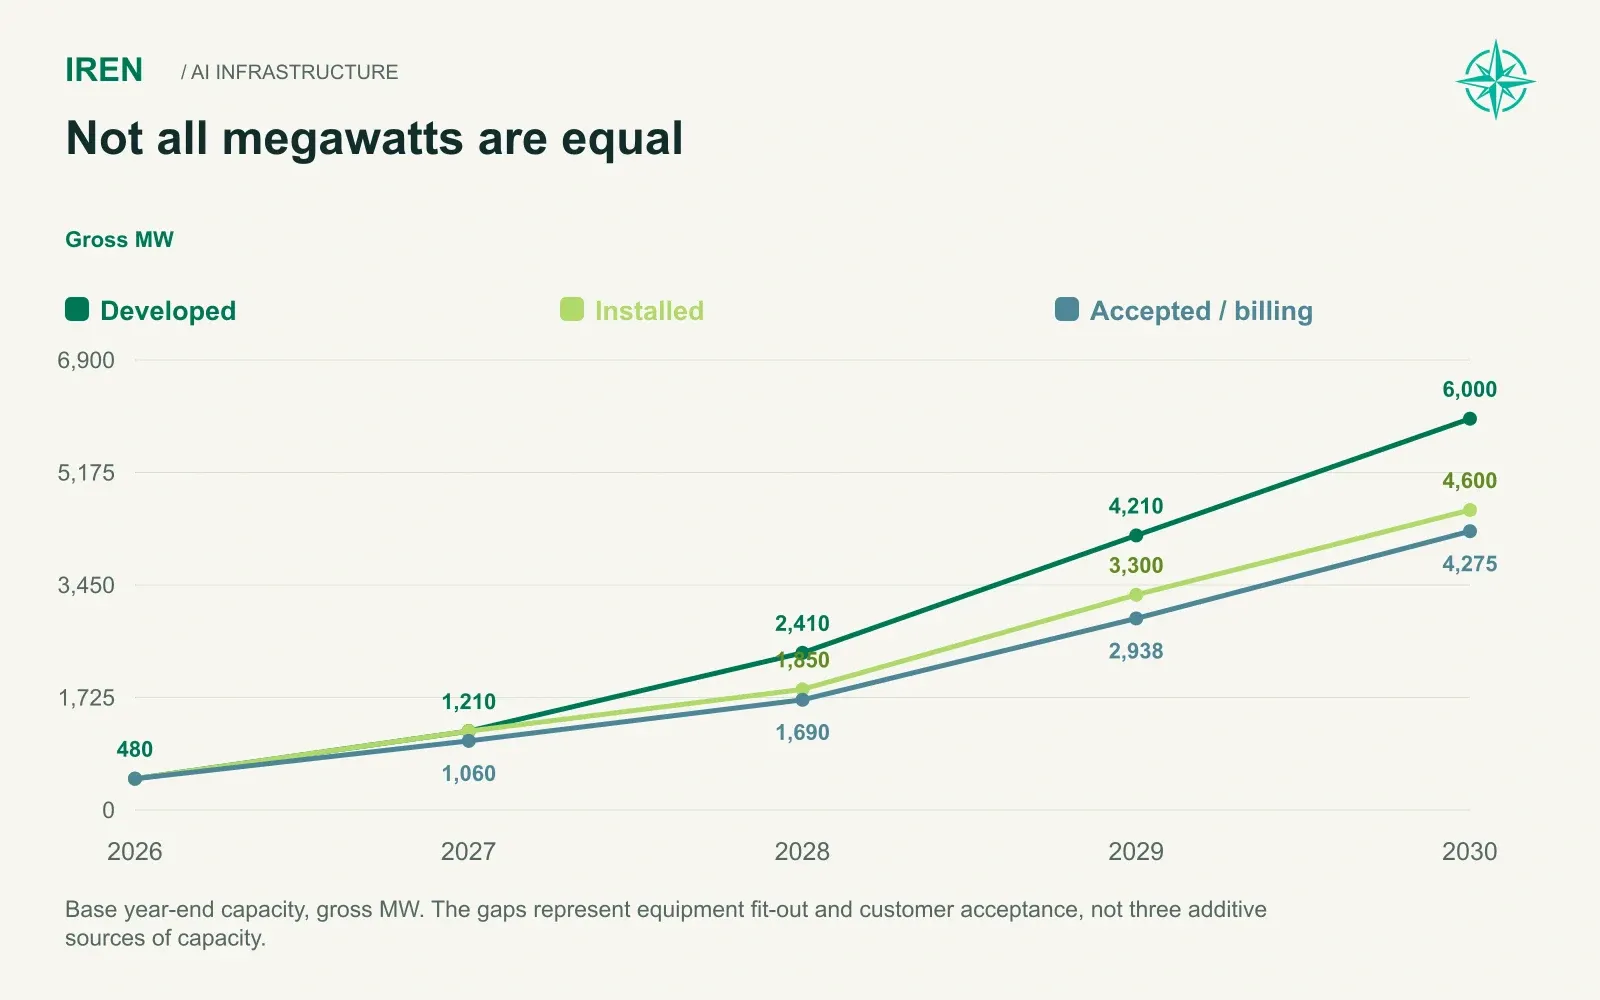
IREN's investor materials describe all three stages in megawatts, and it is easy to read them as the same number. They are not. We call them physical development, installed compute and accepted capacity, and only the last one earns revenue.
Gross MW at end of 2030 | Bear | Base | Bull |
|---|---|---|---|
Physical development | 3,400 | 6,000 | 7,100 |
Installed compute | 2,450 | 4,600 | 6,200 |
Accepted and billing | 2,325 | 4,275 | 5,775 |
Our Base case ends 2030 with 6 GW of developed power, up from 480 MW at the end of 2026. About 77% of it has equipment in place, and about 93% of the installed capacity is billing a customer.
Nothing has to break for the Bear case to happen. It just builds more slowly: Sweetwater reaches 1,100 MW in place of 2,000, Kiowa stops at 550, and the program ends near 3.4 GW. The Bull case finishes Sweetwater by 2029 and adds further Spanish and future capacity on top.
One part of the Base case needs flagging. About 790 MW of its 2030 power comes from Spanish capacity IREN has not reconfirmed and from development sites it has not yet named. We treat those as forecasts, weight them accordingly, and run a stress case that removes them entirely.
The gap between the top row and the bottom row is where IREN spends most of its money. Before we get to the money, though, it helps to see how an accepted megawatt becomes revenue.
How a Megawatt Earns
Each gross megawatt supports about 0.7 MW of IT load, the power that actually reaches the chips. Each IT megawatt then earns an annual rate set by the customer's contract. The customer mix ends up mattering about as much as the megawatt count.
Think of a shopping mall. An anchor tenant like a department store signs a long lease at a lower rate per square foot, and the smaller tenants pay more. IREN works the same way.
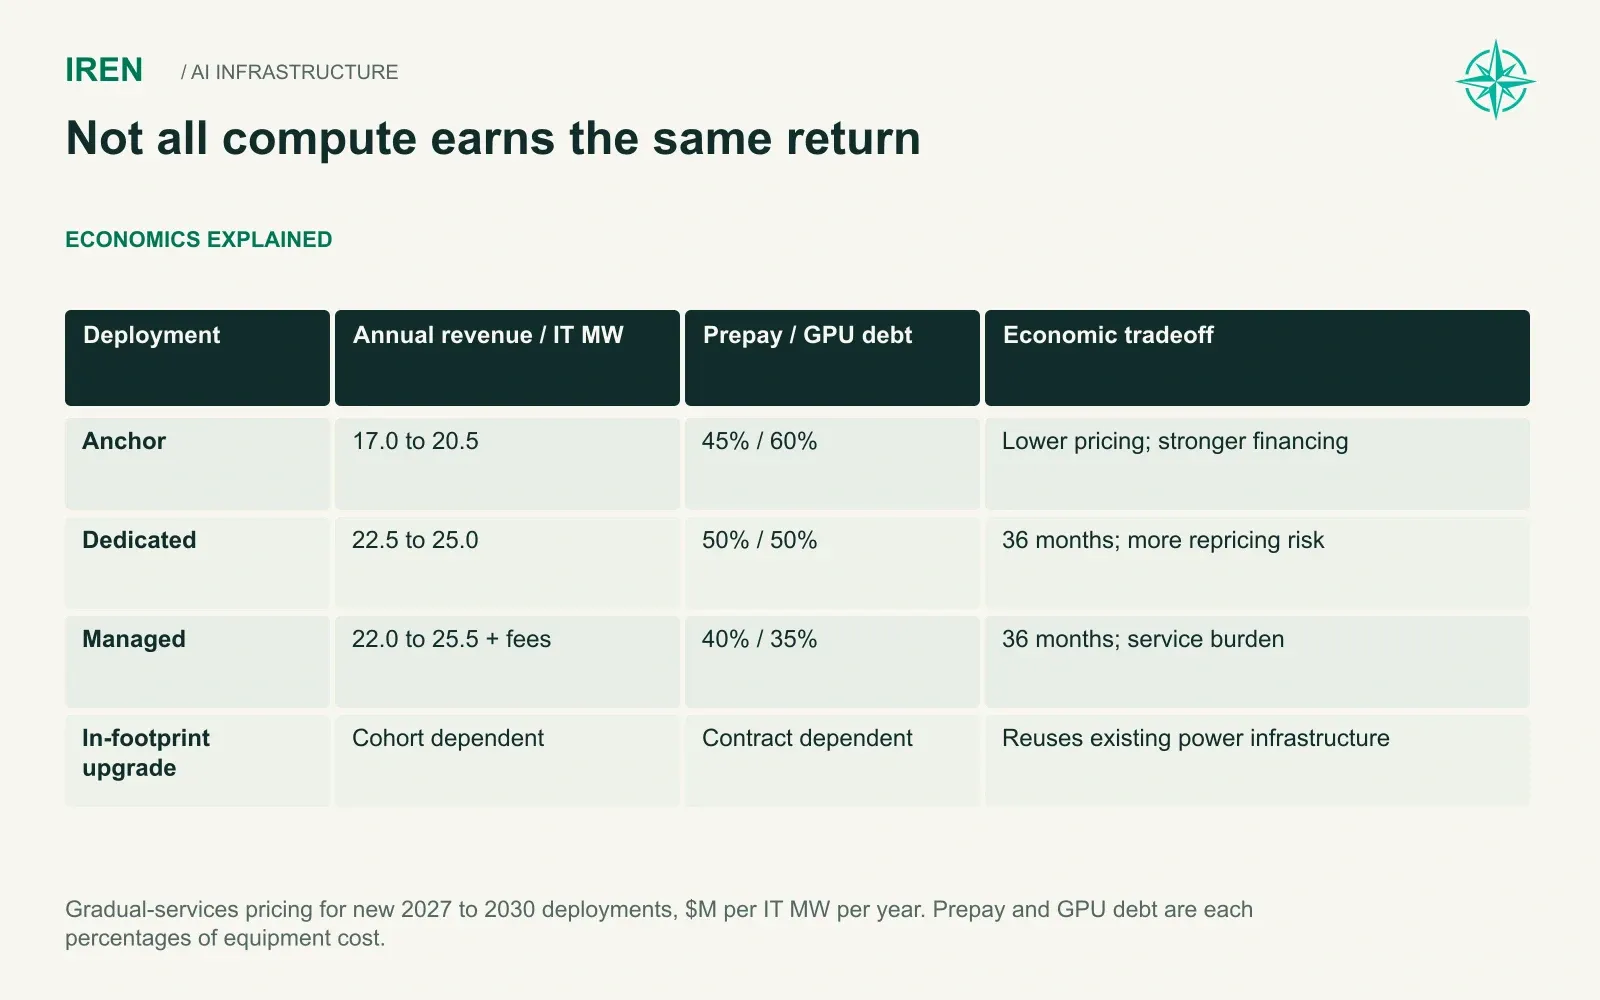
Anchor customers such as Microsoft sign long contracts worth roughly $17M to $20.5M per IT MW a year in our Base case. Dedicated customers, mostly AI labs and enterprises, pay more, about $22.5M per IT MW for 2027 deployments, rising to $25M by 2030. Managed customers pay a compute rate plus a service fee that grows from $1M to $2.5M per IT MW as the Mirantis layer matures.
In Base, anchor contracts fall from 60% of new 2027 capacity to 50% of 2030 deployments, while managed services rise from 4% to 15%. Each shift lifts revenue per megawatt without a single new watt of power. Over four years the effect compounds into billions.
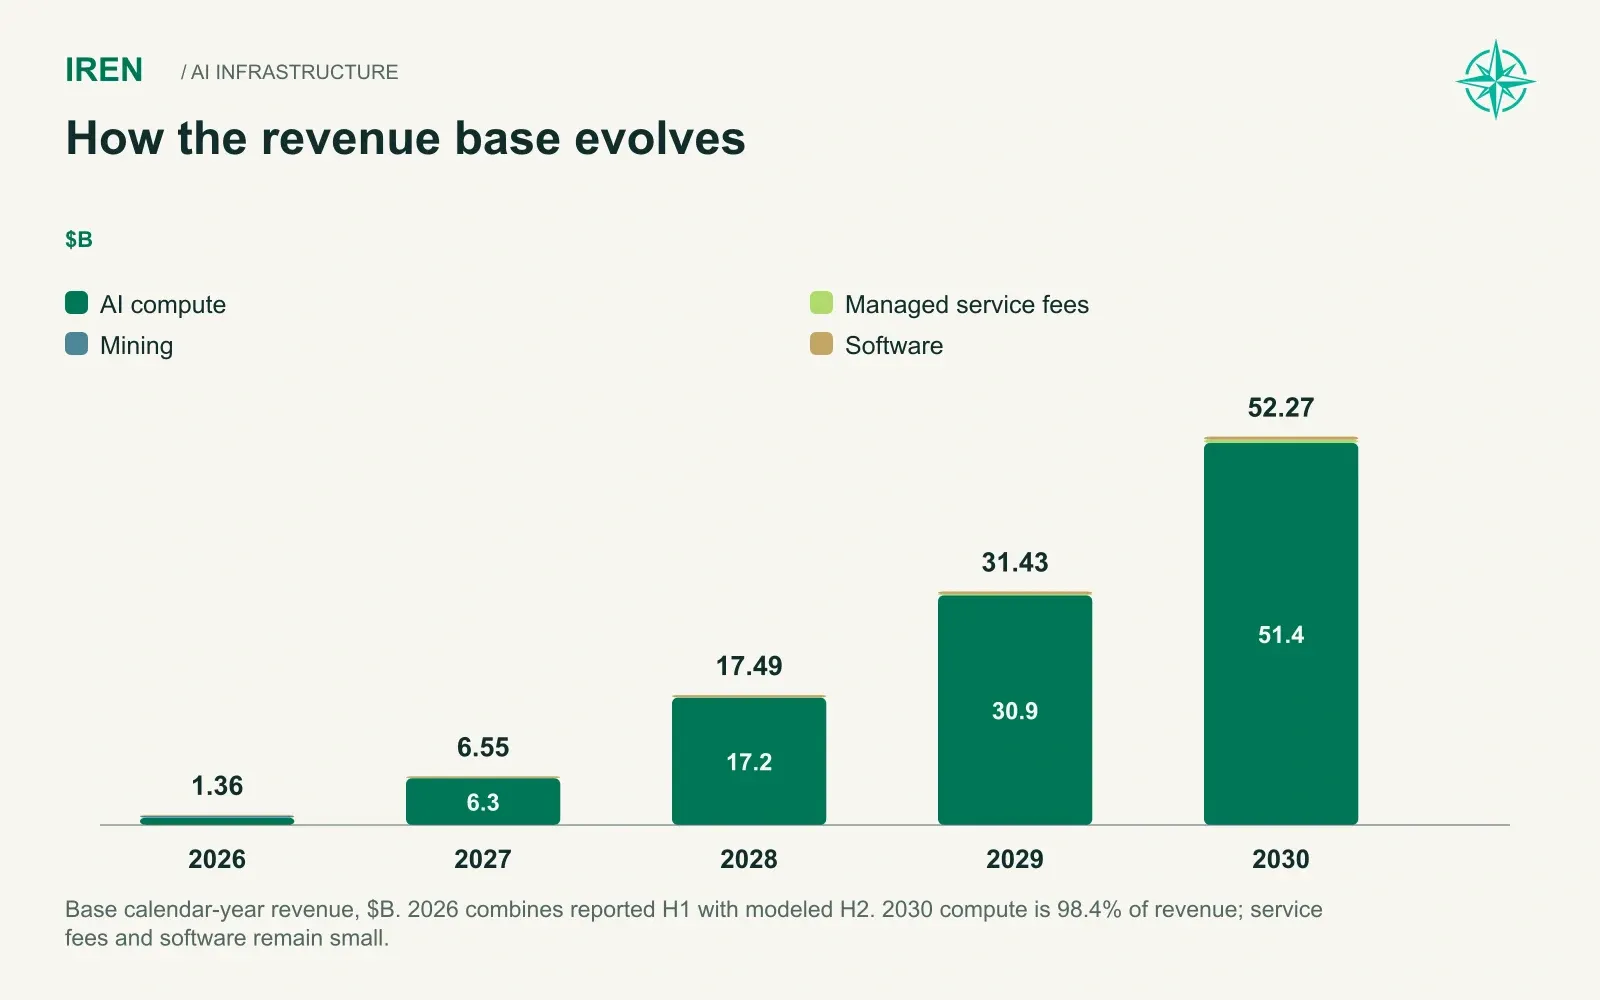
Put capacity and mix together and the business scales steeply:
Base case, $B | 2026 | 2027 | 2028 | 2029 | 2030 |
|---|---|---|---|---|---|
Revenue | 1.36 | 6.55 | 17.49 | 31.43 | 52.27 |
Adjusted EBITDA | 0.43 | 3.48 | 11.19 | 20.84 | 35.40 |
EBITDA margin | 31.5% | 53.1% | 64.0% | 66.3% | 67.7% |
Exit AI cloud ARR | 3.94 | 11.73 | 20.72 | 38.41 | 57.38 |
By December 2030, Base is running at $57.4B of annualized AI cloud revenue, roughly $19.1M per IT megawatt in service. Our Base case describes a power-rich operator climbing the stack gradually, and we think that is the honest description of where IREN is headed.
Bear reaches $25.2B of 2030 revenue and Bull reaches $77.8B. Most of that spread comes from how many megawatts get built and accepted. Pricing moves it less than people tend to assume.
A forecast of $52B in revenue is a bold claim for a company that will report about $1.4B this year. One bank has published numbers far below ours, and the two should be compared directly.
The Gap With Redburn
Redburn's published forecasts let us test ourselves against a careful bear. On a June fiscal year basis, the two sets of numbers diverge quickly:
Fiscal year ending June | Northwise Base | Redburn | Northwise above |
|---|---|---|---|
FY2027 | $3.54B | $2.80B | 26% |
FY2028 | $11.69B | $7.70B | 52% |
FY2029 | $22.95B | $13.30B | 73% |
A 73% gap after three years is not a rounding difference. We didn't have access to Redburn's full model, so some of it may come down to scope. Most of it almost certainly reflects one question: how much of Sweetwater and Kiowa will be energized, equipped and contracted by mid-2029.
We sit higher for a concrete reason. Much of the 2027 and 2028 capacity is already physically underway. Childress conversion is well advanced, Sweetwater's first phase carries a Q4 2027 delivery target, and the 2027 contract book is largely signed.
Redburn's view is still a reasonable outcome. Our own Bear capacity path produces revenue close to theirs, and we give it real probability. Being 73% above a serious bank puts the burden of proof on us, and the place that burden bites hardest is the contract book.
How Much of the Future Is Signed
IREN's annual filing reports $5.1B of remaining performance obligations and $11.4B of contracted lease value, about $16.6B combined. Those figures describe several years of contracted revenue on today's book. They say nothing about the thousands of megawatts still to be built.
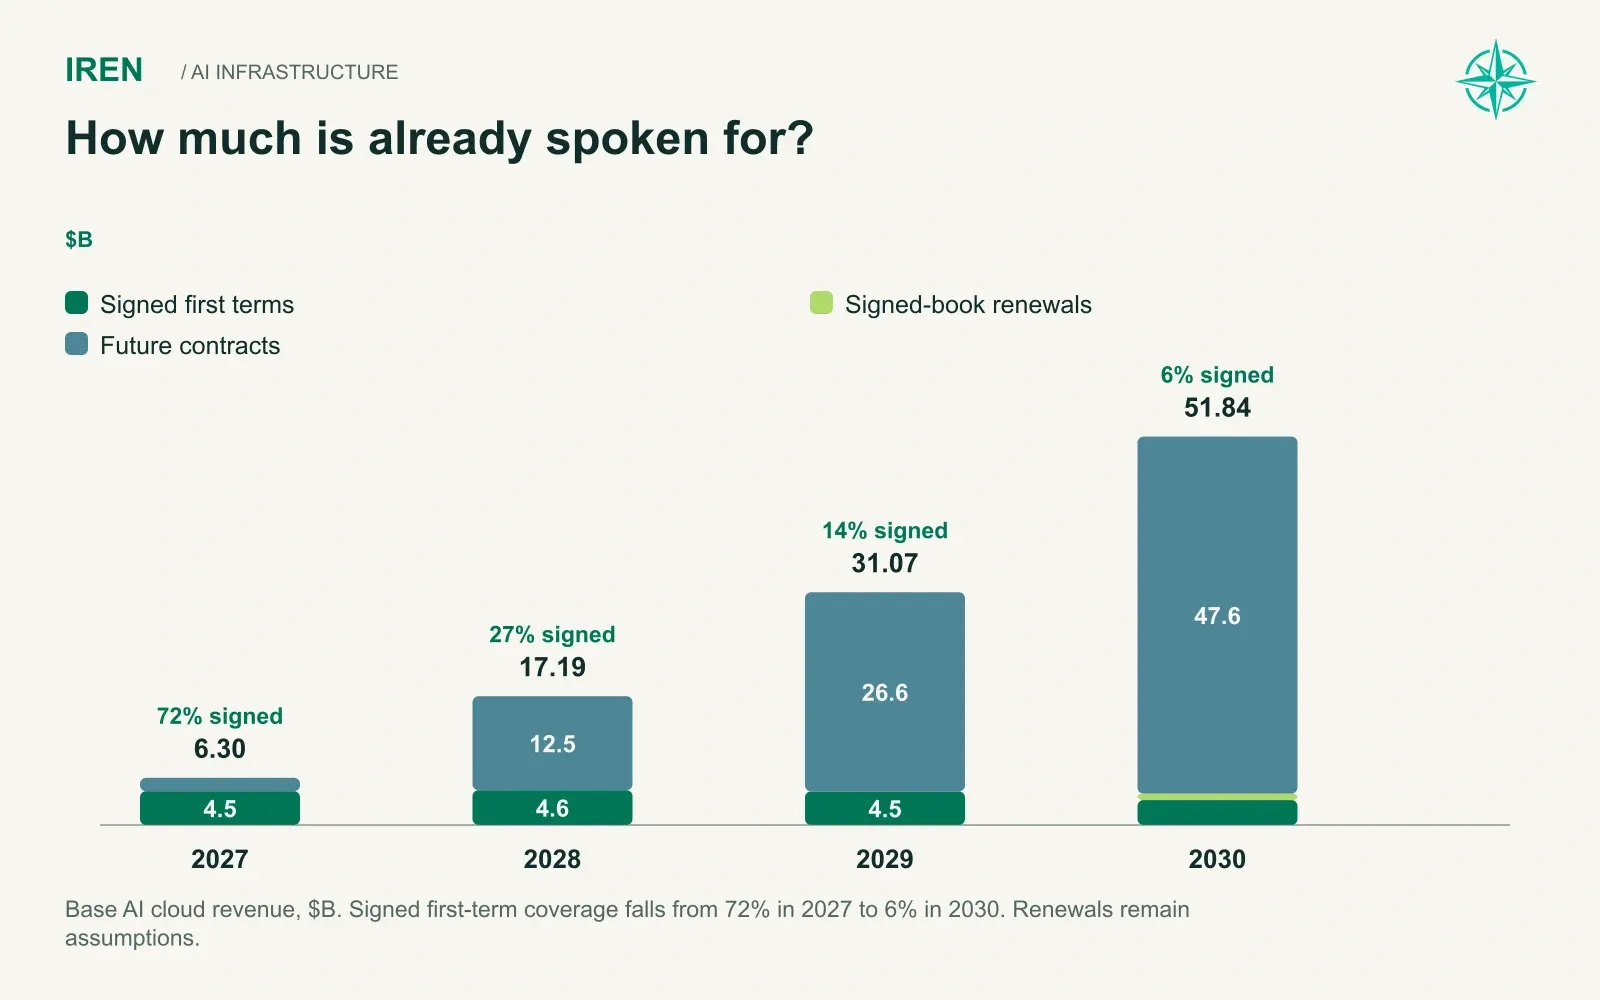
We traced how much of each year's modeled AI revenue comes from first terms of contracts already signed:
Year | Signed first terms | Modeled AI revenue | Signed share |
|---|---|---|---|
2027 | $4.51B | $6.30B | 72% |
2028 | $4.65B | $17.19B | 27% |
2029 | $4.48B | $31.07B | 14% |
2030 | $3.33B | $51.84B | 6% |
The pattern is stark. 2027 is mostly in hand. By 2030, about 94% of Base AI cloud revenue sits outside the current book's first terms: approximately $47.65B from future contracts and $0.86B from modeled renewals.
Bears point to this table and stop there. Bulls answer with JPMorgan's observation that customer demand is broadening and prices are firming. Each side has the facts right. Momentum raises the odds that future contracts get signed, but it does not sign them.
Our position is between the two. Given how scarce energized capacity has become, IREN should be able to fill what it builds. Filling 4 GW still requires a sales and delivery operation that closes a steady stream of large contracts at acceptable prices for four straight years. We price that as an execution risk, and it shows up across the valuation scenarios below.
The revenue story, signed or not, eventually has to pass through the income statement. Reported earnings tell a very different story from the business itself.
Sources: IREN FY26 Form 10-K.
Why IREN Looks Unprofitable
In our Base forecast, IREN does not reach positive annual net income through 2030. Base net income stays negative every year through 2030 and is still about $(0.22)B in the final year. Even the Bull case only reaches $4.66B of net income on $77.75B of revenue.
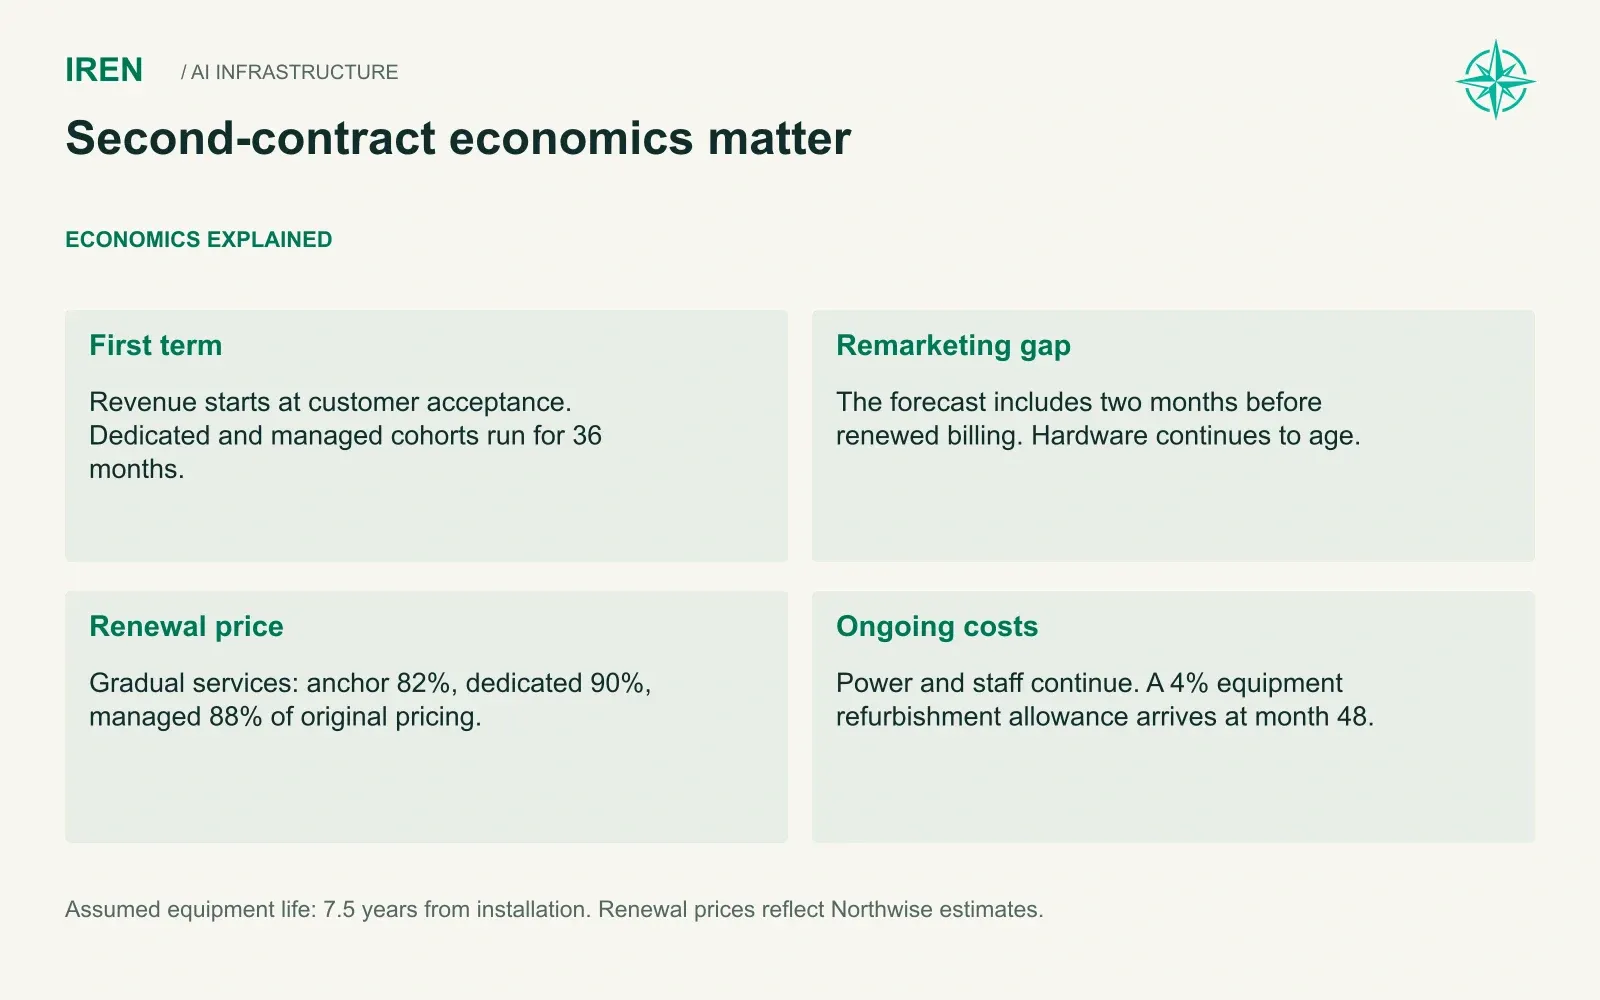
Depreciation explains most of it. GPUs are written off over five years for accounting purposes, while we expect them to earn for about 7.5 years. Base depreciation and amortization climb to $29.6B in 2030 against $35.4B of EBITDA. Add $5.1B of net financing cost and the bottom line disappears.
To see what the business really produces, we use a measure we call owner cash. We start with EBITDA and subtract stock compensation, cash interest and a full reserve for replacing every GPU at the end of its economic life, then apply tax. Base generates $10.9B of owner cash in 2030, about $9.20 per 2030 share.
The measure does not pretend the hardware lasts forever. It simply refuses to let a conservative accounting schedule hide the cash the fleet throws off while it runs.
Hardware life has a second clock that matters more than it first appears. A GPU starts aging the day it is installed, not the day a customer accepts it. If a hall goes live in March and the customer signs off in September, the chips have already used six months of their life without earning anything. Every delay therefore costs twice: revenue starts later, and the equipment has less time left to pay itself off. The stress tests later in the report show how expensive that gets.
Owner cash shows the business can earn. The harder question is how IREN pays for the build before that cash arrives.
The Funding Machine
Base spends $233B of cash capital from 2026 through 2030, peaking at $75.1B in 2029. Bull spends $313B. Even Bear spends $121B. IREN's entire market value is about $16.1B.
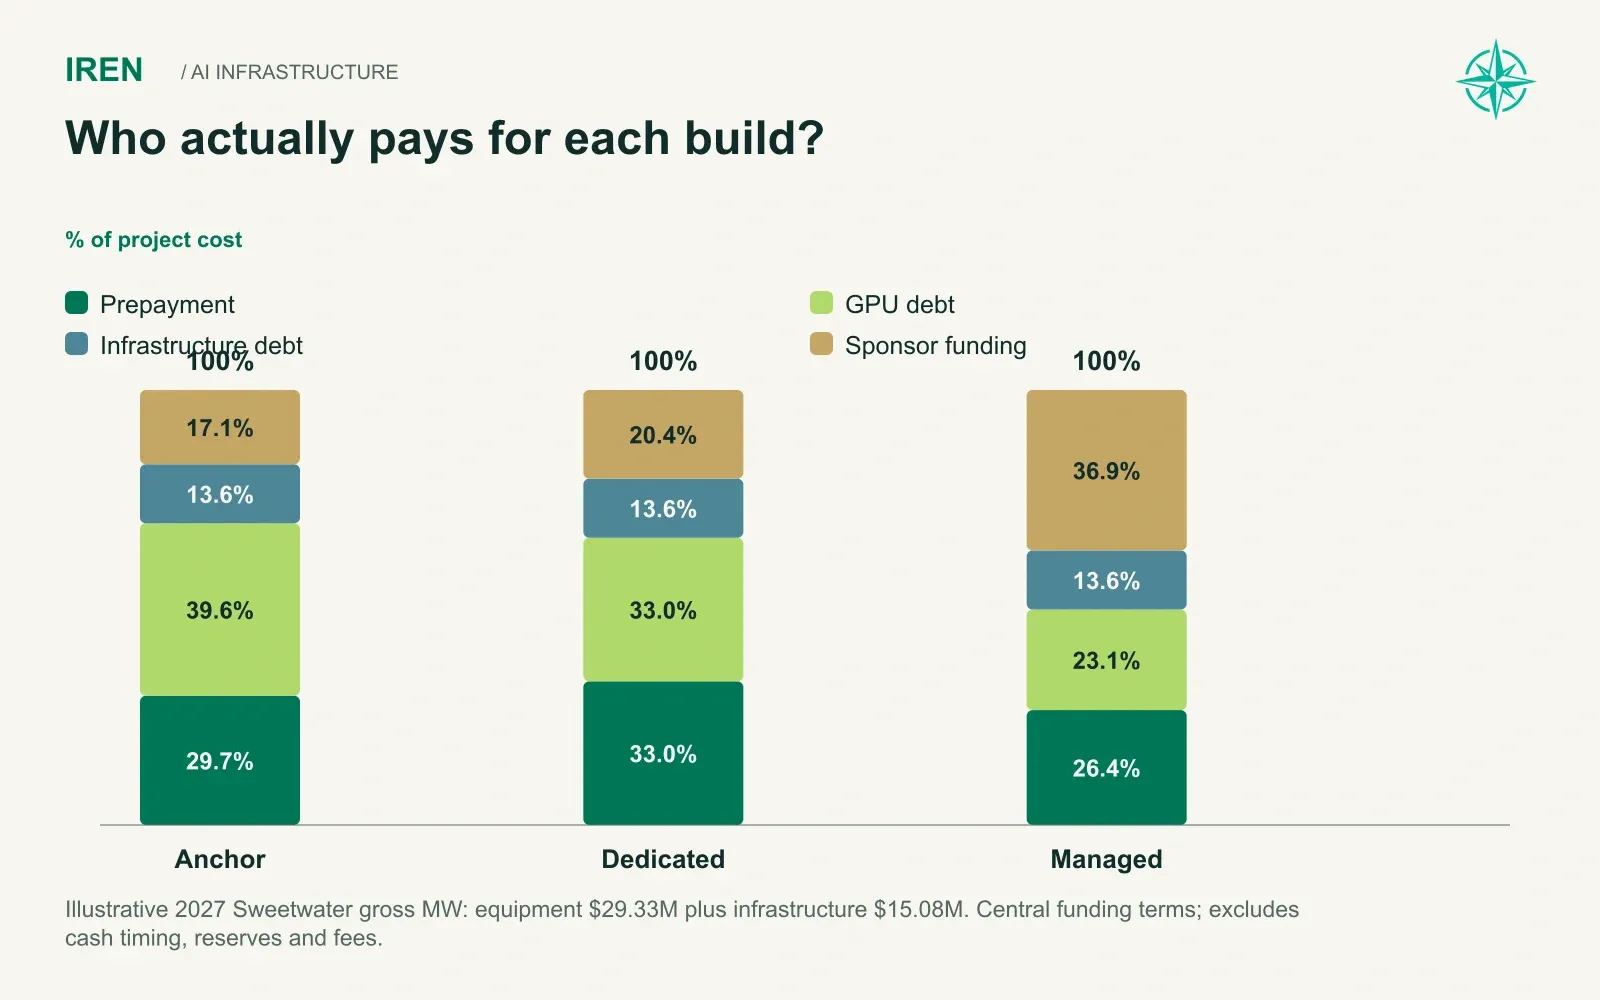
No company funds a build like that from its own pocket. IREN stacks four sources of capital, and the order matters.
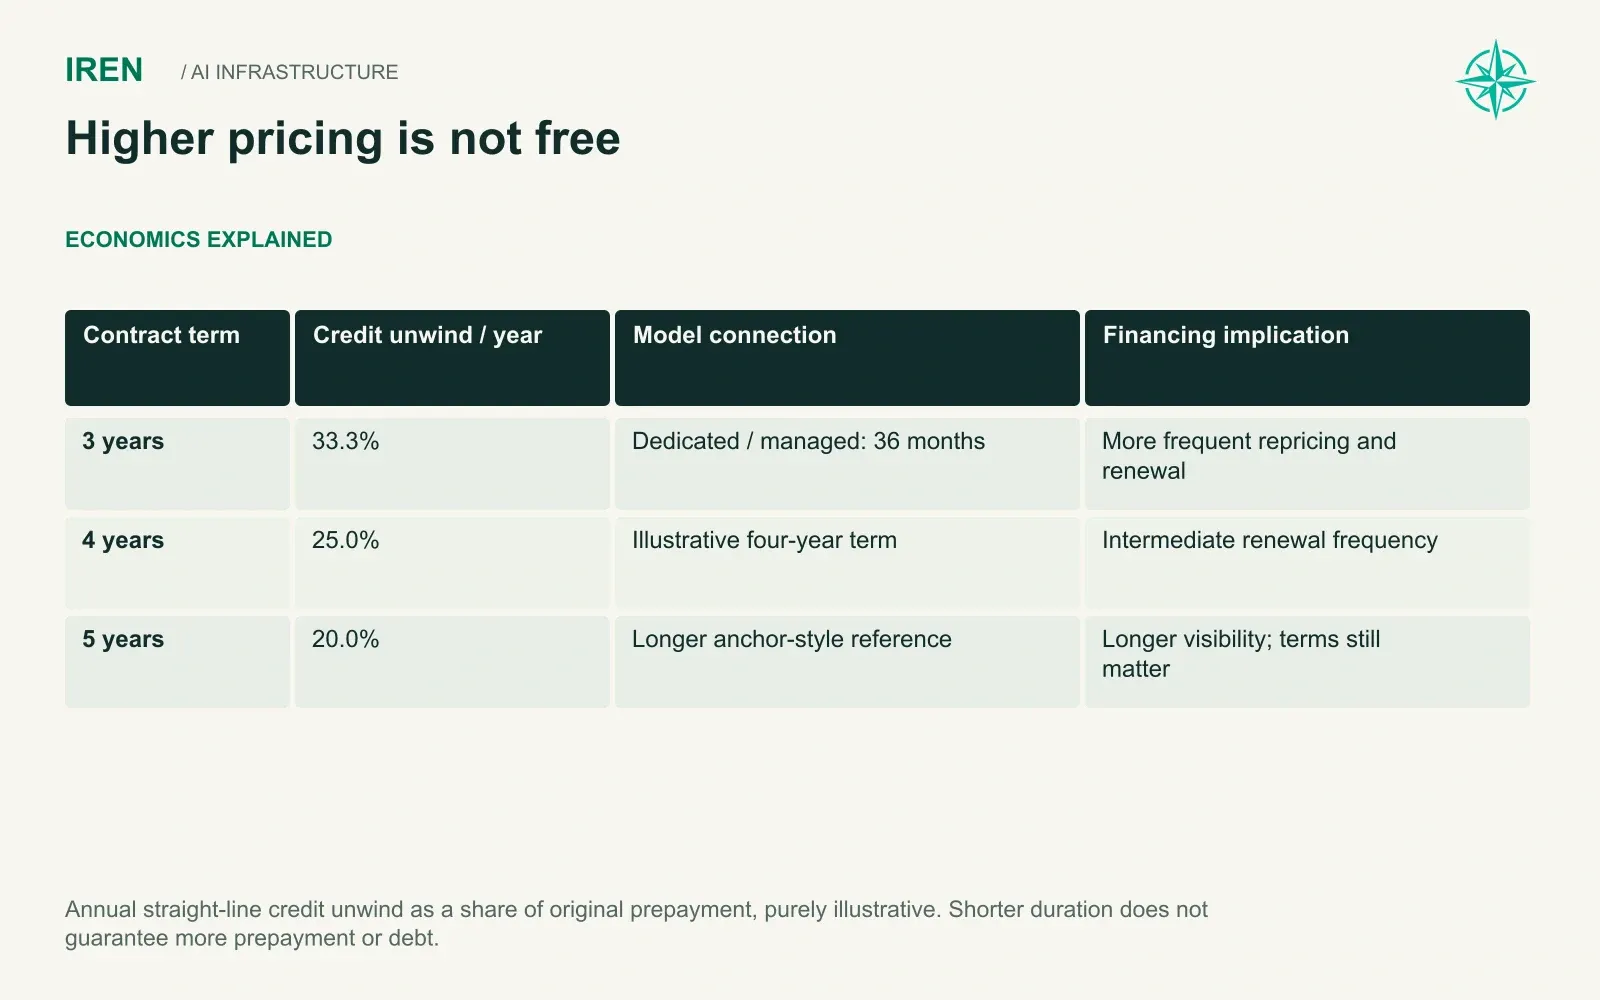
Customers come first. In our central financing case, they prepay 40% to 50% of equipment cost upfront and receive it back as service credits over the life of the contract. GPU lenders come next, advancing 35% to 60% of equipment cost depending on how creditworthy the customer is. Infrastructure lenders fund 40% of the power and buildings. Whatever remains falls to common equity.
The first three sources make the plan possible. By the end of 2030 Base carries $79.2B of debt and $39.1B of prepaid service obligations. The prepayments often go unnoticed. They are customer money already spent on equipment and owed back as future service, so they compete with shareholders for the same cash flows.
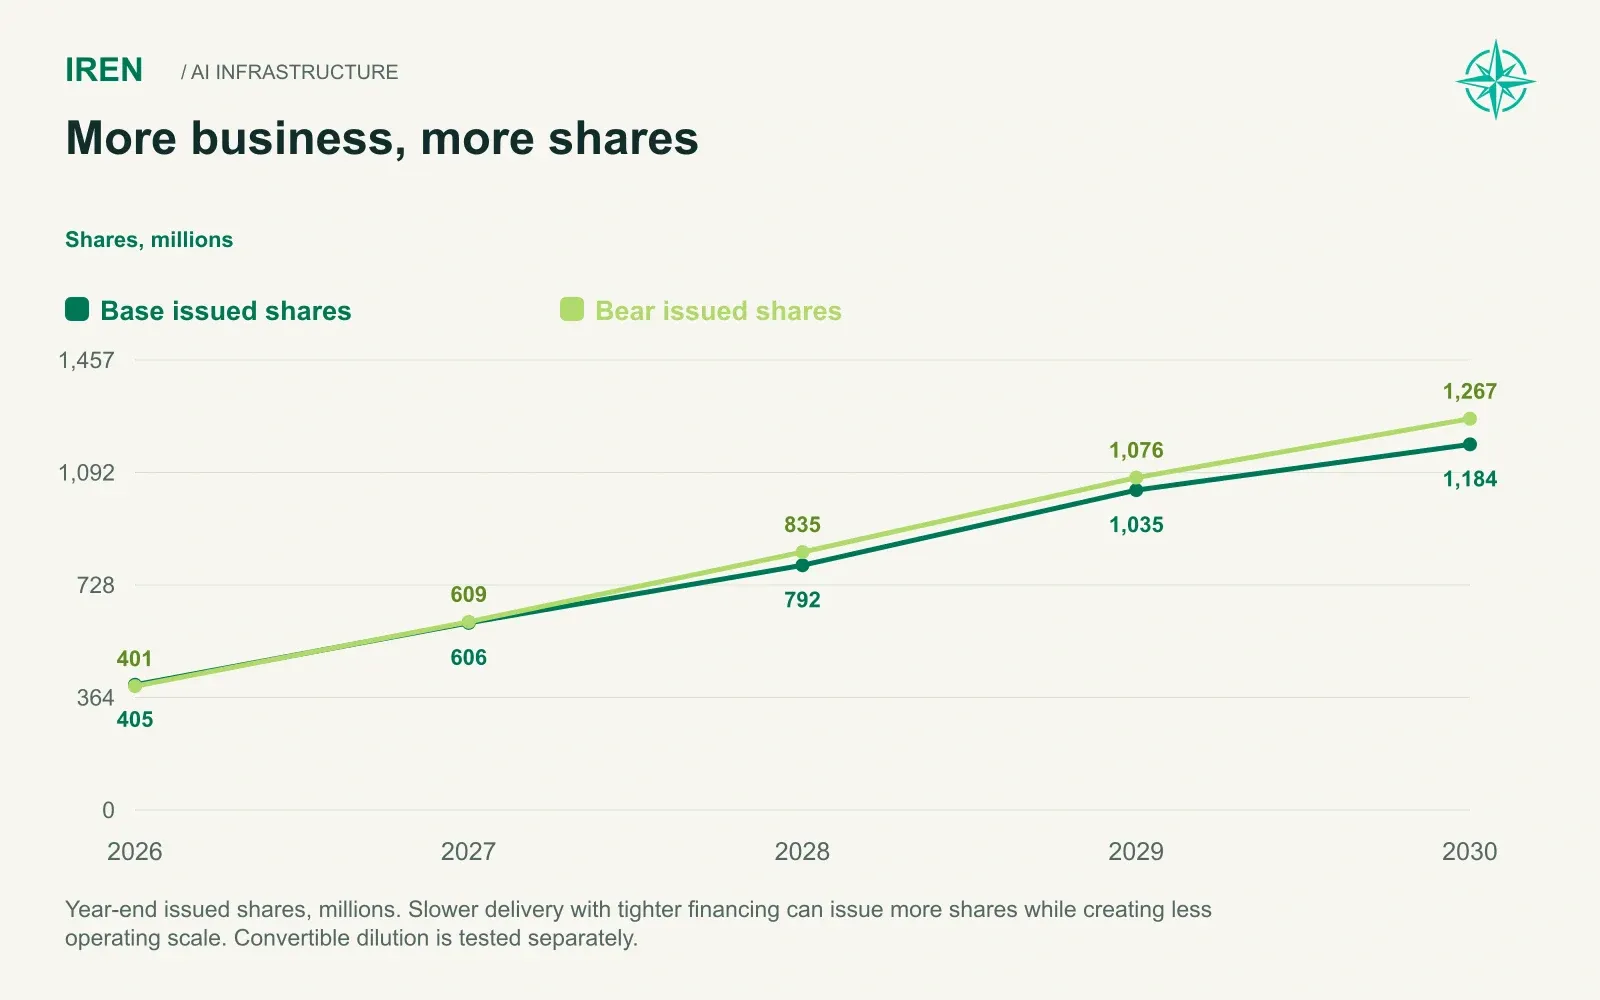
The fourth source makes the plan expensive. Base raises about $63.0B of new common equity between July 2026 and the end of 2030, nearly four times IREN's current market value. The share count rises from about 405M at the end of 2026 to 1,183.5M by 2030.
The scenarios then do something counterintuitive. Bull raises more equity than Base, about $77.1B, since faster growth needs more capital before cash comes back. Bear raises less, about $40.0B, yet ends with more shares, 1,266.6M, since it sells stock at lower prices. A better operating outcome does not mean less dilution, and a worse one does not mean less either.
That brings us to the variable we think matters most. Our central case assumes IREN issues shares at $60 in 2027, $85 in 2028, $110 in 2029 and $140 in 2030, while the stock sits at $40.88 today. In other words, the Base case depends partly on the share price rising to fund the build that justifies the share price. When a stock's valuation relies on its own future price, every quarter it stays depressed makes the underlying plan more expensive.
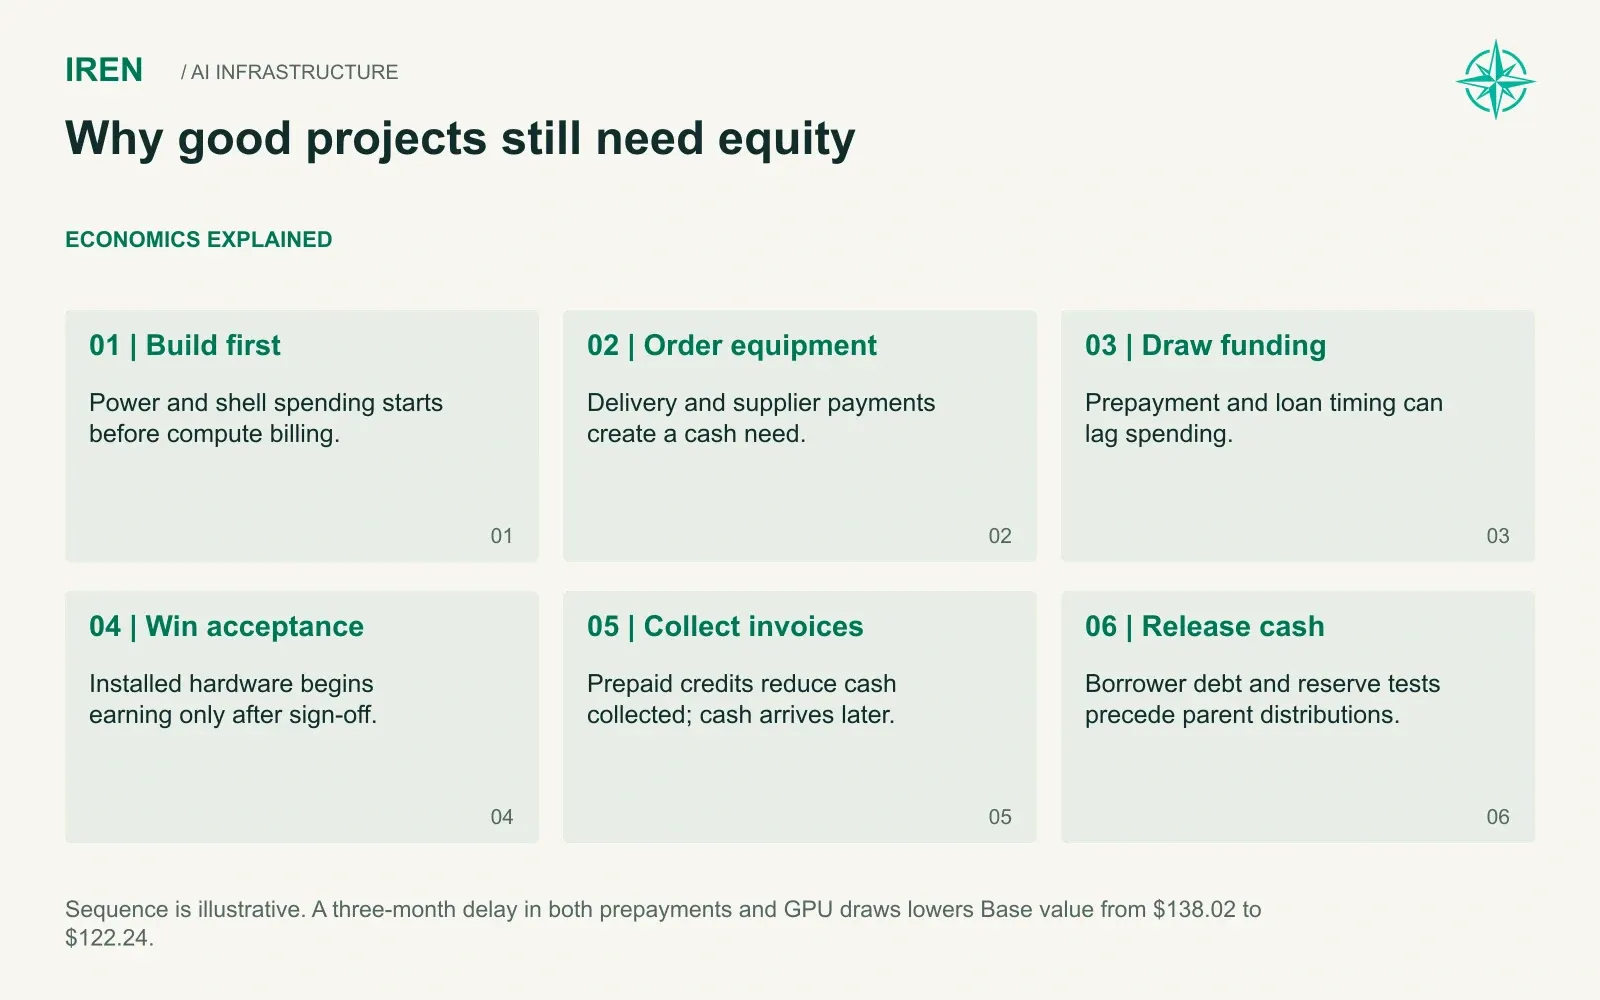
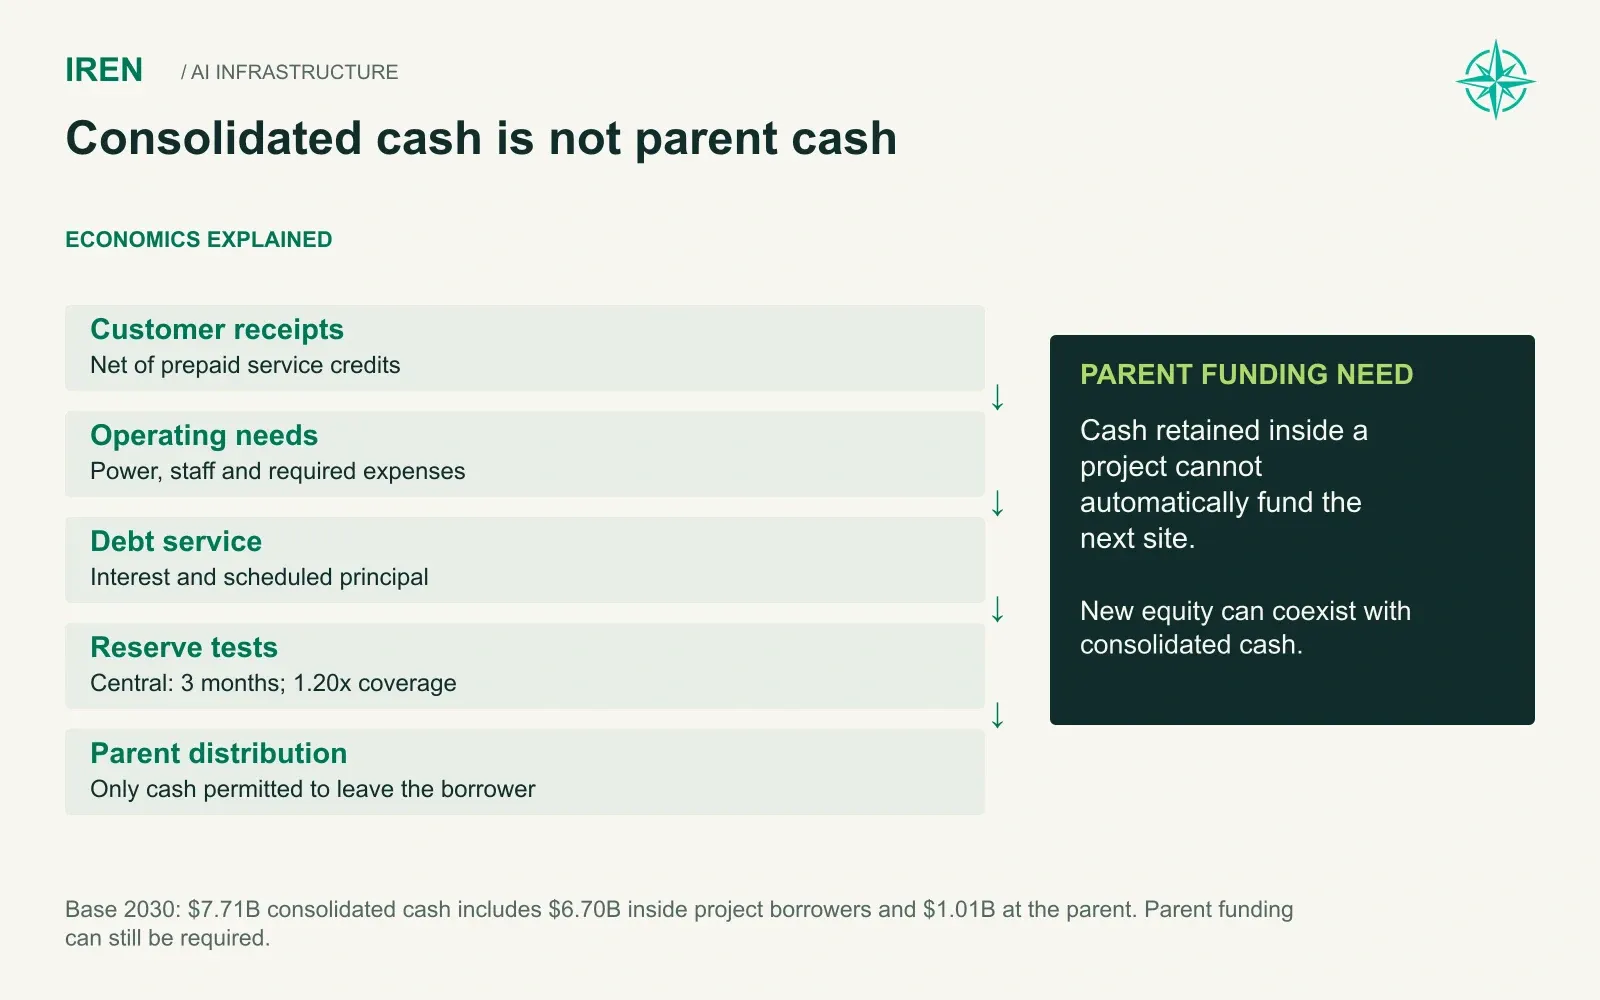
Even raised capital is not fully available. Each financed project collects its own invoices, net of prepaid credits, and must pass debt-service and reserve tests before sending cash up to the parent. At the end of 2030, Base holds $7.7B of cash, but $6.7B of it sits inside project entities. A company can look liquid on a consolidated balance sheet while its parent still needs to raise equity.
Once financing and the stock price are tied together this tightly, timing becomes the variable that decides most outcomes. In September, Texas introduced a new source of timing risk.
Texas and the Cost of Waiting
On September 21, Texas paused new data center permits pending an ERCOT audit, with TCEQ required to report its compliance with the directive by October 19. That is a reporting deadline, not a promised end to the audit. Childress and Sweetwater both sit in Texas.
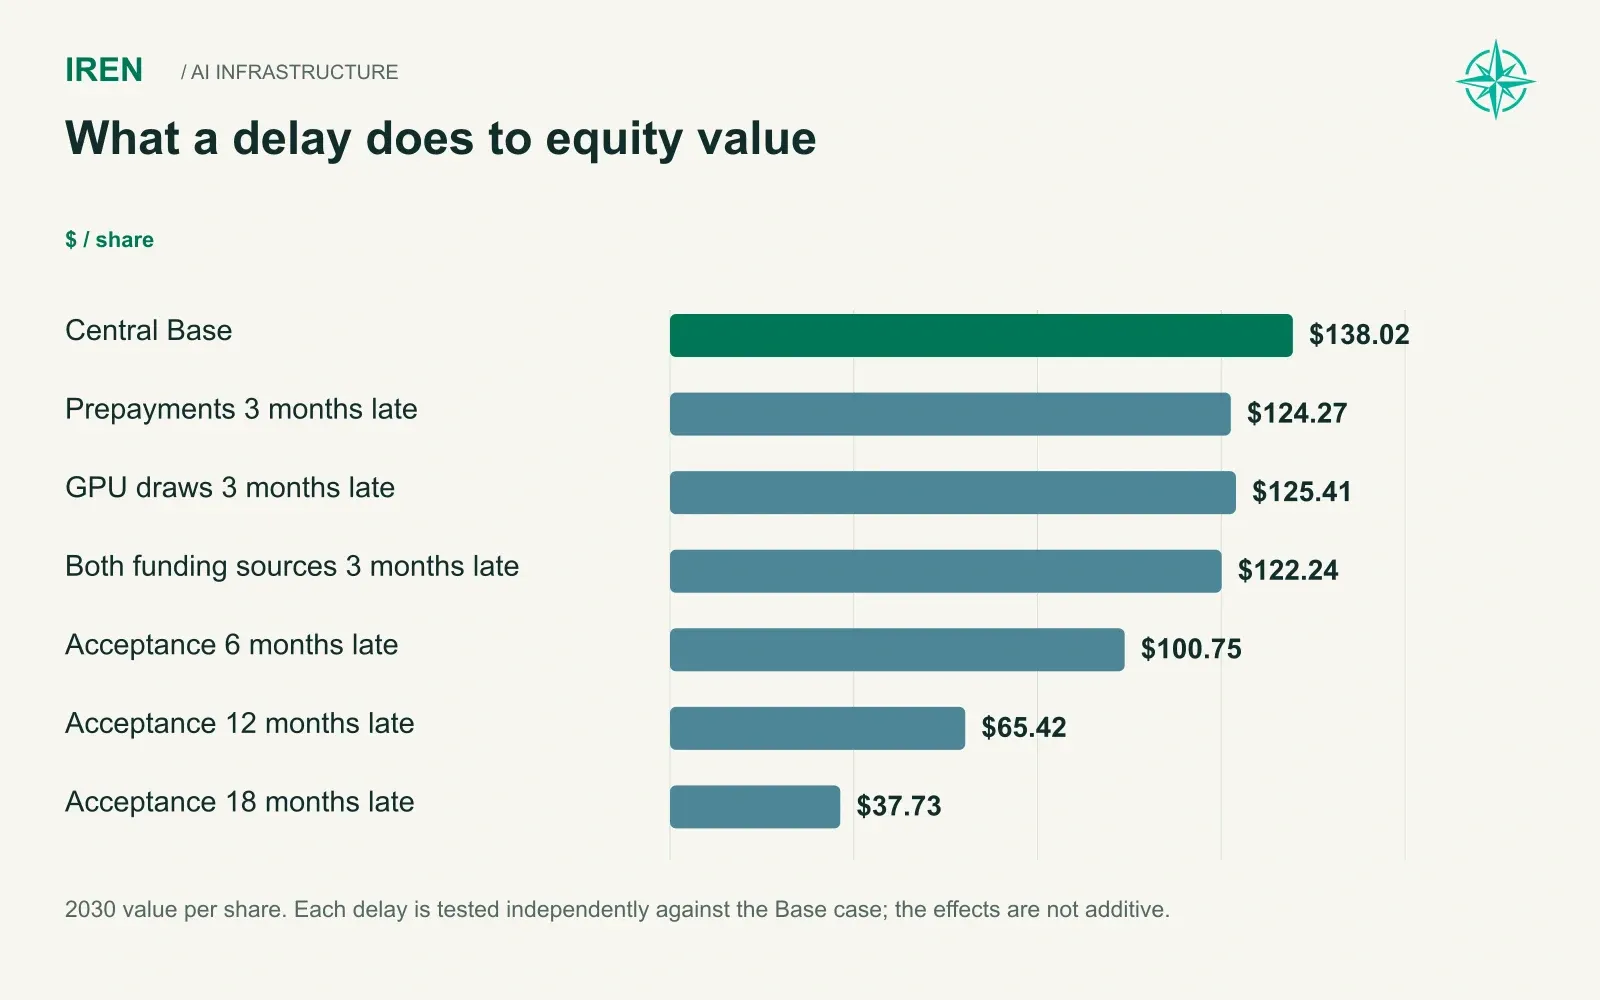
No IREN-specific delay has been announced, and we do not assume the company loses permits it already holds. We did shift probability away from our Faster capacity path and toward Slower. We also built stress cases that push customer acceptance back by six to eighteen months, alongside separate three-month funding delays.
Delay hits IREN in an unusually painful way. Debt and equipment arrive on schedule while revenue slides out, and, as the hardware clock showed, the equipment keeps aging the whole time. A hall that slips six months burns interest, wears out GPUs and needs funding, all while earning nothing.
Bulls have an answer to delay risk. If renting compute ever stops working, they say, IREN can always lease its powered buildings to someone else. We tested that idea directly.
Sources: Texas Governor directive, September 21, 2026.
Is Leasing the Building a Safety Net?
The landlord model is real. Cipher Digital signed a 10-year hosting lease at Barber Lake on exactly those terms. In principle IREN could do the same with any site where its own cloud business struggles.
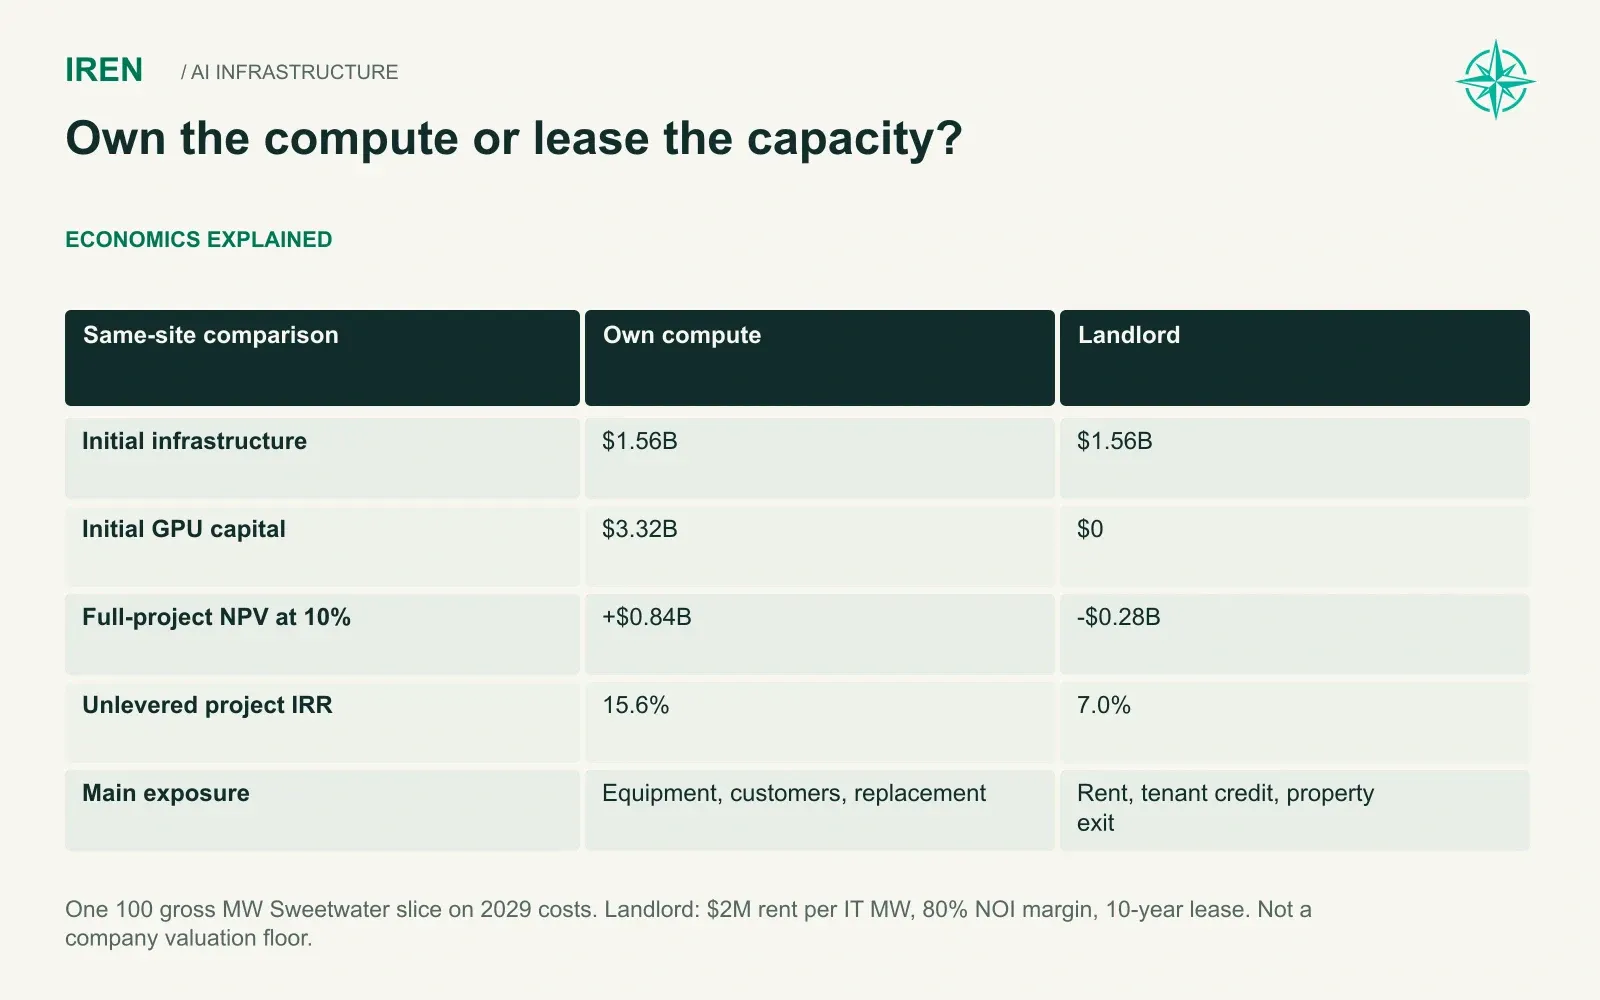
We modeled one 100 gross MW slice of Sweetwater at 2029 costs and ran it both ways:
100 MW Sweetwater slice | Owned compute | Landlord at $2.0M rent per IT MW |
|---|---|---|
Initial infrastructure | $1.56B | $1.56B |
Initial GPU capital | $3.32B | None |
NPV at 10% | $0.84B | $(0.28)B |
Project IRR | 15.6% | 7.0% |
Owning the compute wins clearly. Building a site from scratch to lease it out earns about 7%, below the 10% discount rate used in this comparison, and even at $2.4M of rent the return only reaches about 8.1%.
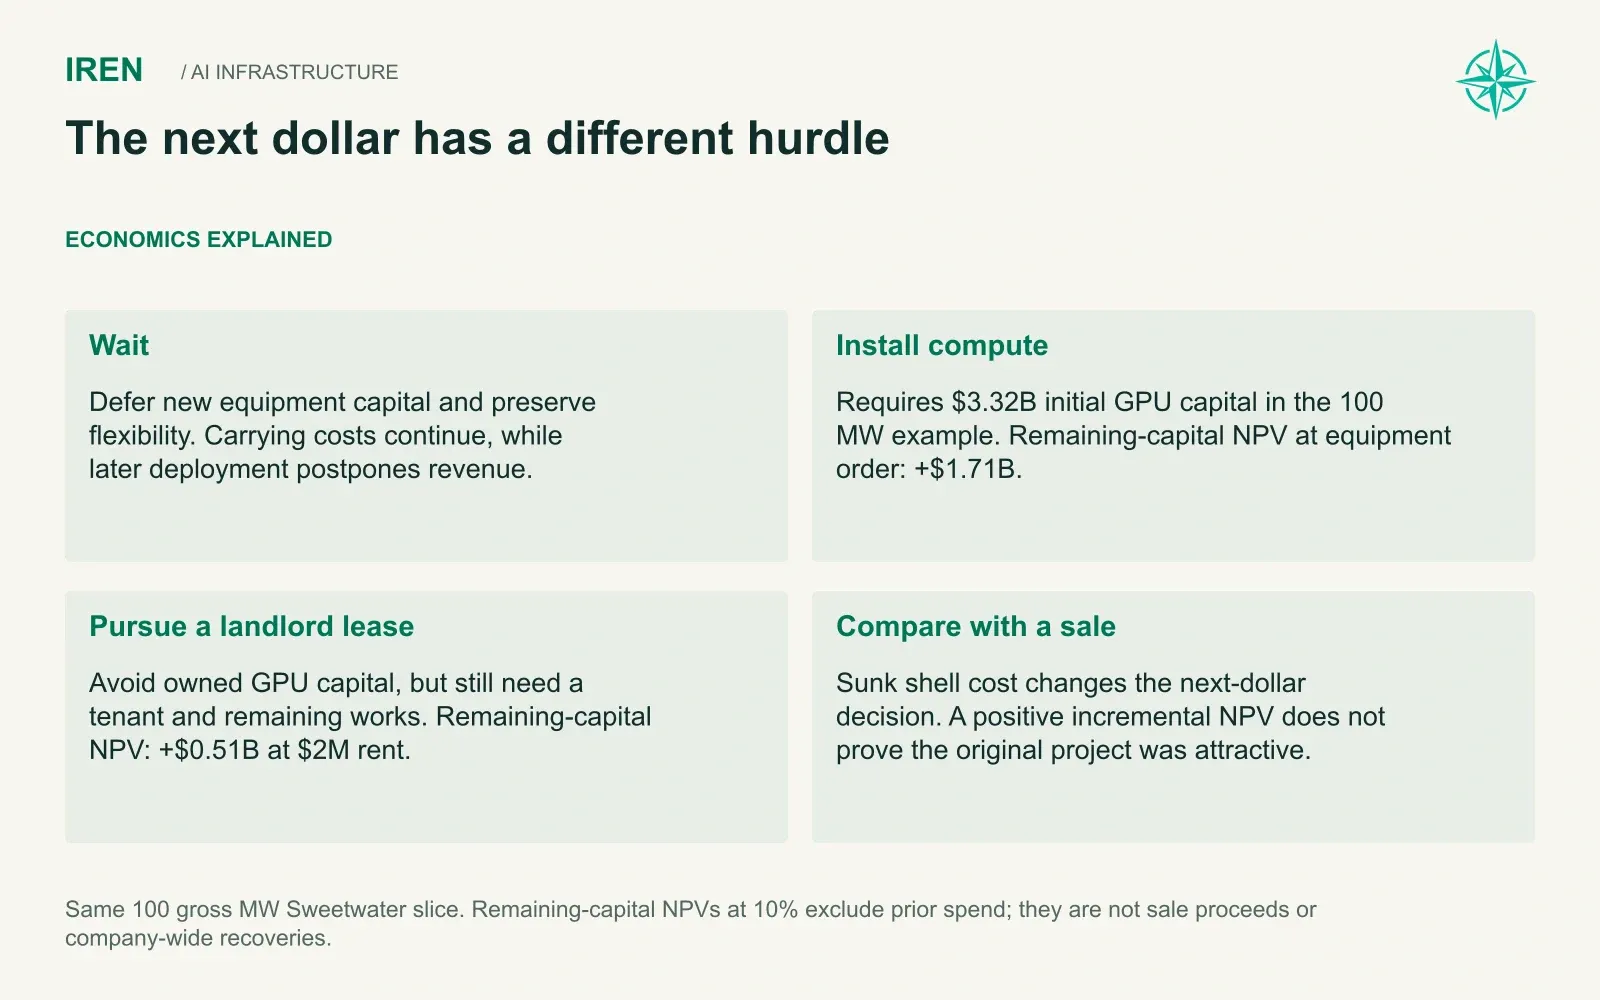
The landlord option looks better for a site that is already built. Once the shell spending is sunk, the same lease shows a positive $0.51B on the remaining capital. Leasing can rescue a stranded hall, but it cannot rescue a 6 GW program. IREN's fallback caps the damage on a handful of sites and offers no floor for the company as a whole.
With the main arguments laid out, the bear case can now be made at full strength before we turn to valuation.
Sources: Cipher Barber Lake hosting agreement.
The Bear Case at Full Strength
Revenue visibility collapses after 2027, and by 2030 about 94% of modeled AI cloud revenue depends on future wins or renewals beyond the current book's first terms. The company must raise more than $60B of equity, and the plan assumes much of it is sold well above today's price. A respected bank forecasts FY2029 revenue at little more than half of ours. Texas has paused new permits, and every month of delay ages hardware that has not yet earned anything.
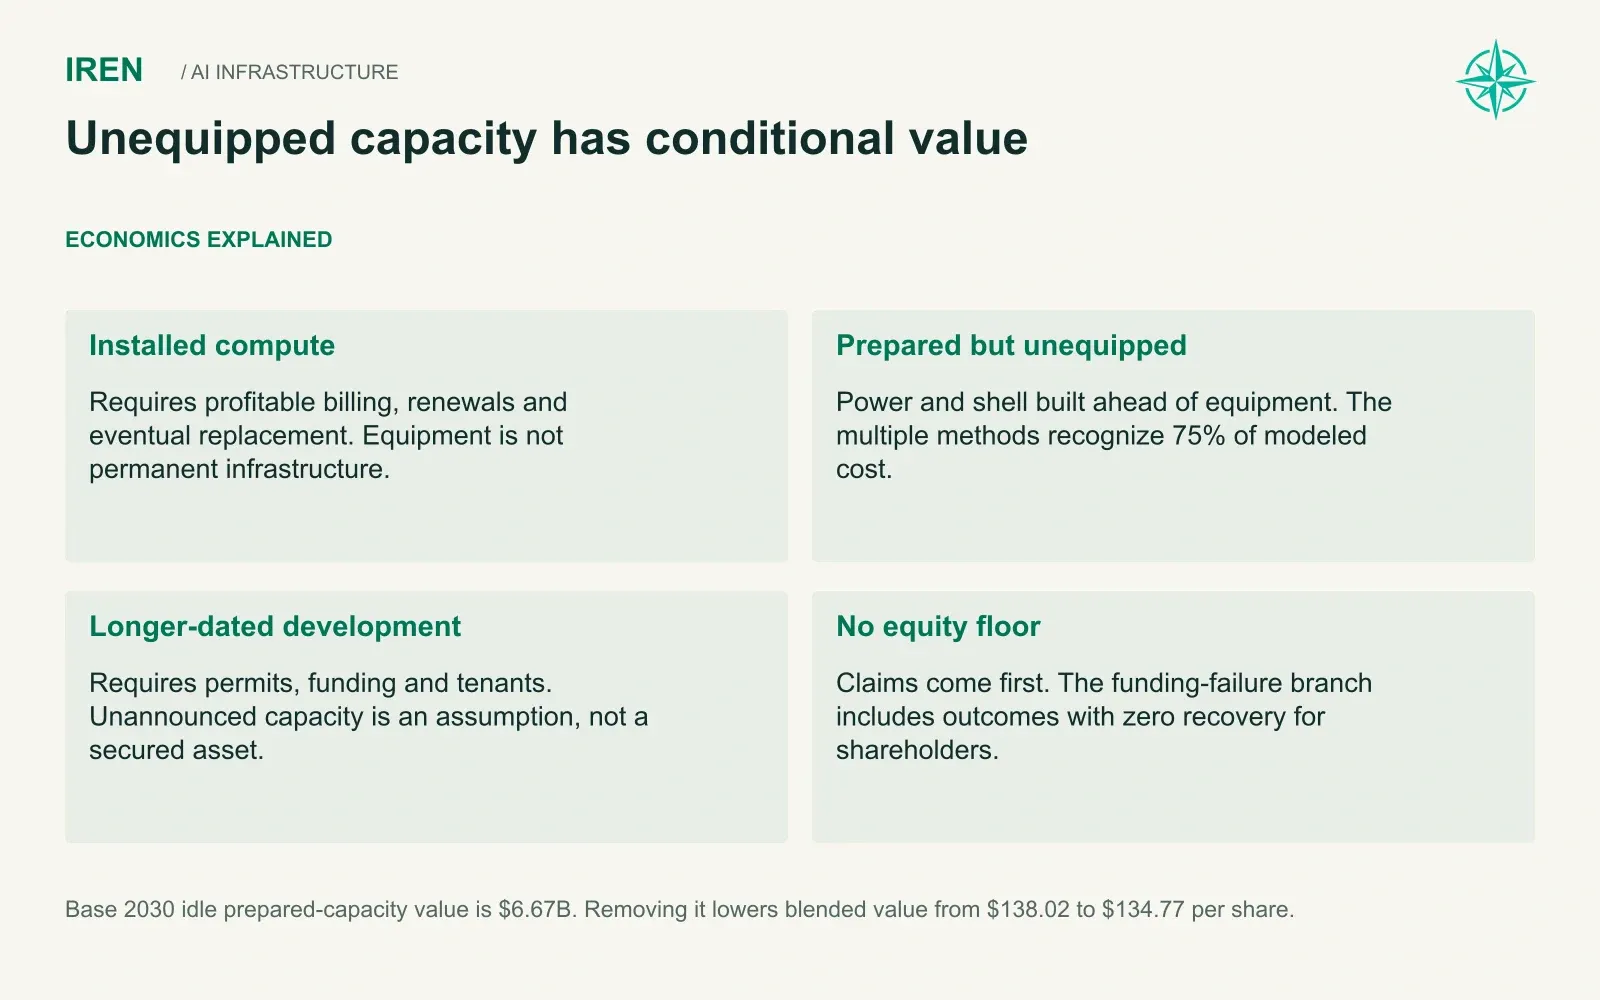
Depreciation erases reported earnings through the decade. By 2030, almost $80B of debt and nearly $40B of customer prepayments stand ahead of shareholders. A capital-access failure is possible too, and we model it explicitly: if IREN loses access to funding in mid-2028 and has to sell assets, shareholders in most paths recover close to nothing after lenders and customers are paid.
None of this is fringe pessimism. Every point above sits inside our own numbers.
Where Northwise Stands
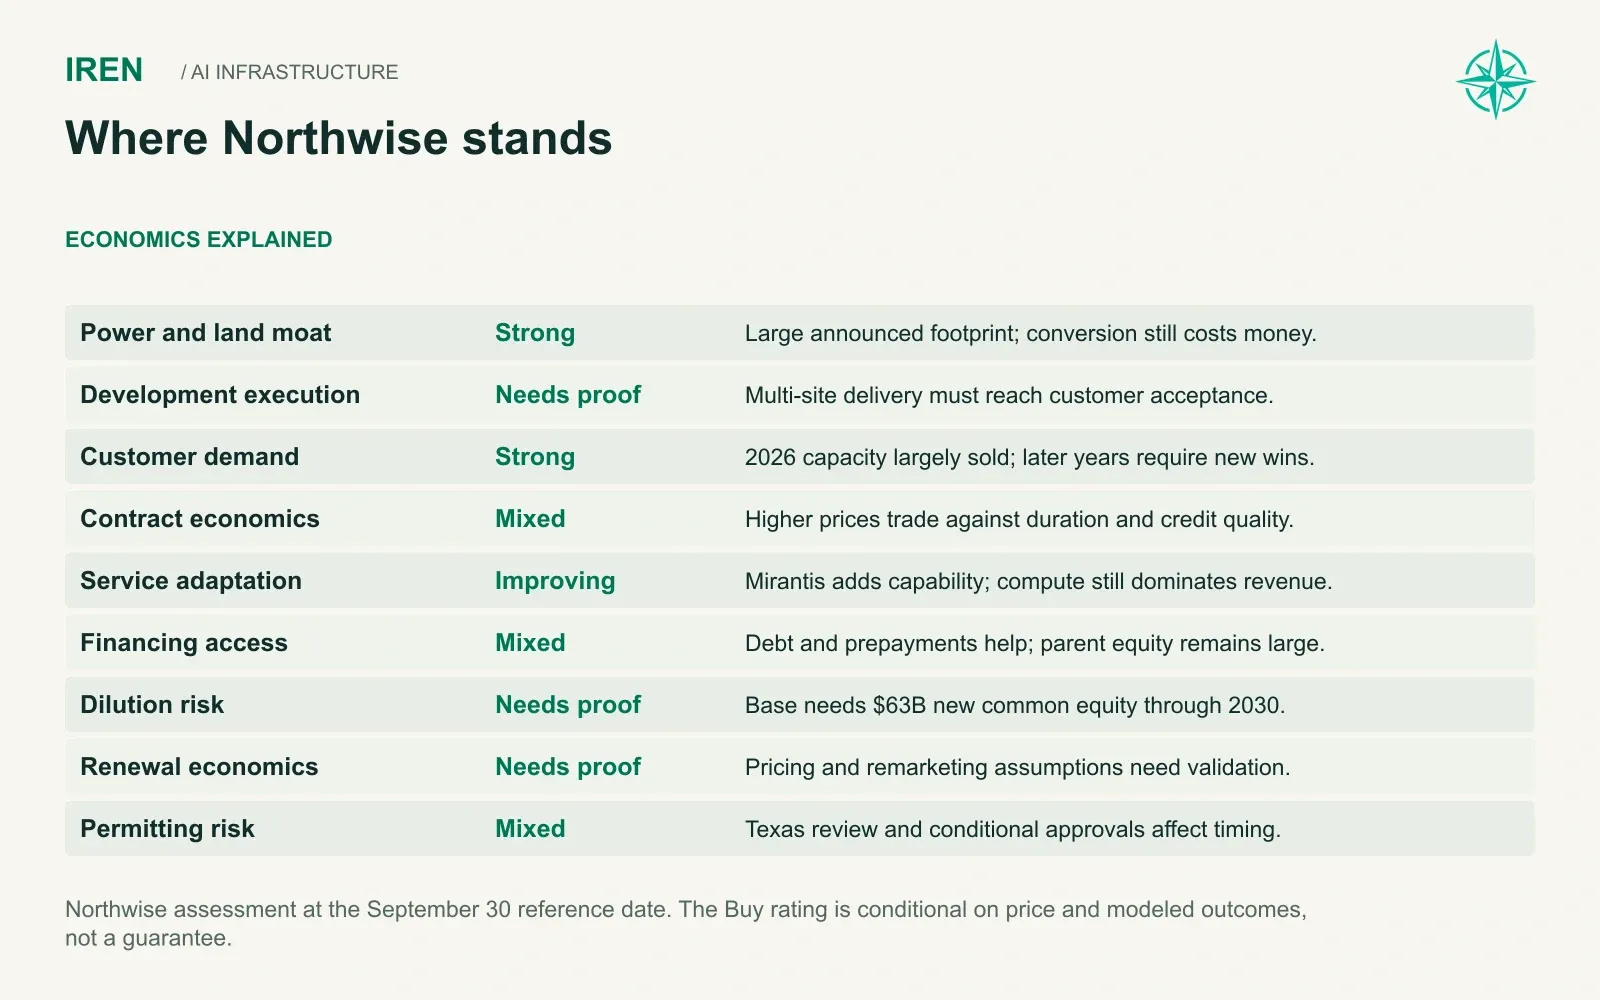
We are constructive on the asset and strict about the price.
IREN's land, power and construction capability are real and scarce. Demand for energized AI capacity remains intense. The services layer is starting to lift revenue per megawatt. In our Base case IREN reaches more than $50B of revenue and $35B of EBITDA by 2030, and we consider that achievable.
The question that matters to shareholders is how much of that business they keep. Three variables decide it: how quickly capacity reaches billing, how many new contracts get signed at acceptable prices, and the share price at which IREN funds the gap. Those three variables explain much of the distance between conservative and optimistic valuations.
We think the right way to value a company like this is as a distribution of outcomes. The full valuation, all 27 paths, present value, our rating and the stress tests that shape them follow below.
How We Value IREN
We value IREN three ways at each year end and blend the results: 40% discounted cash flow, 30% exit ARR multiple and 30% exit EBITDA multiple.
The DCF follows monthly unlevered cash flow through 2040 and adds a terminal value built on normalized owner cash. It captures replacement spending and the long tail of contracts better than any multiple can.
The multiple-based methods apply an ARR multiple of 2.75x, 3.25x or 3.75x and an EBITDA multiple of 8.0x, 9.0x or 9.75x, depending on whether the commercial outcome is infrastructure-led, gradual services or improved services. A richer service mix earns a higher multiple.
Two adjustments separate our work from a quick screen. We subtract the present value of service credits owed to customers, since that service is already paid for and will never bring in cash again. We also solve each per-share value with the convertible notes in place, letting each note dilute only above its threshold and crediting the capped calls up to their caps.
Three Paths Through 2030
2030 value per share | Bear | Base | Bull |
|---|---|---|---|
Discounted cash flow | $25.87 | $137.99 | $229.16 |
Exit ARR | $22.74 | $75.09 | $146.77 |
Exit EBITDA | $68.90 | $201.01 | $335.37 |
Blended 2030 value | $37.84 | $138.02 | $236.31 |
Bear combines slower capacity, infrastructure-led contracts and tighter financing. Base uses central delivery, gradual service growth and central financing. Bull pairs faster delivery with improved services and better financing.
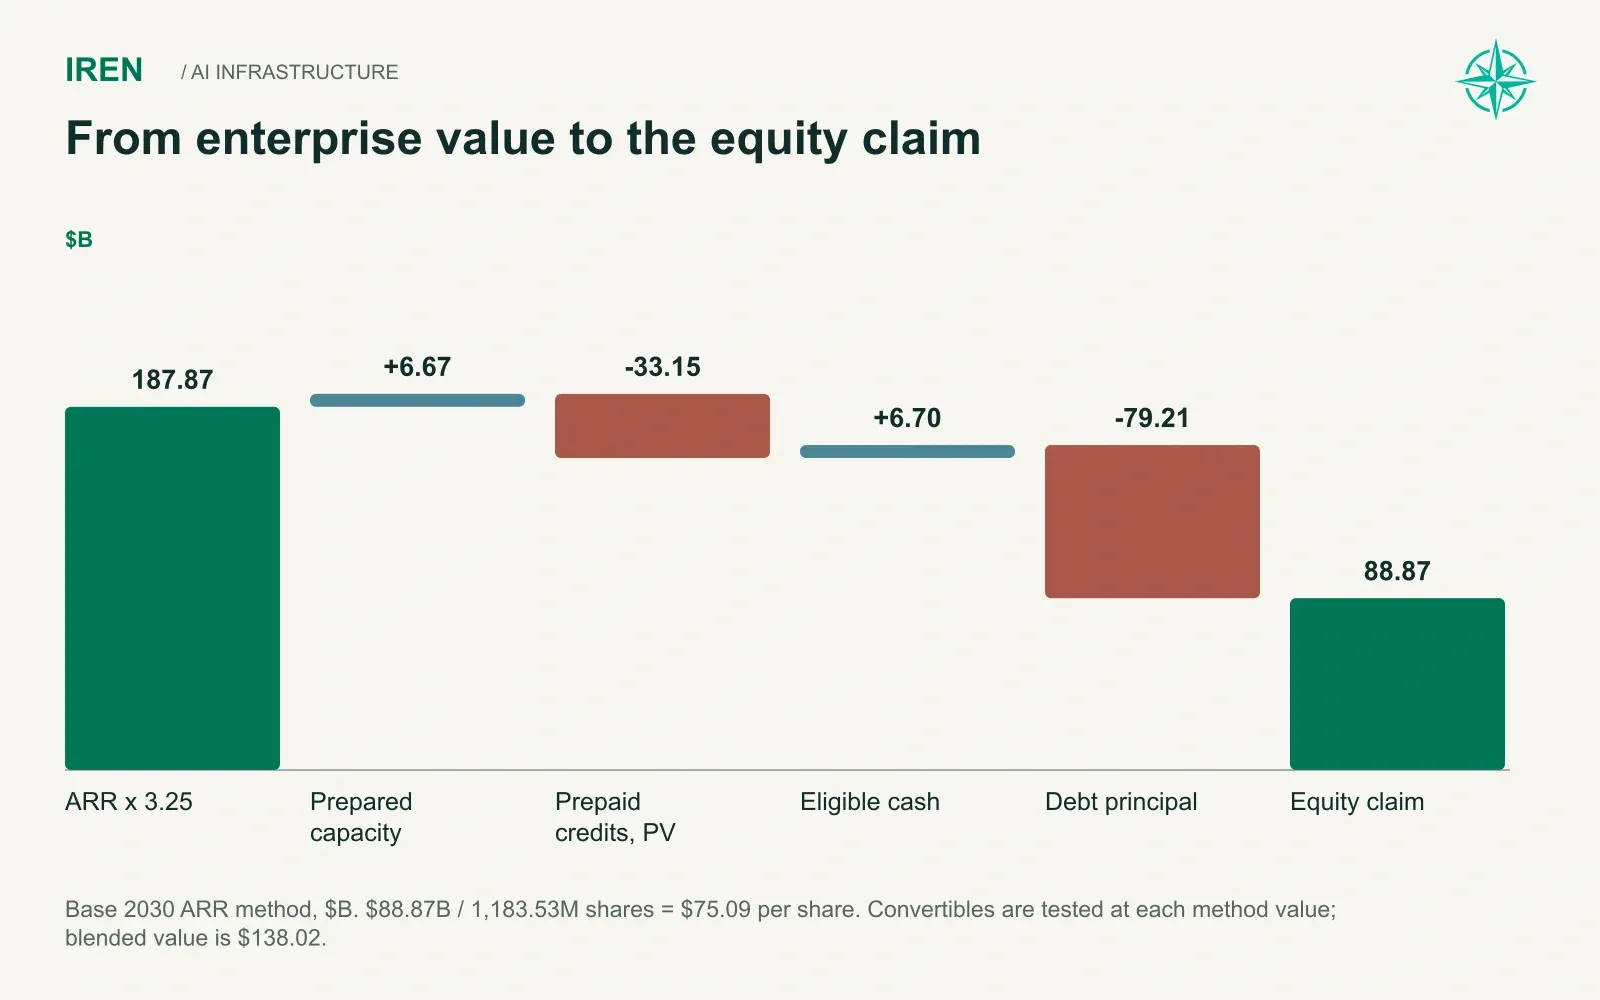
The spread between methods inside Base is instructive. The ARR method lands near $75, while the EBITDA method lands near $201. ARR takes the full weight of $33.2B in prepaid credits and $79.2B of debt against a 3.25x multiple. EBITDA spreads the same claims across a business earning close to 68% margins, and the DCF settles between them at $138.
The year-end marks show how value builds along each path:
Valuation mark, $/share | 2026 | 2027 | 2028 | 2029 | 2030 |
|---|---|---|---|---|---|
Bear | 0.00 | 3.23 | 14.53 | 25.10 | 37.84 |
Base | 47.00 | 56.27 | 76.98 | 101.16 | 138.02 |
Bull | 103.74 | 105.57 | 130.37 | 176.66 | 236.31 |
These marks are what our methods produce at each December. They are not forecasts of the trading price. Bear's zero at the end of 2026 means that on that date, under those assumptions, debt and customer obligations exceed enterprise value, and the equity is purely a claim on what comes later.
Base at $47.00 for December 2026 sits about 15% above today's price. In the near term the market is pricing IREN between our Bear and Base paths, which is a sensible place to sit while most of 2028 through 2030 remains unsigned.
Three paths make useful anchors, but they are only three of 27. The fuller picture comes from running all of them.
All 27 Paths
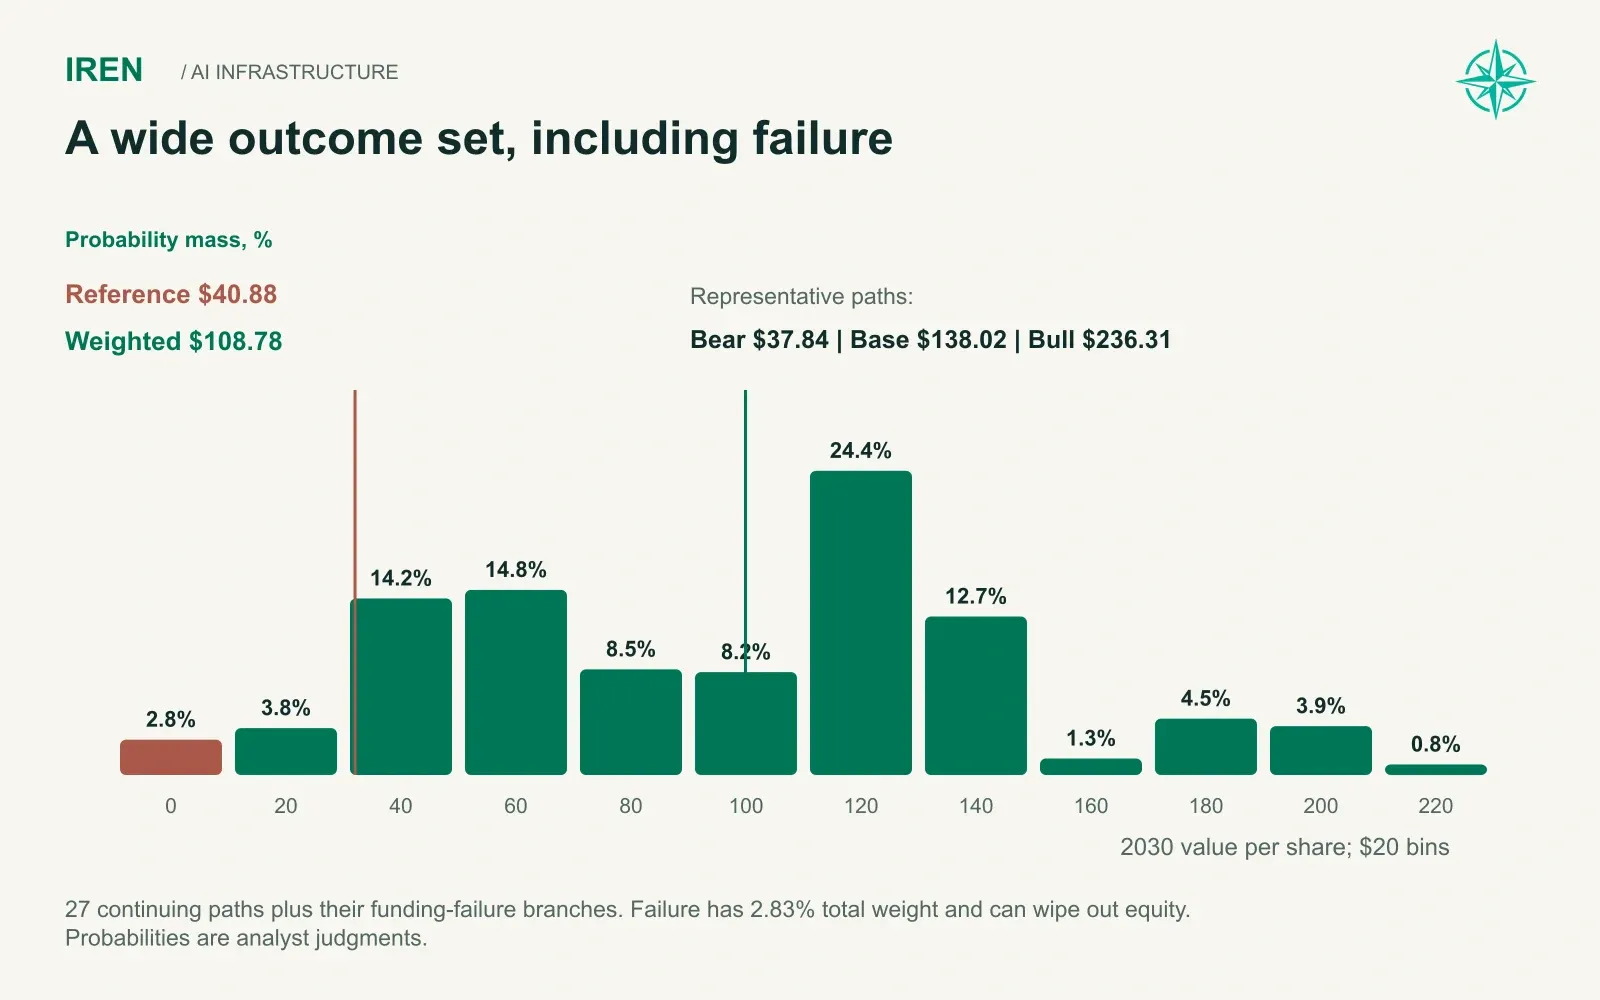
We ran every combination of three capacity paths, three commercial outcomes and three financing conditions, weighting each by our judgment of its likelihood after recent evidence. We then carved a capital-failure branch out of every path, sized by its financing state: 6% of tighter-financing paths, 2% of central paths and 1% of better paths.
Outcome group | Probability | Average 2030 value |
|---|---|---|
Bear | 28.1% | $56.87 |
Base | 58.9% | $118.32 |
Bull | 13.0% | $177.51 |
Probability-weighted | 100% | $108.78 |
The failure branch carries 2.83% of total probability and lowers the weighted value from $111.48 to $108.78.
Across the distribution, the 10th percentile outcome is $45.44, the median is $104.21 and the 90th percentile is $171.69. Those figures describe our assumptions, not a statistical confidence interval.
Two results stand out. The Bear group averages $56.87, well above the Bear representative case at $37.84. Most bearish paths are only partly bad, pairing slow delivery with decent pricing or weak pricing with good financing. And only about 6.6% of the weighted distribution ends 2030 below today's $40.88, mostly from the failure branch and the single worst operating path.
A distribution tells us where outcomes land, but not why. For that we have to break the Base case one variable at a time.
What Moves the Value
We tested 44 variations on the Base case, including individual shocks and combinations. The table below shows the most consequential results.
Base case change | 2030 value | Change |
|---|---|---|
Central Base | $138.02 | n/a |
New contract pricing 10% higher | $177.23 | +28% |
No equipment cost reserve | $149.69 | +8% |
Borrow against seasoned sites | $138.48 | +0% |
Dedicated and managed customers pay in 60 days | $136.45 | (1%) |
One 100 MW customer exits in 2028 | $135.73 | (2%) |
New GPU loans sized to 1.30x coverage | $135.39 | (2%) |
Discount rate 100 bp higher | $130.30 | (6%) |
Electricity cost doubles | $126.06 | (9%) |
Prepayments and loan draws 3 months late | $122.24 | (11%) |
All future equity priced 25% lower | $116.18 | (16%) |
Broader reliability disruption | $114.86 | (17%) |
Equipment and construction cost 10% higher | $112.98 | (18%) |
New contract pricing 10% lower | $102.14 | (26%) |
All new customer acceptance 6 months later | $100.75 | (27%) |
All future equity issued at $46.15 | $85.87 | (38%) |
Pricing down 10%, costs up 10%, equity 25% lower | $66.36 | (52%) |
All new customer acceptance 12 months later | $65.42 | (53%) |
All new customer acceptance 18 months later | $37.73 | (73%) |
The table ranks the risks more clearly than any argument could, and it reorganizes the debate.
Much of what dominates IREN coverage barely moves the value. Lender coverage tests, slower collections, losing one large customer and borrowing against owned property each shift it by 2% or less. The property refinancing raises $5.2B of liquidity and adds almost nothing per share, since the new lender is simply one more claimant ahead of shareholders.
Pricing and cost carry real weight. A 10% move in new contract pricing swings Base value by roughly a quarter either way. Most of that damage comes from lower prices persisting into renewals: confine the same 10% cut to contracts signed before 2031 and value holds at $113.35.
Timing and the share price matter most of all. A 12-month acceptance delay cuts value by more than half. Issuing all future equity at $46.15, about 13% above today's price, cuts it by 38%. The two compound each other, and the second is visible on every trading screen. If the stock stays near $41 while IREN funds a 6 GW build, each new share sold dilutes the remaining ones at exactly the wrong price.
What It Would Take to Break Base
We also ran the question backward, asking how far one variable would have to move, with everything else held, to pull Base 2030 value down to about $46.
New contract pricing would need to fall about 27% across every future contract. Equipment and construction costs would need to rise about 48%. Equity placement prices would need to collapse about 77%, and even that assumes capital stays available at those prices.
Those reverse tests require large isolated changes. Timing is a separate exception: an 18-month acceptance delay brings Base value to $37.73. Combinations are another realistic danger. Pricing down 10%, costs up 10% and equity priced 25% lower produce $66.36. Each of those moves on its own is ordinary in an AI cycle.
Our probability weights are judgments, so we stressed them as well. Shifting 10 points of weight from gradual services toward infrastructure-led outcomes lowers the weighted value from $108.78 to $102.18, and shifting toward improved services lifts it to $113.70. Doubling every failure probability takes it to $106.09. The weighted value turns out to be more sensitive to IREN's commercial mix than to the failure tail.
From 2030 Back to Today
A weighted value of $108.78 at the end of 2030 is worth less today, and how much less depends on the return an investor requires for carrying the risk. Discounted back from December 2030:
Required annual return | Present value | vs $40.88 |
|---|---|---|
10% | $72.54 | +77% |
12% | $67.19 | +64% |
15% | $60.05 | +47% |
18% | $53.82 | +32% |
20% | $50.11 | +23% |
25% | $42.12 | +3% |
30% | $35.65 | (13%) |
Read in reverse, the table says that at $40.88 the market is pricing IREN to return about 25.9% a year to our weighted 2030 target.
Northwise ratings come directly from that implied return. A stock earns a Buy when the probability-weighted target implies 20% to 30% a year from the current price, and a Strong Buy above 30%. For IREN those thresholds fall at $50.11 and $35.65.
Northwise Rating and Price Zones
Share price | Implied return to weighted target | Northwise rating |
|---|---|---|
Below $35.65 | Above 30% CAGR | Strong Buy |
$35.65 to $50.11 | 20% to 30% CAGR | Buy |
$50.11 to $72.54 | 10% to 20% CAGR | Hold |
$72.54 to $108.78 | 0% to 10% CAGR | Trim |
$108.78 to $170.26 | 0% to negative 10% CAGR | Sell |
Above $170.26 | Below negative 10% CAGR | Strong Sell |
At $40.88, IREN sits in the lower half of the Buy range, about $5 above the Strong Buy boundary.
Ideal entry price: below $50.11.
A purchase below $50.11 earns a modeled 20% annual return to the probability-weighted target, which meets the Northwise Buy requirement. Today's price already clears that bar with almost six points to spare. Below $35.65 the implied return passes 30%, which meets our modeled Strong Buy threshold. Funding and contract risks would remain.
From today's price, the return math across the main outcomes looks like this:
From $40.88 to 2030 | Annual return |
|---|---|
Bull case, $236.31 | 51.1% |
Base case, $138.02 | 33.1% |
Probability-weighted, $108.78 | 25.9% |
Bear case, $37.84 | (1.8%) |
Our rating is Buy. The weighted return sits comfortably inside the range, and even the Bear path loses only modestly over four years. The stress tests explain why we stop short of Strong Buy. The weighted outcome partly depends on IREN raising equity at prices well above today's, so a stock that lingers near $40 erodes its own fundamentals. The price would need to fall below $35.65 to clear our modeled 30% annual-return threshold.
Signposts
Five developments will move IREN between rating zones faster than any quarterly earnings figure.
The first is contract signings for 2028. Only 27% of 2028 modeled revenue is signed today. Large signings at or above our pricing move the distribution toward Bull, while dedicated contracts priced below about $20M per IT MW would pull us toward the infrastructure-led paths.
The second is Sweetwater's first 300 MW, targeted for Q4 2027. A six-month slip costs roughly a quarter of Base value, and on-time delivery lets us lower the weight on Slower paths.
The third is the Texas permit review. A resolution without project-specific conditions removes the main source of near-term timing risk.
The fourth is the price of each equity raise. Raises near today's price push IREN toward our $85.87 equity stress, while raises above $60 in 2027 keep the Base path intact.
The fifth is service mix. Managed services climbing toward 15% of new capacity, with fees approaching $2.5M per IT MW, supports a higher multiple and pulls the weighted value toward the improved-services paths.
The Northwise View
IREN is one of the best-placed owners of energized land in the AI buildout, and we believe its operating plan can be delivered. A company with 6 GW of power, Microsoft as an anchor and a growing services layer has a credible path to $50B of revenue by 2030.
Shareholders do not own that business outright. They own a claim that sits behind $79B of debt, $39B of customer prepayments and more than $60B of future equity raises, and its value depends heavily on timing and on the price at which IREN sells new stock.
At $40.88 the market already discounts much of that risk. The weighted 2030 target of $108.78 implies about 26% a year from here, and the Base case at $138.02 shows how much room remains if delivery and funding cooperate.
IREN is a Buy at this price and a Strong Buy below $35.65. The infrastructure was never the question. What decides the outcome is whether IREN can fund the build at prices that leave today's shareholders with a meaningful share of what it creates.
This article is for informational purposes only and does not constitute investment advice. We are not financial advisors.
Appendix: All 27 modeled paths
The path probability below precedes the failure carve-out. Each path splits into a continuing outcome and a funding-failure outcome. Group averages in the report are not these representative case values.
Capacity / commercial / financing | Path probability | Continuing value | Failure probability within path | Failure recovery |
|---|---|---|---|---|
Slower, Infrastructure-led, Tighter | 4.00% | $37.84 | 6% | $0.00 |
Slower, Infrastructure-led, Central | 6.53% | $50.03 | 2% | $0.00 |
Slower, Infrastructure-led, Better | 1.06% | $52.53 | 1% | $0.00 |
Slower, Gradual services, Tighter | 1.97% | $75.10 | 6% | $0.58 |
Slower, Gradual services, Central | 6.67% | $104.21 | 2% | $0.00 |
Slower, Gradual services, Better | 1.38% | $111.18 | 1% | $0.00 |
Slower, Improved services, Tighter | 0.37% | $102.77 | 6% | $0.76 |
Slower, Improved services, Central | 1.23% | $142.51 | 2% | $0.00 |
Slower, Improved services, Better | 0.48% | $152.12 | 1% | $0.00 |
Central, Infrastructure-led, Tighter | 6.00% | $45.44 | 6% | $1.33 |
Central, Infrastructure-led, Central | 9.80% | $66.76 | 2% | $0.00 |
Central, Infrastructure-led, Better | 1.60% | $71.68 | 1% | $0.00 |
Central, Gradual services, Tighter | 6.78% | $88.76 | 6% | $2.13 |
Central, Gradual services, Central | 22.91% | $138.02 | 2% | $0.00 |
Central, Gradual services, Better | 4.74% | $150.88 | 1% | $0.00 |
Central, Improved services, Tighter | 1.40% | $121.65 | 6% | $2.30 |
Central, Improved services, Central | 4.61% | $190.80 | 2% | $0.00 |
Central, Improved services, Better | 1.81% | $209.07 | 1% | $0.00 |
Faster, Infrastructure-led, Tighter | 1.13% | $49.74 | 6% | $2.98 |
Faster, Infrastructure-led, Central | 1.84% | $77.13 | 2% | $0.00 |
Faster, Infrastructure-led, Better | 0.30% | $83.86 | 1% | $0.00 |
Faster, Gradual services, Tighter | 1.91% | $94.62 | 6% | $3.93 |
Faster, Gradual services, Central | 6.46% | $154.88 | 2% | $0.00 |
Faster, Gradual services, Better | 1.34% | $171.69 | 1% | $0.00 |
Faster, Improved services, Tighter | 0.66% | $129.02 | 6% | $4.21 |
Faster, Improved services, Central | 2.17% | $212.71 | 2% | $0.00 |
Faster, Improved services, Better | 0.85% | $236.31 | 1% | $0.00 |
Related IREN research
For the earlier outlook, read our IREN stock forecast. For site context, see Sweetwater, Childress and the IREN infrastructure analysis.
Forecasts and probabilities reflect Northwise assumptions. The representative Bear case is not a loss limit; the failure branches include zero equity recovery.
Explore the IREN financial model
Explore our forecasts, scenarios and valuation assumptions with Northwise Premium.
IREN Stock Forecast 2030
IREN’s new AI-developer contracts are the strongest evidence yet that it can sell something more valuable than bulk hyperscaler capacity.
IREN Stock Infrastructure Analysis
Explore IREN data centers in Canada, the US, Australia and Spain, with site studies and clear distinctions between planned power and delivered AI capacity.

Iren Oklahoma Site
Kiowa, Oklahoma: IREN’s 1.6 GW planned power position, development timing and the remaining delivery dependencies.
Northwise Portfolios
See how the research becomes real decisions
Reader discussion
Discuss the research
Create a Free account to join the discussion with a display name.
Create a Free Account
No comments yet. Start a thoughtful discussion.