
IREN Stock Forecast 2030
IREN’s new AI-developer contracts are the strongest evidence yet that it can sell something more valuable than bulk hyperscaler capacity.
In this article
IREN's new AI-developer contracts are the strongest evidence yet that the company can sell something more valuable than bulk hyperscaler capacity. The opportunity in our IREN Stock Forecast has become materially more credible. Converting a multi-gigawatt platform into durable per-share value still requires exceptional execution, disciplined financing, and protection against bargaining power that has not yet arrived.
Executive Summary
Drive out to Childress County, Texas, and the transition is visible from the road. Inside one fenced campus, bitcoin miners still hash away in air-cooled halls while liquid-cooled GB300 systems come up alongside them, one business quietly funding the replacement of the other.
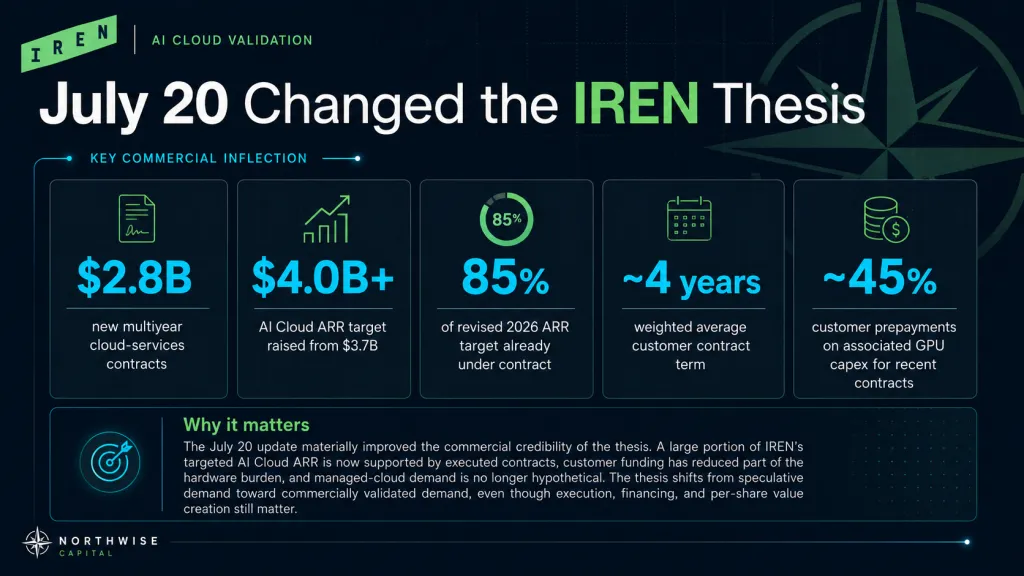
On July 20, 2026, IREN announced $2.8 billion of new multiyear cloud-services contracts, raised its year-end 2026 AI Cloud ARR target from $3.7 billion to more than $4 billion, and disclosed that roughly 85% of the revised target is under contract. The customer list now runs from Microsoft and NVIDIA through Perplexity, Figure AI, Together AI, Fluidstack, Fireworks AI, Fal AI, Hume AI, and one unnamed developer. The agreements cover bare-metal and managed-cloud services, carry a weighted-average term near 4 years, and include prepayments covering approximately 45% of GPU capital expenditure on contracts signed since June 1.
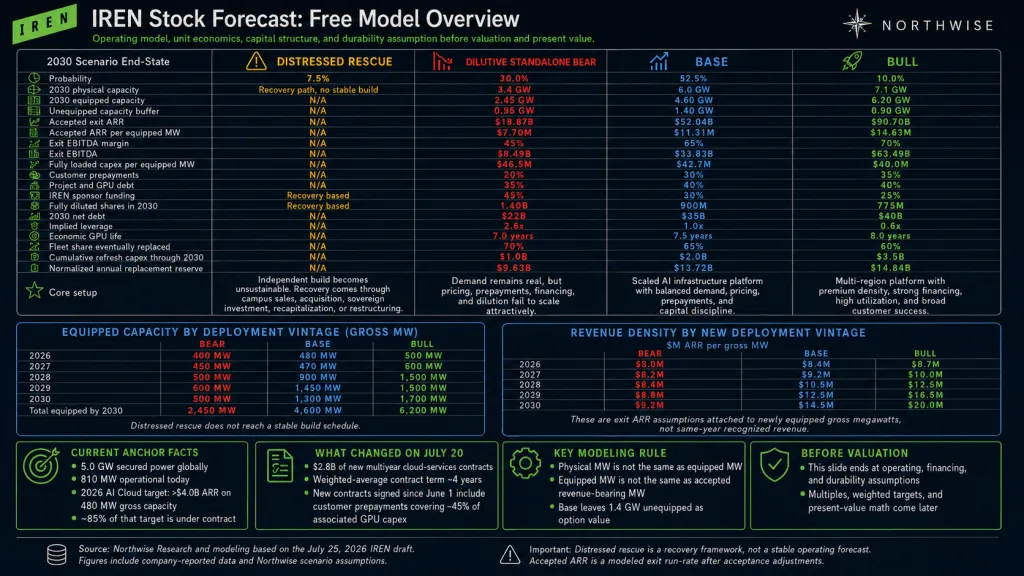
Four figures anchor everything that follows. IREN controls 5 GW of secured power globally with 810 MW operational today. Our base case energizes 6.0 GW by 2030 and equips 4.6 GW of it with compute. Each equipped gross megawatt costs approximately $42.7 million fully loaded, roughly 30% of which customers fund directly, and that build carries the share count to 900 million shares by 2030.
The announcement changes the commercial side of the thesis. Before July 20, the central bear argument held that IREN would build enormous physical infrastructure and remain dependent on a handful of hyperscalers controlling the customer relationship, the software environment, and the negotiating leverage. In that outcome IREN supplies power, buildings, and GPUs without ever developing the capabilities required to defend pricing once supply expands. The contracts do not eliminate that risk, though they make its most severe version considerably less likely.
IREN now sells directly to companies building AI search, humanoid robotics, generative media, model infrastructure, voice systems, and inference platforms. It reaches them through two products instead of one standardized service, and that validation arrived before most of the planned capacity entered service.
The associated capacity remains small against the 480 MW 2026 program and the 1.2 GW 2027 target, which is what makes the announcement simultaneously modest and transformative. It does not prove IREN can fill several gigawatts with diversified, high-value customers. It proves the product exists, that buyers outside the hyperscaler category want it, and that managed-cloud demand has stopped being hypothetical.
This IREN Stock Forecast is organized in 9 parts. Parts I through III cover what changed in July, how mining built the asset base, and the 13 gates a megawatt passes through before it produces cash. Parts IV through VI cover the product, the customer portfolio, the competitive position, and the operating model that carries capacity and revenue density to 2030. Parts VII through IX cover what a single megawatt costs, how the capital structure converts enterprise value into per-share value, and what the whole thing is worth.
The question underneath all of it is narrower than the one the market usually asks. Not whether IREN becomes large, which now seems likely, but how much of the completed platform each existing share will represent.
Part I: What Changed on July 20
1. The Contracts and What They Replace
The $2.8 billion is not the important number. The important number is 85%.
Before the announcement, a large share of the 2026 target rested on management expectations for pricing, utilization, and customer acquisition. At the $4 billion threshold, roughly $3.4 billion of annualized revenue now sits behind executed contracts, leaving about $600 million dependent on further contracting. IREN still has to build and commission the infrastructure, and it no longer has to find customers for most of the targeted revenue base.
The revised target also implies portfolio economics above anything in earlier versions of our model. More than $4 billion across 480 MW of gross AI Cloud capacity implies at least $8.33 million of annualized revenue per gross MW, against roughly $7.71 million under the prior $3.7 billion target. The 480 MW figure did not move, so the 8% uplift comes from pricing, customer mix, storage, or managed-cloud attachment. IREN has stated directly that contracted pricing continues to strengthen.
Two details in the disclosure carry more weight than the headline. Customers are prepaying a substantial share of GPU capital expenditure, which changes how much of the platform IREN must fund itself. And the contracts include managed cloud alongside bare metal, which changes what IREN is selling.
2. Reading $12 Million Per Megawatt
The portfolio average blends hyperscaler capacity, NVIDIA-related infrastructure, earlier cloud agreements, and the new business. The newer contracts appear to sit well above it.
The arithmetic is simple enough to follow. The $2.8 billion of new contract value carries an approximate 4-year weighted-average term, implying roughly $700 million of average annual contract value. If those agreements occupy 58 to 60 MW of gross capacity, implied revenue density lands between $11.7 million and $12.1 million per gross MW.
IREN did not disclose the megawatts assigned to the new contracts. That capacity estimate is a Northwise reconstruction built from the disclosed 2026 program, known anchor contracts, and the residual capacity required to reach the revised target. The figure is an inferred upper-end signal and not a company-reported metric, and it holds unless the associated capacity is materially larger than we estimate.
The distinction governs how the number gets used for the remainder of this report. Our estimate is that the upper end of IREN's newer AI-native and managed-cloud contracts may approach roughly $12 million of ARR per gross MW. The claim is not that IREN's contracts earn $12 million per MW across the fleet.
That level matters where it intersects the project math. Our one-megawatt underwriting, laid out in section 37, requires between $10.94 million and $13.29 million of annual revenue per equipped gross MW to produce sponsor returns of 10% to 25%. Until July 20, revenue density in that band was a modeled requirement with no market observation behind it.
Hyperscalers will likely continue paying less per unit. They contract at enormous scale, carry stronger credit, support project financing, and commit for longer. Smaller AI-native buyers may pay more while requiring more support, carrying more credit risk, and expanding less predictably. The model therefore applies no repricing to older Microsoft and NVIDIA cohorts and uses the signal to support a rising density curve for later deployments only.
3. The Bear Case Moves From Rejection to Compression
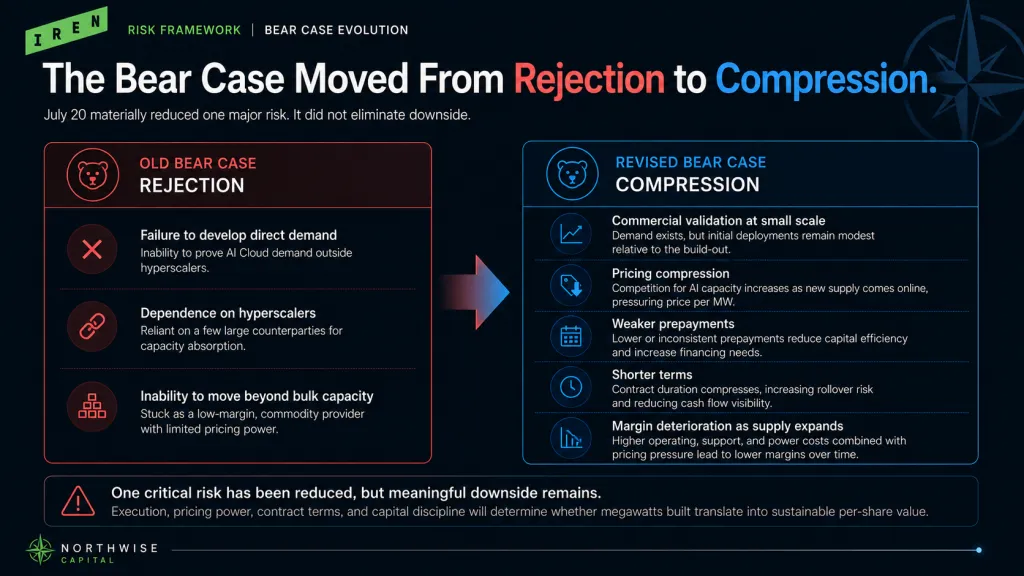
The original commercial bear was straightforward. IREN builds power and GPU infrastructure, fails to develop the relationships and software needed to move beyond bulk capacity, and finds itself undifferentiated the moment supply catches up with demand.
July 20 weakens that argument materially. IREN has attracted a broader group of developers, managed cloud already sits inside customer contracts, pricing is strengthening, and customers are funding hardware. The company is no longer asking investors to assume direct demand will appear after Mirantis is integrated.
The revised bear has to be more demanding. It assumes IREN proves the product at small scale and fails to preserve the economics as the platform expands. Initial contracts commission, managed cloud attracts real customers, density starts above expectations, and physical capacity keeps growing.
The failure arrives later and quietly. Additional infrastructure enters the market, hardware availability improves, hyperscalers finish internal campuses, and developers grow disciplined about infrastructure spending. Customers then ask for lower pricing, smaller prepayments, shorter terms, and stronger guarantees, and margins deteriorate while demand stays substantial.
That shift carries the entire downside case. Revenue can rise while revenue per MW falls, customer count can climb while two counterparties keep the leverage, and managed-cloud revenue can grow while the support costs required to serve it absorb the premium. IREN can build a strategically important platform and issue enough debt and equity that the growth produces weak per-share returns.
The announcement lowers the probability that IREN fails to find customers. It leaves untouched the probability that IREN fails to capture enough value from them.
Part II: The Physical Platform
4. Why Mining Built the AI Business
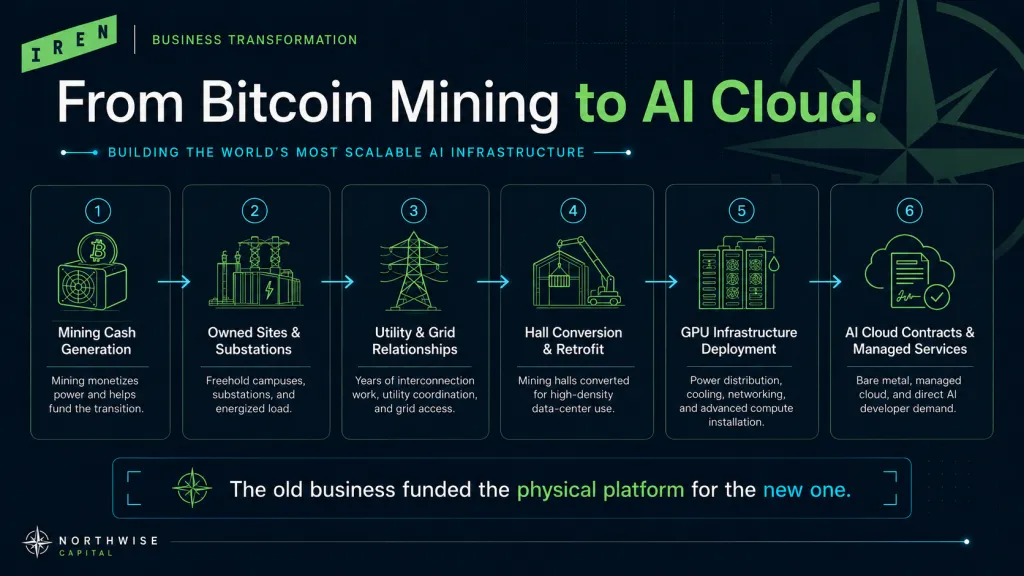
IREN did not enter AI infrastructure as a software company hunting for power. It arrived with energized campuses, utility relationships, owned substations, and a development organization already comfortable deploying capital years before revenue.
Bitcoin mining forced the company to solve hard physical problems before power became the binding constraint in AI. A miner cannot operate without reliable electrical capacity, attractive power economics, and working relationships with the utility and the grid operator. Those capabilities now sit directly beneath the AI Cloud strategy, and IREN owns the infrastructure supporting its 5 GW instead of renting it.
A new provider can raise capital and order GPUs tomorrow. It cannot conjure a grid queue position, a completed interconnection, or an energized substation, and it cannot buy back the years those things took. During a shortage measured in deployment schedules, that time has commercial value.
The two businesses convert the same electricity into computation and share almost nothing after that. Mining monetizes compute through an open protocol, contributing hash power and receiving a probabilistic share of block rewards. IREN does not negotiate the price of a block reward and competes against every other unit of global hashrate.
The March 2026 quarter shows the limitation. Mining revenue fell from $141.2 million to $111.2 million even as average operating hashrate rose from 29.4 EH/s to 36.0 EH/s. IREN improved execution, expanded the fleet, and received worse economics, since the network adjusted around the capacity it added.
AI Cloud runs on commercial contracts, where price depends on GPU type, cluster scale, duration, credit, utilization, and services attached. That creates the possibility of differentiated economics and introduces bargaining power mining never faced. A large buyer negotiates price, term, prepayments, hardware specifications, and renewal rights. Mining counterparties negotiate nothing.
5. What Conversion Actually Costs
The market now values IREN as an AI infrastructure company. The income statement still describes a miner in the middle of changing.
For the quarter ended March 31, 2026, IREN generated $111.2 million of mining revenue against $33.6 million from AI Cloud. Across the first 9 months of fiscal 2026, mining produced $511.5 million against $58.3 million. IREN reported roughly 38 EH/s installed and generally liquidates the bitcoin it mines, so mining functions as a cash-generation business funding the transition.
The gap creates two opposite errors. One values IREN as though the mining-heavy income statement describes the future business. The other values IREN as though the announced run rate has already replaced mining revenue in cash and accounting terms. Neither is true, and the interval between them is where the losses live.
"Convert mining capacity to AI" makes the work sound tidier than it is. Walk a converted hall and the difference is physical: mining racks pulled and palletized, floors reinforced, power distribution replaced, coolant loops threaded through space that previously needed only fans. Some mining-era infrastructure carries forward, and some becomes scrap with a book value attached.
IREN has already booked that cost. The company recorded a $140.4 million impairment in the March quarter against miners and certain IT and electrical equipment at Childress and in British Columbia, with 9-month impairments reaching $188.4 million. Management attributed the write-downs to assets displaced as data centers were redirected toward AI Cloud.
The visible impairment understates the economic cost. Lost mining revenue during retrofit, duplicate staffing, and financing carried before commercial operation never appear as a line item. The largest hidden cost arrives when GPUs land before the hall is ready, since hardware ages economically from the moment it ships. A delayed miner loses some output, and a delayed frontier GPU loses part of the most valuable stretch of its commercial life.
The accounting will look worse before it looks better. The March quarter carried $121.2 million of depreciation, up from $47.3 million a year earlier, alongside $81.8 million of SG&A and a $247.8 million net loss. IREN was depreciating mining hardware, GPU hardware, and data-center infrastructure while writing down equipment the transition displaced.
Early segment margins deserve the same caution. March-quarter AI Cloud revenue of $33.6 million against $4.6 million of reported segment cost excluding depreciation implies an extraordinary gross margin, and that figure excludes GPU and facility depreciation, interest, engineering, and refresh. The early base also enjoys scarcity pricing, few deployments, and hardware at the start of its life. Our model does not treat it as proof that 80% economic margins survive across several gigawatts.
6. The Capital Allocation Culture That Has to Change
Miners are judged on hashrate, fleet efficiency, megawatts energized, and expansion speed. Those metrics build a culture organized around physical scale.
AI Cloud requires a different hierarchy: revenue per equipped MW, contract quality, customer credit, sponsor capital required, and cash return on invested capital. A miner can rationally install the newest efficient machines whenever network economics support it. An AI Cloud operator has to ask whether the capacity is contracted, at what price, for how long, who funds the GPU, and how much equity closes the gap.
The ability to build more capacity is not the obligation to equip it. The strongest version of IREN treats powered capacity as an asset with option value and refuses to destroy that value by forcing weak hardware economics.
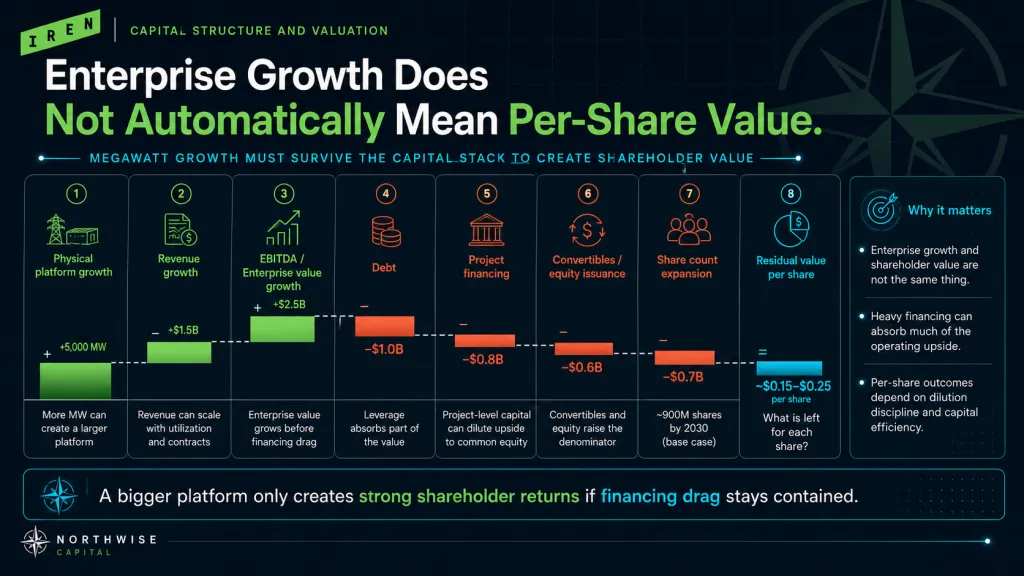
The danger is not that IREN fails to build. The company has proven it can develop sites, procure hardware, raise capital, and move fast. The danger is that management equates a larger platform with greater shareholder value, growing megawatts and revenue and EBITDA while shrinking the economic claim attached to each existing share.
A project can be accretive to enterprise value and dilutive per share at the same time. The difference comes down to the project return, the price at which equity is issued, and how much risk the customer absorbs.
7. The Power Portfolio the Market Misprices
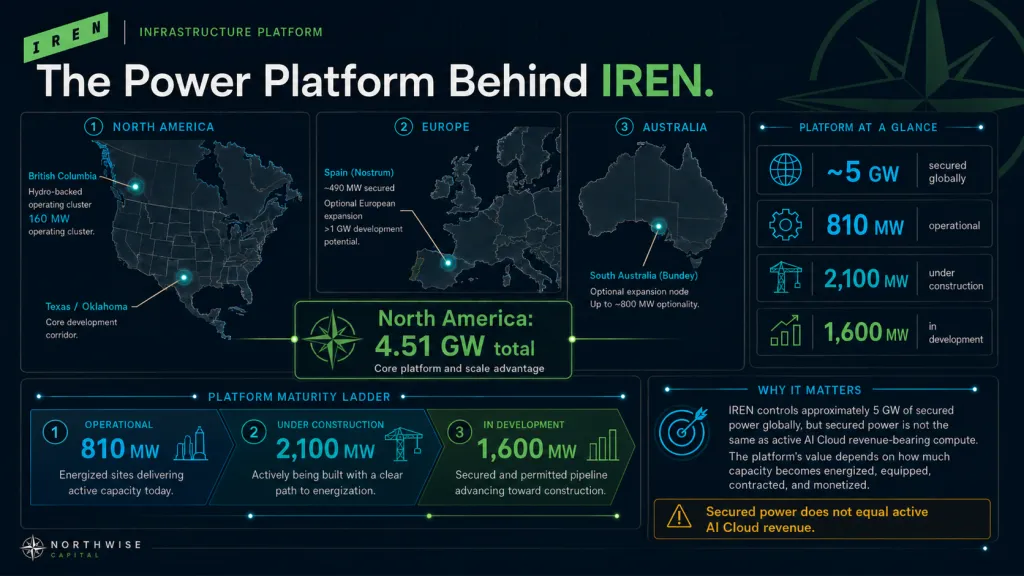
IREN's most valuable asset is not the GPU fleet. It is the platform that makes a GPU fleet possible across three continents.
The market usually discusses IREN through GPU count, contract value, and secured megawatts, which describe different stages of economic development and get treated as one. A secured megawatt may need years of transmission work and permitting before it produces anything. An energized megawatt can hold real strategic value while remaining incapable of running a production cluster.
The asset question is therefore not how many megawatts IREN controls. It is how many it can convert into revenue-bearing capacity, how fast, and how much capital existing shareholders must contribute along the way.
IREN reports approximately 5 GW of secured power globally, with 6 North American locations representing about 4.51 GW. The Nostrum acquisition added roughly 490 MW of secured Spanish capacity plus more than 1 GW of development potential, and Australia adds a long-duration position through Bundey.
Development stage tells you more about the portfolio than the headline number does.
North American status | Capacity | Share of North American portfolio |
|---|---|---|
Operational | 810 MW | 18.0% |
Under construction | 2,100 MW | 46.6% |
In development | 1,600 MW | 35.5% |
Total | 4,510 MW | 100% |
Roughly 65% of North American capacity is operational or under construction, which separates IREN from companies whose capacity exists mainly as grid applications. It also means IREN has entered the most capital-intensive stage of the work. Land and development rights preserve option value cheaply, and transformers, substations, and cooling do not.
The platform grows more valuable as it advances and less reversible at the same time.
The 810 MW operational figure should not be read as 810 MW of active AI Cloud. Operational means the site can take electrical load, and that load may be running bitcoin miners, installed AI hardware, capacity in commissioning, or halls mid-retrofit. The number establishes that a meaningful share of the portfolio cleared the grid and energization stage, and nothing about compute, customers, or collections.
Power is the first constraint and not the final product. The operator has to secure the right to draw an industrial load at a specific site, fund upgrades, procure long-lead equipment, and land power delivery in the same window as data halls and hardware. Grids can produce abundant renewable energy while lacking the transmission to move hundreds of megawatts continuously to a new campus.
IREN's advantage came from starting this work before the shortage reached full intensity. The company owns freehold sites, controls on-site substations at several locations, and has completed grid studies for its major future campuses. That coordination shortens time to compute without reducing the cost of building each layer.
8. Childress: The Flagship and the Concentration
Childress is the most important near-term site in the portfolio and the clearest demonstration that the conversion strategy works.
The campus provides 750 MW across 576 acres of freehold land, connects directly to ERCOT through IREN-owned substations, carries dual diverse fiber paths, and runs both air-cooled and liquid-cooled infrastructure. It is the primary fulfillment site for Microsoft and a major deployment site for NVIDIA-related infrastructure.
The Microsoft project involves approximately $9.7 billion of contract value, an expected $1.94 billion of annualized revenue once fully commissioned, and roughly 200 MW of critical IT load across Horizon 1 through Horizon 4. Northwise's infrastructure reconstruction places the physical Horizon program at approximately 300 MW of gross facility capacity, implying a bridge of about 1.5 gross MW for every critical IT MW. Section 14 explains why that ratio governs more of the model than any other single input.
Childress has already proven several things at once. IREN can convert a mining campus into AI infrastructure, win hyperscaler-scale demand, coordinate construction against advanced GPU procurement, and run two cooling architectures on one site. The company has also achieved NVIDIA Exemplar Cloud status on HGX B300 training workloads, meaning the tested environment performed within NVIDIA reference targets on prescribed multi-node benchmarks including networking efficiency and cluster reliability.
The same campus concentrates a large amount of near-term value in one place. Delays in liquid-cooling commissioning, GB300 delivery, network integration, or Microsoft acceptance move a significant share of expected AI revenue together. Childress must also sequence mining runoff, air-cooled retrofits, two anchor deployments, and additional construction simultaneously.
Microsoft funding covers most of the associated GPU capital through prepayment and investment-grade project financing. The campus underneath it still required land, grid work, substations, and years of prior investment, and later phases may not receive identical terms. Childress proves that exceptional contracts make massive deployments financeable, and it does not prove that the remaining megawatts should be equipped on the same schedule.
9. Sweetwater: The Scale Engine and the Trap
Sweetwater is the largest secured development corridor IREN controls and the site most capable of overwhelming its capital structure.
Site | Capacity | Land | Current status |
|---|---|---|---|
Sweetwater 1 | 1,400 MW | 1,700 acres | Under construction |
Sweetwater 2 | 600 MW | 500 acres | Later-phase development |
Combined | 2,000 MW | 2,200 acres | Phased build |
Both sites connect directly to ERCOT with multiple fiber paths and stated latency below 10 milliseconds to nearby hyperscaler regions. IREN states the combined hub could physically support more than 700,000 liquid-cooled GPUs, which is a design illustration and not an installed fleet. Sweetwater 1 is built around a 1.4 GW bulk substation, which Northwise's infrastructure work records as energized in May 2026.
Stand at that substation and the economics become easier to hold. It is a fenced acre of steel and oil-filled transformers that took years to procure, study, and energize. It does not care which GPU generation eventually sits behind it, and that indifference is precisely why it is worth more than the GPUs.
Energization means the site has moved past an abstract grid position. It does not mean 1.4 GW of revenue is available. Halls, cooling, distribution, networking, hardware, contracts, and acceptance all remain, and the gap between energization and revenue can span years across a full campus.
Sweetwater should be understood as a sequence of investment decisions instead of a binary 2 GW project. IREN can advance substations, civil work, and powered shells without equipping every megawatt, since a substation stays useful across hardware generations while a GPU begins depreciating on arrival. The base model reflects that by letting physical capacity exceed equipped capacity.
Sweetwater 2 extends the runway with contiguous scale and a later delivery window suited to newer GPU generations. Its main risk is premature commitment, since ordering long-lead equipment before customer economics justify the phase would pull sponsor capital forward while Sweetwater 1 is still proving its returns.
ERCOT gives the project large-scale renewable generation, an industrial development ecosystem, and flexible wholesale market structures. It also brings transmission congestion, extreme weather, volatile pricing, and regulatory attention to large flexible loads. Mining could respond to power markets by dropping load, and contracted AI infrastructure is expected to stay available regardless.
Sweetwater is valuable because IREN chooses how fast to develop it. It becomes dangerous the moment management treats 2 GW as a target that must be filled regardless of marginal returns.
10. Kiowa, British Columbia, and the Fleet Cascade
Kiowa provides approximately 1.6 GW across 2,000 acres, connected to the Southwest Power Pool instead of ERCOT. IREN states grid studies are complete, latency to network hubs sits below 6 milliseconds, and power ramps from 2028. Northwise's infrastructure analysis places transformer procurement and civil work through 2026 and 2027, with SPP timing and long-lead equipment as the primary risks.
The later start may prove an advantage. Childress is being converted while operating, whereas Kiowa can be designed from the ground up around Rubin-generation systems, higher rack densities, and lessons from the first two campuses. Intentional design also costs more, and a purpose-built enterprise campus may earn higher revenue per MW while requiring more capex, redundancy, and security to get there.
British Columbia contributes 160 MW across three sites, and its importance exceeds its size. Prince George provides 50 MW with direct BC Hydro connection, dual fiber, more than 23,000 GPUs installed or on order, and average reported PUE near 1.1. Northwise's site work estimates the full 50 MW has been delivered or moved through final commissioning against roughly $500 million of contracted ARR, implying approximately $10 million per gross MW.
That figure is a useful third reference point, sitting between the fleet average and the new AI-native contracts. It validates the operating concept without validating the scaling plan, since a 50 MW air-cooled retrofit in a cold climate establishes nothing about a 1.4 GW liquid-cooled greenfield build.
Mackenzie provides 80 MW with the same efficiency profile and a maximum rack density around 70 kW, and IREN has named it alongside Childress for air-cooled Blackwell deployment in the second half of 2026 covering more than 50,000 additional B300 GPUs. Canal Flats provides 30 MW through a dedicated on-site substation, with Northwise assuming an air-cooled retrofit in 2027 and a shift toward inference workloads. The 70 kW ceiling means both sites drift away from frontier training hardware over time, which changes their optimal workload without making them obsolete.
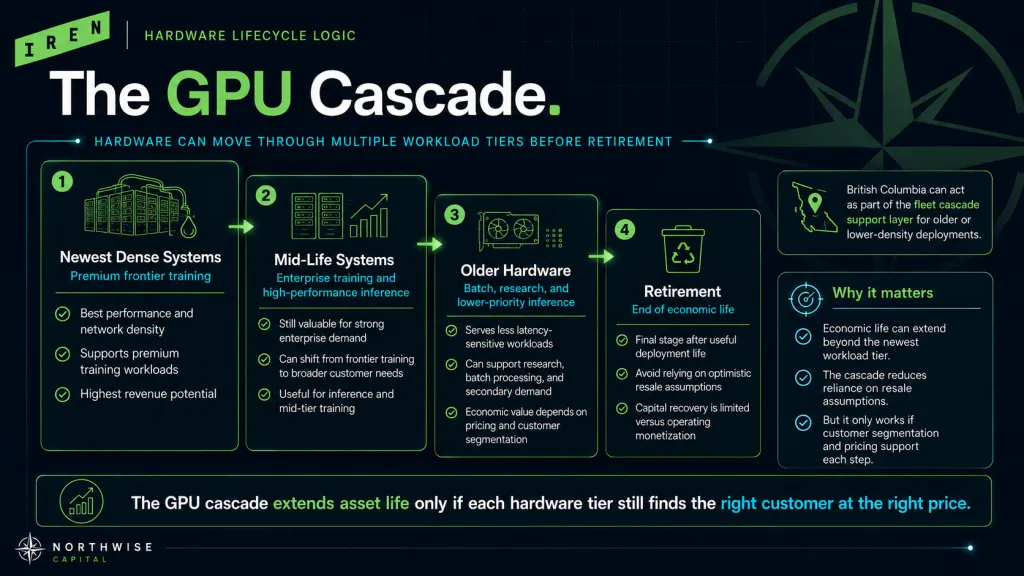
Together the Canadian sites give IREN renewable baseload, existing substations, small environments for testing changes, and somewhere for hardware to go when it ages. That enables a cascade: newest systems take premium training at dense liquid-cooled campuses, mid-life systems move to enterprise training and high-performance inference, older systems handle batch and research work, and equipment retires when power and support costs exceed revenue.
The cascade extends economic life past the first contract and reduces dependence on resale assumptions. It works only if IREN builds the customer segmentation, pricing tiers, and scheduling required to direct workloads into it.
11. Spain, Bundey, and Disciplined Optionality
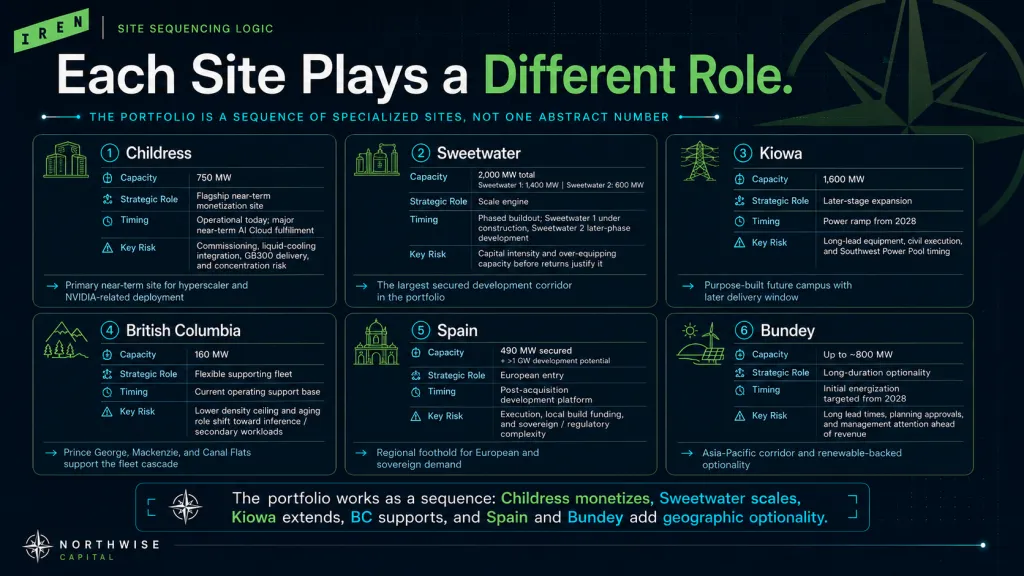
The Nostrum acquisition, completed in June 2026, created IREN's first European position, adding roughly 490 MW of secured grid-connected Spanish capacity, more than 1 GW of further development potential, and a local development and operations team.
Spain's purpose is regional entry. European customers may require data residency, local compute, and sovereign infrastructure, and a provider with physical capacity inside Europe can serve workloads that will not sit comfortably in North America. The acquired local team may matter as much as the megawatts, since a North American operator developing Spanish capacity without one faces a substantial institutional and regulatory gap.
The purchase does not fund the build. IREN must still finance substations, buildings, cooling, hardware, and support, so the 490 MW figure identifies secured opportunity and not completed capacity. Sovereign and regulated European demand can carry premium pricing, since jurisdiction forms part of the product, and those buyers also require auditability, private deployment, and data governance. That strengthens the strategic case for Mirantis more than it strengthens the case for raw capacity.
Bundey covers up to approximately 800 MW in South Australia under a signed transmission connection agreement, with planning approvals pending and initial energization targeted from 2028. Its value is long-duration optionality: an Asia-Pacific corridor, Australian renewable generation, and a platform closer to Asian demand. The long lead time also lets the project consume management attention well before revenue.
IREN has referenced early-stage Texas interconnection opportunities without enough detail to treat them as secured assets, which Northwise labels Batch Zero. Megawatts, land status, connection cost, and timing all remain unknown, so the model treats them as limited optionality and never uses undisclosed pipeline to manufacture a higher base case.
12. Powered Capacity as a Written Option
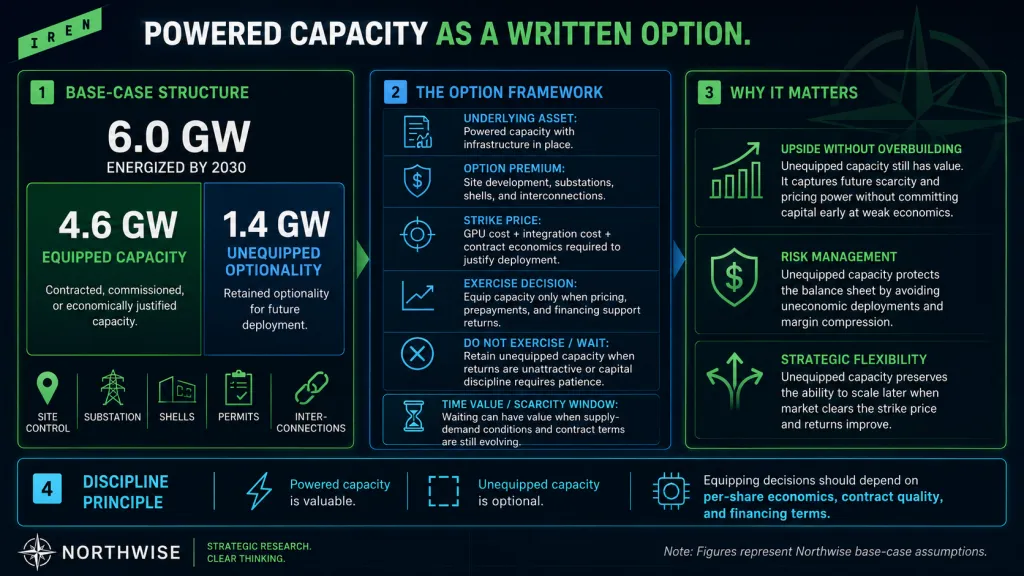
One assumption governs more of the model than any other: IREN does not equip every available megawatt.
The base case energizes approximately 6 GW by 2030 and equips roughly 4.6 GW, leaving about 1.4 GW physically available without a full GPU deployment. Read that gap correctly and it is the most important discipline in the thesis.
The cleanest way to hold it is as an option position. IREN pays construction cost as the premium and buys the right, without the obligation, to install compute later at a strike price set by hardware cost and contract terms. Substations, land, and shells have decades of useful life, and GPUs have 5 accounting years and shorter technological ones. Waiting has value whenever pricing is inadequate, prepayments are weak, debt is expensive, or a new architecture is approaching.
The market may punish unequipped capacity for producing no immediate ARR. Equipping low-return capacity is worse, since it locks in depreciation, interest, principal repayment, and dilution against revenue that never clears the hurdle. The objective is maximum risk-adjusted value per share and not maximum equipped megawatts.
The portfolio should also retain value if the independent strategy underperforms. Hyperscalers, infrastructure funds, sovereign investors, and utilities could all pay for an advanced site to skip years of grid studies, land assembly, permitting, and substation procurement. That supports an asset-based rescue above zero without creating a floor, since any distressed transaction first satisfies secured debt, convertibles, project financing, and restructuring costs.
Timing determines the outcome. Distress arriving before heavy leverage and dilution leaves shareholders meaningful recovery. Distress arriving after years of debt-funded expansion leaves valuable assets attached to weak residual equity.
The market can misprice this portfolio in both directions. The bearish error treats IREN as a former miner with commodity hardware and speculative power claims, ignoring owned substations, completed grid studies, and the years required to replicate the footprint. The bullish error treats 5 GW as though it already deserves AI Cloud revenue and margins, ignoring development stage, conversion ratios, hardware capex, acceptance, and dilution.
Accounting values fail in both directions too. Land bought before AI demand intensified and interconnection rights are probably understated. Mining equipment, older GPUs, and electrical systems incompatible with modern density are probably overstated, and the recent impairments demonstrate that historical cost guarantees nothing about recoverable value. The same principle will eventually reach the AI hardware.
The strongest version of the thesis treats the sites as one system instead of separate rental operations. Frontier training runs on new liquid-cooled systems in Texas and Oklahoma, mature inference migrates to British Columbia, European sovereign workloads stay in Spain, and Asia-Pacific eventually uses Bundey. Without a unified customer layer, IREN owns valuable infrastructure while its customers capture the platform economics.
The power portfolio is the strongest part of the investment case and the source of its largest financial danger. Every stage of physical advancement makes the next capital commitment easier to justify and harder to reverse.
Part III: The Conversion Stack
13. Thirteen Gates From Grid to Cash
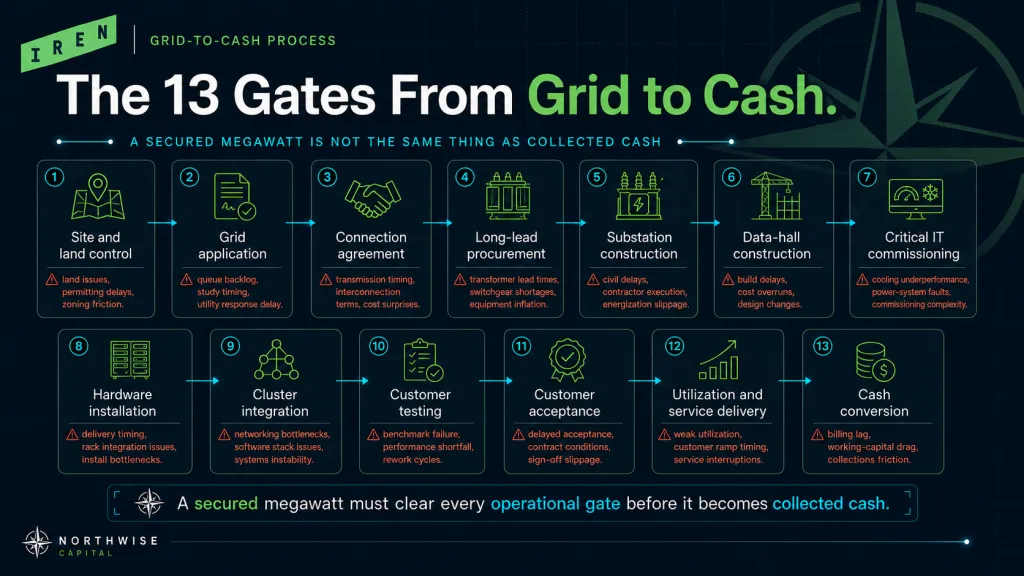
What has to happen between a signed power agreement and a dollar of collected cash?
More than most models admit. A secured megawatt is not an operating asset, an energized megawatt is not equipped, an equipped megawatt is not accepted, and recognized revenue is not collected cash. IREN can advance several stages at once and cannot skip any of them.
Gate | Milestone | What can still fail |
|---|---|---|
1 | Site and land control | Permitting, local opposition, unsuitable conditions |
2 | Grid application | Queue delay, study failure, upgrade cost |
3 | Connection agreement | Transmission timing, revised cost allocation |
4 | Long-lead procurement | Supplier delay, cost inflation, design mismatch |
5 | Substation construction | Commissioning failure, grid delay |
6 | Data-hall construction | Labor, cooling, design, schedule, cost |
7 | Critical IT commissioning | Conversion mismatch, thermal or electrical underperformance |
8 | Hardware installation | Delivery timing, damage, integration problems |
9 | Cluster integration | Networking, firmware, storage, orchestration bottlenecks |
10 | Customer testing | Benchmark failure, reliability issues |
11 | Customer acceptance | Delayed revenue and billing |
12 | Utilization and service delivery | Weak usage, downtime, support cost |
13 | Cash conversion | Receivables, prepayment credits, debt service, refresh capex |
Capital exposure rises as uncertainty falls, which produces the governing paradox of the whole stack. The closer a project moves toward revenue, the more expensive its remaining failure becomes. An early failure wastes deposits and time. A late failure strands a completed building, a full compute system, and the debt behind both.
IREN Conversion Stack Capital Exposure Curve Northwise
The early gates favor IREN. The company controls large freehold sites instead of short-term leases, which gives it design and expansion control, though land ownership creates no usable power by itself. A multi-hundred-megawatt campus requires feasibility and system-impact studies, security deposits, transmission-upgrade agreements, and load-ramp schedules before anything gets built.
Those stages deserve different valuations. A grid application creates possibility, a completed study creates confidence, a signed agreement defines a delivery path, and an energized substation is physical evidence. A 1.4 GW or 1.6 GW development right does not mean the full load arrives at once, and power typically releases in stages as the rest of the campus advances.
Long-lead electrical equipment sets the schedule more often than construction does. Transformers and switchgear require custom engineering, long manufacturing lead times, factory testing, and specialized installation. Ordering early protects the schedule and commits capital before customer identity, hardware generation, and financing are settled, which is defensible when customers will not wait years for procurement to begin. The risk is locking a project into an outdated design or a schedule that no longer matches hardware delivery.
14. Gross Megawatts Versus Critical IT Megawatts
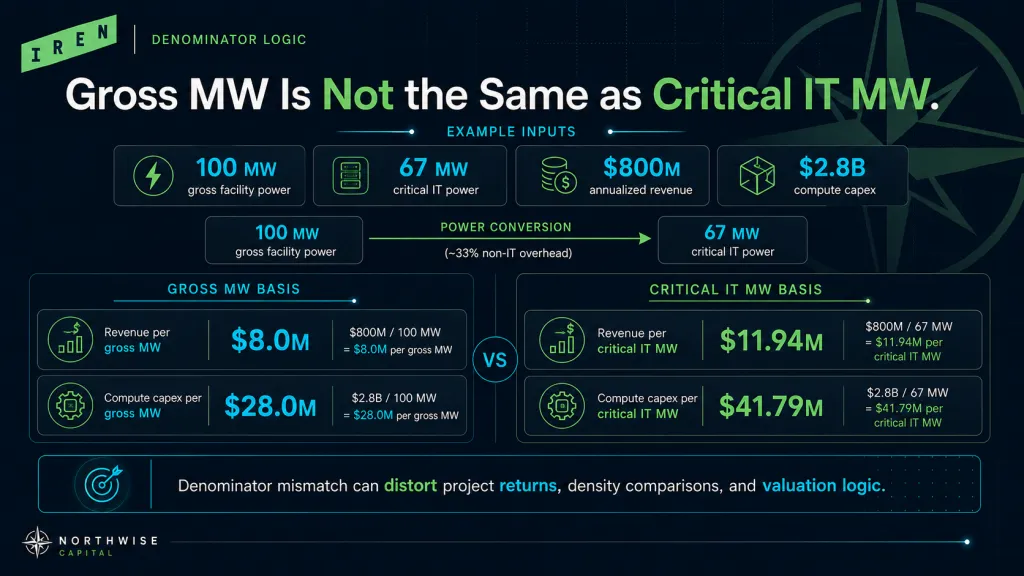
This is the largest unresolved technical issue in the model, and it hides inside almost every metric investors quote.
IREN discusses capacity in gross megawatts. Customer and hardware economics attach to critical IT megawatts. Gross facility power runs the compute plus the cooling, pumps, fans, lighting, security, and electrical losses that keep it alive, and the ratio between the two depends on cooling architecture, climate, rack density, redundancy, and where the measurement boundary sits.
The Microsoft deployment provides the clearest bridge, at approximately 300 MW gross supporting approximately 200 MW of critical IT, or roughly 66.7% availability. That ratio should not travel across the portfolio unexamined, since British Columbia's air-cooled sites, Sweetwater's liquid-cooled halls, and Kiowa's later design all convert differently.
A denominator mismatch distorts everything downstream. Take a project with 100 MW gross, 67 MW critical IT, $800 million of annualized revenue, and $2.8 billion of compute capex. Revenue density reads $8 million per gross MW or $11.9 million per critical IT MW. Compute capex reads $28 million per gross MW or $41.8 million per critical IT MW.
All four figures are correct and answer different questions. Apply revenue on one basis and hardware capex on the other, and project returns move by a wide margin in whichever direction the modeler prefers. Northwise treats the bridge as an explicit sensitivity and never buries it inside a blended assumption.
15. Commissioning, Acceptance, and the Rising Cost of Stopping
Critical IT commissioning is where a building finds out whether it is a data center.
Testing runs load banks against the electrical system, pushes the cooling to full thermal load, and validates redundancy, failover, and integrated controls with no customer in the building and no revenue on the meter. Problems invisible during construction surface here. Cooling that performs at partial load fails under sustained heat, backup power fails to transfer cleanly, a network route introduces unexpected latency.
Every one of those is fixable. Each is expensive at this point, since most of the project capital is already in the ground.
The facility becomes useful only after the full compute system arrives, and the GPU is one component among many that decide whether it performs. A cluster with premium accelerators and inadequate networking delivers poor economics, insufficient storage leaves accelerators waiting on data, and weak monitoring turns routine failures into extended outages.
Hardware timing creates a three-way coordination problem across facility readiness, equipment delivery, and customer commencement. Finish the hall first and fixed costs run against an empty building. Take hardware first and supplier payments begin, warranties start, and technological aging precedes revenue. Slip the customer and completed infrastructure sits idle while financing costs accrue.
Large projects rarely align all three, so the model builds in partial-year deployment, acceptance lag, and idle commissioning capacity instead of assuming instant monetization.
Installed servers still do not make a cluster. Integration runs from network fabric and storage configuration through firmware compatibility, scheduling, and monitoring, and the system performs at the level of its weakest layer. Training jobs spanning thousands of accelerators expose that layer quickly, whether through a network bottleneck, unstable node groups, or cooling that forces throttling. Customers pay for effective throughput, which is where managed-cloud capability becomes an economic question instead of a technical one.
Acceptance converts a physical system into a commercial service, triggering contract commencement, billing, revenue recognition, and service obligations. Contracted ARR is therefore not accepted ARR. A cluster can pass every internal test and still miss customer-specific requirements on multi-node scaling, inference latency, or reliability thresholds, delaying the entire commercial start after the capital is spent.
16. Why ARR Is an Exit Rate, Not a Year
IREN calculates ARR as hourly pricing on commissioned GPUs at year-end multiplied by 8,760 hours, plus annualized storage and ancillary revenue.
That answers one question: what would this capacity produce if the year-end rate ran for a full year. It does not answer what IREN recognized during the year, and the difference is large during a build.
Capacity accepted on October 1 contributes 3 months of revenue and a full 12 months of ARR. Capacity accepted on December 20 contributes almost nothing to the year and moves the exit rate materially. IREN can therefore exit 2026 above $4 billion of ARR while reporting far less than $4 billion of AI Cloud revenue for the year, which is timing and not inconsistency.
Certainty increases along a hierarchy: targeted ARR, contracted ARR, commissioned ARR, accepted ARR, revenue-bearing ARR, recognized revenue, collected cash. July 20 moved a large block of the 2026 target from the first rung to the second, which is real progress and not the last rung.
The definition also includes storage and ancillary services, so revenue per MW is not a GPU rental metric. A customer can buy compute, storage, networking, support, orchestration, and security against the same physical footprint, all of which lift revenue without adding megawatts. The $12 million signal may therefore reflect a broader package as much as expensive compute.
17. Prepayments, Debt, and the Cash Gate
Acceptance creates the right to bill. Utilization determines what the capacity actually earns.
Utilization means different things depending on who says it: GPUs assigned to a customer, capacity contractually reserved, accepted capacity billed, theoretical compute consumed, or hardware operational time. A take-or-pay contract protects revenue when the customer underuses the cluster, and a usage-based managed-cloud agreement does not. A reserved cluster can sit underused and fully paid, while a multi-tenant platform can show strong demand and weak physical utilization through scheduling friction.
The model separates contractual protection from operational usage by applying a revenue-bearing factor to equipped capacity, capturing deployment timing, acceptance lag, operational ramp, and unallocated capacity.
Recognized revenue and collected cash diverge in both directions during expansion. Prepayments push collections above revenue early, and receivables and prepaid credits push revenue above collections later. Both are rational, and neither is free cash flow.
The prepayment mechanism deserves care since it runs in two phases. The customer pays before full service delivery, IREN reduces its GPU funding need, and revenue is then recognized across the service period while later invoices are reduced against the prepaid balance. Both phases belong to the same contract, and celebrating the first while treating the second as a working-capital surprise misreads the economics.
Scaling the 45% figure correctly matters more than any other number in the disclosure. It applies to associated GPU capital expenditure, not to land, substations, buildings, cooling, networking, or corporate overhead. Section 35 works the conversion through the full project cost stack, and the short version is that it funds roughly 30% of a complete project.
Project debt behaves similarly. It improves equity returns when revenue is contracted, interest sits below project returns, amortization matches cash generation, and hardware outlives the repayment schedule. A 5-year customer contract funded with 3-year equipment debt can be profitable across its life and painful in year 2, so the model includes principal repayment instead of interest alone.
Collected cash is the final operating gate and not the final shareholder gate. Project cash still has to fund operating costs, support, interest, principal, maintenance, taxes, overhead, and refresh before anything reaches common equity. That residual is why adjusted EBITDA can look extraordinary while free cash flow stays weak.
The model carries separate schedules for physical, equipped, average equipped, and revenue-bearing megawatts. Annual revenue is average equipped MW multiplied by vintage density multiplied by the revenue-bearing factor, and exit ARR uses year-end equipped MW by vintage against an acceptance factor. That structure blocks the four most common errors: treating year-end capacity as available all year, treating installed hardware as accepted, applying 2030 pricing to the entire fleet, and converting gross megawatts directly into critical IT economics.
The binding constraint also migrates. Early development is gated by land, studies, and permitting; the build by transformers and labor; the launch by testing, acceptance, and utilization; and mature operation by renewal, pricing, and refresh. IREN's historical strength sits in the early gates, and the later ones depend on software, support, and pricing power. That is the deeper significance of July 20: evidence that the company is moving through the commercial gates and not only the physical ones.
Part IV: The Product and the Customer
18. What Bare Metal Does Well and Where It Breaks
IREN's long-term value depends on what it can sell above the concrete.
Bare metal gives customers dedicated physical servers with no shared virtualization layer between them and the machine. IREN supplies the hardware, networking, storage connectivity, facility operations, and component replacement, and the customer keeps control of operating systems, cluster software, scheduling, and security configuration.
That suits technically sophisticated buyers with internal platform teams. Hyperscalers, frontier laboratories, and AI infrastructure companies do not need IREN managing their software stack. They need a large, reliable cluster available sooner than anyone else can deliver one.
Bare metal can produce strong project economics even at lower revenue per MW. It absorbs capacity in large blocks, keeps customer-acquisition cost low, minimizes software customization and support expense, and makes project financing straightforward. One 100 MW customer is operationally simpler than 100 customers at 1 MW each, even when the smaller buyers pay more per unit.
The strategic weakness appears when bare metal becomes the whole business. A customer using IREN purely for dedicated hardware controls the workload, the software environment, the data, and the end-user relationship, which leaves IREN replaceable the moment someone offers comparable capacity cheaper. Competition intensifies as GPU supply improves, powered data centers open, cluster designs standardize, and workloads become more portable.
During an acute shortage, availability is differentiation. After it, the customer runs a comparison, and pricing, duration, prepayments, and termination rights all move against the provider. The physical assets stay valuable while the margin attached to them compresses.
Bare metal is not perfectly interchangeable. Moving a large production workload requires data migration, network redesign, security review, and validated performance, and dedicated clusters are often configured around a specific architecture. That friction is real and weaker than the integration a full managed environment creates.
19. What Managed Cloud Adds and What It Costs
Managed cloud changes IREN's role from providing the building to operating it.
The product spans provisioning, orchestration, Kubernetes, storage, networking, monitoring, security controls, incident response, and customer onboarding. Those capabilities matter as complexity compounds across more sites, more hardware generations, and more customer types. A physical platform scales through repeated construction, and a cloud platform has to scale through automation.
Managed cloud lifts revenue density through several channels at once. Service attachment lets customers buy storage, networking, orchestration, and support against the same footprint. A 2 MW customer pays more per unit than a 200 MW hyperscaler, with less volume leverage and greater assistance needs, and buyers also pay premiums to skip building an infrastructure team.
Higher revenue does not become higher returns automatically. Managed services require platform engineers, site-reliability engineers, solutions architects, security staff, and account management, and 20 customers at 1 MW each require 20 onboarding processes and 20 security reviews against one for a single bare-metal tenant. The premium creates value only when incremental revenue exceeds the incremental cost of delivering it, which is why our model lifts later-cohort revenue density without lifting EBITDA margins on the same evidence.
A deeper platform can also improve utilization and extend hardware life. A pure bare-metal provider dedicates full clusters to customers who may not consume them, while a managed multi-tenant platform can schedule across available infrastructure when workload compatibility and isolation requirements permit. Some customers require dedicated hardware, so this is an opportunity and not an automatic efficiency gain.
The service layer becomes most valuable as the fleet ages. A customer who wants only the newest accelerators leaves when the cluster turns 4, while a managed platform can segment workloads across pricing tiers and keep older systems earning.
20. Mirantis: From Demand Creation to Scaling
IREN agreed to acquire Mirantis in May 2026 as the third layer of a strategy built on physical infrastructure, compute, and software. Mirantis brings more than a decade of cloud-infrastructure experience and relationships with over 1,500 enterprises.
Its k0rdent Enterprise platform manages Kubernetes clusters, services, and observability across public clouds, private data centers, bare metal, and edge environments, with documented multi-cluster management, lifecycle automation, service templates, bare-metal provisioning, air-gapped deployment, and enterprise security. Mirantis also runs 24-hour enterprise support covering deployment from proofs of concept through complex production systems.
Before July 20, the acquisition rested on strategic logic. IREN owned the infrastructure and lacked the software and support layer required to move upward, and Mirantis appeared to be the path. The contracts show managed cloud is already being sold, which means Mirantis accelerates an existing product instead of inventing one.
That is a materially stronger thesis and a more measurable one. The bet shifts from creating demand to standardizing deployment, increasing service attachment, reducing onboarding time, and managing fleet complexity across regions.
Scale is the open question. A small block of managed-cloud customers can be carried on dedicated engineering, bespoke support, and senior management attention. A multi-gigawatt cloud requires standardized deployment, repeatable support, automated orchestration, and billing that works without heroics, and if every new customer needs a bespoke environment, revenue grows and margins decay.
Standardization has limits in the other direction. Customers choose specialized clouds partly for flexibility hyperscalers will not offer, competing through dedicated clusters, hardware choice, custom networking, and direct engineering access. Too much standardization erases that advantage and too much customization erases operating leverage, so the target is standard architectures with controlled options layered above them. Separating stable infrastructure from configurable customer environments may be the most valuable thing Mirantis does.
Mirantis presents k0rdent AI as an open, standards-based platform and has stated the acquisition preserves its open-source commitments and ability to serve the broader market. That openness eases migration onto IREN and eases migration away from it, so the company has to hold customers through reliability, performance, support, and economics. We regard that as the healthier long-term strategy and a weaker source of artificial lock-in.
Independence cuts both ways as well. It lets Mirantis keep existing customers and earn external validation while allowing its resources to support IREN competitors and its priorities to diverge. Overintegration damages Mirantis, and underintegration leaves IREN without the operating benefit it paid for.
The customer list validates AI-native demand and proves nothing yet about conventional enterprises. Enterprises require formal procurement, long security reviews, compliance documentation, and multi-year account management, and those cycles run slower while producing more durable customers. The model does not treat 1,500 Mirantis relationships as 1,500 prospective GPU customers, since they represent distribution potential and not contracted demand.
Security becomes a strategic requirement in this transition. Bare metal isolates customers physically, and managed cloud expands the surface to access control, tenant isolation, patch management, and incident response. IREN's appointment of a Chief Information Security Officer in July 2026 reflects that shift, and a serious failure would cost customers, contracts, and enterprise credibility at once.
The acquisition can still fail through talent loss, Mirantis customer churn, product distraction during a massive physical build, or support costs that outrun cross-selling revenue. We will judge it on operating evidence and not on product descriptions.
21. Microsoft and NVIDIA: Anchors and Constraints
Microsoft is less a customer than a financing structure with a service agreement attached.
The relationship provides approximately $9.7 billion of contract value, investment-grade counterparty credit, a substantial prepayment, and access to contract-backed GPU financing. Microsoft's prepayment and IREN's $3.65 billion GPU facility together fund nearly all of the GPU capital in the deployment, which collapses the sponsor equity required for the compute layer.
That structure is exceptional and unlikely to repeat at every site. Microsoft's credit lets lenders underwrite with confidence no private AI developer can currently command, so the contract delivers more than revenue per MW: it reduces the IREN capital required per MW. A lower-priced Microsoft megawatt can therefore beat a higher-priced AI-native megawatt on the only metric that reaches shareholders.
The same contract creates structural dependence. Microsoft influences hardware specification, cooling design, delivery timing, acceptance, expansion, and renewal, and IREN cannot redeploy a customer-specific cluster on short notice. Concentration is rational during the first large phase and dangerous if the mix has not broadened by the time that contract matures.
NVIDIA occupies more positions than any other counterparty: customer, supplier, architect, validator, potential equity holder, and source of credibility. IREN signed a 5-year, approximately $3.4 billion agreement for 60 MW of gross Childress capacity, and NVIDIA holds rights tied to delivery of up to 600,000 GPUs across the broader platform.
That alignment buys architectural guidance, faster deployment, supplier credibility, and benchmark validation. It also concentrates the fleet on one roadmap, exposing IREN to hardware pricing, allocation, cooling requirements, and upgrade cycles set elsewhere. NVIDIA can stay strategically aligned with IREN and capture a large share of the value through hardware pricing, which makes the relationship an advantage and not a source of independent bargaining power.
22. The New Customers and the Workloads They Bring
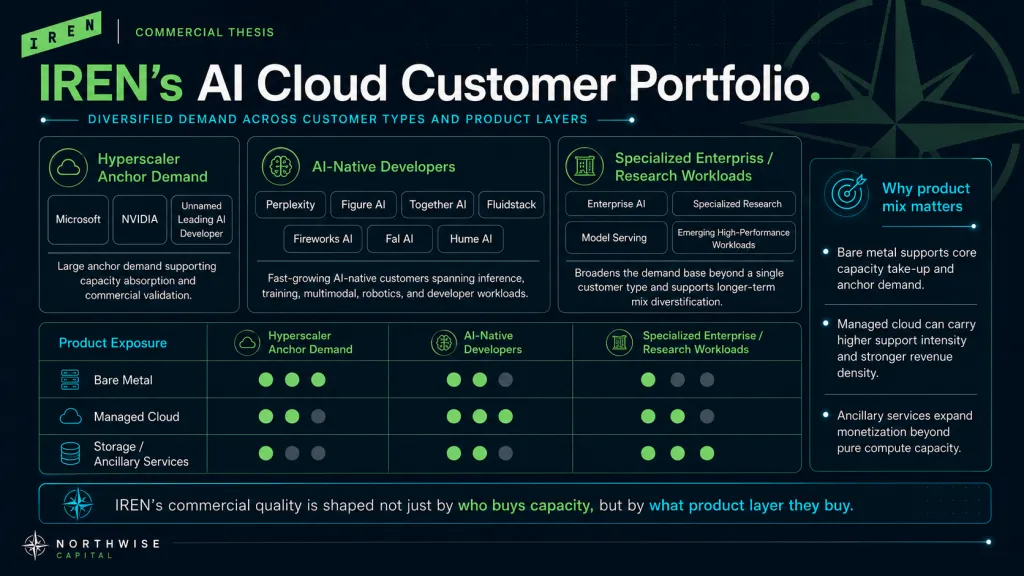
The value of the July 20 list is workload diversity, not logo count.
Customer category | Customers |
|---|---|
Hyperscaler and strategic anchors | Microsoft, NVIDIA |
AI cloud and infrastructure platforms | Together AI, Fluidstack |
Inference and model-serving platforms | Fireworks AI, Fal AI |
Direct AI applications and frontier developers | Perplexity, Figure AI, Hume AI, unnamed developer |
Together AI describes itself as an AI-native cloud spanning inference, pretraining, dedicated GPU clusters, and managed storage. It brings large clusters, high utilization, and sophisticated requirements, and it runs its own customer-facing layer that keeps developer relationships and downstream pricing. It is also a demanding counterparty, since its product is AI infrastructure and it can price IREN against hyperscalers, CoreWeave, and its own build options with full information.
Fluidstack occupies the strangest position on the list. It acquires power, designs and builds data centers, and operates hardware and software systems, which makes it simultaneously a customer, a reseller of IREN capacity, a competitor for power, and a future owner of its own footprint. The relationship works while demand exceeds what any single provider can serve, and the risk grows as Fluidstack's own capacity comes online.
Perplexity represents direct application demand as an AI answer engine coordinating multiple models. Its requirements run to continuous inference, retrieval, indexing, and low-latency availability, all tied to end-user growth instead of another provider's backlog. Inference is particularly useful for fleet economics since it runs acceptably on a wider range of hardware than frontier training.
Figure AI brings physical AI through humanoid robotics and the Helix system, generating training, simulation, vision, and inference demand that recurs as new environments and data arrive. Humanoid robotics also remains capital intensive, early in commercialization, and dependent on continued funding, so the contract weakens if deployment moves slower than planned.
Hume AI extends the portfolio into voice and interactive systems, where real-time inference demands low latency and high availability. Fireworks AI and Fal AI operate closer to model serving and generative media, supporting high-throughput inference and bursty application demand.
Several of these customers monetize models they did not train. Open-weight releases expand that buyer pool well beyond firms that can afford frontier training runs, and they lower switching costs at the same time, since a workload running a portable model on bare metal moves to a competitor more easily than one entangled in a proprietary stack.
Training arrives in large project-based commitments tied to the newest hardware. Inference runs continuously, tolerates older silicon, and cares intensely about efficiency. A mixed portfolio smooths demand and complicates capacity planning, and it gives IREN somewhere to send a GPU cohort when its first contract expires, which a portfolio of two anchors cannot do.
Infrastructure platforms like Together AI and Fluidstack fill capacity quickly at low sales cost while inserting a commercial layer between IREN and the workload owner. IREN gives up access to the final customer, visibility into downstream demand, and part of the margin. The company should keep serving them and should not let them become the only route to AI-native demand.
23. Contract Duration and the 2030 Renewal Wall
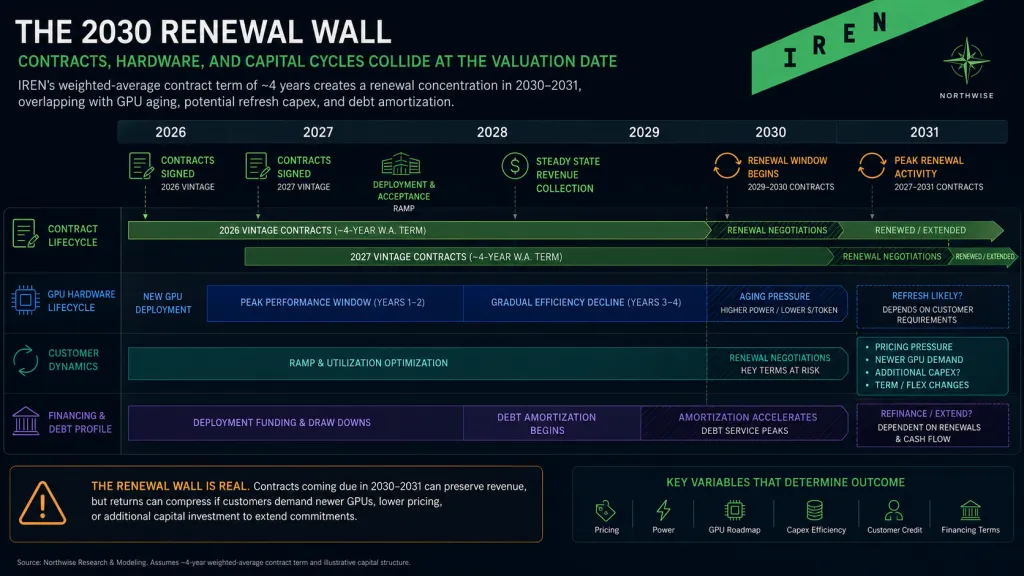
The most consequential number in the July 20 disclosure may be a date nobody stated.
The weighted-average contract term of approximately 4 years, weighted by ARR contribution, means capacity contracted in 2026 and 2027 comes up for renewal around 2030 and 2031. Our valuation date sits inside that window.
Four years is constructive on its own terms. It recovers a meaningful share of GPU cost, supports debt underwriting, reduces early utilization risk, and permits redeployment afterward. It aligns reasonably with a 5-year accounting life and a 7-to-8-year economic life without covering either.
A weighted average also hides its distribution. The portfolio likely contains 5-year anchors, shorter managed-cloud agreements, and usage-based services, and IREN has disclosed none of the renewal rights, termination provisions, pricing escalators, or upgrade obligations that determine contract quality. Duration is one variable among many, and it is the only one investors can currently see.
Renewal can also cost capital. A customer may renew only against newer GPUs, more storage, upgraded cooling, or lower pricing, which retains the relationship and produces a weaker return on the next investment cycle. Renewal rate alone tells you nothing, and renewal return on capital tells you everything. A customer who leaves and frees hardware for economical redeployment can be worth more than one who stays after a funded refresh at reduced pricing.
The hardware and contract clocks run out of phase. A 4-year contract on a 7-year asset leaves years of potential value, realizable only if the hardware stays competitive and software supports a mixed fleet. A contract can also outrun the attractive period of the hardware's life, forcing refresh mid-term if the customer expects frontier performance throughout, and IREN has not disclosed which party carries that obligation.
24. What Happens When the Shortage Ends
Hyperscalers use external infrastructure because their own campuses cannot arrive fast enough.
IREN sells against that gap with secured power, operating campuses, rapid deployment, and liquid-cooled capacity, letting a customer compress time to compute and push construction and hardware risk outside its own balance sheet. IREN's bargaining power is strongest when the alternative is waiting.
Scarcity currently shows up in every contract term. Customers accept longer durations, higher pricing, prepayments, and less flexible termination, and the disclosure that pricing is strengthening while customers fund 45% of GPU capex is exactly what a shortage looks like from the seller's side. None of it should be assumed permanent.
The central bear does not require an AI recession. Bargaining power shifts when hyperscalers finish internal campuses, competing neoclouds energize, traditional operators add AI-ready halls, GPU supply improves, and customers gain experience running their own clusters. The question is not whether AI demand is larger in 2030 than 2026, which it almost certainly will be. It is whether available infrastructure grows faster than the scarcity premium IREN currently collects.
If it does, pressure lands on pricing, ARR per MW, duration, prepayments, refresh obligations, and service credits simultaneously. IREN can offset part of that through managed services, storage, geographic specialization, sovereign demand, and low-cost power. The physical platform wins the first contract, and the service platform has to defend the second.
AI-native customers reduce hyperscaler dependence without being price takers. Successful developers grow into large infrastructure buyers with internal teams, multi-provider strategies, and detailed cost knowledge, and some eventually lease dedicated capacity or build their own. IREN has to make staying attractive through power access, deployment speed, reliability, multi-region reach, and integration, so that customers remain because IREN is valuable and not because they lack options.
Managed cloud is the defensive layer in that fight. A customer buying hardware access compares providers on price, performance, availability, and location. A customer whose orchestration, storage, monitoring, security, and workload management run on IREN faces a far more complex migration. The friction is worth only what the service quality is worth, since bad software makes integration a liability.
25. Concentration, Financing, and the Path to 2030
Concentration needs to be measured on five axes instead of one. Customer count says nothing about ARR concentration, capacity concentration, financing concentration, or workload concentration, and IREN likely remains highly concentrated on at least three of them. Microsoft's contract alone may represent close to half the contracted 2026 ARR base.
Customer type | Primary benefit | Primary risk |
|---|---|---|
Hyperscalers | Scale, credit, utilization, financing | Concentration and buyer power |
AI infrastructure platforms | Large technical workloads, rapid growth | Intermediation and future competition |
AI application companies | Direct workload exposure, service attachment | Credit and demand volatility |
Traditional enterprises | Durability and diversified demand | Long sales cycles and support costs |
Sovereign customers | Geography, security, premium requirements | Regulation, procurement, political risk |
Traditional enterprise adoption is the missing middle. Enterprises embed AI in operations, analytics, security, and supply chains and rarely disappear the way venture-funded developers can, while contracting slowly and demanding more support. Sovereign demand adds geographic pricing power for buyers who treat jurisdiction as part of the product, and it will never fill a multi-gigawatt portfolio by itself.
Customer diversification also has to become financing diversification. IREN cannot fund several gigawatts from sponsor equity, so a durable portfolio needs prepayments, contract-backed debt, GPU financing, and infrastructure capital arriving from more than one relationship. If financing stays dependent on a single contract, the customer list has diversified and the capital risk has not.
Stage | Expected customer structure |
|---|---|
2026 | Microsoft and NVIDIA dominate, initial AI-native diversification |
2027 | AI infrastructure platforms and direct developers expand |
2028 | Managed cloud and enterprise adoption become material |
2029 | Customer concentration declines, regional demand grows |
2030 | Balanced hyperscaler, AI-native, enterprise, sovereign portfolio |
The base case requires movement along that path. The confirming signal would be expansion, with a small contract growing into a multi-site relationship, and the warning signal would be rapid customer additions alongside flat or falling revenue per MW.
IREN no longer needs to prove AI-native customers will buy its capacity. It needs to prove they will stay, expand, and pay enough to justify the capital required to serve them.
Part V: Competitive Position
26. What IREN Is, Exactly
Ask five investors what IREN is and you will get five valuation frameworks.
Emphasize the land and the framework becomes asset values, development costs, and lease economics. Emphasize the compute and it becomes ARR, utilization, depreciation, and financing. Emphasize the software and it becomes attachment, retention, and service margin. IREN currently sits between all three, owning the scarce physical layer, financing the compute layer, and beginning to sell services above both.
Business model | Primary control point | Primary advantage | Primary risk |
|---|---|---|---|
Hyperscaler | Customer ecosystem and software | Cross-selling, scale, integration | Enormous capital burden |
Specialized AI cloud | Compute and cloud operations | Performance, speed, specialization | Debt, hardware, concentration |
Vertically integrated power cloud | Power, sites, compute, services | Physical scarcity, stack control | Extreme capital intensity |
Traditional data center | Buildings, power, leases | Stable rent, lower hardware risk | Limited compute upside |
Mining-to-HPC host | Power and powered shells | Fast conversion into leases | Tenant concentration |
Software-led AI cloud | Orchestration and workflows | Higher attachment and retention | Dependence on others' capacity |
IREN's distinguishing feature is the attempt to control nearly every layer from grid access to managed delivery. That creates more potential value per megawatt and leaves the company holding the bag whenever any layer underperforms. It is physically ahead of most emerging competitors and commercially behind the most mature AI-native clouds, and July 20 narrowed that gap without closing it.
27. IREN Versus CoreWeave
CoreWeave is the most useful public comparison, since both companies are building the same thing from opposite ends.
Dimension | IREN | CoreWeave |
|---|---|---|
Original base | Bitcoin mining and power development | GPU compute and specialized cloud |
Historical advantage | Grid-connected land, power, development | Cluster operations, software, delivery |
Physical ownership | Substantial owned land and substations | Mixed owned, leased, partner-developed |
Cloud maturity | Emerging rapidly | More mature |
Financing | Debt, converts, equity, prepayments | Heavy debt, GPU-backed financing, equity |
Main weakness | Software maturity and dilution | Leverage and facility dependence |
CoreWeave has already reached a scale IREN is still targeting, reporting $5.13 billion of 2025 revenue and $66.8 billion of backlog at year-end. In the first quarter of 2026 it passed 1 GW of active power, lifted contracted power above 3.5 GW, and announced an expanded NVIDIA relationship intended to support more than 5 GW of AI factories by 2030. IREN's $4 billion-plus 2026 ARR target is a comparable figure that has not yet survived commissioning and acceptance.
CoreWeave also competes on more than availability, with cluster management, training systems, observability, and Weights & Biases integrated into research and production workflows. IREN pursues similar structural advantages through Mirantis, and both companies have concluded that GPU availability alone stops being defensible as supply arrives.
IREN's advantage is control of the bottleneck. CoreWeave has relied more heavily on leased and partner-provided facilities, which enables fast expansion and creates dependence on powered-shell delivery and lease terms. Its 2025 guidance revisions were tied to shell availability and infrastructure sequencing instead of customer cancellations, which our prior work identified as the core tension in that model: contracted revenue gated by someone else's construction schedule. IREN can be late for its own reasons and cannot blame a landlord.
CoreWeave's financing engine is more advanced and more leveraged. In 2026 it closed an $8.5 billion investment-grade-rated, nonrecourse delayed-draw term loan with a floating tranche at SOFR plus 2.25% and a fixed tranche near 5.9%, and NVIDIA completed a $2 billion common-stock investment. Against that, CoreWeave reported roughly $1.23 billion of net interest expense in 2025 alongside a $46 million operating loss and a $1.17 billion net loss, with our prior work identifying total debt above $18 billion late in the year.
CoreWeave is therefore an operating preview of the scale IREN wants and the financial physics attached to reaching it. It proves a specialized AI cloud can grow fast, win enormous contracts, and attract investment-grade capital. It also proves that adjusted EBITDA can coexist with deep GAAP losses, that interest absorbs operating value at scale, and that physical delay shifts revenue without shifting fixed obligations.
28. IREN Versus Nebius
Nebius approaches the same market from software and full-stack cloud, which makes it the more strategically complete competitor.
In the first quarter of 2026 Nebius reported $390 million of AI Cloud revenue, $1.9 billion of ARR, and guidance for $7 billion to $9 billion of year-end 2026 ARR, alongside more than 3.5 GW of contracted power with over 75% tied to owned capacity. Its platform spans infrastructure, serverless inference, training, production deployment, enterprise security, and developer services, with Q1 materials describing Aether 3.5 and inference products designed to reduce the capacity required to run large models.
Nebius has also moved hard toward owned facilities, announcing a Pennsylvania project of up to 1.2 GW alongside a 1.2 GW Missouri project and a 310 MW Finland site, expecting 800 MW to 1 GW of connected power by year-end 2026. That narrows one of IREN's largest historical advantages. IREN retains more operating history in direct power development and campuses that already carried large computational loads before the AI cycle began.
Nebius is not asset-light. It spent approximately $2.47 billion on property, equipment, and intangibles during Q1 2026 against 253.9 million shares outstanding, and its expansion increasingly requires debt, convertibles, equity, and customer commitments. Its advantage is combining that capital intensity with a deeper software platform, alongside interests in Avride, TripleTen, ClickHouse, and Toloka that add optionality and complicate consolidated valuation.
Company | Existing strength | Gap that must close |
|---|---|---|
IREN | Power, land, substations, rapid physical scale | Enterprise software, customer depth |
Nebius | Software, full-stack cloud, developer tools | Gigawatt-scale delivery and capital efficiency |
Both gaps are closing. July 20 is evidence on IREN's side and the 2026 power announcements are evidence on Nebius's, and both companies can succeed. The question is which one finishes its weak side without damaging its strong one.
29. Landlords, Hosts, and Who Holds the Obsolescence Risk
Strip away every other difference between IREN and a data-center landlord and one question remains: when the chips age, whose problem is it?
A landlord develops land, buildings, power, cooling, and connectivity and collects rent while the tenant owns the servers. If the tenant's hardware becomes obsolete, the building stays valuable and the tenant writes the check. That model produces stable, long-duration cash flow and forfeits participation in the compute upside.
IREN owns or finances the compute, which means it collects far more revenue per physical megawatt and holds depreciation, utilization, residual value, refresh, and technology selection risk directly. Revenue per MW cannot be compared with rent per MW without carrying that entire cost stack alongside it. IREN builds a much larger enterprise, and the landlord may earn a steadier return on invested capital.
Landlords can also be partners instead of competitors. IREN does not need to own every future site and can use colocation, build-to-suit, joint ventures, and powered-shell leases to enter regions where direct development is unattractive, trading control over timing and specification for reach and shared capital.
TeraWulf illustrates the hosting alternative from the same mining origin. At the end of 2025 it reported 522 critical IT MW of contracted HPC capacity representing more than $12.8 billion of revenue across a 2.9 GW gross platform, with 60 MW operational for Core42 and $21 million of HPC lease revenue in Q1 2026. Hosting removes GPU capex, obsolescence, utilization risk, and software burden, and it removes access to cloud pricing, storage, managed services, and customer expansion.
IREN chose to own the physical asset, the compute asset, the cloud relationship, and part of the software layer, which justifies both the larger upside and the larger risk discount. The mining-to-AI migration also expands supply in exactly the segment where IREN currently collects scarcity pricing, and the threat is collective rather than individual.
30. The Migrating Bottleneck
Competition in AI infrastructure changes shape as the binding constraint moves.
Market phase | Primary bottleneck | Winning capability |
|---|---|---|
Hardware shortage | Access to GPUs | Supplier relationships and financing |
Power shortage | Grid-connected capacity | Land, power, substations |
Deployment shortage | Ready data halls | Construction and cooling execution |
Cluster shortage | Reliable integrated systems | Networking, commissioning, operations |
Cloud maturation | Usable managed infrastructure | Orchestration, support, software |
Enterprise adoption | Security and integration | Compliance, sales, workflows |
Mature competition | Cost and retention | Efficiency, differentiation, switching value |
IREN's strength sits in the power and deployment rows. July 20 shows movement into managed infrastructure, and Mirantis targets the two rows below that. The thesis depends on IREN climbing the table before the market moves past the rows where it is strongest.
Power scarcity should outlast GPU scarcity. Foundry capacity, packaging, yields, and alternative accelerators can all expand production, while transmission develops on a schedule set by utilities and regulators. Even with abundant chips, customers still need energized land, substations, cooling, and halls, so the premium migrates from access to chips toward access to deployable powered infrastructure.
Our earlier IREN work described this as a windowed infrastructure thesis instead of a company that had earned permanent platform status. The July 20 contracts improve the odds of converting the window into something durable. They do not extend the window.
Several current strengths get mistaken for moats and are not. Competitors can buy the same GPUs, contracts expire, growth can be purchased with capex and dilution, secured power creates no cloud economics by itself, prepayments fall when leverage shifts, and an acquisition becomes a moat only after it improves customer outcomes. The honest test is not scale but whether returns survive competition, visible through stable density, high utilization, attractive renewals, falling sponsor capital per MW, and per-share value outgrowing the share count.
IREN does not need to defeat CoreWeave, Nebius, or the hyperscalers. It needs to convert a power advantage into enough customer, software, and financing differentiation that the platform still earns after raw infrastructure becomes ordinary.
Part VI: The Operating Model
31. Four Outcomes and the Physical Schedule
The model runs four strategic outcomes, and three of them involve IREN building a large company.
Distressed rescue assumes IREN cannot complete the independent strategy under an acceptable capital structure. It may still own powered land, substations, operating facilities, contracts, and development rights, monetized through asset sales, joint ventures, or restructuring. The model does not treat it as a normal capacity case, since the outcome depends entirely on when distress arrives and what has been completed by then.
The dilutive standalone bear assumes IREN stays independent and keeps building while later project economics weaken. Supply expands, bargaining power shifts, pricing moderates, prepayments decline, and equity issuance continues. IREN becomes a large infrastructure company whose stock performs poorly since the growth is divided across too many shares and too much debt.
Base assumes IREN executes the physical build while holding discipline on the compute layer, completing the major North American campuses, expanding selectively abroad, scaling managed cloud, and accepting substantial dilution without letting it swamp enterprise growth. It requires the strongest projects to advance while management delays or abandons the weaker ones.
Bull assumes IREN becomes one of the largest independent AI Cloud platforms in the world, combining 7.1 GW physical and 6.2 GW equipped with scaled AI-native adoption, enterprise and sovereign demand, and repeatable contract-backed financing. It assumes neither zero dilution nor permanent shortage pricing.
Year-end physical capacity | Bear | Base | Bull |
|---|---|---|---|
2026 | 430 MW | 480 MW | 500 MW |
2027 | 1,050 MW | 1,210 MW | 1,300 MW |
2028 | 1,700 MW | 2,410 MW | 3,210 MW |
2029 | 2,450 MW | 4,210 MW | 5,500 MW |
2030 | 3,400 MW | 6,000 MW | 7,100 MW |
The near-term range is narrow since construction is underway, major hardware is ordered, contracts support most of the capacity, and liquidity is substantial. Bear does not assume the 2026 program collapses, and instead assumes delay, hardware timing mismatch, acceptance slippage, and partial capacity sliding into 2027.
IREN has targeted approximately 1.2 GW during 2027 and stated it is engaged with customers across the full 2026 and 2027 program. Engagement is not a signed contract, a prepayment, a completed hall, or an accepted megawatt. The base physical schedule reaches 1.21 GW by the end of 2027 while the equipped schedule reaches 950 MW, which is deliberate.
Site or region | Bear | Base | Bull |
|---|---|---|---|
British Columbia | 160 MW | 160 MW | 160 MW |
Childress | 750 MW | 750 MW | 750 MW |
Sweetwater | 1,100 MW | 2,000 MW | 2,000 MW |
Kiowa | 550 MW | 1,400 MW | 1,600 MW |
Secured Spain | 350 MW | 490 MW | 490 MW |
Additional Spain | 0 MW | 0 MW | 300 MW |
Bundey | 190 MW | 600 MW | 800 MW |
Unannounced or Batch Zero | 300 MW | 600 MW | 1,000 MW |
Total | 3,400 MW | 6,000 MW | 7,100 MW |
Larger scenarios do not scale every site proportionally, since each outcome reflects different bottlenecks. British Columbia and Childress appear at full value across all three, reflecting existing infrastructure and committed capital. Sweetwater is the single largest difference between bear and base, and bull deliberately does not exceed the secured 2 GW, so bull upside comes from faster fit-out and better economics instead of invented capacity. Kiowa creates the largest post-2027 divergence, and Bundey carries the least central weight given pending approvals.
32. Equipped Capacity and the Discipline Gap
Equipped-capacity vintage | Bear | Base | Bull |
|---|---|---|---|
2026 | 400 MW | 480 MW | 500 MW |
2027 | 450 MW | 470 MW | 600 MW |
2028 | 500 MW | 900 MW | 1,500 MW |
2029 | 600 MW | 1,450 MW | 1,900 MW |
2030 | 500 MW | 1,300 MW | 1,700 MW |
Total equipped by 2030 | 2,450 MW | 4,600 MW | 6,200 MW |
IREN Physical Versus Equipped Capacity Divergence 2026 to 2030 Northwise
The base 2026 cohort matches IREN's gross target, and the July 20 disclosure makes full delivery more credible with 85% contracted, demand across multiple customer groups, and prepayments reducing the funding requirement. Acceptance and revenue-bearing adjustments still apply later, since hitting a gross megawatt target does not produce a full annual run rate on arrival.
Bear equips 2.45 GW against 3.4 GW physical, and that 950 MW gap is not a collapse scenario. It assumes the July 20 customers are real, managed cloud works at initial scale, and capital remains available on worse terms, with IREN delaying marginal deployments whenever density weakens or the project misses the sponsor hurdle. Bear requires enough weak projects funded and enough dilution absorbed that common equity ends up poorly.
Base leaves 1.4 GW unequipped, which is the clearest expression of the option framework from section 12. Powered capacity holds value while management waits for better terms, cheaper hardware, or a new architecture, and the durable layers outlive several generations of compute. A company that has already funded a substation can create more value by waiting two quarters than by filling it immediately.
That gap also hedges the hardware cycle. Buy too early and you commit shortly before a performance step-change or a better financing structure. Wait too long and you lose the customer or the scarcity premium.
Even bull holds a 900 MW gap. The 6.2 GW outcome requires sustained demand, multi-region contracting, repeatable prepayments, scaled managed cloud, and enough organizational capacity to run it, with the remaining unequipped capacity preserving post-2030 growth. Bull is aggressive on the amount equipped and the density earned, not on the assumption that every decision is perfect.
All equipped schedules are expressed in gross megawatts to stay consistent with IREN's targets and the density framework. The project model still requires the site-specific bridge from section 14, and a fleet can post high ARR per gross MW while carrying much higher compute capex per critical IT MW.
33. Revenue Density by Deployment Vintage
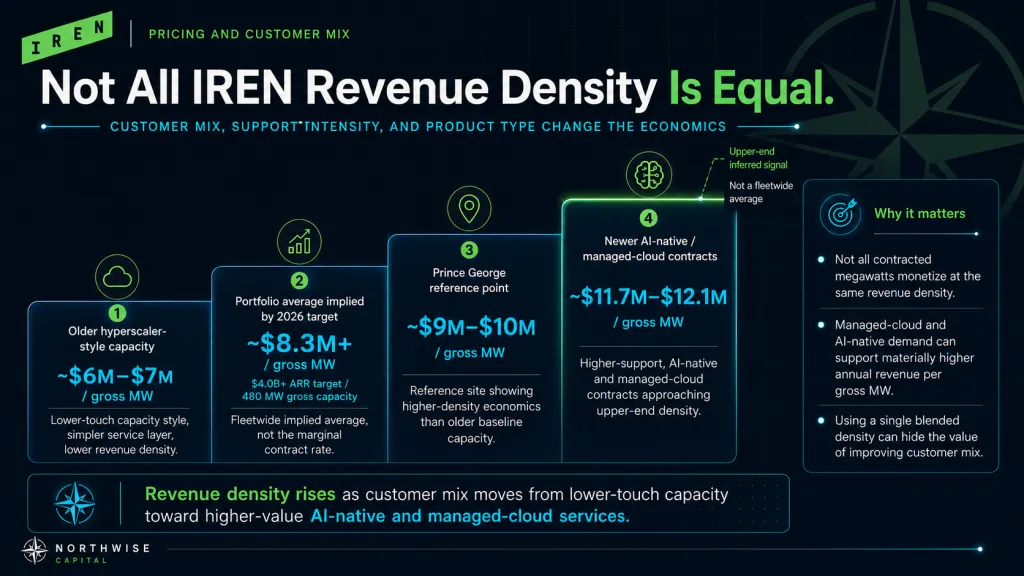
A 2026 megawatt and a 2030 megawatt should never carry the same revenue assumption.
New deployment vintage | Bear | Base | Bull |
|---|---|---|---|
2026 | $8.0M per MW | $8.4M per MW | $8.7M per MW |
2027 | $8.2M | $9.2M | $10.0M |
2028 | $8.4M | $10.5M | $12.5M |
2029 | $8.8M | $12.5M | $16.0M |
2030 | $9.2M | $14.5M | $20.0M |
IREN Revenue Density Curve by Deployment Vintage Northwise
These values represent exit ARR attached to each newly equipped gross megawatt, not revenue recognized during the installation year. The 2026 figures are the most tightly anchored, since they connect to a live company target: base rounds the implied $8.33 million to $8.4 million, bear assumes weaker realized pricing and commissioning friction, and bull assumes modest outperformance.
Base 2027 rises to $9.2 million on new AI-native customers, managed cloud, stronger pricing, and more advanced hardware. It stays well below the inferred $12 million upper end, since the cohort will mix anchor contracts, bare metal, managed cloud, intermediaries, and direct application customers. IREN does not need every 2027 megawatt at premium pricing, and it needs the mix to improve against the hyperscaler-heavy starting portfolio.
Bear rises too, from $8.0 million to $9.2 million, since newer hardware delivers more compute per megawatt and the validated demand does not vanish. The bear case lives in the spread instead of the direction, with bear at $9.2 million against base at $14.5 million and bull at $20.0 million by 2030. Bear assumes technical progress gets handed to customers through lower pricing, weaker prepayments, and thinner service attachment.
The base curve requires more direct developer relationships, managed-cloud growth, enterprise adoption, and Mirantis-supported operations working together. Its 2029 assumption of $12.5 million sits near the level our project work identifies as necessary for a 20% sponsor return, and the July 20 signal provides the first commercial evidence that selected customers already pay there. The 2030 figure still requires scaling well beyond the current block.
Bull's 2030 cohort assumes next-generation hardware, high critical IT density, scaled managed cloud, sovereign workloads, and strong retention. That $20 million applies only to the newest cohort and never to the fleet.
The model does not reprice a 2026 Microsoft or NVIDIA deployment to 2030 economics. Older capacity is constrained by its original terms, hardware, duration, and service mix, and while expansion or renewal may improve it, nothing guarantees that. Cohort treatment is what prevents the most favorable marginal economics from quietly infecting the entire fleet.
34. Cohort-Weighted Exit ARR
Multiplying vintage megawatts by vintage density and summing across deployment years produces the exit run rate before any acceptance adjustment.
Scenario | Exit ARR before acceptance | Acceptance factor | Accepted exit ARR |
|---|---|---|---|
Bear | $20.97B | 90% | $18.87B |
Base | $54.78B | 95% | $52.04B |
Bull | $93.50B | 97% | $90.70B |
Base combines 480 MW at $8.4 million, 470 MW at $9.2 million, 900 MW at $10.5 million, 1,450 MW at $12.5 million, and 1,300 MW at $14.5 million. The acceptance factor is not a conservatism discount, and it captures late-year capacity still in testing, incomplete acceptance processes, and revenue commencing after the valuation date.
The fleet average is the number worth watching, since it sits well below the newest cohort in every scenario.
Scenario | Accepted exit ARR | Equipped capacity | Accepted ARR per equipped MW |
|---|---|---|---|
Bear | $18.87B | 2,450 MW | $7.70M |
Base | $52.04B | 4,600 MW | $11.31M |
Bull | $90.70B | 6,200 MW | $14.63M |
That gap is one of the most important safeguards in the model. A company can announce $14 million or $20 million of marginal density without the fleet ever reaching it.
July 20 changes this model through three channels and no more. It lifts the 2026 base cohort from $7.7 million to $8.4 million, it makes the later customer mix credible enough to support the curve, and it removes the bear case's reliance on IREN failing to attract AI-native demand. It does not change physical megawatts, equipped megawatts, margins, multiples, or bull probability.
Mirantis enters the same way, embedded in later-cohort density instead of carried as separate revenue. If the acquisition helps IREN earn more per equipped megawatt, that value already sits in the curve, and any standalone Mirantis revenue is upside the central case does not require.
Base requires 6.0 GW physical, 4.6 GW equipped, $52.04 billion of accepted exit ARR, and a fleet-average accepted density near $11.31 million. That is aggressive, and it is no longer speculative in the way it was before July 20. The unresolved question is whether these economics survive at several times the current scale.
Part VII: Unit Economics and Capital
35. What One Megawatt Costs
$42.7 million buys one equipped gross megawatt in the base case. Roughly two-thirds of that is hardware with a 5-year accounting life.
Scenario | Fully loaded capex per equipped gross MW |
|---|---|
Bear | $46.5M |
Base | $42.7M |
Bull | $40.0M |
The spread reflects site mix, construction efficiency, procurement scale, standardization, and schedule execution. Bear runs highest since weaker execution and smaller blocks reduce purchasing leverage while adding delay and redesign. Bull runs lowest as a larger standardized platform spreads engineering across more capacity, and it still requires enormous absolute capital to equip 6.2 GW.
Capital component | Base cost per gross MW |
|---|---|
Infrastructure | $14.5M |
Compute, networking, storage, installation | $28.2M |
Total fully loaded capex | $42.7M |
The compute share of roughly 66% is what converts the prepayment disclosure into a usable modeling input. A 45% prepayment against $28.2 million of compute equals approximately $12.7 million per gross MW, or 29.7% of the $42.7 million project. That arithmetic is why the base funding assumption uses 30% customer prepayments and not 45%: customers are funding most of a compute system, not a third of a data center.
Development type | Approximate cost per gross MW |
|---|---|
Existing conversion and expansion | $34M to $40M, later vintages |
Texas greenfield | $36M to $42M |
Kiowa | $39M to $44M |
Spain | $46M to $52M |
Bundey | $49M to $55M |
Unannounced or acquired projects | $42M to $48M |
Costs climb wherever a project needs new transmission, new regional teams, greater redundancy, or international supply chains. A Canadian retrofit and a Spanish greenfield campus cannot be underwritten at the same number, so the model blends the portfolio only after site-specific assumptions are applied.
36. Funding Mix and Sponsor Capital
Funding source | Bear | Base | Bull |
|---|---|---|---|
Customer prepayments | 20% | 30% | 35% |
Project and GPU debt | 35% | 40% | 40% |
IREN sponsor funding | 45% | 30% | 25% |
Prepayments attach to compute, project debt can reach GPUs, servers, networking, and parts of the facility, and sponsor funding covers whatever remains from cash, operating flow, converts, common equity, or partners. The sponsor share is the portion whose return reaches common shareholders.
Scenario | Fully loaded capex | Prepayment | Project debt | Sponsor funding |
|---|---|---|---|---|
Bear | $46.5M | $9.3M | $16.3M | $20.9M |
Base | $42.7M | $12.8M | $17.1M | $12.8M |
Bull | $40.0M | $14.0M | $16.0M | $10.0M |
Bear requires more than twice the sponsor capital per megawatt that bull does, which makes the relationship between project economics and dilution violently nonlinear. Across 1 GW, the sponsor requirement runs to roughly $20.9 billion at bear economics, $12.8 billion at base, and $10 billion at bull. A modest change in prepayments or project cost moves required equity by billions across a program this size.
Customer funding and debt both reduce the equity check and are not equivalent. Debt carries interest, principal, covenants, collateral, and refinancing risk. A prepayment carries a service obligation and generally no contractual interest, which improves sponsor IRR, project liquidity, debt capacity, and cancellation protection at the cost of reduced collections during the unwind.
Microsoft demonstrates the extreme end of capital efficiency. Approximately $1.94 billion of customer prepayment plus approximately $3.65 billion of GPU financing against approximately $5.81 billion of GPU capex covers roughly 96% of the compute layer at a blended debt cost near 6%. IREN deploys an enormous compute system against a small hardware-layer equity contribution, while the campus underneath still requires land, substations, buildings, and cooling.
A higher-priced AI-native contract can consume more IREN capital than a cheaper hyperscaler one. Smaller prepayments, tougher lender terms, weaker credit, shorter duration, heavier support, and less reusable hardware all push the sponsor share up. The best contract is the one producing the highest risk-adjusted return on IREN's own capital, which is frequently not the one with the highest ARR per megawatt.
37. Sponsor Return Thresholds
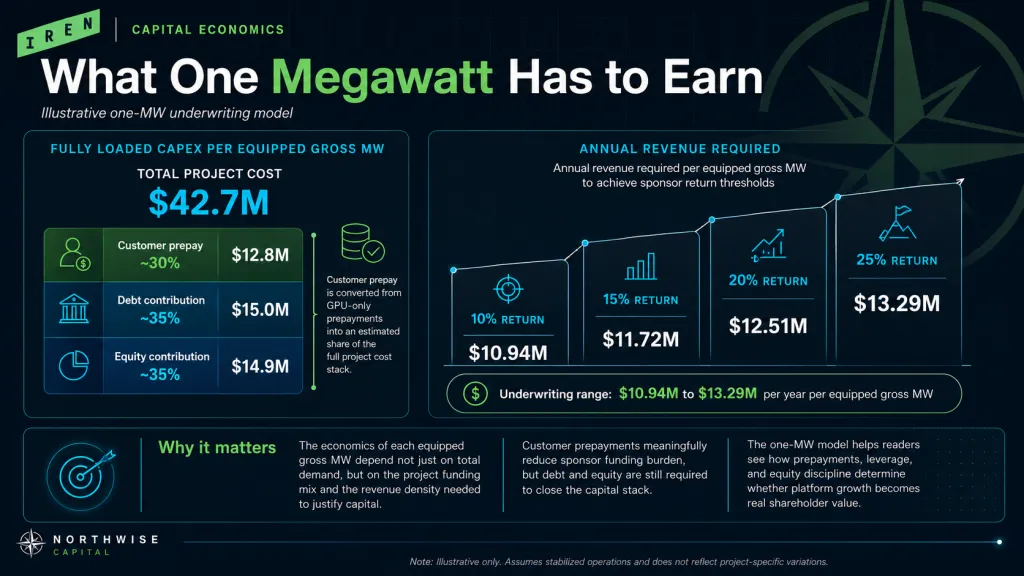
Target sponsor return | Required annual revenue per equipped gross MW |
|---|---|
10% | $10.94M |
15% | $11.73M |
20% | $12.51M |
25% | $13.29M |
Treat these as a decision rule: what must a marginal deployment earn before IREN commits sponsor capital. The inferred $12 million upper end from section 2 clears the 10% threshold comfortably, clears 15% narrowly, approaches 20%, and falls short of 25%. IREN disclosed no contract-level capex, margin, or financing, so the actual project return is unknown.
Revenue density has to survive the margin before it reaches anyone. At a 65% EBITDA margin, $12.5 million of revenue produces roughly $8.1 million of EBITDA per gross megawatt while $8.4 million produces roughly $5.5 million. That difference looks comfortable until the excluded costs arrive.
Run the representative base project through its financing and the comfort disappears. Against $17.1 million of project debt at an illustrative 6.5%, annual cash interest runs approximately $1.1 million per gross MW, and even 5-year amortization requires roughly $3.4 million of principal. At $8.4 million of revenue, EBITDA of $5.5 million leaves under $1 million before maintenance, support, taxes, and the prepayment unwind. At $12.5 million, EBITDA of $8.1 million leaves approximately $3.6 million.
Structure matters as much as rate. A 6% loan amortizing over 3 years is harder to carry than a 9% loan amortizing over 7, and a 5-year customer contract funded with short equipment debt produces early cash pressure inside a profitable project.
Leverage cuts in both directions. Project debt takes contractual payments, the customer takes delivery, and common equity absorbs everything left over, which accelerates sponsor returns when projects perform and accelerates losses when they do not.
Our bear-case test on a late deployment produced approximately a negative 5.8% gross asset IRR, a negative 7.5% project IRR, and a negative 16.2% sponsor-equity IRR. Under those conditions the correct decision is to not equip the megawatt. That is precisely why bear does not equip all 3.4 GW: management can fail through excessive caution, and it destroys more value deploying capital into a project with a clearly negative expected return.
The 20% hurdle is an underwriting target and not a claim about every existing contract. Anchor deals can be rational below it when they establish credibility, finance infrastructure, and generate downstream demand, and Microsoft plausibly created value beyond its standalone IRR. Those spillovers are real and cannot become an excuse to stop measuring, since higher-return cohorts have to increasingly offset the lower-return anchors.
38. Depreciation, Hardware Life, and the Replacement Reserve
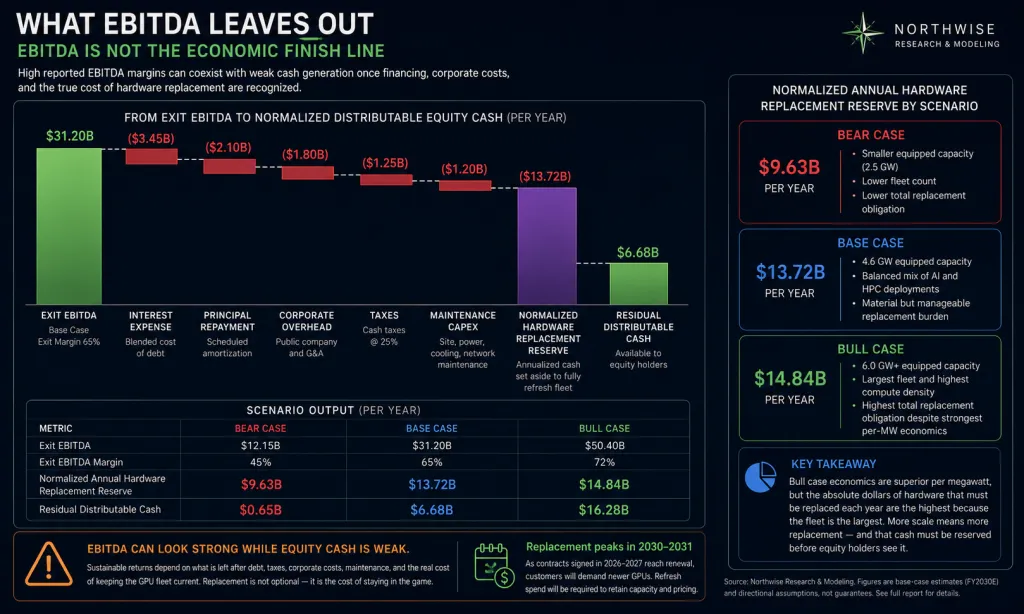
Asset class | Modeled accounting life |
|---|---|
Buildings and structural infrastructure | 20 years |
Electrical, cooling, and plant equipment | 10 years blended |
HPC and GPU hardware | 5 years |
Infrastructure splits roughly 55% buildings and 45% electrical and plant. Working the base project through those lives produces approximately $0.4 million of annual building D&A, $0.7 million on electrical and plant, and $5.6 million on the compute layer, for roughly $6.7 million per equipped gross megawatt.
Annual revenue per MW | EBITDA at 65% | Approximate D&A | Approximate unit EBIT |
|---|---|---|---|
$8.4M | $5.5M | $6.7M | Negative $1.2M |
$12.5M | $8.1M | $6.7M | Positive $1.4M |
$14.5M | $9.4M | $6.7M | Positive $2.7M |
This is the single most clarifying table in the report. A megawatt earning 2026 economics at an excellent EBITDA margin is unprofitable at the EBIT line, and only the later cohorts cross over. The accounting result does not prove the project destroys cash, and it does show how much capital gets consumed to produce the EBITDA everyone quotes.
Accounting life and economic life answer different questions. A GPU stays operational past 5 years and loses its premium role well before it stops working, so the real question is which workload uses it, at what price, at what utilization, and after how much additional capital.
Scenario | Economic GPU life | Fleet share eventually replaced | Cumulative refresh capex through 2030 | Normalized annual replacement reserve |
|---|---|---|---|---|
Bear | 7.0 years | 70% | $1.0B | $9.63B |
Base | 7.5 years | 65% | $2.0B | $13.72B |
Bull | 8.0 years | 60% | $3.5B | $14.84B |
Longer life assumes inference, fine-tuning, generative media, and lower-cost tiers absorb aging hardware, and it does not assume constant pricing. The July 20 mix helps, since search, robotics, voice, and media do not all demand frontier silicon at the same moment. It gives older hardware a destination and no guarantee of one.
The refresh figures look small against the fleet because of timing. Most equipped capacity installs during 2028 through 2030 and remains young at the valuation date, meaning IREN has not yet entered the replacement cycle for a mature platform. The 2030 income statement can therefore show excellent EBITDA immediately before the largest refresh burden arrives.
The reserve is not a spending forecast, since hardware purchases arrive in large uneven cohorts. It is the annualized economic burden of sustaining the platform across repeated hardware cycles, and it is the cost headline EBITDA conceals. Bull carries the largest reserve despite the best per-unit economics, simply because maintaining 6.2 GW costs more than maintaining 2.45 GW.
Depreciation and the reserve should never be subtracted together without care. GAAP earnings take accounting D&A, current free cash flow takes actual capex paid, and normalized mature cash earnings take the reserve. Growth capex and maintenance capex also need separating, since the failure mode is management labeling everything growth while a rising share quietly replaces hardware that already generated its revenue.
GPU-backed financing carries its own decay. Collateral value can fall quickly when new architectures ship or used supply expands, and a lender continues collecting while IREN's flexibility narrows. Our CoreWeave work identified the same structural issue: hardware-backed debt works when collateral declines predictably, and GPU economics move in steps instead of slopes.
A later cohort can create far more value per megawatt through better density, higher prepayments, lower cost, and stronger service attachment, and those advantages compound into dramatically higher sponsor returns. That is why the model escalates density in later years, and it is equally why the company should stay selective. The later cohort should be better, and if it is not, physical scale alone is no reason to deploy it.
39. The Denominator Problem
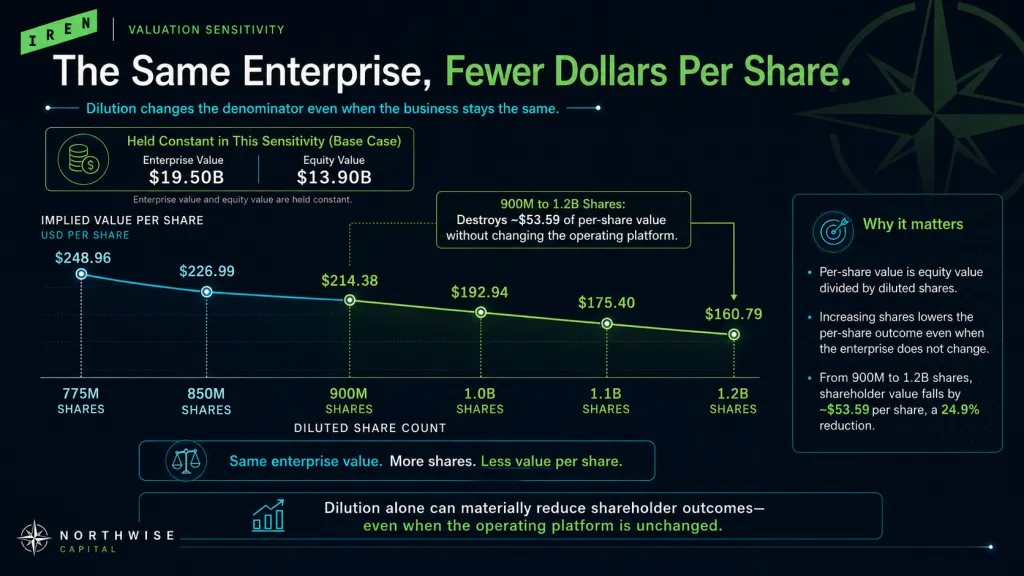
IREN's opportunity is measured in gigawatts and its outcome is measured per share. The capital structure is the exchange rate between them.
Enterprise value measures the operating assets. Common equity is enterprise value minus net debt and senior claims. Per-share value is that figure divided by fully diluted shares, and IREN can grow the numerator every year while shrinking what each existing share represents.
The company must fund grid infrastructure, substations, data centers, cooling, GPUs, networking, software, international expansion, and hardware refresh at once. No single source covers that, so IREN combines customer prepayments, project debt, converts, existing liquidity, operating cash flow, common equity, strategic equity, and partner capital. The quality of the outcome depends on which source funds which layer.
Project-specific capital funds identifiable deployments and belongs with prepayments and contract-backed debt. Platform capital funds durable infrastructure serving multiple customers and generations, and needs corporate cash, infrastructure debt, or joint ventures. Corporate capital funds Mirantis, software, sales, support, and overhead, and cannot be financed against any single contract. The more project risk IREN isolates inside customer-supported structures, the less pressure lands on common equity.
The funding mix matters as much as the project cost. A $42.7 million megawatt at 30% sponsor funding requires $12.8 million of IREN capital, and the same megawatt at 45% requires $19.2 million. Across 1 GW that is approximately $6.4 billion of additional equity-like capital, which flows directly into the modeled share count.
IREN's $3 billion convertible carries a 1% coupon, a 2033 maturity, an initial conversion price near $73.07, capped-call protection extending to approximately $110.30, and potential initial conversion exposure near 54.4 million shares. The low coupon defers cost into future dilution if the stock performs, which is attractive during a build and expensive in success.
Investors frequently treat converts as equity, which understates the downside. Until converted or settled the note is a senior claim, and if the stock sits below the threshold near maturity IREN must repay, refinance, exchange, or issue equity at weak prices. In a poor outcome it behaves like debt, in a strong one like dilution, and shareholders pay one of the two. The capped call offsets issuance between the conversion price and the cap and stops offsetting above it, and base and bull 2030 targets both exceed those levels.
The June 30 cash balance of approximately $7.6 billion includes about $1.7 billion of restricted cash tied to Microsoft financing, leaving roughly $5.9 billion unrestricted. That reduces near-term execution risk and should not be added to equity value, since much of it arrived through converts, project financing, and prepayments. A company can report more cash and more net debt in the same quarter.
Restricted cash is not corporate liquidity either. It may be available only for specific GPU purchases, milestones, or collateral, and it cannot fund Sweetwater, Kiowa, Spain, or overhead.
The liquidity still buys something valuable. It lets IREN order long-lead equipment, secure hardware, absorb acceptance delays, and negotiate without an equity raise hanging over the table. Cash solves timing, and project economics solve value creation, and confusing the two is how well-funded companies build unprofitable platforms.
Scenario | Fully diluted shares in 2030 |
|---|---|
Bear | 1.40B |
Base | 900M |
Bull | 775M |
The count falls as execution improves, since better outcomes bring more customer funding, more project debt, higher issuance prices, and stronger internal cash generation. Bull still assumes material dilution, since a 6.2 GW equipped platform cannot be financed any other way.
Bear reaches 1.40 billion shares alongside 45% sponsor funding per project. The company keeps building while a weaker stock price requires more shares per dollar raised and refresh costs arrive against existing obligations. Base reaches 900 million despite better economics, since 6 GW physical, 4.6 GW equipped, international expansion, Mirantis, and refresh still have to be paid for. Bull uses 775 million instead of a lower number, since combining maximum capacity with minimum dilution would be internally inconsistent.
The count must include common issuance, employee and founder awards, convert dilution, NVIDIA-linked rights, and acquisition consideration from Mirantis and Nostrum. Founder and employee equity aligns management and dilutes shareholders, and the design question is whether awards reward share price or per-share value creation. A share-price target can be reached through enterprise growth, multiple expansion, added leverage, and equity issued below the target itself.
40. Net Debt, Maturities, and the Stop Option
Scenario | 2030 net debt | Exit EBITDA | Implied leverage |
|---|---|---|---|
Bear | $22B | $8.49B | 2.6x |
Base | $35B | $33.83B | 1.0x |
Bull | $40B | $63.49B | 0.6x |
Debt rises with scale, and bull carries the most against a far larger asset and revenue base. Base leverage near 1.0 times looks manageable and should not be read like leverage on a software business, since the EBITDA rests on capital-intensive hardware, contract renewals, and large future refresh.
Bear carries the least debt at $22 billion and the most dangerous debt. Lower EBITDA, weaker project returns, harder refinancing, and softer hardware collateral make each dollar heavier, and substantial equity has already been issued by then.
Maturity concentration can break an otherwise reasonable balance sheet. IREN must manage convert maturity, project amortization, equipment loans, contract expiry, and refresh, and the dangerous alignment puts renewals, replacement, and refinancing in the same window. The 4-year weighted contract term places that window in 2030 and 2031, next to our valuation date.
Equity creates value when issued above intrinsic value into projects that clear their hurdle, and destroys it even in a rising market when it does not. Issue at $100 to fund a project creating $80 per new share and the stock can still rise on reported megawatts, ARR, and EBITDA while existing holders have transferred value. The comparison that matters is value created against value surrendered, never issuance price against last year's price.
That produces a feedback loop running in both directions. Strong contracts lift the valuation, fewer shares are needed per dollar, per-share value improves, and financing gets cheaper. Delays weaken the price, capital needs persist, more shares are issued, and the next project costs more equity than the last.
Path dependence follows directly. Two companies reaching identical 2030 revenue and EBITDA can deliver very different per-share outcomes depending on whether they raised equity at high prices and delayed weak projects or raised during distress after overbuilding. The final state is not the whole story.
IREN can also reduce corporate funding pressure through infrastructure funds, sovereign investors, and regional partners, funding substations, buildings, or international campuses in exchange for shared ownership. Capital recycling through sale-leasebacks or campus-level stakes helps if IREN sells mature assets at infrastructure valuations and redeploys into higher returns, and hurts if it sells the durable layer while keeping the GPU risk.
The distressed path assumes the independent build becomes unsustainable through delays, customer losses, financing closure, or covenant pressure. Common equity is paid last, after project lenders, equipment financiers, convertible holders, customer claims, and restructuring costs, and our $22.50 recovery estimate reflects real residual value without pretending replacement cost belongs to shareholders.
The most valuable governance capability in this business may be the willingness to stop. Delay an equipped phase, cancel a weak project, preserve a shell, reject a low-prepayment customer, walk away from expensive debt.
Metric | Why it matters |
|---|---|
Fully loaded capex per MW | Measures build efficiency |
Customer funding per MW | Reduces sponsor burden |
Sponsor capital per MW | Connects project growth to dilution |
Cash return on sponsor capital | Measures actual shareholder economics |
Share issuance per GW | Measures dilution efficiency |
Second-contract revenue | Tests hardware residual economics |
Disclosure is itself a governance question. Investors currently lack contract-level megawatts, customer concentration, project capex, support costs, debt amortization, and residual values, which forces indirect estimation of the variables that determine returns. A company asking shareholders to fund an expansion this size should show enough for them to evaluate per-share outcomes.
IREN can become one of the world's largest AI infrastructure platforms and still disappoint, if the financing path hands too much of the result to lenders, partners, employees, and future equity holders. Its greatest operating strength is the ability to build, and its greatest governance responsibility is knowing when the next build stops being worth it.
Part VIII: Judgment
41. What the Model Proves
The operating work does not prove IREN reaches its most ambitious targets. It proves the company no longer needs them.
The investment case is usually framed as a binary: IREN becomes one of the world's largest AI infrastructure platforms, or the strategy fails and the market reprices it as a miner. The model produces a far wider distribution. IREN can build part of the announced platform, equip less than it energizes, keep meaningful concentration, dilute substantially, carry tens of billions of debt, and still create an enterprise many times larger than the company that entered this cycle.
IREN no longer needs to prove that large customers need external infrastructure, that hyperscalers will contract with it, that developers will buy directly, that managed-cloud demand exists, that customers will prepay, or that mining campuses convert. Each proposition now has operating evidence behind it.
An investment resting on unproven demand is speculative. An investment resting on proven demand with unresolved capital returns is underwritable. The risk here remains high and has become measurable, which is a different and better problem.
Unresolved question | Why it matters |
|---|---|
Can IREN deliver the full 2026 program on time? | Near-term execution credibility |
Can it secure acceptance without material delay? | When contracted ARR becomes revenue |
Can AI-native contracts scale beyond the first block? | Whether diversification becomes material |
Can managed cloud stay profitable after support costs? | Whether density improves returns |
Can prepayments survive the shortage? | Sponsor capital per MW |
Can older GPUs stay productive after contract one? | Economic hardware life |
Can concentration fall before the renewal cycle? | Bargaining power in 2030 |
Can IREN build without issuing away the value? | Per-share returns |
Can management stop marginal projects? | Capital discipline |
The easiest bullish argument is that AI demand keeps growing, and we broadly agree. It is not sufficient to underwrite this equity. IREN can disappoint inside a booming market if supply expands, pricing falls, prepayments weaken, financing costs rise, and dilution accelerates, with value redistributed toward customers, suppliers, lenders, and future shareholders while revenue growth still looks spectacular.
A stronger outcome also demands more capital than a weaker one, which reads as a paradox and is not. Executing well means completing more campuses, equipping more megawatts, and entering more regions, and every success requires funding. Success creates a larger system that has to be financed, and the equity performs only when the value created exceeds the debt and dilution used to build it.
42. The Case Against the Sector, Stated Properly
The strongest argument against this entire category does not come from people who think AI is a fad. It comes from people who can read a depreciation schedule.
Stated in its own register, it goes roughly like this. A neocloud generating well under $2 billion of annualized revenue at a 33% EBITDA margin is not a technology platform. It is a leveraged rental business on a depreciating asset, and it is being valued as though it were software. The revenue is small, the margin is ordinary for a capital-intensive utility, and the multiple assumes both figures grow into something they have never been.
Depreciation is the trick, on this view. The cost of goods sold in a GPU cloud is the GPU, spread across a 5-year book life that may prove generous, and excluding it from the headline metric converts a marginal business into an apparently exceptional one. Adjusted EBITDA is not a proxy for cash when the asset consuming the cash has to be repurchased before the contracts renew.
The financing compounds the problem. Capital expenditure is funded by equity and debt instead of operations, the equity is issued into enthusiasm, and the debt is collateralized by hardware whose resale market has never been tested through a full architecture cycle. ARR measures a moment in December, not a year of delivery, and backlog assumes counterparties still exist in year 4.
The circularity is the part that should trouble people most. One vendor supplies the chips, invests in the buyers, and books the revenue, while the buyers cite the vendor's participation as validation. That structure has appeared before in telecommunications equipment, and the analogy that fits is not AWS in 2010. It is dark fiber in 1999: real demand, real assets, real technology, and a decade of returns transferred from the builders to the users after supply arrived.
The conclusion follows without requiring AI to disappoint. When capacity catches up, rents fall toward cash cost, the buildings and substations retain value, and the equity does not.
We think that argument deserves to be taken seriously and several parts of it are already inside our model. Depreciation is why section 38 shows a megawatt at 2026 economics losing money at the EBIT line. ARR being an exit rate is why section 16 exists. The refusal to apply software multiples is why base uses 3.75 times ARR and 9.0 times EBITDA. The bear case, at 30% probability, is essentially this argument playing out over 4 years.
Where we part company is on three points. The first is substitutability: the short case treats powered, energized, interconnected land as reproducible on the same schedule as chips, and transmission queues do not behave that way. The second is timing, since rent compression requires supply, and supply requires transformers, substations, and interconnections that are themselves the bottleneck. The third is asset recourse: fiber in 1999 had no alternative buyer at scale, while a completed gigawatt-class campus in ERCOT has several.
The honest synthesis is that the skeptics are describing our bear case with more confidence than we can justify assigning it, and we are describing our base case with more confidence than they can justify rejecting. Both cases start from the same facts. The disagreement is about how long physical scarcity persists and who holds the pen when it ends.
43. How the Thesis Breaks
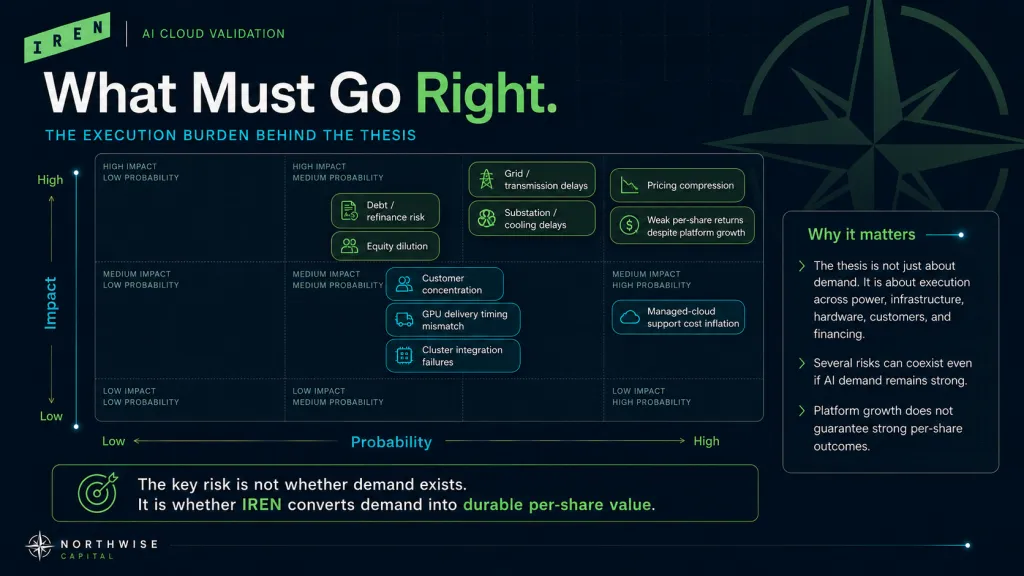
The thesis does not break on a falling share price, a bitcoin decline, a quarterly slip, a large GAAP loss, or temporary multiple compression. It breaks when the operating, commercial, and capital structures stop reinforcing each other.
A stalled conversion stack is the first mode, visible as a persistent gap between contracted, commissioned, accepted, and collected. A temporary gap is normal during a build, and a persistent one means the sales organization has outrun the construction organization.
Density compression before scale creates efficiency is the second, and it is the central post-shortage bear. IREN keeps filling capacity while ARR per MW falls, contracts shorten, prepayments shrink, and upgrade requirements become mandatory. The platform gets larger while each incremental megawatt is worth less.
Cosmetic diversification is the third, with Microsoft and NVIDIA continuing to dominate revenue, capacity, financing, and renewal risk while the new names stay small or arrive through intermediaries. The logo count improves and the economic concentration does not.
Managed cloud becoming a cost center is the fourth, appearing when every customer needs customization and support headcount climbs faster than revenue. That moves the company up the stack without improving returns.
Hardware living only through its first contract is the fifth. Older GPUs fail to find inference demand, second-contract pricing collapses, and resale weakens, pulling economic life toward accounting life and refresh spending forward.
A financing stack turning corporate is the sixth, signaled by corporate guarantees, short maturities, cross-collateralization, equity-funded GPU purchases, and common raises ahead of contracting. The strongest structure isolates customer-backed projects, and the weakest makes shareholders the residual claimant on every layer.
Dilution outrunning the platform is the seventh and the most likely. Revenue, EBITDA, and enterprise value all rise while per-share value stagnates, driven by weak-price issuance, expanding awards, and project cash flow that never funds the next project.
Losing stop discipline is the eighth. Every secured site creates a visible opportunity and every energized megawatt creates pressure to buy hardware, and the thesis weakens the moment sunk cost becomes an argument for continuing.
The ninth is convergence around 2030 and 2031, when contracts expire, older cohorts need repositioning, project debt amortizes, and convertible planning begins simultaneously. Each is manageable alone and destabilizing together.
The tenth is time ceasing to be an asset. If IREN's build lands after hyperscalers finish internal capacity and competitors energize comparable sites, the campuses stay useful without earning scarcity economics.
44. Three Clocks
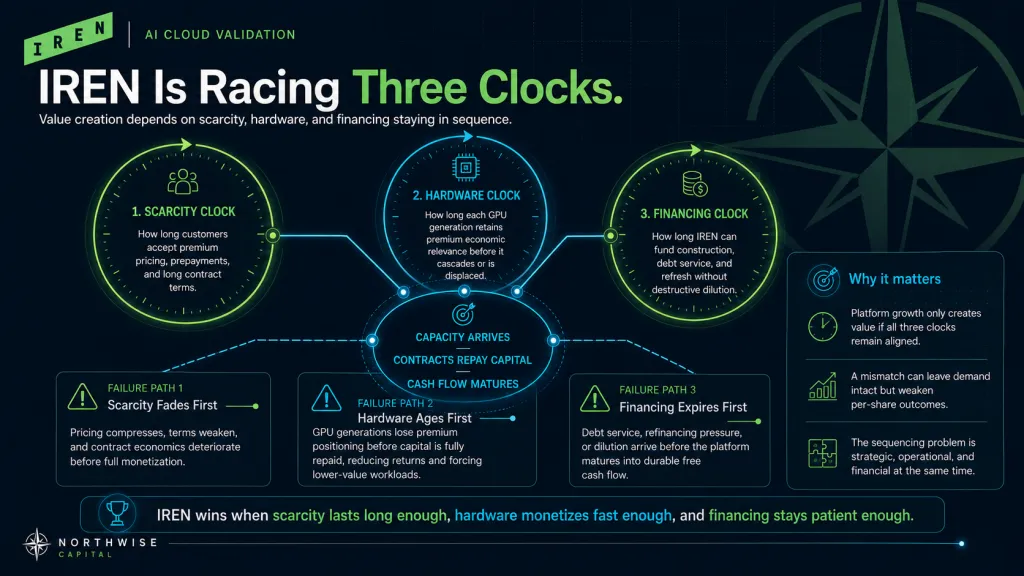
IREN runs against three clocks, and the thesis is a question of sequencing.
The scarcity clock measures how long customers will pay premiums, prepay capital, and sign long contracts for fast access. The hardware clock measures how quickly each GPU cohort loses its premium role. The financing clock measures how long IREN can fund construction, hardware, debt service, and refresh without destructive issuance.
Exceptional value requires capacity arriving before the scarcity clock expires, contracts returning capital before the hardware clock weakens, and cash flow maturing before the financing clock tightens. Value is destroyed when they fall out of order, and no single clock tells you anything useful alone.
The opportunity exists because the market is pricing contradictory facts simultaneously. IREN is a former miner with a volatile history, an owner of scarce grid-connected infrastructure, a rapidly emerging cloud, an NVIDIA customer, a Microsoft partner, a capital-intensive builder, and a financing-dependent equity. Investors compress that into one identity, and both compressions are wrong.
The market can undervalue IREN by fixating on mining history, GAAP losses, dilution, and complexity while ignoring physical scarcity, contract validation, and asset recovery value. It can overvalue IREN by capitalizing secured megawatts, targeted ARR, and customer logos while ignoring conversion ratios, acceptance, refresh, and the share count. The opportunity sits in the gap between those two errors.
Our conclusion is neither that IREN is a clean compounder nor that it is a speculative infrastructure trade. IREN is a high-risk attempt to convert a scarce power portfolio into a multi-layer AI Cloud platform before the current window matures, and it is running six construction projects at once: physical infrastructure, compute, cloud operations, software, customer relationships, and financing. Few companies attempt all six, and fewer finish without handing most of the value to capital providers.
Continue with Northwise Premium
Iren's transition is real and the finished platform is not. The valuation work ahead assigns a value to each outcome, weights them, and converts the result into an entry price, which is where our judgment becomes a number. It sits alongside the price targets, action zones, and weekly portfolio behind every name Northwise covers.
69. A Great Company Is Not Automatically a Great Entry
Part IX: Valuation - IREN Stock Forecast
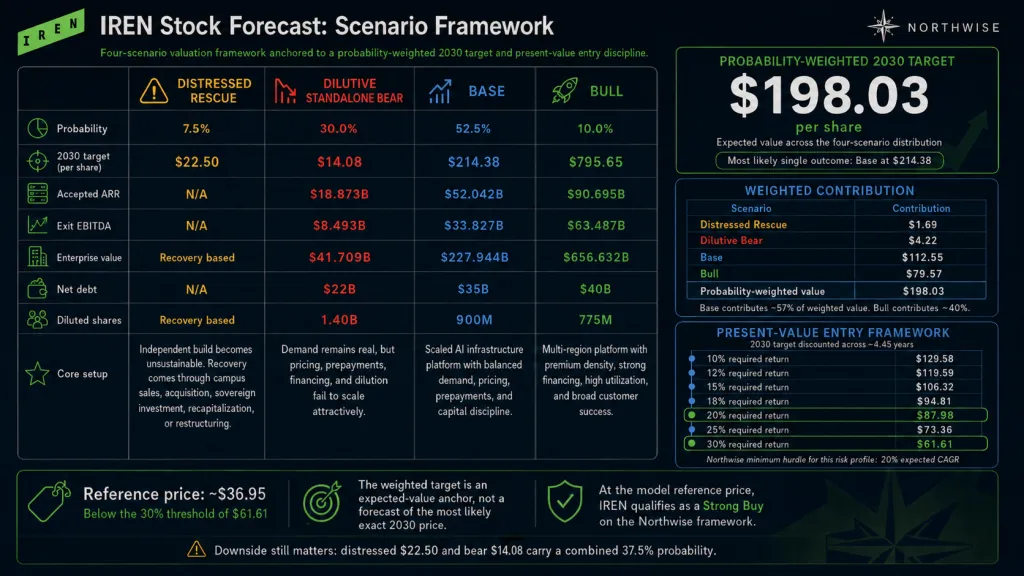
45. Why Exit ARR and EBITDA
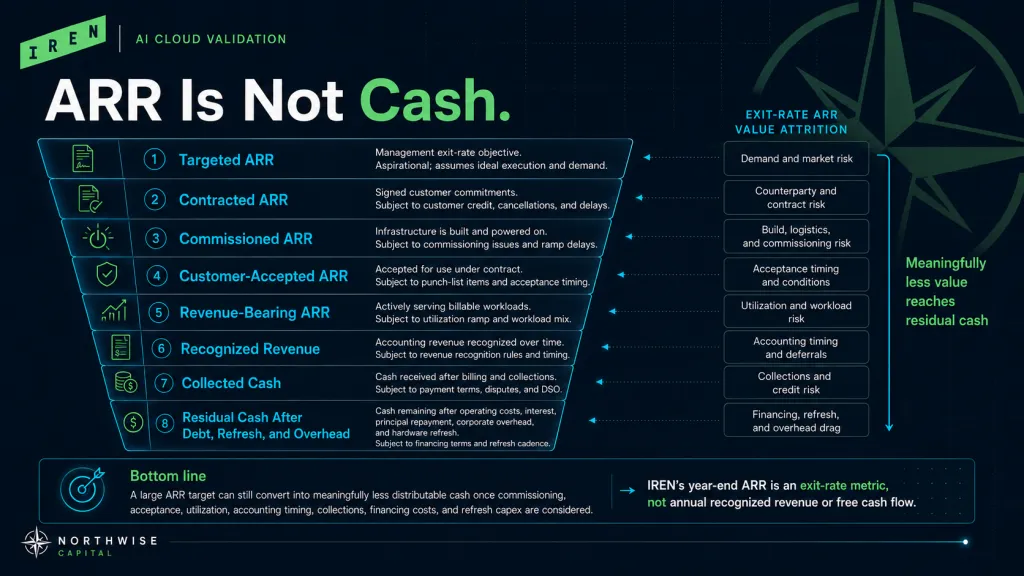
A discounted cash-flow model is the right tool for a business whose assets exist.
IREN's value depends mostly on assets not yet built, customers not yet contracted, hardware not yet purchased, and financing not yet arranged. A conventional DCF would demand precise annual estimates for construction timing, hardware purchases, amortization, working capital, refresh, and share issuance, producing a figure that looks exact and is governed entirely by its assumptions. Small changes to deployment timing or hardware life move free cash flow by billions.
The model instead builds a 2030 enterprise value from accepted exit ARR, exit EBITDA, scenario-specific multiples, net debt, and fully diluted shares, then discounts the probability-weighted result. That makes the uncertainty visible instead of eliminating it.
Exit ARR captures the platform's scale at the valuation date, since capacity installed late in 2030 adds a full run rate while contributing almost nothing to the year. ARR alone reveals nothing about quality, so EBITDA provides a partial productivity measure while excluding depreciation, interest, principal, refresh, and growth capex. We use it to separate a platform that fills capacity from one that earns on it, and we do not treat it as cash.
Scenario | ARR valuation weight | EBITDA valuation weight |
|---|---|---|
Bear | 70% | 30% |
Base | 70% | 30% |
Bull | 60% | 40% |
A pure ARR multiple overvalues weak-margin growth, and a pure EBITDA multiple undervalues a platform still investing heavily against contracted revenue and scarce power. Bear stays ARR-weighted since the company still produces contracted revenue despite poor capital economics. Bull shifts toward EBITDA, since a mature and highly profitable platform should be judged on earnings.
Free cash flow gets no separate exit multiple. Through 2030 the company remains in a growth cycle where heavy spending on attractive projects looks identical to distress while deferred refresh looks identical to strength. Cash quality enters indirectly through the EBITDA multiple, net debt, dilution, and hardware-life assumptions.
46. Margins and Exit EBITDA
Scenario | Exit EBITDA margin |
|---|---|
Bear | 45% |
Base | 65% |
Bull | 70% |
All three sit below IREN's earliest reported AI Cloud gross-margin profile, reflecting the operating weight of a much larger platform funding cloud operations, support, software, sales, security, and international teams. They remain high, reflecting large contracted clusters, cheap power, high density, and vertical integration.
Bear's 45% assumes substantial gross profit against weaker pricing, rising support costs, falling utilization, and managed cloud that never scales cleanly. That margin is excellent in most industries and inadequate for a business consuming tens of billions of dollars of compute capital.
Base's 65% requires strong utilization, meaningful bare-metal scale, profitable managed-cloud attachment, repeatable site designs, and controlled support expense. It assumes service revenue exceeds the cost of delivering it, not that services are free. Bull's 70% assumes exceptional utilization, premium density, strong automation, and scale purchasing, and stays below early segment reporting since it carries the full organization required to run 6.2 GW.
Scenario | Accepted ARR | EBITDA margin | Exit EBITDA |
|---|---|---|---|
Bear | $18.873B | 45% | $8.493B |
Base | $52.042B | 65% | $33.827B |
Bull | $90.695B | 70% | $63.487B |
Bull ARR is roughly 4.8 times bear ARR and bull EBITDA is roughly 7.5 times bear EBITDA. That compounding is why the equity outcomes diverge so violently.
47. The Bear Valuation
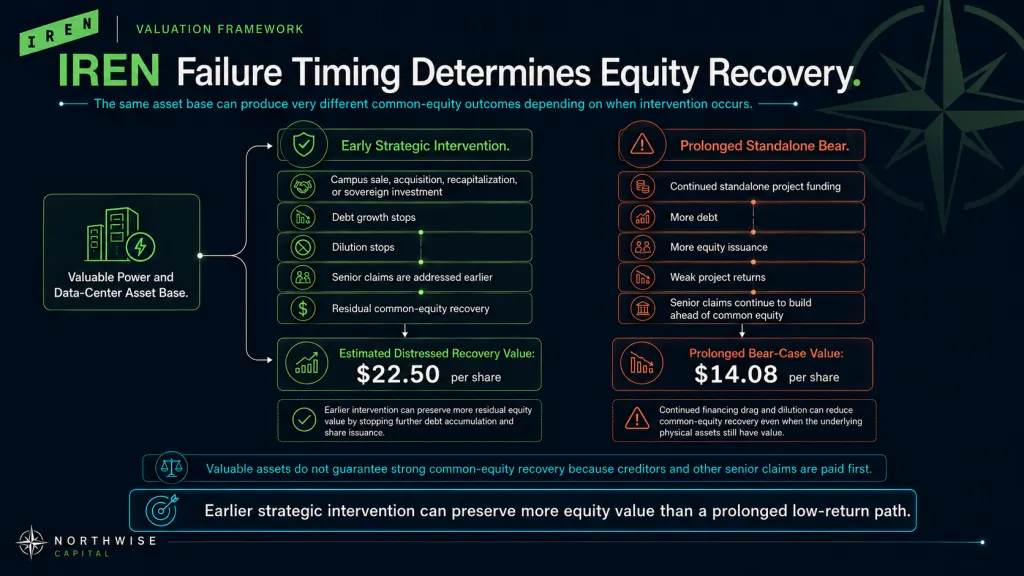
Bear applies 2.0 times ARR and 6.0 times EBITDA at a 70/30 weighting. The ARR leg produces $37.746 billion, the EBITDA leg produces $50.958 billion, and the blend gives approximately $41.709 billion of enterprise value.
The 2.0 times ARR multiple recognizes that IREN would still hold contracted relationships, multi-gigawatt infrastructure, a large operating fleet, and managed-cloud capability, discounted for weak returns, buyer power, dilution, and renewal uncertainty. The company would be too important to value as a failed miner and too capital-hungry to value as a premium cloud. The 6.0 times EBITDA multiple fits a capital-intensive platform facing heavy replacement, real debt, and technology risk.
Against $22.000 billion of net debt, equity value is $19.709 billion across 1.400 billion shares, for a target of $14.08 per share.
That result is severe even though IREN produces $18.9 billion of accepted ARR, $8.5 billion of EBITDA, and 2.45 GW of equipped capacity. Debt absorbs more than half the enterprise, the share count more than doubles, and the market applies lower-quality multiples to the whole thing. This is the dilution trap expressed numerically.
Bear lands below the $22.50 distressed estimate, which is not a contradiction. A prolonged standalone bear destroys more common-equity value than an earlier rescue, since IREN keeps funding projects, issuing shares, and adding debt for years. An earlier intervention can stop the dilution while the assets still carry negotiating value.
48. The Base Valuation
Base applies 3.75 times ARR and 9.0 times EBITDA at a 70/30 weighting. The ARR leg produces approximately $195.158 billion, the EBITDA leg approximately $304.443 billion, and the blend approximately $227.944 billion.
That figure assumes IREN becomes a scaled, strategically important AI infrastructure platform without receiving a hyperscaler or software valuation. It earns more than an infrastructure-lease multiple since IREN controls physical assets, compute, operations, and services together, and it stays below premium software levels since hardware replacement, financing, concentration, and renewal risk are all real. The 9.0 times EBITDA multiple acknowledges that EBITDA overstates distributable cash before refresh and amortization.
Against $35.000 billion of net debt, equity value is $192.944 billion across 900 million shares, for a target of $214.38 per share.
The base target is not built on minimal dilution. It carries a share count large enough to absorb common issuance, convert dilution, employee and founder awards, strategic rights, and acquisition consideration, and the platform still grows fast enough that per-share value becomes substantial.
Reaching it requires 6.0 GW physical, 4.6 GW equipped, $52.0 billion of accepted ARR, $33.8 billion of exit EBITDA, a 65% margin, $35 billion of net debt, and 900 million shares. It does not require full 5 GW monetization, zero dilution, software-like cash conversion, or permanent shortage pricing.
49. The Bull Valuation and the Distressed Path
Bull applies 6.0 times ARR and 13.0 times EBITDA at a 60/40 weighting. The ARR leg produces $544.170 billion, the EBITDA leg approximately $825.331 billion, and the blend approximately $656.632 billion, which would place IREN among the world's largest technology and infrastructure platforms.
The 6.0 times ARR multiple assumes IREN has become considerably more than a hardware landlord, with global infrastructure, multi-region operations, enterprise and sovereign demand, managed cloud, and premium density. It stays below extreme software valuations since IREN still buys and replaces the hardware. The 13.0 times EBITDA multiple assumes exceptional growth, low leverage against earnings, durable relationships, and proven repeatable financing.
Against $40.000 billion of net debt, equity value is $616.632 billion across 775 million shares, for a target of $795.65 per share. Even that outcome carries substantial dilution and 900 MW of unequipped physical capacity, so bull describes operating performance overwhelming a real capital burden instead of a pristine balance sheet.
Bull requires 7.1 GW physical, 6.2 GW equipped, more than $90 billion of accepted ARR, and more than $63 billion of EBITDA, with construction, demand, pricing, financing, software, and hardware life all cooperating. Weakness in any one moves the outcome toward base.
The distressed case uses a direct equity recovery of $22.50 per share instead of a multiple, since a distressed IREN has no stable operating forecast to capitalize. Recovery would come through campus sales, acquisition, sovereign investment, recapitalization, or restructuring, with buyers valuing Childress, Sweetwater, grid positions, substations, land, hardware, and contracts. Common equity is paid last, which is why the figure recognizes real residual value without assuming replacement cost belongs to shareholders.
50. Probabilities and the Weighted Target
Scenario | Probability | 2030 target |
|---|---|---|
Distressed Rescue | 7.5% | $22.50 |
Dilutive Standalone Bear | 30.0% | $14.08 |
Base | 52.5% | $214.38 |
Bull | 10.0% | $795.65 |
Scenario | Accepted ARR | Exit EBITDA | Enterprise value | Net debt | Diluted shares |
|---|---|---|---|---|---|
Distressed Rescue | N/A | N/A | Recovery based | N/A | Recovery based |
Dilutive Standalone Bear | $18.873B | $8.493B | $41.709B | $22B | 1.40B |
Base | $52.042B | $33.827B | $227.944B | $35B | 900M |
Bull | $90.695B | $63.487B | $656.632B | $40B | 775M |
Base receives 52.5% as the single most likely outcome, supported by demonstrated hyperscaler validation, AI-native contracting, managed-cloud demand, prepayments, liquidity, and active construction. The model no longer requires a commercial leap and instead requires scaling evidence that already exists at smaller capacity. It sits only slightly above 50% since construction, commissioning, financing, diversification, software, hardware lifecycle, and dilution all still have to work.
Bear holds 30%, since demand generation does not guarantee returns. Pricing compression, higher project cost, lower prepayments, expensive debt, weak residual values, and excessive issuance can each contribute, and the revised bear accepts the July 20 evidence while assuming it fails to scale.
Bull receives 10% since it requires nearly every system to reinforce every other one. A company producing more than $90 billion of accepted ARR from 6.2 GW would be one of the most successful infrastructure expansions in modern technology, and that precision justifies a low weight. The announcement raises confidence in the direction of bull while primarily lifting base.
Scenario | Probability | Target | Weighted contribution |
|---|---|---|---|
Distressed Rescue | 7.5% | $22.50 | $1.69 |
Dilutive Bear | 30.0% | $14.08 | $4.22 |
Base | 52.5% | $214.38 | $112.55 |
Bull | 10.0% | $795.65 | $79.57 |
Probability-weighted value | 100% | $198.03 |
IREN 2030 Probability Weighted Outcome Distribution Northwise
Bull contributes roughly $79.57, about 40% of the weighted value, on a 10% probability. Base contributes roughly $112.55, about 57%. The two downside scenarios contribute $5.91 combined.
The $198.03 figure is an expected value across a wide distribution and not a forecast of the 2030 price. The most likely single outcome is base at $214.38, and the weighted figure sits lower since severe loss carries meaningful probability. That distinction governs position sizing, since a stock can carry high expected value, a credible base case, and brutal downside at once.
The weighting is only as good as the probabilities. Shifting 5 percentage points from bull to bear would reduce the weighted value by approximately $39.08 per share, which makes probability discipline as important as the operating arithmetic.
51. Revision From the Prior Model
The prior weighted target was $164.58. The revised figure is $198.03, an increase of roughly $33.45 per share or about 20%.
Revision source | Impact |
|---|---|
Higher ARR and improved contract economics | +$10.74 |
Lower modeled dilution | +$7.89 |
Probability shift toward base | +$14.81 |
Total increase | +$33.44 |
The revenue component comes from lifting the 2026 anchor from approximately $7.7 million to more than $8.3 million per gross MW and from the evidence supporting higher later cohorts. It is not applied to the full fleet, and it still flows through ARR, EBITDA, and enterprise value together.
The dilution component comes from raising base customer funding to approximately 30% of fully loaded project cost, which lowers sponsor capital per megawatt and reduces the modeled 2030 share count. That contribution of roughly $7.89 is a reminder that financing quality creates value even when revenue does not move.
The largest revision is probability. A greater share of prior downside reflected the possibility that IREN never moves beyond hyperscaler-dominated bulk capacity, and the new customer list weakens that specific outcome. We shifted weight away from commercial failure toward base execution without transferring most of it into bull, since the contracts remain small against the full build.
We did not revise physical capacity, equipped capacity, margins, net debt, multiples, or bull probability. Those require separate evidence, since a commercial announcement proves nothing about construction, margin, hardware life, or capital discipline.
52. Present Value and Entry Discipline
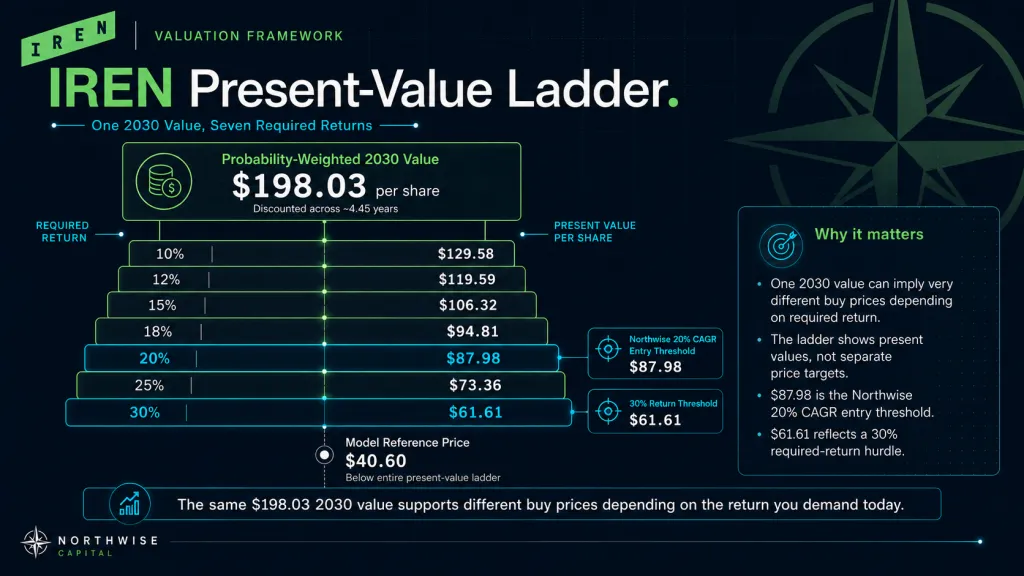
The 2030 target discounts across approximately 4.45 years from the model reference date.
Required annual return | Present value |
|---|---|
10% | $129.58 |
12% | $119.59 |
15% | $106.32 |
18% | $94.81 |
20% | $87.98 |
25% | $73.36 |
30% | $61.61 |
This is one relationship viewed at seven required returns, not seven price targets.
Northwise requires at least a 20% expected CAGR for a company carrying execution risk, debt, dilution, and hardware obsolescence at this scale, which puts the entry value at $87.98. At the model reference price near $40.60, the weighted target is approximately 4.88 times the reference price, the implied annualized return is approximately 42.8%, and the 20% threshold sits at roughly 2.17 times the reference price.
A $129.58 purchase would deliver only a 10% expected annual return against this distribution, which is inadequate compensation for construction risk, concentration, financing risk, refresh, and dilution. IREN should not be underwritten like a mature diversified infrastructure company, and a valuation can be correct while the required return attached to it is far too low.
The entry value rose on improved contract economics, better dilution assumptions, and higher base probability, which means the expected-value model improved. The downside did not soften, and the bear target remains $14.08 against a $22.50 distressed estimate.
Price range | Implied expected return | Northwise rating |
|---|---|---|
Below $61.61 | Above 30% CAGR | Strong Buy |
$61.62 to $87.98 | 20% to 30% CAGR | Buy |
$87.99 to $129.58 | 10% to 20% CAGR | Hold |
$129.59 to $198.03 | 0% to 10% CAGR | Trim |
$198.04 to $316.48 | 0% to negative 10% CAGR | Sell |
Above $316.48 | Worse than negative 10% CAGR | Strong Sell |
These zones are model outputs and should move when probabilities, targets, time, or the share count change.
At the reference price, the distressed outcome implies roughly 45% cumulative downside and bear implies roughly 65%, while base implies more than 5 times the price and bull nearly 20 times. The expected value is favorable since the upside outcomes are much larger than the downside ones, which describes asymmetry and not safety.
53. Sensitivities
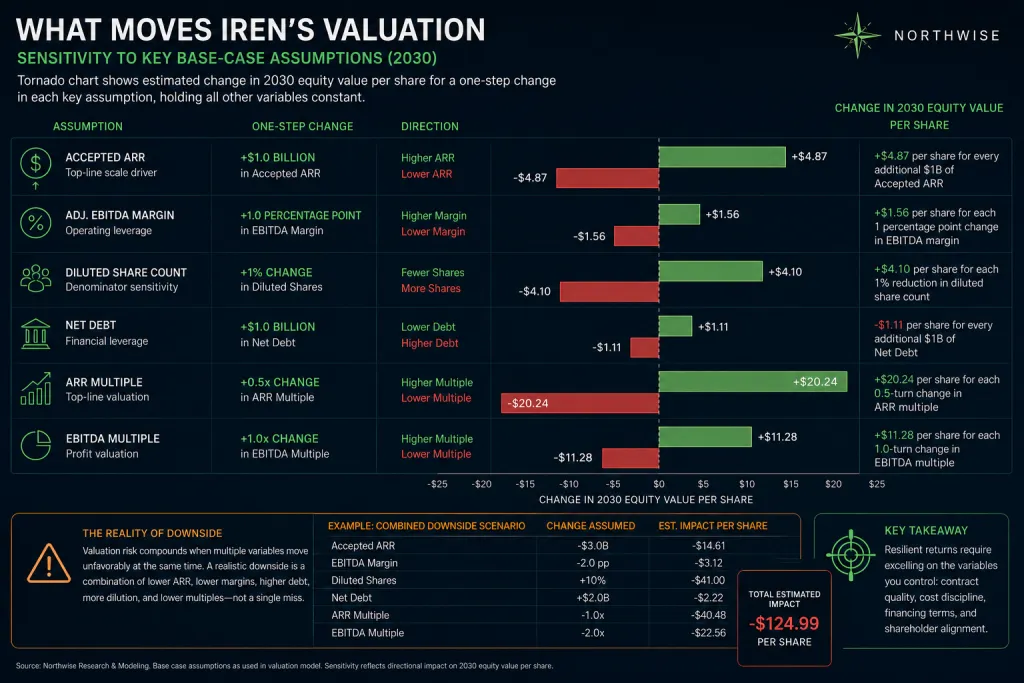
Each additional $1 billion of accepted ARR adds $2.625 billion through the ARR leg and $1.755 billion through the EBITDA leg, or approximately $4.380 billion of enterprise value. At 900 million shares that is roughly $4.87 per share, so a $5 billion ARR miss costs approximately $24 per share.
Each percentage point of EBITDA margin moves EBITDA by roughly $520 million against base accepted ARR. At 9.0 times and a 30% weight, that is approximately $1.40 billion of enterprise value or $1.56 per share, so a 10-point margin decline costs approximately $15.60 before secondary effects.
Diluted shares | Implied base target |
|---|---|
775M | $248.96 |
850M | $226.99 |
900M | $214.38 |
1.00B | $192.94 |
1.10B | $175.40 |
1.20B | $160.79 |
Moving from 900 million to 1.2 billion shares costs approximately $53.59 per share against an unchanged enterprise, which is the denominator problem from section 39 in a single column. Each additional $1 billion of net debt costs $1.11 per share in base, $0.71 in bear, and $1.29 in bull.
Each half-turn change in the base ARR multiple moves enterprise value by approximately $18.21 billion, or $20.24 per share, and each full turn on the EBITDA multiple moves it by approximately $10.15 billion, or $11.28 per share. A company entering 2030 with unresolved renewals, refresh, and concentration can hit its ARR target and still receive a materially lower multiple.
The realistic downside never moves one variable. Combine 10% lower ARR, a 10-point lower margin, a full turn off the ARR multiple, 2 turns off EBITDA, $10 billion more net debt, and 200 million more shares, and the result travels from base toward bear quickly, since those variables reinforce one another. That correlation is precisely why the report uses distinct scenarios instead of a point estimate surrounded by isolated sensitivities.
54. Terminal Risk and Monitoring
The model values IREN at an awkward point in its own asset cycle. By 2030 the company may face contract renewals, hardware repositioning, refresh spending, debt amortization, and convertible planning at once, and the market will not pay the same multiple for $52 billion of ARR arriving with renewals settled as it will for the same ARR arriving with everything open.
The base multiple could prove conservative if IREN enters 2030 with renewed anchors, low concentration, scaled enterprise demand, proven managed-cloud margins, funded refresh, and a stable share count. It could prove too high if ARR stays concentrated, renewals are unresolved, managed cloud is low margin, net debt rises, and dilution continues. IREN can hit the operating target and miss the equity target purely on revenue quality.
The weighted target should rise if the 2026 target is accepted on schedule, 2027 capacity becomes largely contracted, density holds above $8.3 million, new managed-cloud contracts approach or exceed $12 million per MW, prepayments hold near 30% of fully loaded capex, dilution tracks below 900 million shares, and concentration falls materially. It should fall if accepted ARR trails contracted ARR, the 2026 program slips, density declines, prepayments shrink, support costs pressure margins, or equity issuance accelerates.
Bull probability should rise only on multi-site customer expansion, conventional enterprise demand, sovereign contracts, repeatable managed-cloud economics, high utilization, and favorable renewals. One more customer announcement is not evidence that the platform compounds.
55. Final Judgment
IREN's revised probability-weighted 2030 target is $198.03 per share, worth $87.98 today at a 20% required return.
Iren's current stock price sits well below the required 20% Northwise entry requirement and even further below the 30% cut off that generally indicates significant value. According to the Northwise Terminal Framework, IREN qualifies as a Strong Buy.
That rating does not imply low risk. The downside cases remain $22.50 and $14.08, and a 37.5% combined probability sits behind them. The expected-value case is attractive since the physical assets are real, demand is increasingly validated, managed-cloud contracts improve density, prepayments reduce sponsor capital, and the current price does not appear to reflect the full platform opportunity.
The central risk is not that IREN fails to become large. It is that IREN becomes very large while debt, dilution, refresh, and customer bargaining power consume the value the assets create.
This is one of the widest credible outcome distributions in public AI infrastructure, spanning a distressed asset portfolio, a poorly financed infrastructure provider, a scaled independent cloud, and one of the world's most valuable AI platforms. July 20 materially improved the middle of that distribution by showing IREN can attract developers, sell managed cloud, earn stronger pricing, and secure customer funding. It proved nothing about scaling those economics across gigawatts, preserving margins, controlling dilution, or navigating 2030.
At the reference price, investors are not paying for the base outcome. They are paying below the present value associated with a 30% required annual return, which creates exceptional modeled asymmetry earned through exposure to exceptional risk. IREN belongs in a portfolio as a high-conviction, tightly monitored position, sized accordingly, and never mistaken for a predictable compounder.
The company has built the power platform. It has begun proving the customer platform. The remaining test is whether it can build the financial platform that lets common shareholders keep enough of what those assets create.
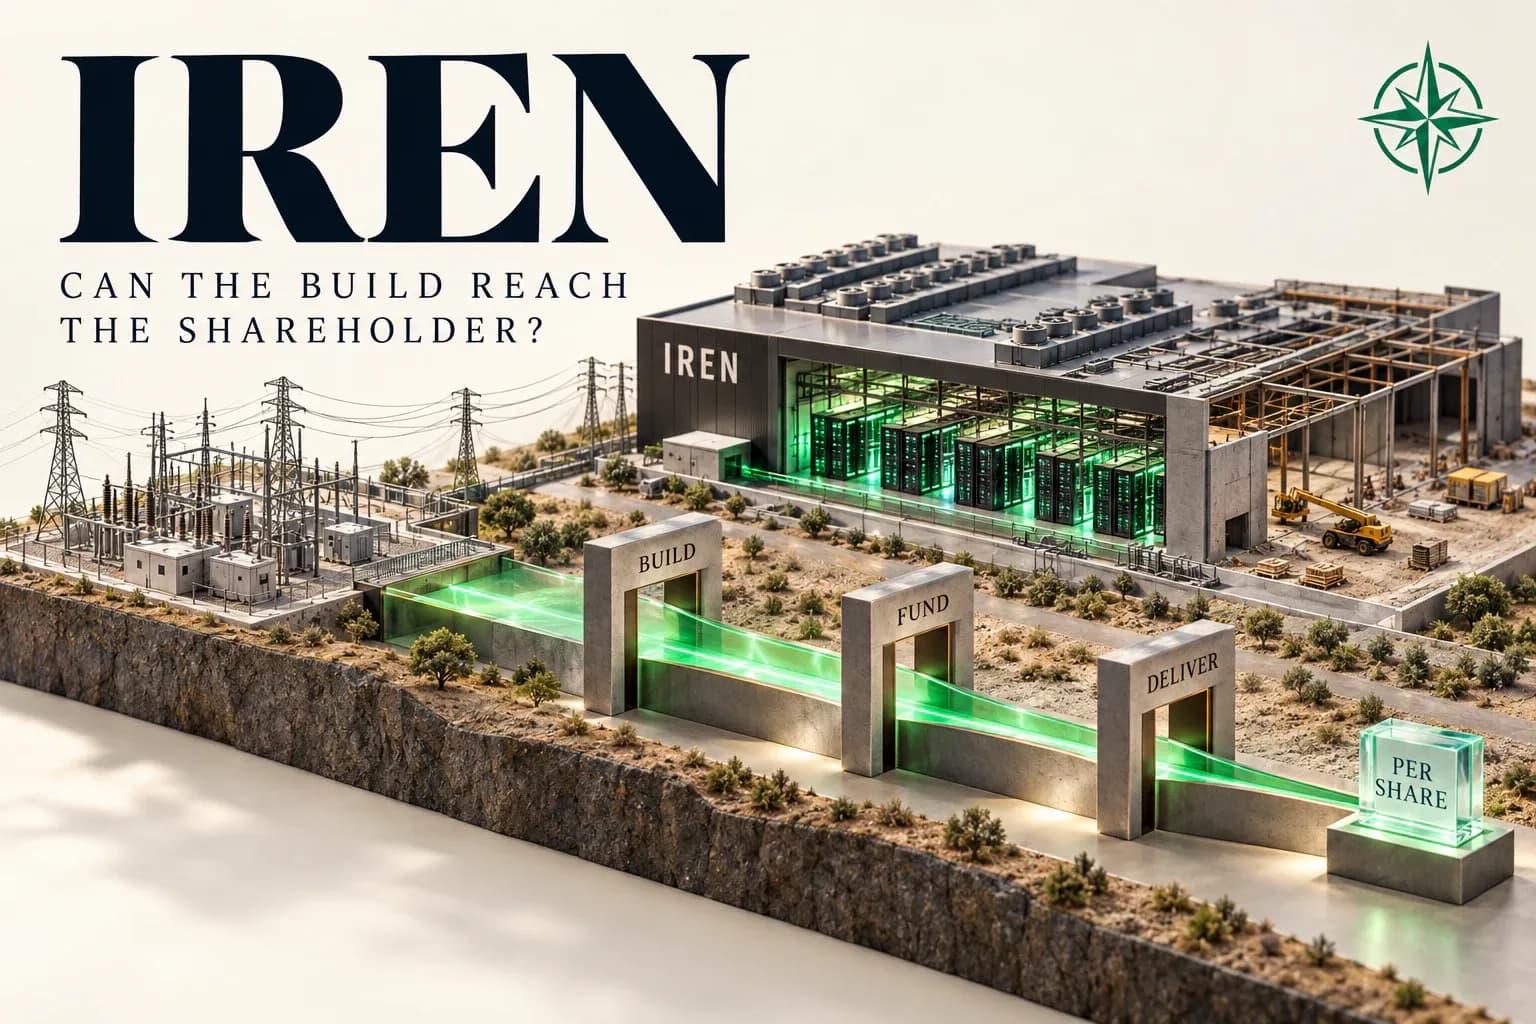
IREN Stock Dilution: Can the Build Reach Shareholders?
IREN stock analysis of AI growth, funding and dilution through 2030. Read our full valuation, 27 scenarios and price zones free. Excel model is Premium.
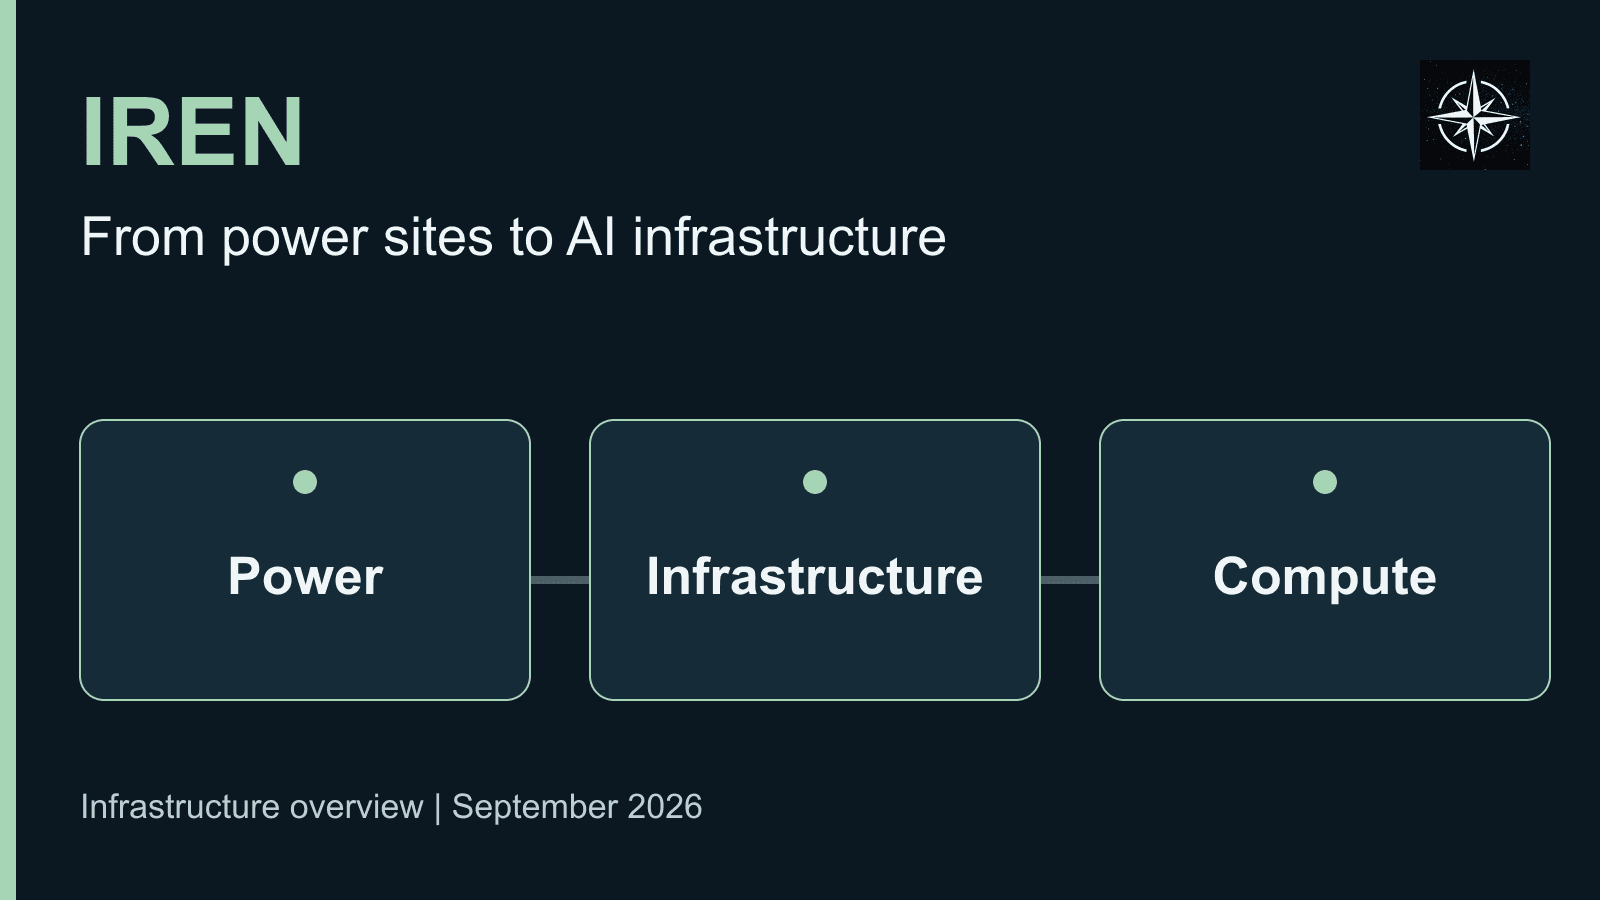
IREN Stock Infrastructure Analysis
Explore IREN data centers in Canada, the US, Australia and Spain, with site studies and clear distinctions between planned power and delivered AI capacity.

Iren Oklahoma Site
Kiowa, Oklahoma: IREN’s 1.6 GW planned power position, development timing and the remaining delivery dependencies.
Northwise Portfolios
See how the research becomes real decisions
Reader discussion
Discuss the research
Create a Free account to join the discussion with a display name.
Create a Free Account
No comments yet. Start a thoughtful discussion.