
Amazon Stock Forecast 2030

Amazon stock Forecast 2030 modeling Amazon’s AI capital cycle, AWS scale, depreciation wall, and 2030 price targets, buy zones, and valuation.
In this article
A full-cycle analysis of Amazon’s AI infrastructure buildout, depreciation absorption, segment scaling, and 2030 valuation framework under a $300B annual CapEx regime.
1. Executive Summary
Amazon is entering the most capital-intensive phase in its corporate history.
FY2025 CapEx reached approximately $131.8B, with guidance signaling roughly $200B in 2026, primarily driven by AI infrastructure expansion inside AWS. Under a continued scaling regime, annual CapEx could approach $300B by 2029–2030.
This investment wave creates a mechanical consequence: depreciation.
Depreciation and amortization, roughly $51B in 2025, will likely expand toward $160B–$180B annually by 2030 as successive hardware cohorts layer into the income statement.
The market sees rising CapEx and rising depreciation.
This report focuses on whether operating throughput can rise faster.
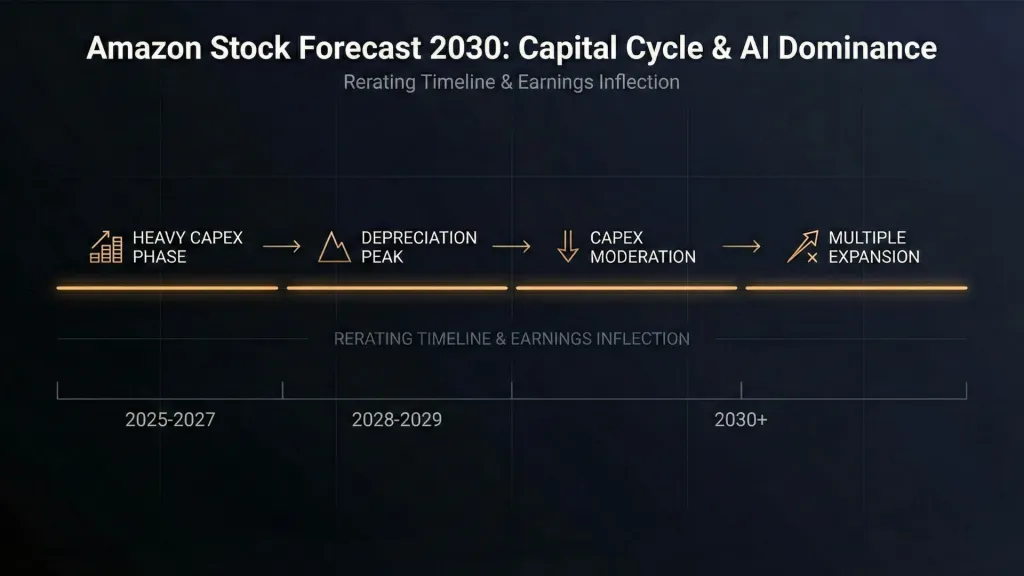
The thesis is rooted in capital cycle absorption. The next five years will determine whether Amazon transitions from peak build phase to harvest phase with earnings power that materially exceeds today’s consensus framing.
1.1 The Capital Cycle Thesis in Plain Terms
Amazon is spending at infrastructure scale.
Roughly 70% of forward CapEx is assumed to be hardware-heavy AWS infrastructure, implying annual AWS hardware deployments in excess of $140B beginning in 2026, scaling toward ~$210B per year by the end of the decade.
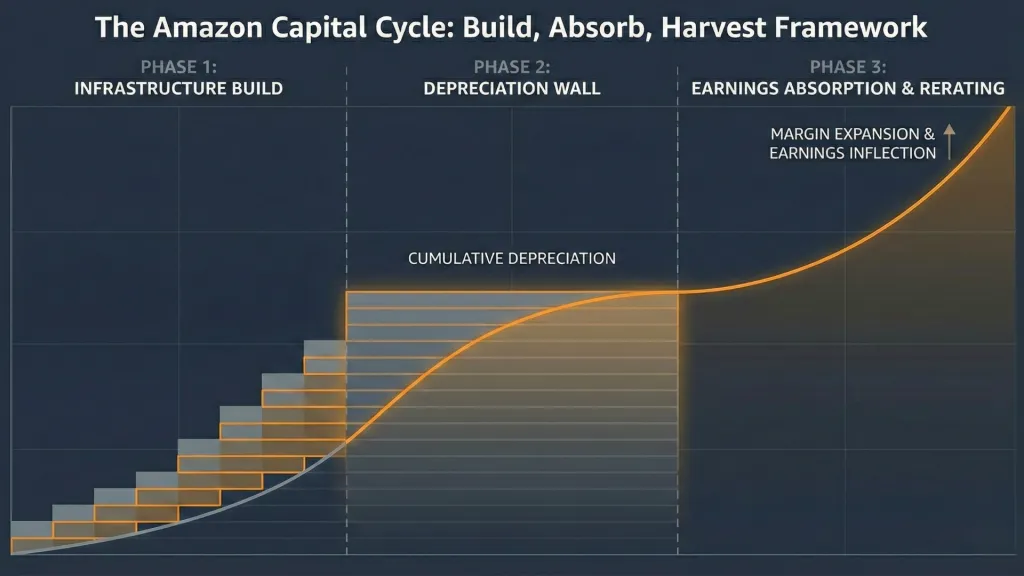
Each hardware cohort depreciates over approximately five years. As these layers accumulate, depreciation compounds.
The result resembles a multi-story structure being built floor by floor. Each completed floor adds weight. The foundation must strengthen proportionally.
The central question becomes simple:
Can Amazon generate enough operating income from AWS, Advertising, and Retail to absorb the depreciation wall created by its own investment?
If utilization remains high and AI demand persists, infrastructure behaves like a power grid running near capacity. If demand weakens, fixed cost intensity becomes visible immediately.
This is the nature of capital cycles.
1.2 Why the Market Is Anchored to the Wrong Variable
Markets compress multiples during peak build phases.
High CapEx reduces near-term free cash flow visibility. Rising depreciation pressures GAAP earnings. Margins appear unstable during expansionary periods.
Amazon currently trades at a multiple that reflects uncertainty around peak investment rather than a steady-state earnings regime.
Capital cycle businesses historically rerate when build transitions to yield. Once CapEx growth slows and throughput stabilizes, operating leverage becomes visible.
The timing of that transition determines valuation.
Short-term earnings optics dominate headlines. Long-duration infrastructure cycles determine terminal value.
1.3 The Depreciation Wall and the Optical Earnings Problem
Under the assumed CapEx path, AWS hardware cohorts from 2026 through 2030 will layer in sequentially.
Each annual deployment contributes tens of billions in incremental depreciation expense. Layered onto the 2025 baseline of ~$51B, total depreciation could reach $160B–$180B annually by 2030.
This is the depreciation wall.
However, accounting depreciation follows a fixed schedule. Economic usefulness does not necessarily follow the same timeline.
Inference workloads are expected to expand materially through the back half of the decade. If GPUs retain productive economic value beyond their accounting life, the effective return profile improves.
Depreciation behaves like a clock. Utilization behaves like traffic through a toll bridge. The clock ticks evenly. Revenue depends on how many vehicles cross.
The bridge only becomes problematic if traffic slows.
1.4 Where the Asymmetry Comes From
Amazon operates multiple structural earnings engines:
- AWS, with ~$129B in 2025 revenue and a backlog of ~$244B
- Advertising, generating ~$60B with high-margin characteristics
- North America retail exceeding $400B in annual revenue
- International retail with margin catch-up potential
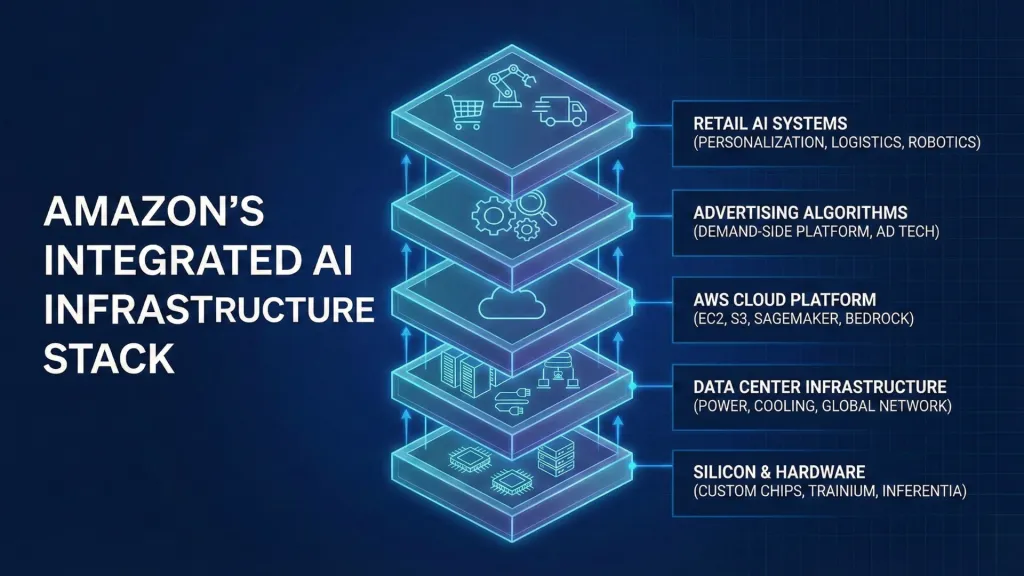
The AI infrastructure buildout primarily serves AWS. Advertising acts as structural margin ballast. Retail continues to mature operationally through robotics and AI logistics optimization.
If these engines scale in tandem while CapEx growth moderates into 2029–2030, operating leverage can emerge rapidly.
If utilization falters or demand slows materially, the capital structure becomes heavy.
The asymmetry rests in demand persistence.
1.5 What Must Be True for 2030 to Work
Five structural conditions underpin the framework:
- AI enterprise demand remains durable through the decade.
- AWS backlog converts efficiently into revenue.
- Inference workloads extend hardware monetization windows.
- Advertising monetization density continues expanding.
- CapEx growth moderates before 2030, enabling a rerating regime.
Failure conditions are explicit:
- Hyperscaler utilization declines materially.
- CapEx persists without revenue absorption.
- AWS loses meaningful share.
- Regulatory fragmentation impairs Ads or AWS economics.
- Energy constraints compress margins.
This report evaluates those conditions segment by segment before introducing full financial modeling, valuation frameworks, and allocation strategy.
The conviction is conditional.
The build phase is visible today.
The harvest phase depends on throughput.
Table of Contents
- Executive Summary
1.1 The Capital Cycle Thesis in Plain Terms
1.2 Why the Market Is Anchored to the Wrong Variable
1.3 The Depreciation Wall and the Optical Earnings Problem
1.4 Where the Asymmetry Comes From
1.5 What Must Be True for 2030 to Work - Amazon’s Capital Cycle Regime
2.1 From Retail Platform to AI Infrastructure Utility
2.2 The AI Infrastructure Arms Race
2.3 Why $200B–$300B Annual CapEx Is Rational
2.4 The Supply-Constrained Compute Environment
2.5 What a Peak Build Phase Actually Looks Like - The Depreciation Wall Explained
3.1 Hardware Cohort Layering Through 2030
3.2 Why Depreciation Will Reach $160B–$180B
3.3 GAAP Optics vs Economic Productivity
3.4 Inference Workloads and Asset Life Extension
3.5 Absorption Capacity and Utilization Risk - AWS: The Primary Earnings Engine
4.1 Revenue Base and $244B Backlog Dynamics
4.2 GPU Supply, Custom Silicon, and Throughput Expansion
4.3 Training vs Inference Mix Shift
4.4 Margin Structure Under Scale
4.5 What Breaks the AWS Assumption - Advertising: The Structural Margin Ballast
5.1 Why Ads Is a Different Business Model
5.2 AI Yield Optimization and Monetization Density
5.3 International Expansion Runway
5.4 Margin Durability and Competitive Moat
5.5 Downside Sensitivities - North America Retail: Mature but Improving
6.1 Embedded Subscription Economics
6.2 Robotics and AI Logistics Optimization
6.3 Margin Expansion Framework
6.4 Sensitivity to Consumer Weakness - International Retail: Controlled Expansion
7.1 Revenue Composition and Regional Drivers
7.2 Emerging Market Scaling Logic
7.3 Margin Catch-Up Path
7.4 Currency and Regulatory Risk - Project Leo (Kuiper): Strategic Optionality
8.1 Capital Requirements and Deployment Timeline
8.2 Revenue Potential Under Different Adoption Curves
8.3 Depreciation Drag vs Strategic Value
8.4 Why Leo Is Not Required for the Base Case - Consolidated 2030 Operating Framework
9.1 Segment-Level Revenue Composition
9.2 Operating Income Expansion Under Heavy Depreciation
9.3 Corporate Overhead and Structural Expenses
9.4 Sensitivity to CapEx Timing and Revenue Mix - Risk Matrix and Failure Conditions
10.1 AI Enterprise Demand Slows
10.2 Hyperscaler Utilization Compression
10.3 CapEx Persists Without Revenue Absorption
10.4 AWS Share Loss
10.5 Regulatory Fragmentation
10.6 Energy and Power Constraints
Premium Modeling & Allocation
- Full 2030 Financial Model
11.1 Bear Case Framework
11.2 Base Case Framework
11.3 High Case Framework
11.4 Probability Weighting and Scenario Logic - EPS and Share Count Modeling
12.1 Net Income Conversion Assumptions
12.2 Tax and Share Count Framework
12.3 EPS Outcomes by Scenario - Valuation Framework and Rerating Mechanics
13.1 Terminal Multiple Assumptions
13.2 Harvest-Phase Rerating Logic
13.3 Scenario-Based Price Targets - Discounted Fair Value (Early 2026)
14.1 Discount Rate Sensitivity
14.2 Intrinsic Value Range
14.3 Expected IRR From Current Price - Buy, Hold, Trim Framework
15.1 Accumulation Zones
15.2 Strong Buy Range
15.3 Hold Range
15.4 Trim and De-Risk Levels
15.5 What Would Change Our View - Northwise Portfolio Allocation
16.1 Current Portfolio Allocation
16.2 Role of AMZN Within the Northwise Portfolio
16.3 Capital Cycle Exposure and Portfolio Balance
16.4 Rebalancing Discipline
16.5 Allocation Triggers - The Northwise View
17.1 Why This Opportunity Exists
17.2 Where the Market Is Overreacting
17.3 The Conditional Conviction Statement
17.4 Final Synthesis
2. Amazon’s Capital Cycle Regime
Amazon’s current trajectory cannot be evaluated through traditional retail or platform lenses. The company is operating inside an infrastructure expansion cycle measured in hundreds of billions of dollars annually.
This is a capital regime shift.
Between FY2025 and FY2030, Amazon is expected to deploy cumulative CapEx approaching $1.3T–$1.4T under the assumed path. The majority of this spend is tied to AI-driven data center buildout, networking capacity, and custom silicon deployment inside AWS.
Capital cycles of this magnitude reshape income statements, competitive positioning, and valuation frameworks simultaneously.
The question is not whether spending is elevated.
The question is whether spending is rational relative to long-duration demand.
2.1 From Retail Platform to AI Infrastructure Utility
Amazon began as an e-commerce logistics network. By 2025, AWS has become the structural earnings engine.
AWS generated approximately $129B in 2025 revenue, supported by a reported $244B backlog, reflecting multi-year enterprise and hyperscaler commitments.
Retail revenue remains substantial:
- North America retail: ~$426B
- International retail: ~$162B
Advertising contributes roughly ~$60B, operating at structurally higher margins than retail.
However, forward capital intensity is being driven primarily by AI compute demand.
The shift resembles a transformation from marketplace operator to infrastructure utility. Utilities operate with high upfront capital intensity and long-duration revenue streams. Margins stabilize when utilization stabilizes.
Amazon’s financial statements are beginning to reflect that utility-like buildout.
2.2 The AI Infrastructure Arms Race
AI compute demand is supply constrained.
Leading-edge GPU manufacturing capacity is limited by wafer allocation and advanced packaging throughput. Data center power availability has become a gating factor across the United States and Europe.
Amazon’s response is scale.
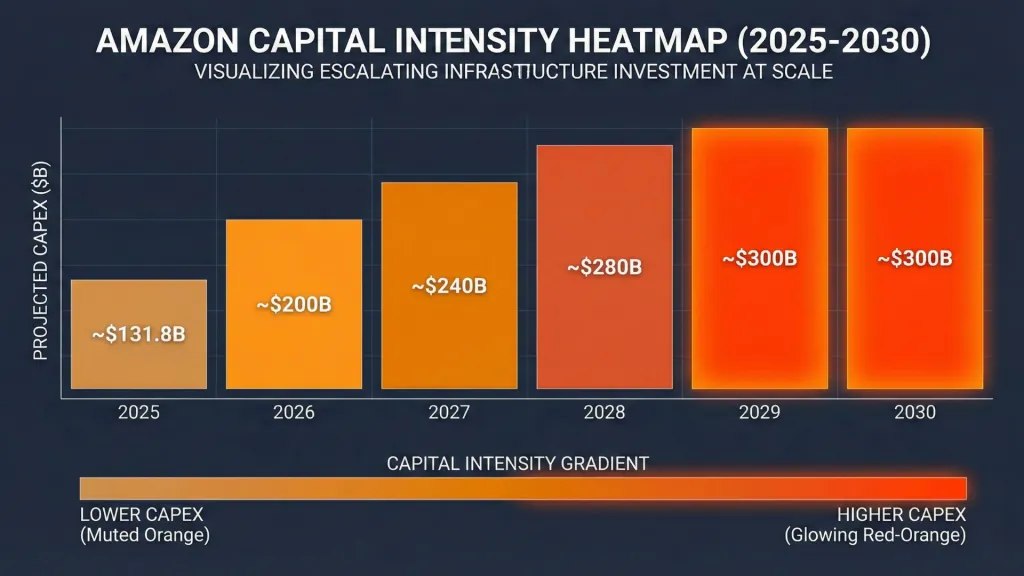
Projected CapEx under the modeled path:
Year | Total CapEx |
|---|---|
2025 | $131.8B |
2026 | ~$200B |
2027 | ~$240B |
2028 | ~$280B |
2029 | ~$300B |
2030 | ~$300B |
Approximately 70% of this spend is assumed to be AWS infrastructure, including:
- GPU clusters
- Custom AI silicon
- Networking expansion
- Power contracts
- Data center construction
The arms race dynamic is driven by hyperscaler demand for AI training and inference capacity. Enterprise adoption is expanding across healthcare, financial services, manufacturing, and defense sectors.
This is not incremental capacity expansion. It is industrial-scale compute deployment.
2.3 Why $200B–$300B Annual CapEx Is Rational
High CapEx appears aggressive in isolation. Context determines rationality.
AWS operates in a market where demand visibility is partially anchored by backlog commitments. The $244B backlog reflects contracted enterprise obligations extending across multiple years.
AI workloads exhibit high capital intensity but also high switching costs once integrated into enterprise systems.
Spending ahead of demand can create oversupply. Spending behind demand cedes share permanently.
Amazon appears to be spending in alignment with supply constraints and backlog visibility.
Capital allocation at this scale resembles constructing an interstate highway network. The cost is front-loaded. Economic throughput compounds once traffic density stabilizes.
2.4 The Supply-Constrained Compute Environment
The AI compute ecosystem is constrained by three structural bottlenecks:
- Leading-edge wafer allocation
- Advanced packaging capacity
- Power infrastructure availability
AWS infrastructure buildout addresses all three simultaneously:
- Long-term power contracts secure megawatt availability.
- Data center expansion increases physical capacity.
- Custom silicon initiatives reduce dependency on third-party supply chains.
Power density requirements for AI clusters are significantly higher than traditional cloud workloads. Data center operators increasingly compete for access to regional grid capacity.
In this environment, capital availability becomes a competitive weapon.
Amazon’s balance sheet and cash flow generation provide the flexibility to commit capital at scale.
2.5 What a Peak Build Phase Actually Looks Like
Peak build phases share common characteristics:
- Elevated CapEx relative to revenue
- Rising depreciation layers
- Margin compression during expansion
- Compressed valuation multiples
- Narrative focus on spending risk
Amazon exhibits each characteristic today.
Depreciation is expected to expand from ~$51B in 2025 toward ~$160B–$180B by 2030 under cohort layering assumptions.
This mechanical layering creates earnings optics that may appear stagnant even as capacity expands rapidly.
Peak build phases feel uncomfortable. Capital is deployed long before full economic yield is visible.
The transition from build to harvest typically occurs when:
- CapEx growth moderates
- Utilization stabilizes
- Revenue per unit of infrastructure increases
- Operating leverage becomes measurable
The inflection is rarely obvious in advance.
This section establishes the structural context. The next section evaluates the mechanical implications of depreciation layering and asset economics in detail.
3. The Depreciation Wall Explained
If CapEx is the visible action, depreciation is the delayed consequence.
Amazon’s forward investment cycle is hardware heavy. Servers, GPUs, networking equipment, power systems, and data center infrastructure enter the balance sheet first and the income statement later. The lag between deployment and earnings pressure defines the depreciation wall.
The issue is structural rather than cosmetic. Depreciation will compound mechanically as successive annual hardware cohorts layer into expense. The key variable is whether revenue scales fast enough to absorb that compounding effect.
3.1 Hardware Cohort Layering Through 2030
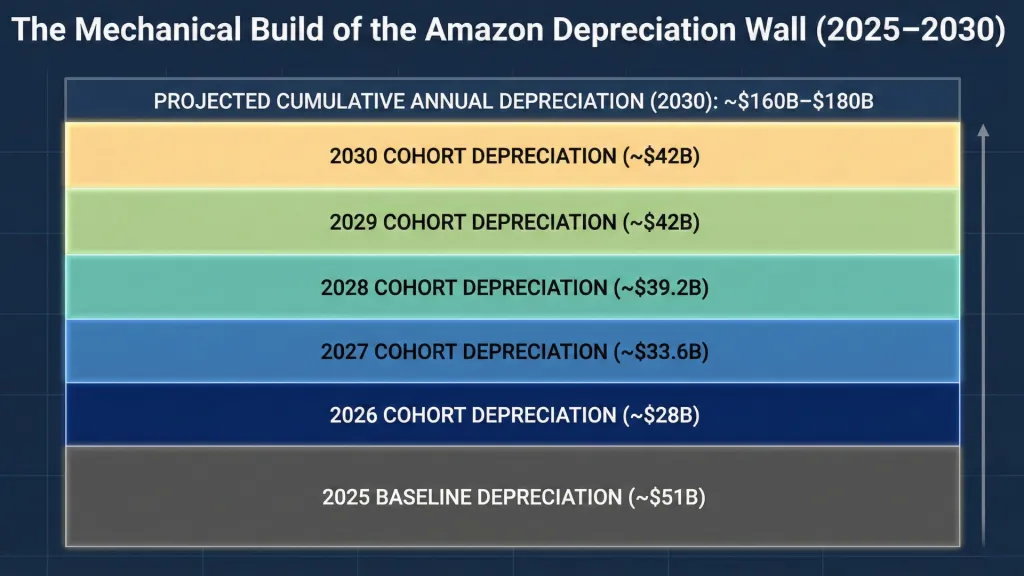
Under the assumed CapEx path, approximately 70% of annual CapEx is allocated to AWS infrastructure. Using that framework:
Year | AWS CapEx (70%) | Approx. Annual Depreciation (5-year life) |
|---|---|---|
2026 | $140B | ~$28B per year |
2027 | $168B | ~$33.6B per year |
2028 | $196B | ~$39.2B per year |
2029 | $210B | ~$42B per year |
2030 | $210B | ~$42B per year |
Each year’s deployment contributes incremental depreciation across a five-year window. These layers stack.
Layered onto a baseline of roughly $51B in 2025 depreciation and amortization, total depreciation could reach $160B–$180B annually by 2030 depending on asset mix and timing.
The layering effect behaves like adding floors to a building while previous floors continue to bear weight. No single cohort creates the wall. Accumulation creates the wall.
3.2 Why Depreciation Will Reach $160B–$180B
The math is arithmetic, not speculative.
Cumulative AWS hardware deployment between 2026 and 2030 under the modeled path approaches ~$924B. Even assuming a five-year straight-line schedule, annual expense scales proportionally as cohorts overlap.
This figure excludes:
- Retail automation equipment
- Logistics robotics
- International fulfillment buildout
- Kuiper infrastructure
Depreciation expansion is therefore not limited to AWS alone.
The income statement pressure point will likely peak around 2029–2031 depending on cadence. At that stage, Amazon could be recognizing depreciation expense more than triple the 2025 level.
The depreciation wall is visible years in advance.
3.3 GAAP Optics vs Economic Productivity
Accounting depreciation follows fixed schedules. Hardware utilization follows demand.
GAAP assumes a five-year useful life for infrastructure hardware. AI workloads evolve rapidly, yet inference economics suggest that high-performance GPUs may retain economic relevance longer than accounting frameworks imply.
Training clusters are cyclical and performance driven. Inference clusters are volume driven and monetization dense. As inference expands through enterprise deployment, older hardware can remain productive at scale even as newer chips enter the stack.
Accounting recognizes time. Economic productivity recognizes throughput.
The distinction matters when evaluating earnings compression during peak build years.
3.4 Inference Workloads and Asset Life Extension
AI infrastructure economics are shifting.
Training is capital intensive and concentrated. Inference is distributed and persistent. Once models are deployed across industries, inference demand scales with user interaction, not research cycles.
If inference becomes the dominant workload by the latter half of the decade, GPU monetization windows extend. Hardware that may appear depreciated under GAAP can remain economically valuable in inference environments.
This dynamic improves absorption capacity.
Inference behaves like toll traffic on an established highway. Once enterprise systems integrate AI layers, token generation becomes recurring throughput.
The highway’s construction cost remains fixed. Traffic density determines return.
3.5 Absorption Capacity and Utilization Risk
Depreciation becomes problematic when utilization declines.
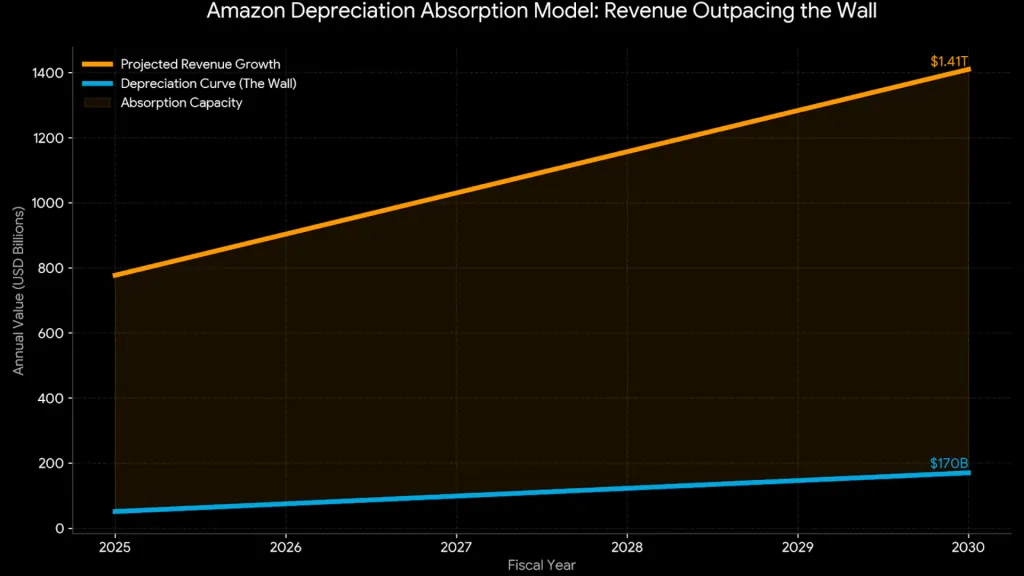
If hyperscaler demand slows materially or enterprise AI adoption plateaus, infrastructure may operate below optimal throughput. In that scenario, depreciation expense compresses margins visibly.
Conversely, high utilization rates allow operating income to expand despite elevated depreciation layers.
Key indicators to monitor:
- AWS revenue growth relative to CapEx growth
- Backlog conversion velocity
- Hyperscaler infrastructure commitments
- Enterprise AI deployment trends
- Regional power utilization rates
Depreciation is mechanical. Absorption is behavioral.
The wall exists. The question is whether traffic density rises alongside it.
4. AWS: The Primary Earnings Engine
If the capital cycle is the structure, AWS is the load-bearing column.
In 2025, AWS generated approximately $129B in revenue, representing the most profitable segment inside Amazon’s portfolio. It operates at materially higher margins than retail and carries structural switching costs that increase with workload integration.
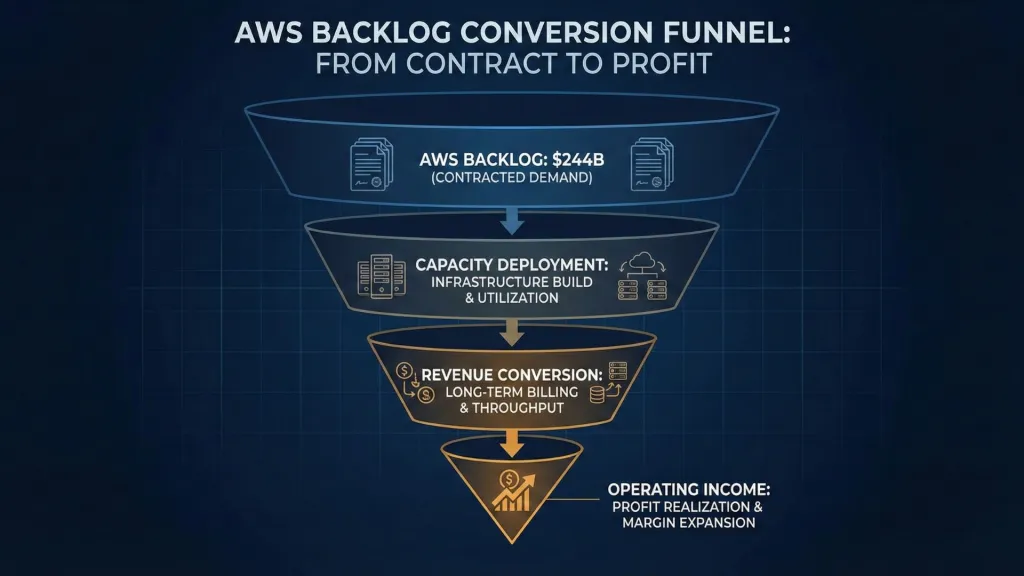
More importantly, AWS reported a $244B backlog, reflecting multi-year enterprise and hyperscaler commitments. That backlog represents contracted throughput.
The AI infrastructure expansion underway is primarily designed to service that throughput.
The depreciation wall becomes manageable only if AWS scales proportionally.
4.1 Revenue Base and $244B Backlog Dynamics
AWS revenue has grown from a sub-$20B business less than a decade ago to nearly $129B annually. Growth has moderated from peak pandemic levels, yet remains structurally durable given enterprise digitization and AI adoption.
The $244B backlog functions as forward demand visibility. It includes long-duration contracts across:
- Enterprise AI deployment
- Hyperscaler infrastructure commitments
- Government and regulated industry workloads
- Migration and modernization initiatives
Backlog conversion velocity becomes one of the most important indicators in this cycle.
A backlog that converts steadily supports high infrastructure utilization. A backlog that slows introduces absorption risk.
4.2 GPU Supply, Custom Silicon, and Throughput Expansion
AI workloads are hardware intensive.
AWS infrastructure buildout includes:
- GPU clusters for model training
- Networking expansion to support low-latency inference
- Custom silicon development to optimize performance per watt
Custom silicon initiatives reduce reliance on external GPU suppliers and improve cost structure over time. Performance per watt improvements directly influence operating margins under heavy power density environments.
AI clusters demand significantly more energy per rack than traditional cloud workloads. Power availability and cooling efficiency therefore become core competitive variables.
The expansion underway resembles building industrial-scale compute factories rather than incremental server rooms.
Throughput capacity, measured in compute density per megawatt, defines earnings potential.
4.3 Training vs Inference Mix Shift
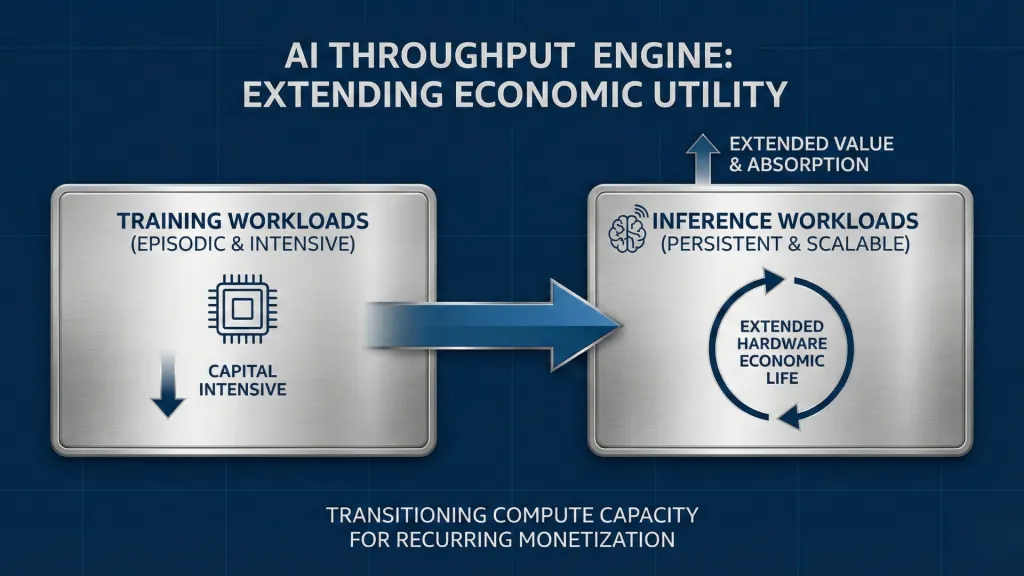
Training workloads attract headlines. Inference workloads generate recurring revenue.
Training demand is episodic and research driven. Inference demand scales with user interaction, application embedding, and enterprise integration.
As enterprise AI becomes embedded across healthcare diagnostics, financial modeling, logistics routing, cybersecurity monitoring, and generative applications, inference volume expands structurally.
Inference workloads typically:
- Require persistent uptime
- Scale with user adoption
- Favor optimized cost structures
- Benefit from hardware utilization stability
If inference becomes the dominant mix driver through the latter half of the decade, AWS revenue stability improves materially.
Inference density behaves like recurring toll revenue. Training behaves like periodic construction surges.
The shift toward inference strengthens the absorption case.
4.4 Margin Structure Under Scale
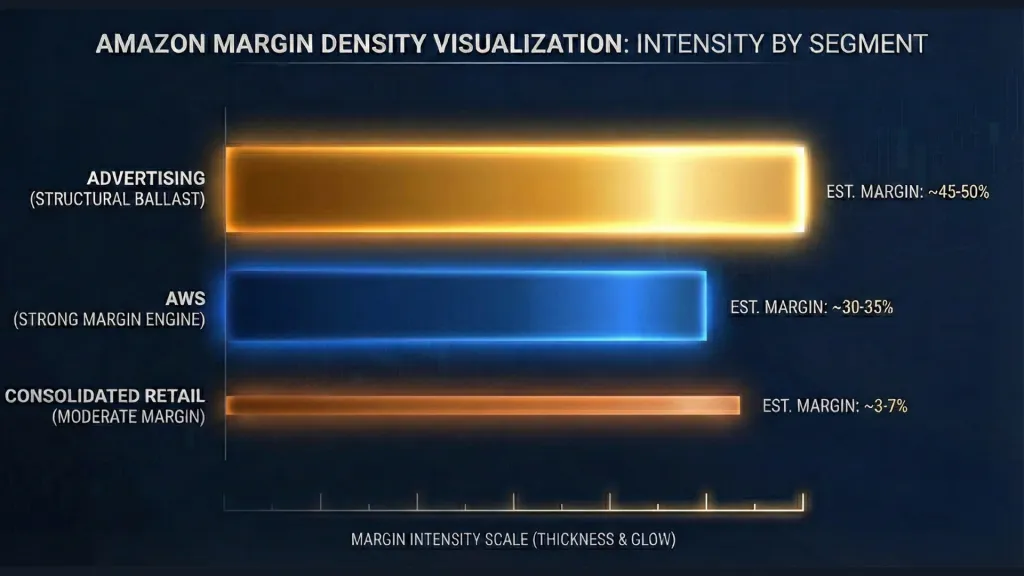
AWS historically operated with operating margins in the low-to-mid 30% range. AI infrastructure expansion introduces both pressure and opportunity.
Pressure factors:
- Elevated depreciation layers
- Power and cooling costs
- Hardware refresh cycles
Opportunity factors:
- Custom silicon improving cost efficiency
- Higher-margin AI workloads
- Long-duration enterprise contracts
- Operating leverage at scale
If infrastructure utilization remains high, margin expansion is achievable even in a high depreciation regime.
Margins in infrastructure businesses depend on density. When fixed cost per unit declines relative to throughput, incremental revenue contributes disproportionately to operating income.
The margin profile therefore hinges on utilization rates, not headline CapEx figures.
4.5 What Breaks the AWS Assumption
The AWS engine must function efficiently for the broader capital cycle thesis to hold.
Key break conditions include:
- Enterprise AI adoption slows materially
- Hyperscalers reduce infrastructure commitments
- Utilization rates decline below breakeven thresholds
- Competitive pricing compression accelerates
- Regulatory intervention limits data monetization
AWS operates within a supply-constrained compute environment today. If that constraint loosens unexpectedly, pricing power and density assumptions weaken.
The capital cycle thesis assumes continued AI infrastructure demand and stable utilization across expanded clusters.
If demand remains durable, AWS functions as the primary absorption engine for the depreciation wall.
If demand fractures, the capital structure becomes heavy quickly.
5. Advertising: The Structural Margin Ballast
Amazon’s advertising business has evolved into one of the highest-quality earnings streams inside the company.
In 2025, advertising revenue approximated ~$60B, operating at estimated margins in the 45–50% range, materially above retail and competitive with scaled digital platforms. Unlike AWS, advertising requires limited incremental capital intensity relative to revenue.
Within a heavy infrastructure build cycle, advertising acts as margin ballast.
While AWS absorbs capital, advertising compounds yield.
5.1 Why Ads Is a Different Business Model
Advertising is asset light relative to infrastructure.
The business leverages:
- First-party transaction data
- High-intent shopping traffic
- Prime ecosystem engagement
- Embedded sponsored placements
Unlike social platforms monetizing attention, Amazon monetizes purchase intent. Ad placement occurs at the moment of conversion rather than at the top of the funnel.
This intent density supports pricing durability.
Revenue scales primarily through:
- Increased ad load
- Higher cost-per-click
- Sponsored product adoption
- International expansion
Incremental revenue requires minimal incremental CapEx relative to AWS.
In capital cycle terms, advertising functions as the internal stabilizer.
5.2 AI Yield Optimization and Monetization Density
AI integration enhances advertising economics through yield optimization.
Machine learning models improve:
- Bid pricing efficiency
- Placement optimization
- Conversion prediction
- Cross-sell targeting
As AI personalization improves, monetization density per transaction increases. Small improvements in conversion rates at Amazon’s transaction scale translate into meaningful revenue expansion.
Advertising revenue is directly correlated with gross merchandise volume and engagement intensity. As logistics optimization improves retail velocity, ad impressions increase proportionally.
The advertising engine therefore benefits indirectly from retail automation investments.
Yield behaves like compression inside an engine cylinder. The same traffic volume generates higher revenue density with improved optimization.
5.3 International Expansion Runway
Advertising penetration internationally remains below North America.
International retail generated approximately ~$162B in revenue in 2025, yet advertising monetization per transaction remains structurally lower than domestic levels.
As international marketplaces mature and merchant adoption increases, advertising revenue per order can converge upward.
Key expansion drivers:
- Sponsored product adoption in emerging markets
- Cross-border merchant integrations
- Prime membership growth internationally
- Localized ad inventory expansion
Advertising monetization scales with ecosystem maturity. International catch-up provides incremental margin leverage without significant capital investment.
5.4 Margin Durability and Competitive Moat
Advertising margins remain structurally high due to:
- First-party data advantages
- Integrated marketplace placement
- Embedded merchant ecosystem
- Prime membership density
Unlike third-party ad networks, Amazon controls the purchase environment end-to-end.
This integration reduces dependency on external platforms and provides stronger attribution accuracy for advertisers.
High-margin revenue streams inside capital-intensive businesses create operating stability.
Advertising functions as the financial counterweight to depreciation layering.
5.5 Downside Sensitivities
Advertising is cyclical to macro conditions.
Consumer demand contraction reduces gross merchandise volume, which reduces ad inventory velocity. Merchant budgets can compress during economic slowdowns.
Regulatory scrutiny around digital advertising and data usage remains a variable across jurisdictions.
Competitive pressures from retail media networks and large digital platforms could influence pricing dynamics.
However, Amazon’s structural integration between commerce and advertising provides insulation relative to purely attention-based platforms.
Within the broader capital cycle thesis, advertising’s role is clear:
It enhances operating income resilience during peak infrastructure investment.
If AWS carries capital intensity, advertising supports margin stability.
6. North America Retail: Mature but Improving
North America retail remains Amazon’s largest revenue segment.
In 2025, North America generated approximately $426B in revenue at an operating margin near 6.9%. This segment historically operated with thin margins due to logistics intensity, fulfillment expansion, and fixed-cost infrastructure.
Over the past several years, however, margin discipline has improved materially. Fulfillment network optimization, regionalization, and robotics deployment have structurally enhanced cost efficiency.
Retail no longer serves solely as a growth engine. It now functions as a stabilized cash generator embedded within the broader capital structure.
6.1 Embedded Subscription Economics
Prime membership underpins North America retail economics.
Prime creates:
- Recurring subscription revenue
- Increased purchase frequency
- Higher basket size
- Loyalty reinforcement
Subscription economics improve predictability within retail revenue streams. Prime members typically exhibit higher order density and lower churn.
Retail economics therefore extend beyond merchandise margin alone. Embedded subscription revenue enhances contribution margin stability and improves fixed-cost absorption across fulfillment infrastructure.
Subscription density functions as the connective tissue between retail, advertising, and AWS cross-sell opportunities.
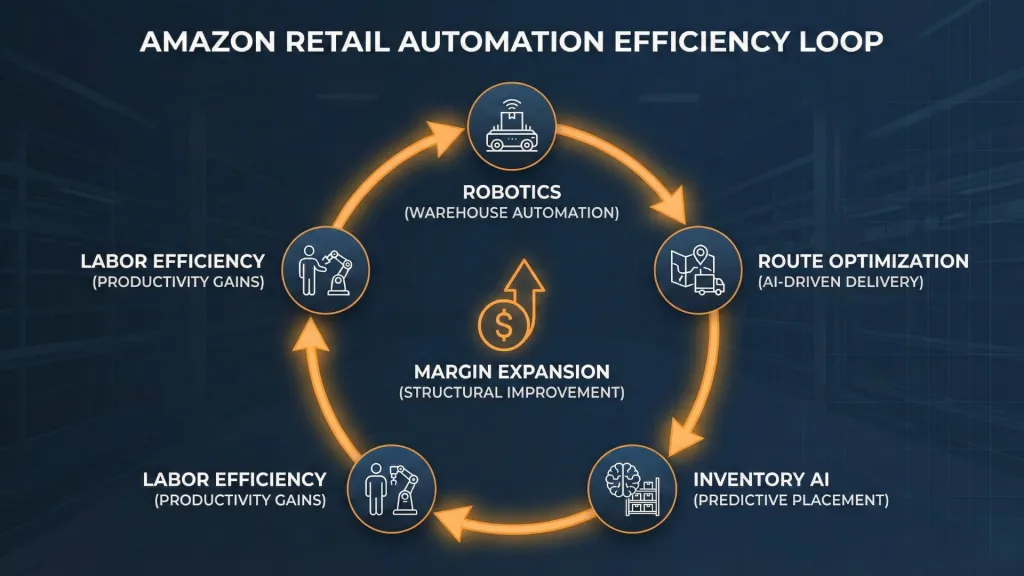
6.2 Robotics and AI Logistics Optimization
Amazon has steadily increased robotics deployment across fulfillment centers.
Automation improves:
- Pick-and-pack efficiency
- Inventory placement optimization
- Warehouse throughput density
- Labor cost per unit
AI routing enhances:
- Last-mile delivery efficiency
- Package density per route
- Delivery time compression
- Fuel cost optimization
Logistics operates as a network business. Efficiency improvements compound as scale increases. Small gains per order translate into meaningful margin improvement at hundreds of billions in annual revenue.
The fulfillment network increasingly resembles a distributed manufacturing grid rather than a traditional warehouse system.
Automation improves structural margin floors even during macro slowdowns.
6.3 Margin Expansion Framework
North America retail margins near 6.9% in 2025 reflect material improvement from prior years.
Margin expansion drivers through 2030 include:
- Increased automation penetration
- Higher Prime adoption density
- Greater advertising monetization per transaction
- Mix shift toward higher-margin third-party marketplace sales
- Regionalization reducing shipping distance
Third-party marketplace services typically carry higher margin characteristics than first-party retail inventory. As third-party seller penetration increases, operating margin benefits proportionally.
Retail margin expansion does not require aggressive top-line acceleration. It requires cost density improvement and mix optimization.
Improved throughput per fulfillment node enhances contribution margin even if revenue growth moderates to mid-single digits.
6.4 Sensitivity to Consumer Weakness
Retail remains cyclical to consumer demand.
Macroeconomic contraction reduces discretionary spending. Promotional activity may compress gross margins temporarily.
However, Amazon’s scale provides relative insulation. Price leadership and logistical reliability often attract volume during weaker economic periods.
Cost structure improvements achieved through automation reduce downside sensitivity compared to earlier expansion phases.
Retail functions less as a volatility driver and more as a stabilizing revenue base inside the broader capital cycle framework.
While AWS carries the infrastructure expansion, North America retail provides durable revenue mass and incremental margin improvement potential.
7. International Retail: Controlled Expansion
International retail operates at a different stage of maturity than North America.
In 2025, International retail generated approximately $162B in revenue with operating margins near 2.9%. Structural headwinds include currency volatility, regional regulatory frameworks, logistics fragmentation, and varying Prime penetration rates.
Unlike North America, international markets still reflect active scale optimization rather than full maturity.
The role of International retail within the capital cycle thesis is incremental rather than primary. It provides optional margin improvement and diversified revenue exposure without driving core absorption dynamics.
7.1 Revenue Composition and Regional Drivers
International retail revenue spans:
- Europe
- Japan
- India
- Emerging markets across Latin America and Asia
Revenue composition differs meaningfully across geographies:
- Developed markets exhibit higher Prime penetration and stronger third-party marketplace density.
- Emerging markets demonstrate faster GMV growth but lower monetization density per order.
Currency effects can materially impact reported revenue growth. Constant-currency performance provides a clearer signal of operational trajectory.
International performance must therefore be analyzed through volume growth, Prime adoption, and third-party seller penetration rather than headline FX-driven figures.
7.2 Emerging Market Scaling Logic
Emerging markets offer higher growth potential yet require disciplined capital allocation.
Logistics density remains lower than in North America. Infrastructure buildout must be selective to avoid margin drag.
Amazon’s strategy appears measured:
- Expand fulfillment where Prime density supports throughput.
- Encourage third-party marketplace adoption to improve capital efficiency.
- Leverage global procurement and logistics optimization to reduce cost per unit.
Marketplace-driven models reduce working capital intensity relative to first-party retail inventory.
International expansion resembles planting seeds in high-growth soil while preserving capital discipline. Not every geography warrants equal investment intensity.
7.3 Margin Catch-Up Path
Operating margins near 2.9% in 2025 indicate structural under-optimization relative to North America.
Margin expansion drivers include:
- Increased third-party seller penetration
- Advertising monetization expansion
- Prime membership scaling
- Regional logistics automation
- Improved cross-border inventory optimization
Margin convergence toward mid-single digits would materially enhance consolidated operating leverage, even without aggressive revenue acceleration.
International margin improvement does not need to match North America levels to contribute meaningfully. Incremental improvement across $160B+ in revenue carries scale.
The pathway resembles slow tightening rather than rapid expansion.
7.4 Currency and Regulatory Risk
International operations introduce variability absent in domestic markets.
Primary sensitivities include:
- Currency translation volatility
- Local digital taxation regimes
- Competition from regional e-commerce incumbents
- Regulatory constraints on marketplace data usage
These variables influence reported performance but do not fundamentally alter the capital cycle framework.
International retail functions as diversified revenue exposure with optional margin expansion. It does not anchor the AI infrastructure thesis, yet it enhances consolidated resilience.
Within the broader structure:
- AWS absorbs capital.
- Advertising stabilizes margins.
- North America retail matures.
- International retail tightens incrementally.
The next section examines Project Leo, which represents strategic optionality layered on top of the core framework.
8. Project Leo (Kuiper): Strategic Optionality
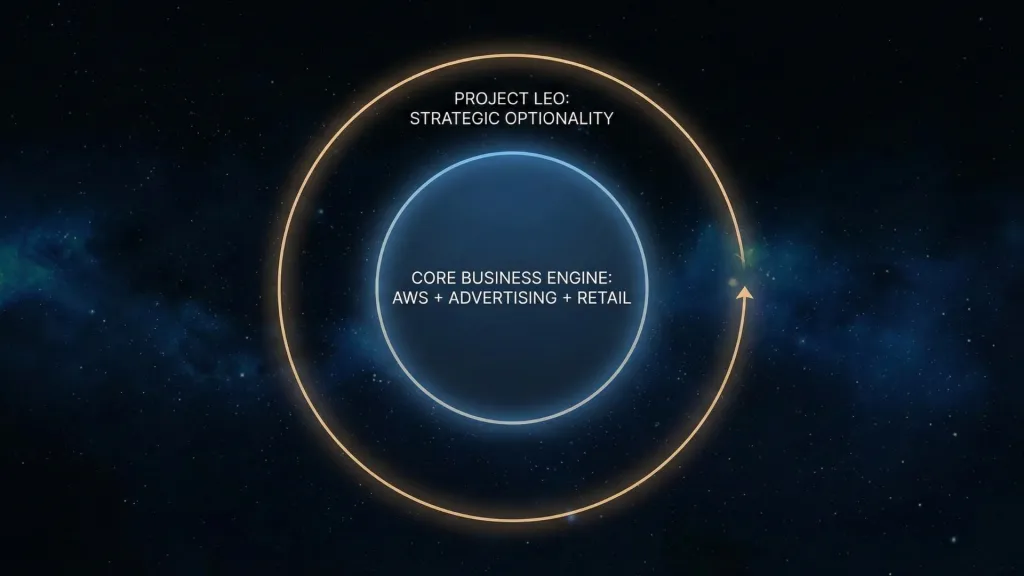
Project Leo, Amazon’s satellite broadband initiative, represents the smallest contributor to the 2030 operating framework and the widest distribution of potential outcomes.
Unlike AWS or retail, Leo does not anchor the capital cycle thesis. It sits adjacent to it.
The initiative requires substantial upfront capital for satellite deployment, ground infrastructure, and launch cadence. Revenue contribution through 2030 is expected to remain modest relative to Amazon’s consolidated scale.
Leo therefore functions as strategic optionality rather than a core pillar of the thesis.
8.1 Capital Requirements and Deployment Timeline
Low Earth Orbit satellite constellations require:
- Satellite manufacturing at scale
- Launch vehicle procurement
- Ground station buildout
- Spectrum coordination and regulatory clearance
Capital deployment for satellite networks is front-loaded. Infrastructure must be placed in orbit before meaningful recurring revenue materializes.
Compared to AWS infrastructure, Leo introduces additional complexity:
- Launch cadence risk
- Orbital debris and regulatory oversight
- International licensing requirements
Deployment timelines influence revenue ramp velocity. Delays primarily affect timing rather than long term success.
Within the broader capital framework, Leo represents incremental capital allocation layered on top of already elevated AWS infrastructure investment.
8.2 Revenue Potential Under Different Adoption Curves
Satellite broadband markets typically target:
- Rural and underserved regions
- Maritime and aviation connectivity
- Enterprise redundancy solutions
- Government and defense contracts
Revenue scale through 2030 is expected to remain limited relative to AWS and retail. Even mid-single digit billions in annual revenue would represent a small fraction of consolidated performance.
Adoption curves depend on:
- Terminal hardware cost
- Latency performance
- Pricing competitiveness
- Service reliability
Leo’s strategic advantage lies in integration potential across Amazon’s ecosystem, including AWS edge compute and global logistics coordination.
However, the core capital cycle thesis does not require aggressive Leo monetization to function.
8.3 Depreciation Drag vs Strategic Value
Satellite networks carry depreciation and amortization schedules distinct from terrestrial data centers.
Depreciation impact through 2030 is expected to remain manageable relative to AWS layering. Even several billion dollars in annual depreciation would represent a small proportion of consolidated depreciation expansion projected under the infrastructure buildout.
Strategic value extends beyond direct revenue:
- Edge connectivity for AWS workloads
- Resilience in global network coverage
- Enhanced enterprise cloud integration
Leo behaves like a call option embedded within the broader Amazon platform.
Optionality is valuable when underlying capital structure remains strong.
8.4 Why Leo Is Not Required for the Base Case
The 2030 framework relies primarily on:
- AWS absorption capacity
- Advertising margin stability
- Retail efficiency improvements
Leo enhances upside variability but does not underpin the structural model.
If Leo scales successfully, incremental operating income contributes positively. If adoption lags or deployment extends, consolidated performance remains anchored to AWS and retail dynamics.
Optionality layered onto scale creates asymmetric upside without being structurally required for absorption.
Within the capital cycle architecture, Leo is the satellite orbiting a much larger engine.
9. Consolidated AMZN 2030 Operating Framework
The prior sections evaluated each segment in isolation.
This section reassembles the pieces to assess structural balance.
The capital cycle thesis depends on whether consolidated operating income can expand meaningfully while annual depreciation approaches the $160B–$180B range by the end of the decade.
The answer does not depend on a single segment. It depends on composition, density, and operating leverage across the stack.
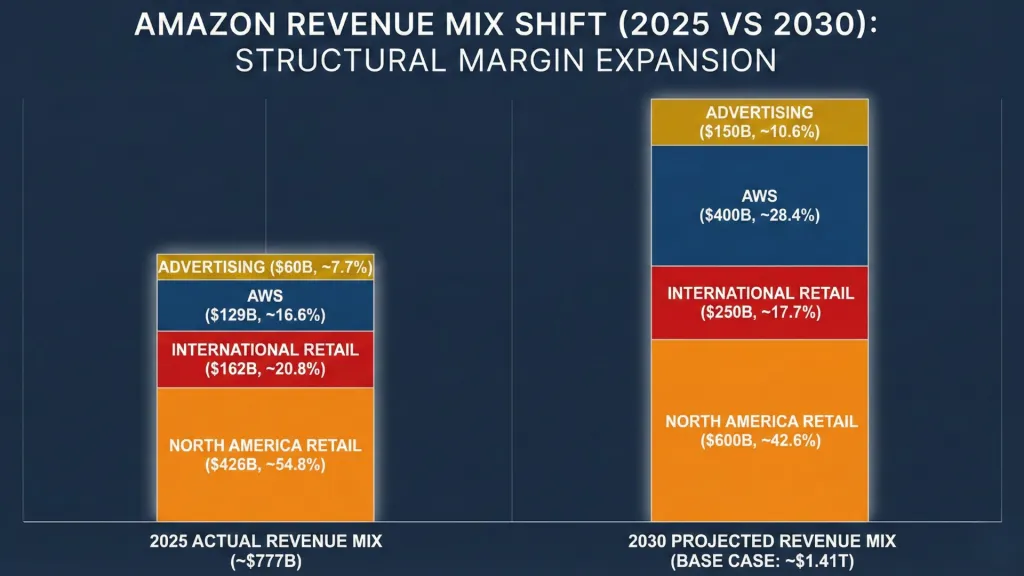
9.1 Segment-Level Revenue Composition
By 2025, Amazon’s revenue mix reflects diversification across infrastructure, commerce, and advertising:
Segment | Approx. 2025 Revenue |
|---|---|
AWS | ~$129B |
Advertising | ~$60B |
North America Retail | ~$426B |
International Retail | ~$162B |
Retail remains the largest top-line contributor. AWS drives margin expansion. Advertising enhances earnings density.
Through 2030, composition matters more than scale alone.
If AWS and Advertising expand as a percentage of consolidated revenue, blended operating margins improve structurally. Retail revenue may remain dominant in absolute dollars while margin contribution shifts toward higher-density segments.
Revenue composition determines absorption capacity.
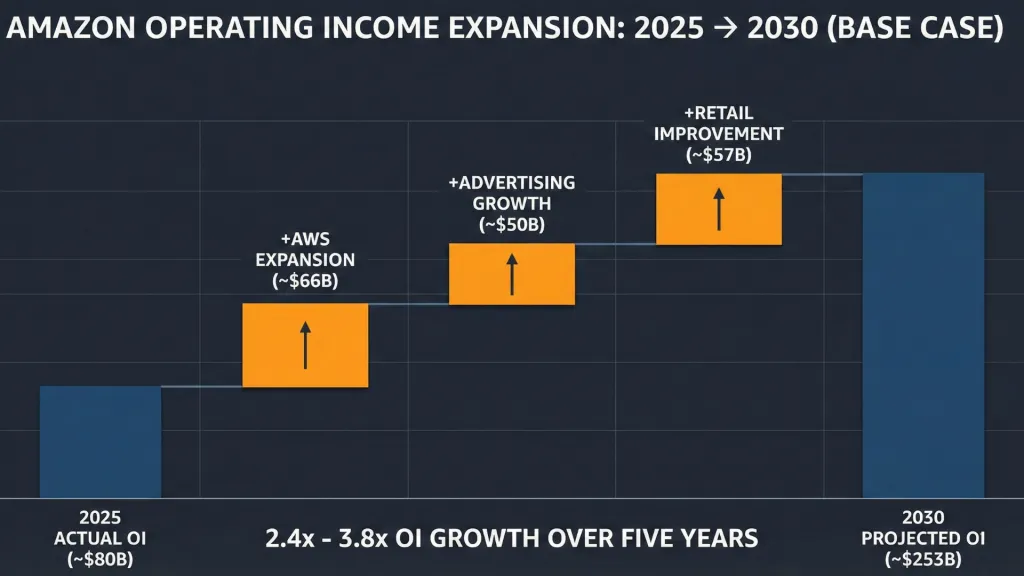
9.2 Operating Income Expansion Under Heavy Depreciation
Depreciation will likely triple from 2025 levels under the assumed CapEx path.
The relevant evaluation is whether operating income expands at a comparable or greater pace.
Operating leverage drivers include:
- AWS scale and utilization density
- Advertising monetization per transaction
- Third-party marketplace mix shift
- Retail automation cost compression
- International margin tightening
If these forces operate concurrently, consolidated operating income can expand even as depreciation layers accumulate.
Infrastructure businesses transition from build to yield when throughput exceeds incremental cost layering.
The yield phase becomes visible when CapEx growth moderates and revenue continues compounding.
9.3 Corporate Overhead and Structural Expenses
Corporate overhead functions as a structural deduction across segments.
Key components include:
- Stock-based compensation
- Corporate administration
- Research and development
- Legal and regulatory compliance
- Shared infrastructure expenses
As Amazon scales, overhead as a percentage of revenue can compress provided expense discipline persists.
Scale economies apply not only to fulfillment and data centers but also to corporate layers.
Structural expense control enhances operating income translation from segment growth.
9.4 Sensitivity to CapEx Timing and Revenue Mix
The capital cycle is sensitive to timing.
Two variables matter:
- CapEx growth rate deceleration
- Revenue mix shift toward higher-margin segments
If CapEx continues accelerating beyond 2030 without throughput stabilization, depreciation layering may outpace operating expansion.
If CapEx growth slows into 2029–2030 while AWS and Advertising maintain momentum, operating leverage becomes visible.
Revenue mix also influences resilience:
- Higher AWS contribution increases margin density.
- Higher Advertising contribution enhances operating stability.
- Retail mix shifts toward third-party marketplace services improve capital efficiency.
The consolidated framework is therefore dynamic rather than static.
It depends on balance.
If infrastructure investment transitions into high-utilization throughput, depreciation becomes absorbable.
If throughput stalls, capital intensity dominates the income statement.
10. Risk Matrix and Failure Conditions
Every capital cycle thesis must define its break points.
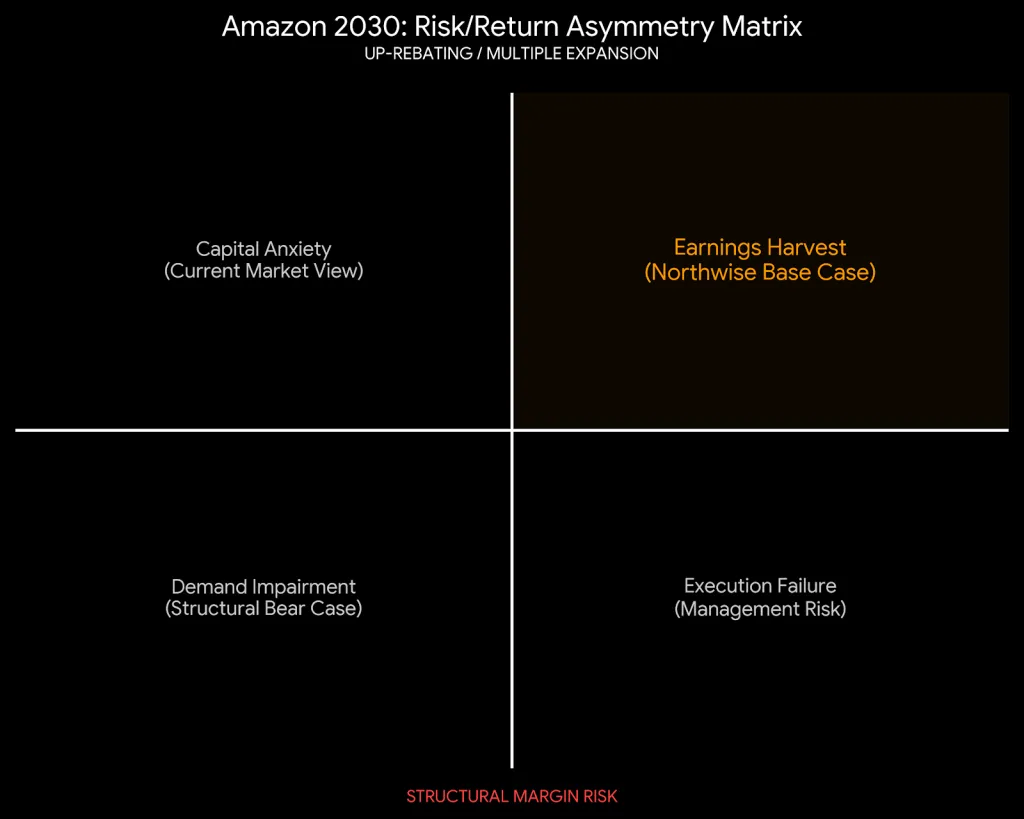
Amazon’s forward investment profile introduces scale-driven upside and scale-driven risk. Elevated CapEx amplifies outcomes in both directions. Infrastructure intensity rewards utilization and penalizes idle capacity.
The following matrix outlines the primary structural risks that would impair the 2030 framework.
10.1 AI Enterprise Demand Slows
The thesis assumes that enterprise AI adoption continues compounding through the decade.
A material slowdown in:
- Generative AI deployment
- Enterprise workflow integration
- Model inference expansion
- Cloud migration velocity
would directly impact AWS utilization rates.
High fixed-cost infrastructure requires traffic density. Slower enterprise adoption reduces throughput per unit of deployed hardware.
Signals to monitor include:
- Deceleration in AWS backlog growth
- Declining enterprise AI spend trends
- Reduced hyperscaler capital commitments
Demand fragility transforms depreciation from manageable layering into visible margin compression.
10.2 Hyperscaler Utilization Compression
The supply-constrained environment supporting elevated pricing and infrastructure deployment may normalize faster than expected.
If:
- GPU supply expands aggressively
- Competitive pricing pressure intensifies
- Cloud pricing per compute unit declines materially
then revenue per deployed asset could compress.
High utilization is essential when depreciation layers are rising.
Utilization compression does not require revenue contraction. Even a decline in density relative to capital deployed can pressure margins.
Throughput per megawatt becomes the key metric.
10.3 CapEx Persists Without Revenue Absorption
The most direct structural risk is capital discipline failure.
If CapEx growth remains elevated while:
- Revenue growth decelerates
- Backlog conversion slows
- AI adoption plateaus
then the depreciation wall expands without proportional operating expansion.
Infrastructure cycles must eventually transition from build to yield.
The absence of CapEx moderation into the latter half of the decade would extend the heavy investment phase and delay rerating potential.
10.4 AWS Share Loss
AWS operates in a competitive environment alongside other hyperscalers.
Meaningful share erosion could arise from:
- Pricing compression
- Enterprise multi-cloud diversification
- Technological differentiation gaps
- Regulatory fragmentation limiting data portability
Backlog retention and enterprise stickiness mitigate near-term share shifts. However, infrastructure cycles magnify competitive positioning errors.
Market share stability is necessary for absorption capacity.
10.5 Regulatory Fragmentation
Regulatory risk spans multiple domains:
- Data privacy constraints
- Digital advertising oversight
- Antitrust scrutiny
- Cross-border data transfer restrictions
Advertising economics depend on first-party data utilization. AWS enterprise workloads depend on global interoperability.
Fragmentation across jurisdictions increases compliance costs and may constrain monetization density.
Regulatory pressure introduces structural cost layers that compound alongside depreciation.
10.6 Energy and Power Constraints
AI clusters are power dense.
Data centers supporting large-scale GPU deployments require:
- High megawatt availability
- Reliable grid access
- Efficient cooling systems
Regional grid limitations or energy price volatility can materially influence operating margins.
Power behaves as both input cost and gating factor for deployment velocity.
If energy availability constrains cluster scaling, throughput expansion could slow even if demand remains intact.
11. Full Amazon Stock Forecast 2030 Financial Model
This section translates the segment assumptions outlined earlier into consolidated 2030 financial outputs.
All numbers below are derived directly from the fixed framework established at the beginning of this report.
Northwise Premium
Choose how to continue with Northwise
Join Northwise Premium
Unlock the rest of this report, its complete valuation, the downloadable model, portfolios, and action framework.
Join Northwise PremiumCreate a Free Account
Continue across Free Northwise research, follow companies, save reports, and receive updates.
Create a Free Account
AMZN Stock Forecast 2030: The $1.6 Trillion Test
Our AMZN stock forecast models AWS, advertising, Leo and Zoox through 2030, including Amazon’s $1.6 trillion capital program, financing and valuation.

Amazon Zoox
Amazon Zoox: current rider access, federal commercial-deployment permission, vehicle production and the economic test for autonomous passenger service.

Amazon Leo
Amazon Leo: current satellite deployment, conditional FCC relief, the proposed direct-to-device network and the economics of commercial rollout.
Northwise Portfolios
See how the research becomes real decisions
Reader discussion
Discuss the research
Premium access is required to join this report's discussion.
Join Northwise Premium
No comments yet. Start a thoughtful discussion.