AMZN Stock Forecast 2030: The $1.6 Trillion Test

Our AMZN stock forecast models AWS, advertising, Leo and Zoox through 2030, including Amazon’s $1.6 trillion capital program, financing and valuation.
In this article
AWS is accelerating, advertising is becoming a much larger profit source, and Leo and Zoox are moving toward commercial scale. Our forecast follows what Amazon must build, sell and finance without assuming the spending suddenly stops.
Forecasts are Northwise estimates. Financial tables are in U.S. dollars, billions, except per-share figures and where otherwise indicated.
On Amazon’s July earnings call, Andy Jassy offered investors a reassuring sentence: “If the demand isn’t there, we won’t spend the capital.” (July earnings call transcript).
He was talking about servers and networking equipment, which Amazon generally purchases close to the date it expects to put them to work. The buildings that house them require a different commitment. Cash starts leaving roughly two years before customers can generate revenue inside them, and the structures are intended to support several generations of equipment. Amazon can adjust one part of the spending program more quickly than the other.
That is a more useful starting point for understanding this company than deciding whether a large capital-expenditure number is inherently good or bad.
The latest financial statements give both sides of the debate something substantial to point at. Over the twelve months through June, Amazon generated $161.4 billion of operating cash flow, up 33%. It also spent $169.0 billion on property and equipment after sales and incentives, leaving free cash flow negative $7.6 billion. The business was generating more cash, and the investment program was consuming all of it. (Amazon Q2 results).
The bearish interpretation is straightforward: Amazon is replacing a highly profitable cloud business with something more capital-intensive, more dependent on a handful of demanding customers, and more exposed to equipment prices and financing conditions. The bullish response is that spending ahead of contracted demand is precisely how Amazon establishes the next, much larger source of earnings.
We are closer to the second view, but only after accounting for the first.
Our central forecast includes approximately $1.60 trillion of cash capital expenditure between 2026 and 2030. By the final year, Amazon is still spending about $401 billion annually. We nevertheless model $1.64 trillion of revenue, $334 billion of normalized operating income and $89 billion of free cash flow in 2030. The cash-flow improvement comes from a larger operating business, not an assumption that management abruptly stops investing.
AWS carries most of that expansion. Advertising contributes a growing share of profit without requiring the same physical investment. Commerce supplies customers, transaction activity and delivery infrastructure that remain valuable in their own right. Leo and Zoox introduce new markets, but also new expenses, regulatory requirements and opportunities to disappoint.
We do not need every initiative to become another AWS. We do need the revenue forecasts to respect the assets required to produce them, and the funding plan to survive the years before those assets earn their keep.
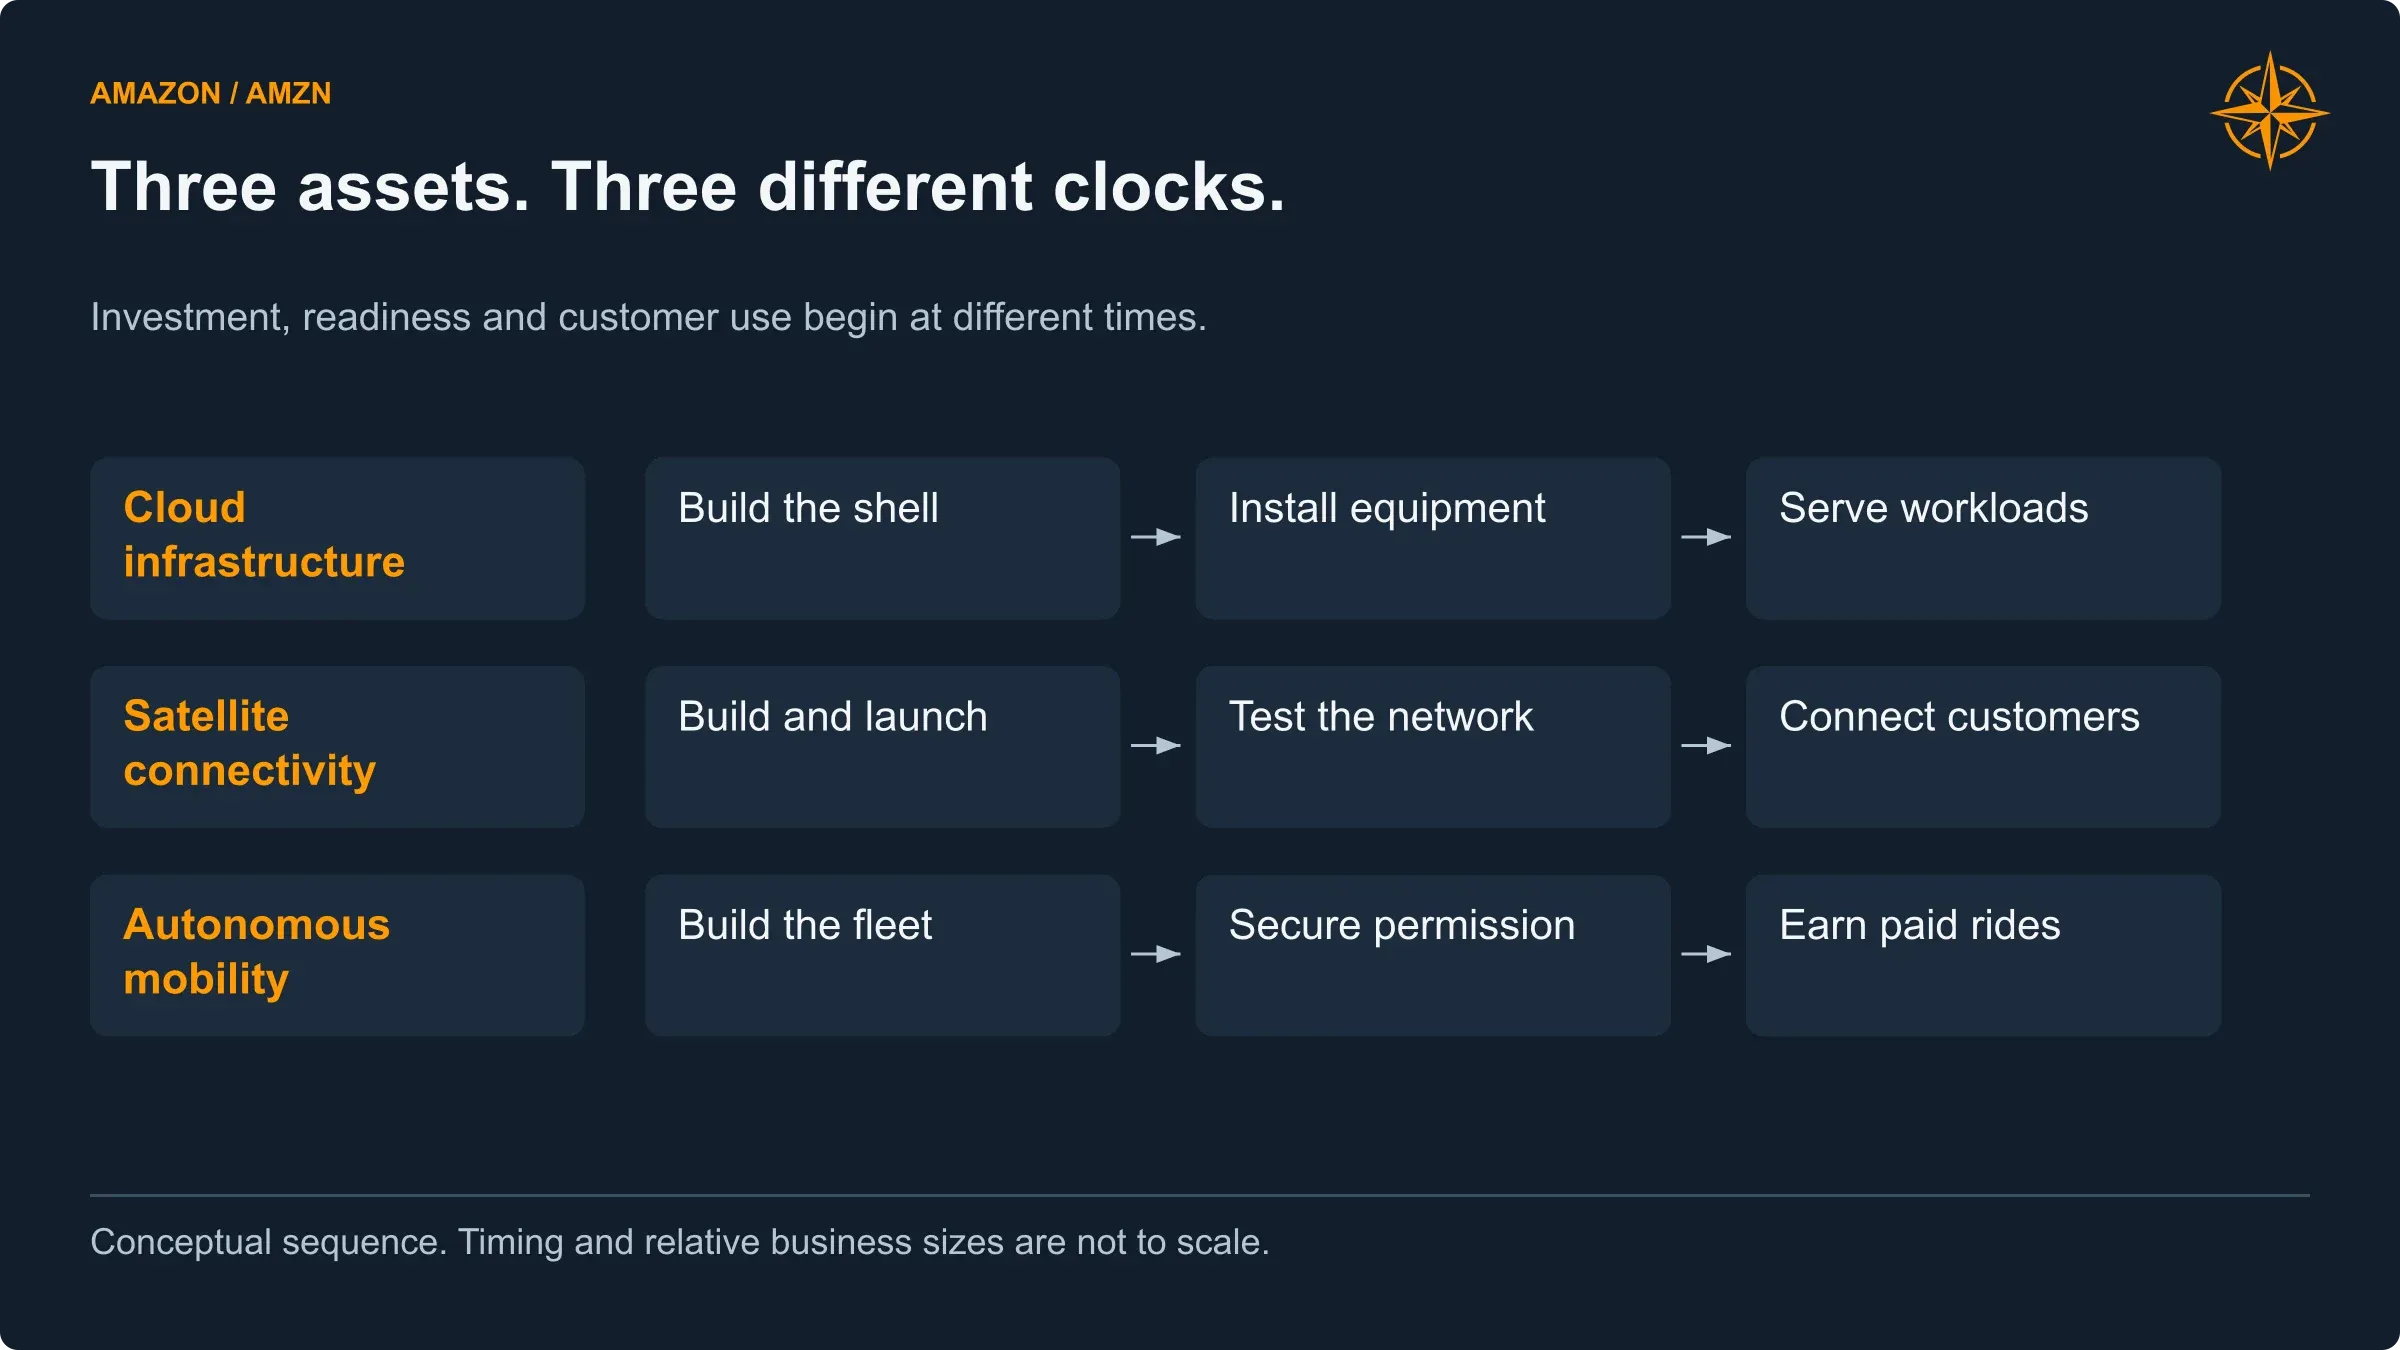
Amazon must fund infrastructure before it is ready to earn revenue. Cloud, satellite and vehicle assets have different routes to commercial use.
One company, several ways to get paid
A familiar Amazon purchase can generate several different kinds of revenue.
Amazon may own the item and record the product sale. A third-party merchant may own it, with Amazon earning commissions and fulfillment fees instead. That merchant might also buy advertising. The customer may be a Prime subscriber, while the delivery itself uses a network that increasingly serves businesses outside Amazon’s store.
Those activities are connected, but their accounting is not interchangeable. A merchant’s entire sale is not Amazon’s seller-services revenue. Subscription services include more than Prime membership fees. Advertising is already included in Amazon’s North America and International reporting segments.
The reported numbers reconcile cleanly. In 2025, North America generated $426.3 billion of revenue, International generated $161.9 billion, and AWS generated $128.7 billion. Together, they produced $716.9 billion. Advertising’s $68.6 billion was another view of that same revenue, not an additional business to stack on top. (Amazon supplemental financial tables).
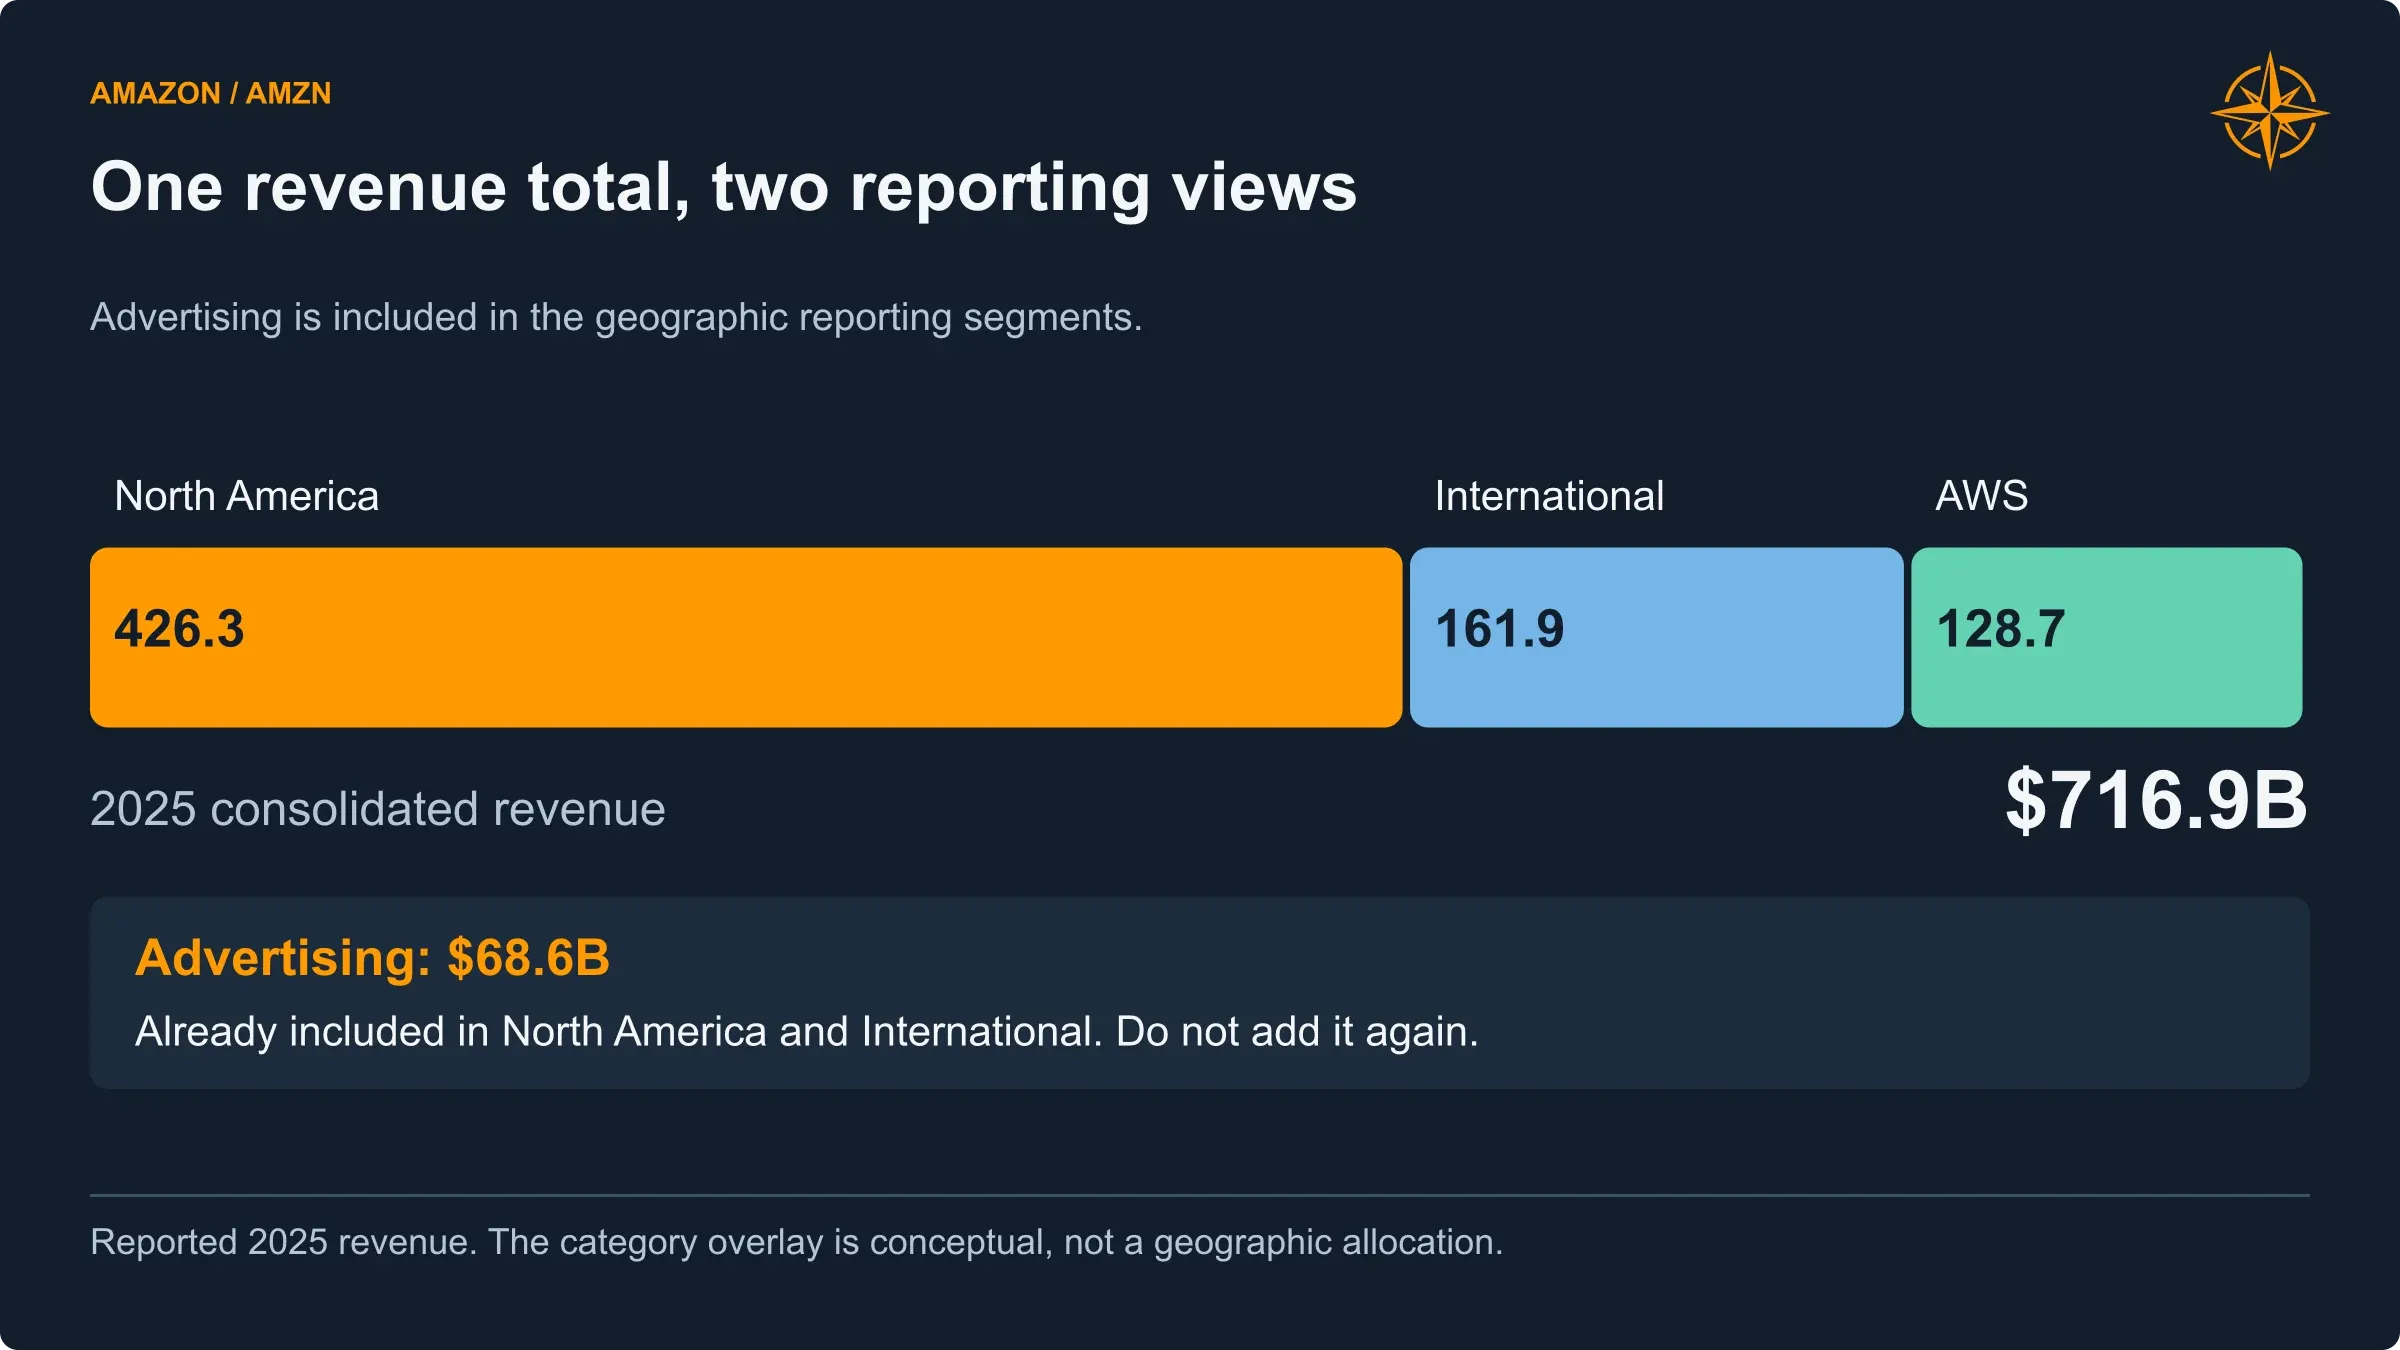
North America, International and AWS sum to $716.9 billion in 2025 revenue. Advertising is already included in that total.
For our operating forecast, we separate the company into mutually exclusive product and service categories. This allows us to examine advertising’s economics, distinguish cloud workloads, and build dedicated schedules for Leo and Zoox while preserving one consolidated total.
It also stops the retail business from disappearing behind the cloud discussion. Amazon’s stores are not simply a cash register attached to a data center. Their customers and transaction activity help create the advertising opportunity, support subscriptions, and improve the usefulness of the delivery network.
AWS, however, is where the financial outlook has changed most dramatically.
AWS is selling more than access to an accelerator
AWS generated $42.2 billion of revenue in the second quarter, up 36.7% from a year earlier. Revenue increased by approximately $4.6 billion from the first quarter alone. Management described its fifth consecutive quarterly growth acceleration and its fastest growth in eighteen quarters, when the business was less than half its present size.
That acceleration deserves more than a modest adjustment to an old growth curve. It also needs an explanation beyond “AI demand is strong.”
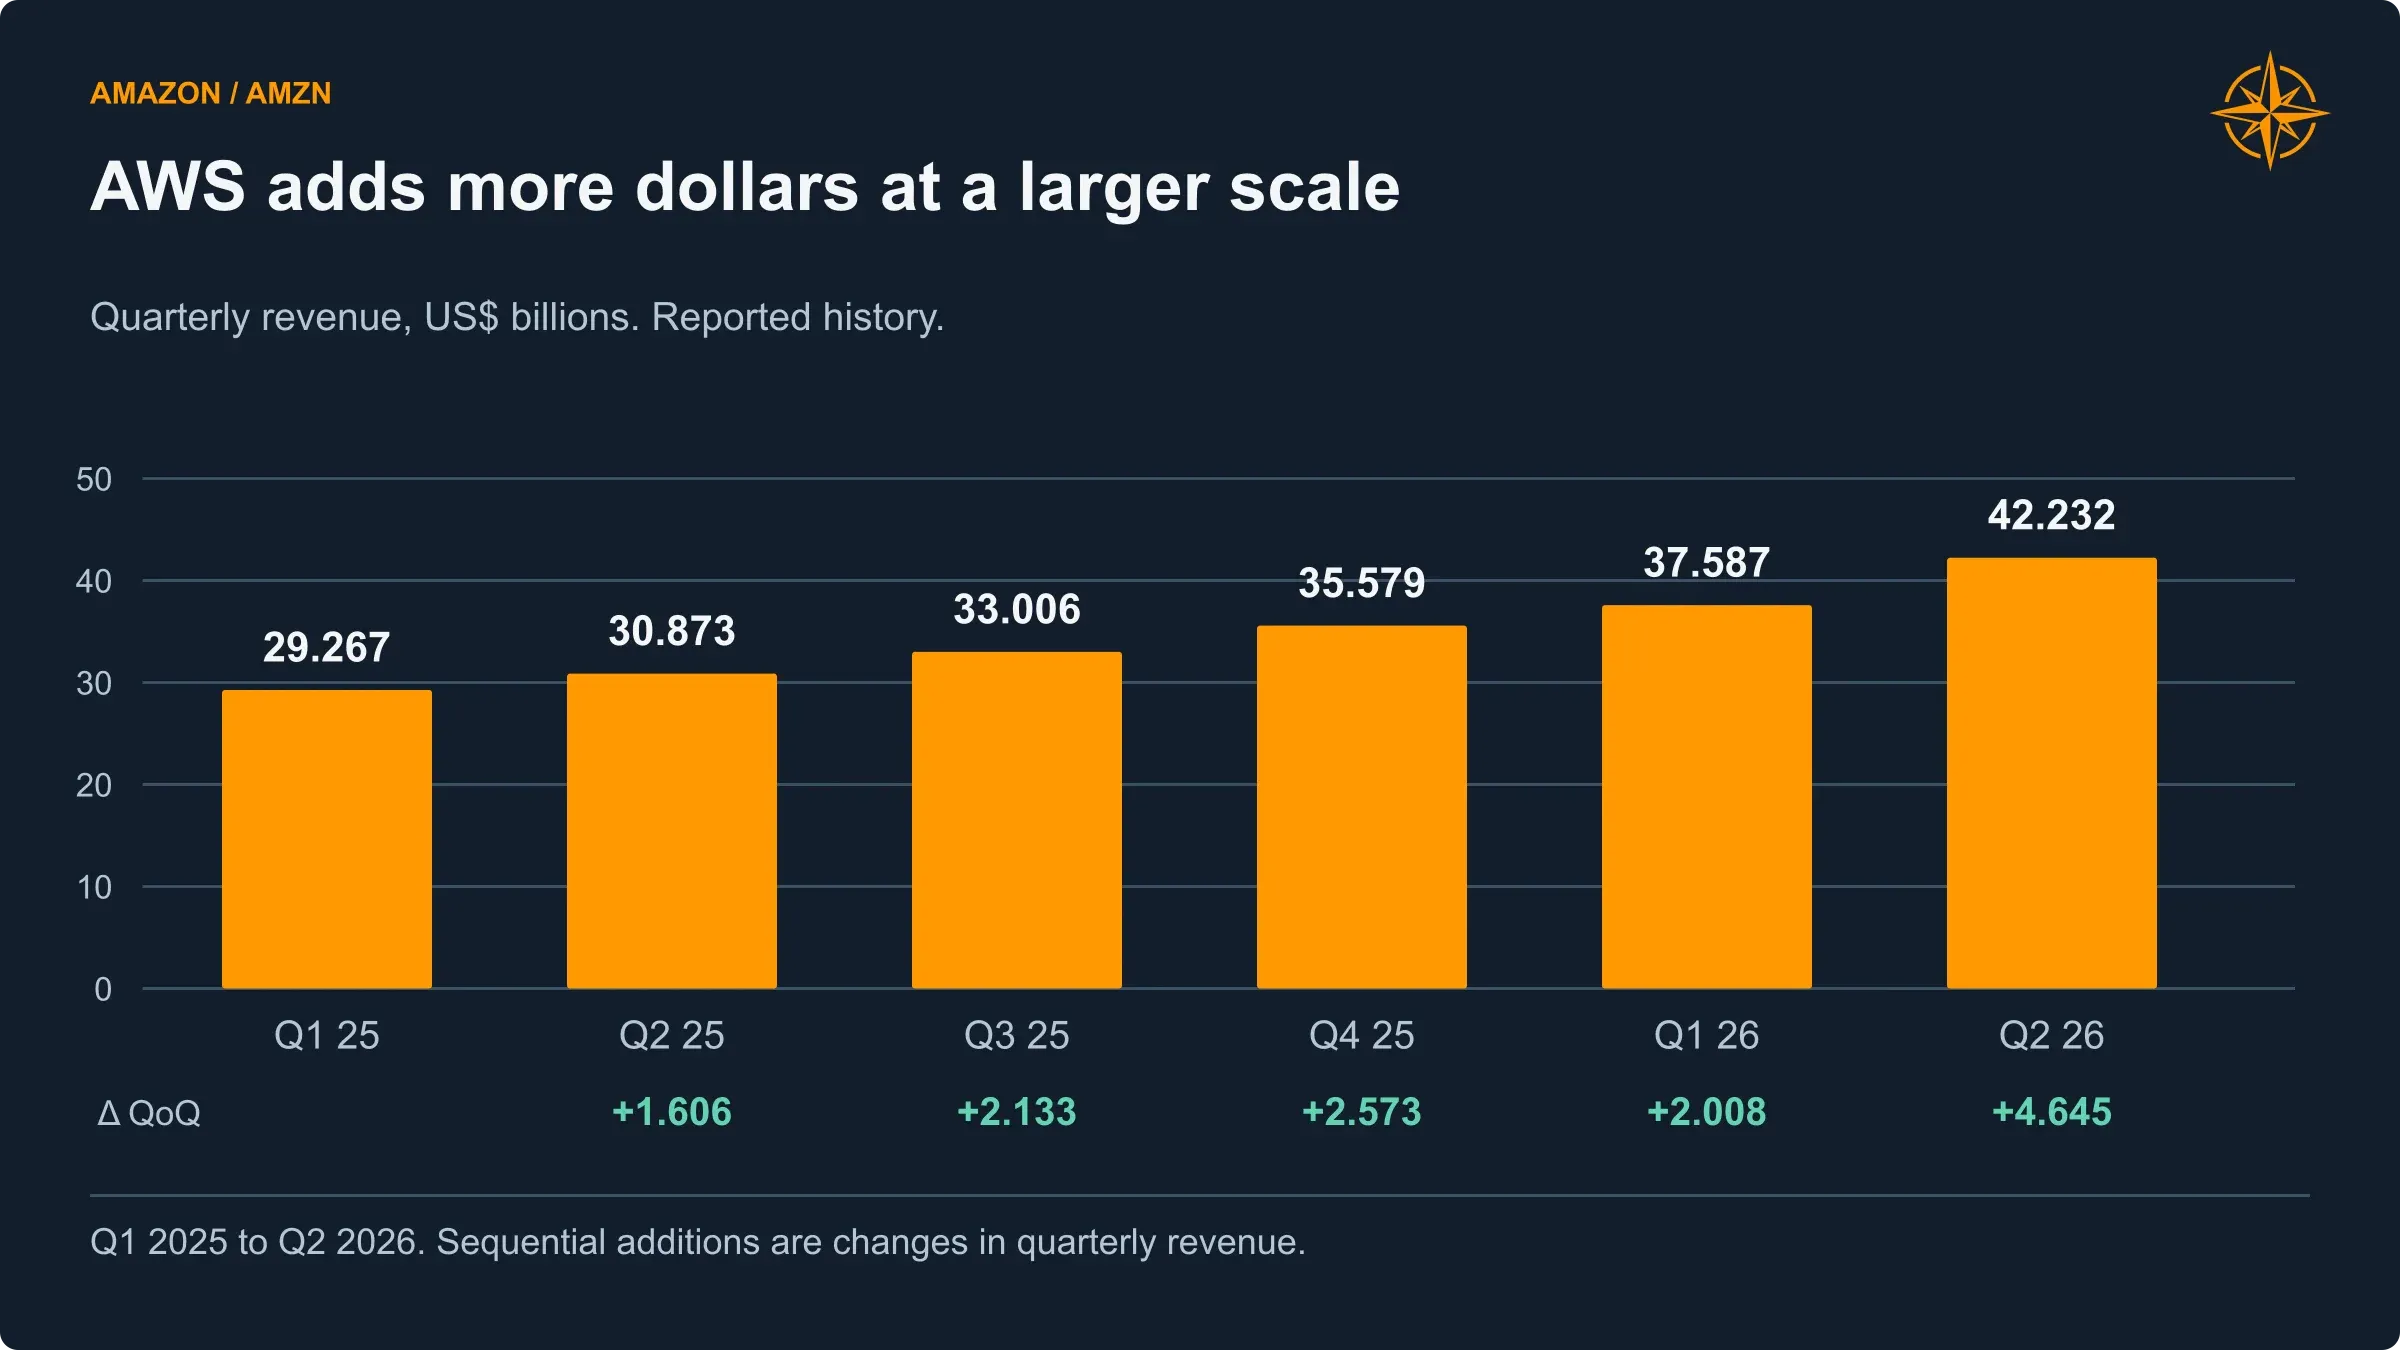
AWS added $4.645 billion of quarterly revenue from Q1 to Q2 2026, on a business generating $42.232 billion in the latest quarter.
Consider what happens when a business deploys an AI agent to resolve a customer problem. The model may interpret the request, but the application still needs to identify the customer, retrieve records, check permissions, query inventory, call other software, execute an authorized action and record what happened. The model is one part of the workload. Databases, storage, conventional computing, security and application infrastructure remain part of the bill.
This is the relationship Amazon is describing when it says AI consumption is pulling core cloud usage along with it. The company’s managed-agent infrastructure addresses functions such as identity, memory, tool access and controls, while its existing cloud services handle much of the surrounding application work. Not every deployment uses every product, but the opportunity extends well beyond renting an AI chip.
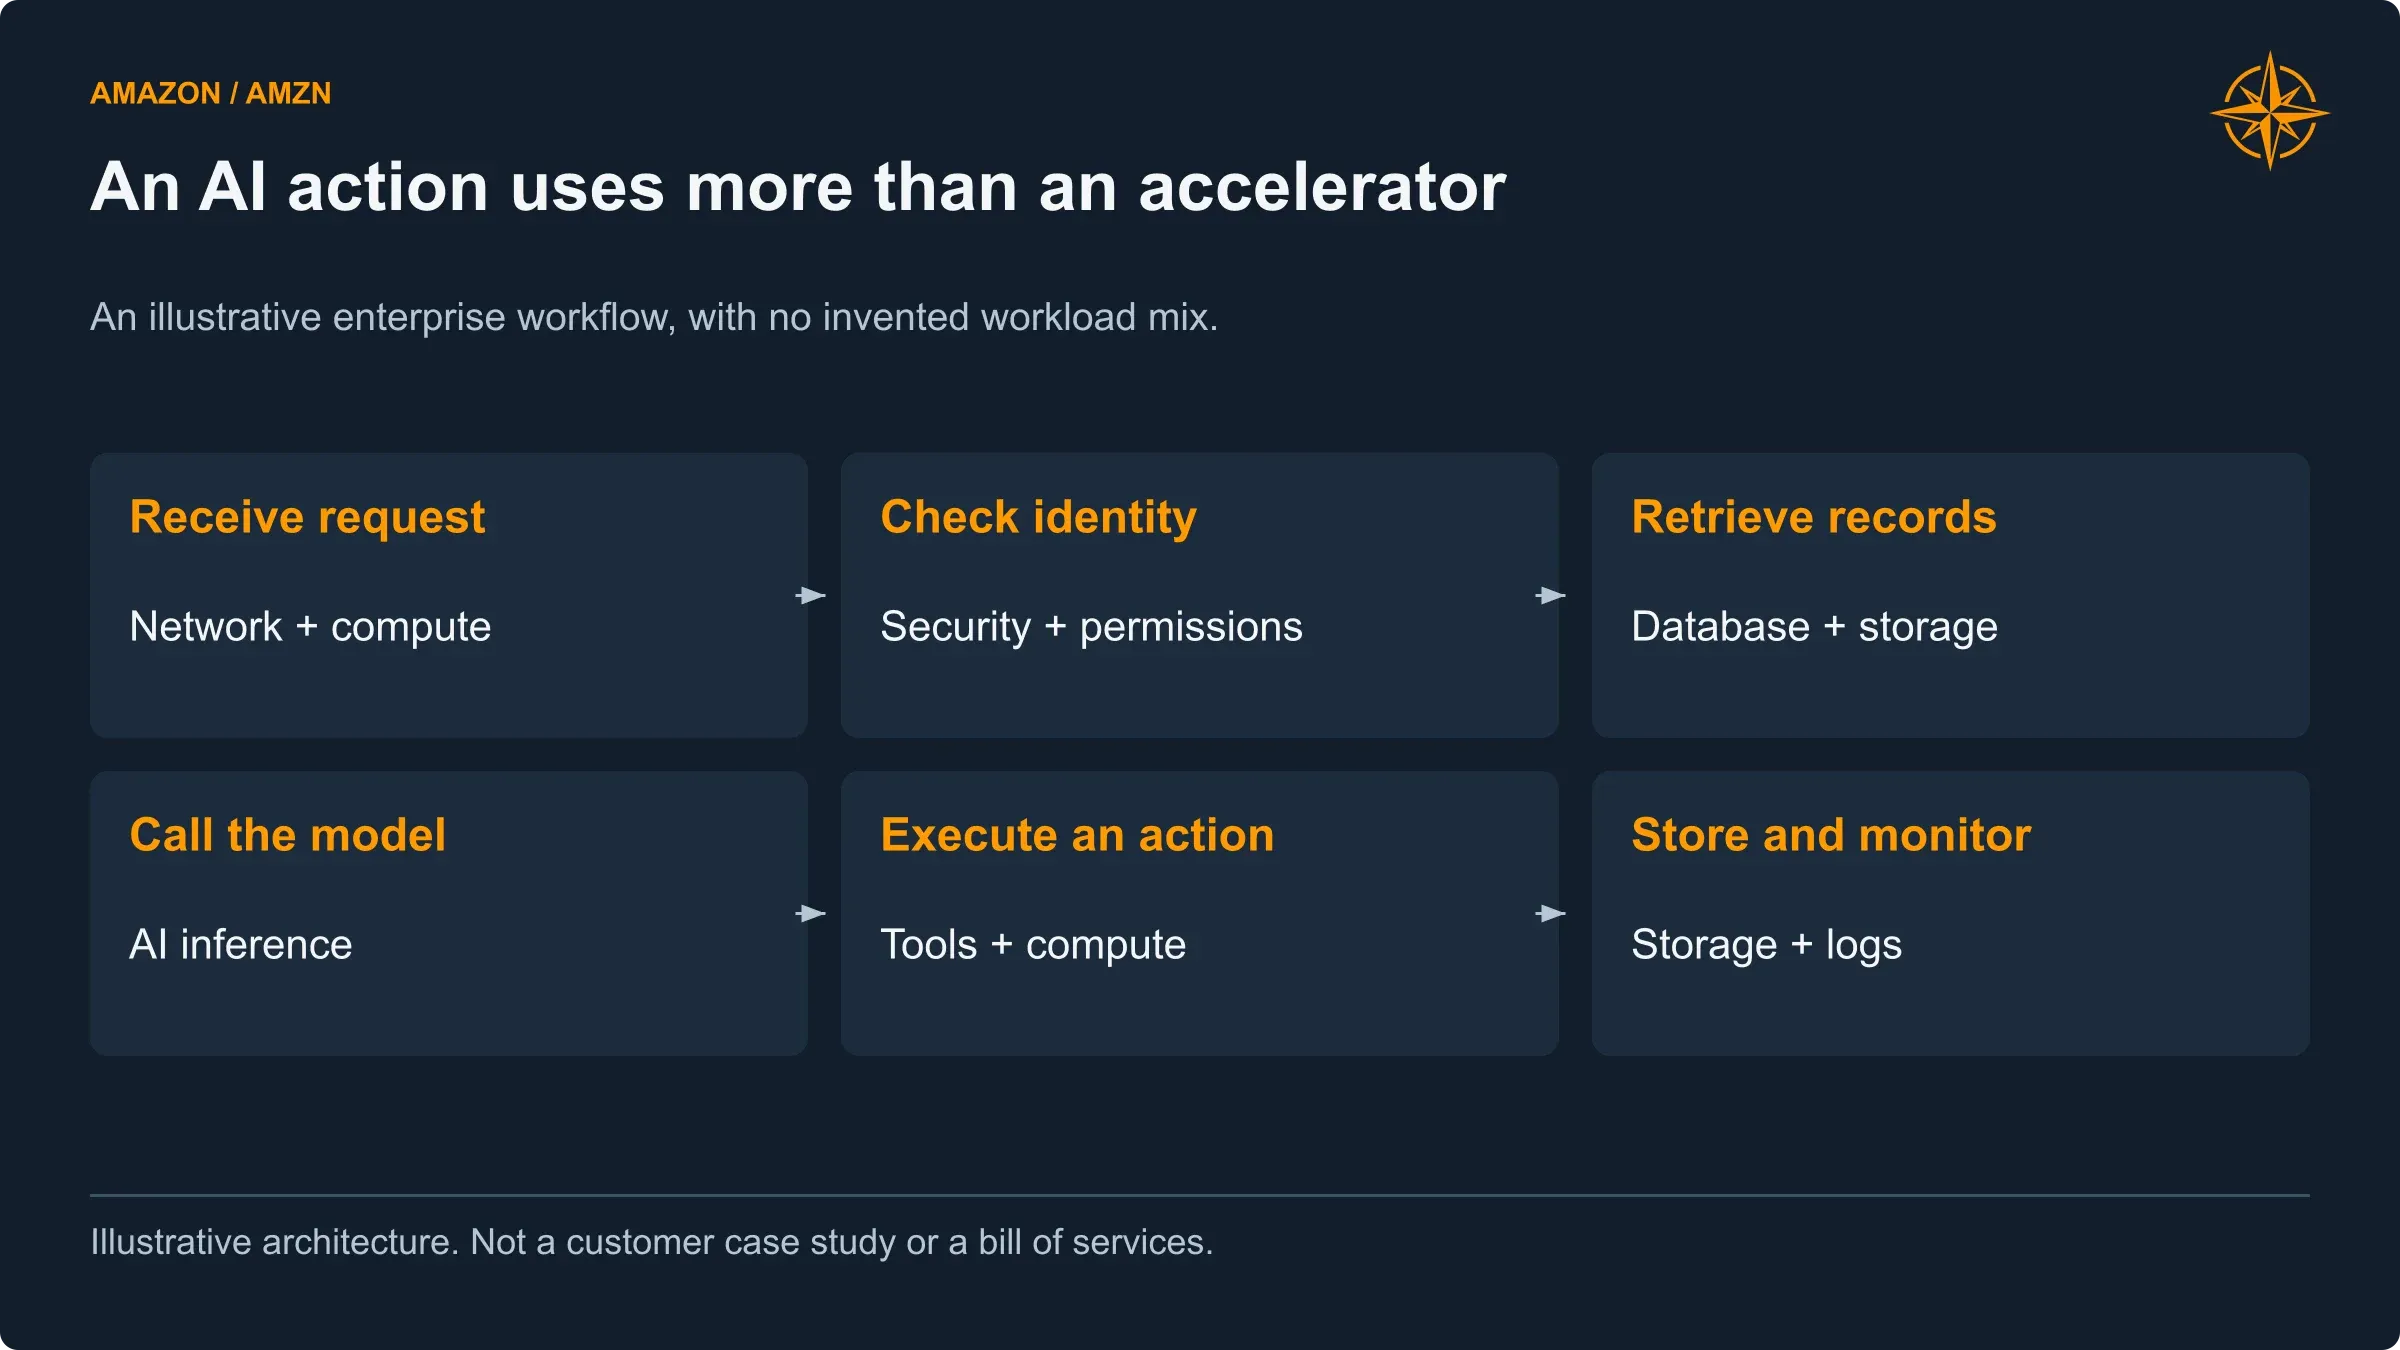
Model inference is one part of a production application. Data, conventional compute, security and monitoring can also drive cloud consumption.
The product range makes more sense when organized around what a customer is trying to accomplish. SageMaker supports building and adapting models. Bedrock provides access to models and inference, the process of using a trained model. AgentCore helps customers deploy and operate agents. Applications such as Kiro, Quick, Connect and Transform address coding, workplace assistance, contact centers and software modernization. Amazon is attempting to sell both the underlying infrastructure and useful ways to consume it.
Our forecast does not assign an invented standalone revenue number to every product announcement. Their contributions sit within the AWS business they support.
The AWS forecast
We divide AWS analytically into core cloud and direct AI. Core cloud includes the conventional infrastructure supporting both ordinary applications and AI-related activity. Direct AI captures accelerator and model-serving workloads. Amazon does not disclose this exact financial split.
AWS central forecast | 2026E | 2027E | 2028E | 2029E | 2030E |
|---|---|---|---|---|---|
Core cloud revenue | 148.3 | 185.4 | 226.2 | 269.2 | 312.2 |
Direct AI revenue | 30.5 | 65.6 | 114.8 | 174.4 | 244.2 |
Total AWS revenue | 178.8 | 251.0 | 340.9 | 443.6 | 556.4 |
Revenue growth | 38.9% | 40.4% | 35.8% | 30.1% | 25.4% |
Operating income | 67.3 | 87.1 | 116.6 | 159.5 | 204.6 |
Operating margin | 37.6% | 34.7% | 34.2% | 35.9% | 36.8% |
Net cash capital expenditure | 174.0 | 228.0 | 266.0 | 295.0 | 322.0 |
Northwise estimates. The core/direct-AI split is an analytical allocation, not a company reporting segment.
Core cloud grows 25%, 22%, 19% and 16% from 2027 through 2030. Direct AI grows 115%, 75%, 52% and 40%. Those are demanding assumptions. They produce approximately 34% compound annual AWS revenue growth from the disclosed 2025 base through 2030. We are not calling that conservative.
There is evidence for underwriting a larger opportunity. In August, AWS and NVIDIA announced plans to deploy two million additional GPUs during 2027–2028, beyond the million-plus GPUs previously announced for deployment beginning in 2026. These are planned deliveries, not revenue already earned, but they materially strengthen the case for a larger infrastructure program. (NVIDIA Investor Relations)
There is also evidence against assuming AWS owns the opportunity. Synergy estimated second-quarter cloud-infrastructure spending at $143.4 billion, up 43%, and put Amazon’s share at 28%. Microsoft and Google were growing faster. These are third-party estimates covering a particular set of services, not a direct calculation from Amazon’s total reported AWS revenue. They show a rapidly expanding market with serious competition, not a market waiting politely for Amazon to finish building. (Synergy Research Group)
Our view is that Amazon does not need to supply the winning frontier model to benefit substantially from AI. It does need customers to keep choosing AWS for the infrastructure and services around their applications. That requires competitive performance, sensible pricing and reliable execution even as the underlying models change.
Customer choice is part of the chip strategy
Trainium and NVIDIA are not mutually exclusive bets.
Amazon designs Trainium for AI workloads and Graviton for general-purpose computing, while continuing to purchase substantial NVIDIA capacity. The company reported landing more than 2.1 million AI chips over the preceding twelve months in its first-quarter release, with more than half being Trainium. It also disclosed substantial Trainium capacity commitments from major customers.
Custom silicon can improve the economics of delivering a service. It can also introduce software-compatibility, customer-adoption and execution challenges. The relevant financial benefit is better performance for the investment, lower operating cost, or a more attractive customer offering. It is not an additional sale merely because Amazon designed the chip itself.
The reported AI and chips run rates therefore cannot be added together as two independent businesses on top of AWS. Both exceeded $25 billion at the time of the second-quarter results, but they describe overlapping economic activity.
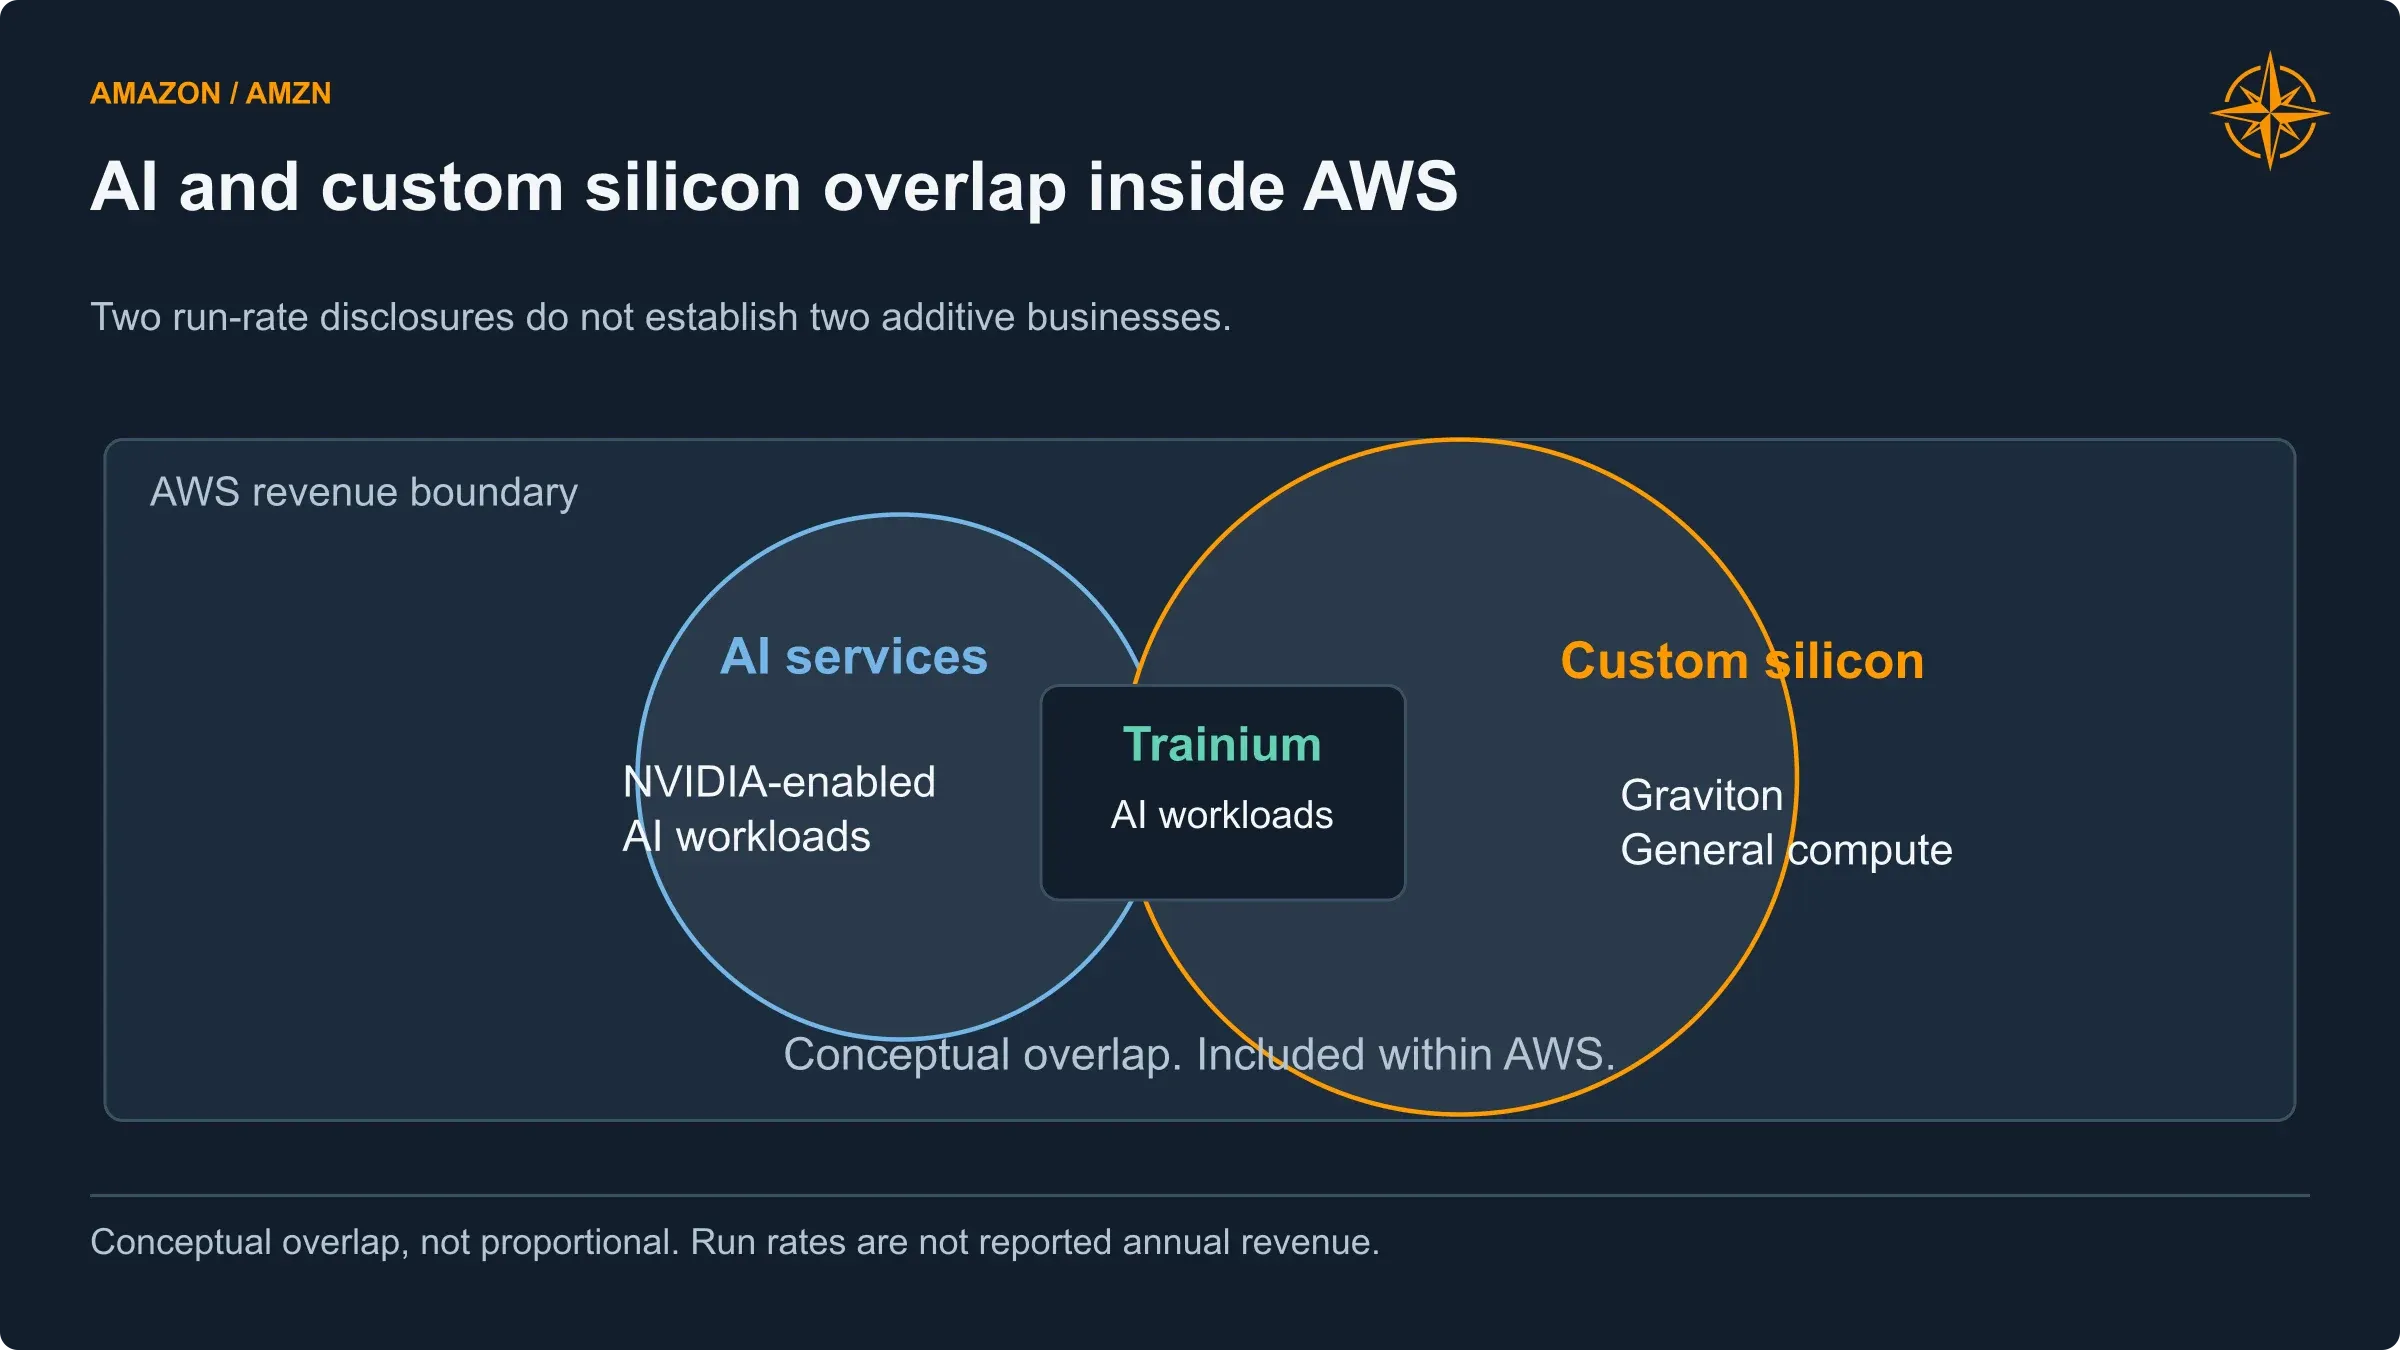
Trainium can support AI workloads, Graviton serves general computing, and NVIDIA also supports AI. These exposures sit within AWS revenue.
We also do not assume a separate external chip-selling business in the forecast. Management has discussed that possibility; it has not supplied the financial detail needed to treat it as an established revenue stream.
What the larger cloud business costs
The strongest argument against a complacent AWS forecast is sitting in Amazon’s own spending guidance.
Management raised its expected 2026 cash capital expenditure from approximately $200 billion to $220 billion, attributing the increase to memory costs. That does not mean Amazon suddenly found an additional $20 billion of revenue-producing equipment to buy. Some of the same infrastructure became more expensive.
We separate equipment quantities from acquisition prices for that reason. We also distinguish spending, assets acquired and assets ready to serve customers.
In the first half, Amazon spent $96.3 billion of net cash on property and equipment. Property acquired but not yet paid increased by $20.6 billion, and finance-leased equipment added another $2.1 billion. Reported net property additions were $118.6 billion. Those figures are related, but they are not identical measures of investment. Supplier payment timing can improve cash temporarily without reducing the cost of the equipment entering the business. (Amazon Q2 10-Q, supplemental cash flow information).
Capital spending remains elevated throughout the forecast
Central capital program | 2026E | 2027E | 2028E | 2029E | 2030E |
|---|---|---|---|---|---|
AWS | 174.0 | 228.0 | 266.0 | 295.0 | 322.0 |
Commerce and related infrastructure | 41.6 | 47.0 | 52.0 | 57.0 | 62.0 |
Advertising | 2.0 | 2.5 | 3.0 | 3.5 | 4.0 |
Leo | 2.0 | 5.5 | 7.0 | 8.5 | 10.0 |
Zoox | 0.4 | 0.8 | 1.6 | 2.4 | 3.3 |
Total net cash capital expenditure | 220.0 | 283.8 | 329.6 | 366.4 | 401.3 |
Cash plus newly financed capital expenditure | 226.8 | 290.3 | 336.6 | 373.9 | 409.3 |
Property depreciation and amortization | 58.9 | 89.6 | 120.8 | 147.6 | 189.0 |
Northwise estimates. Property depreciation is not the entire depreciation-and-amortization adjustment on Amazon’s cash-flow statement.
Our asset schedule assigns different lives to different purchases. New AWS additions are modeled as 60% equipment, 30% buildings, 5% power and cooling, and 5% land. Equipment uses a 5.5-year depreciation life, buildings thirty years, and power systems fifteen. Land is not depreciated. The opening age distribution and entry-to-service timing are estimates because Amazon does not disclose a complete asset-vintage inventory.
That schedule produces approximately $189 billion of property depreciation in 2030. We have not selected an operating margin and then declared that depreciation will somehow fit underneath it.
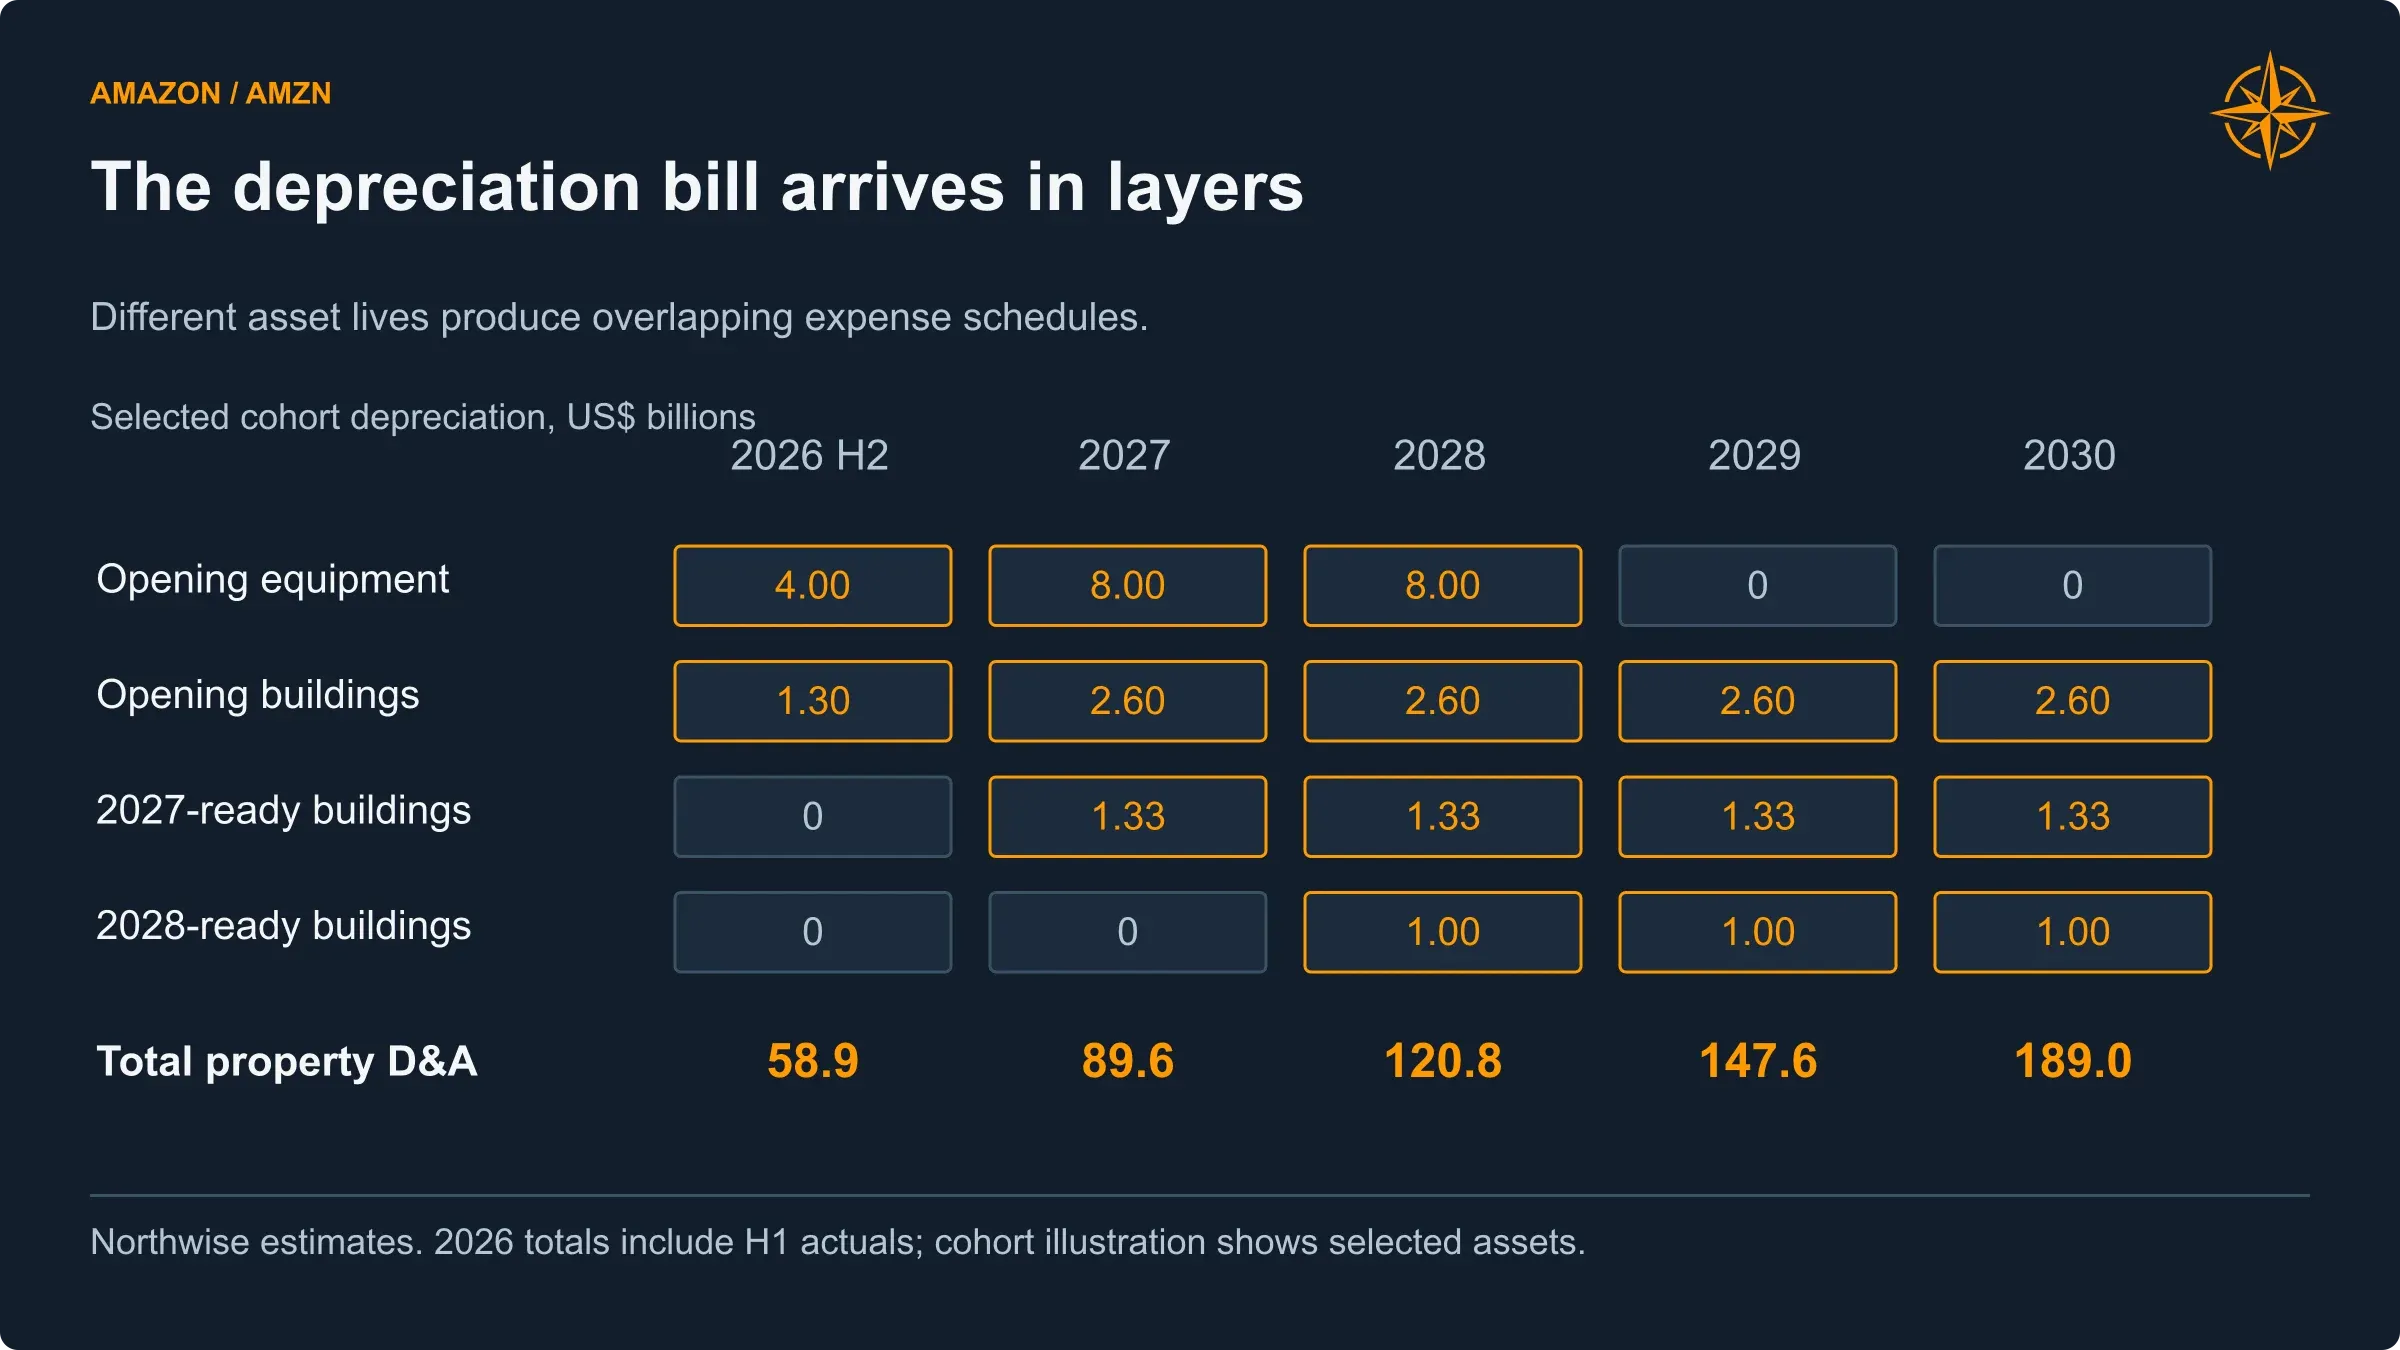
Annual property depreciation rises from $58.9 billion in 2026 to $189.0 billion in 2030 as successive assets enter service. This is not all cash-flow-statement amortization.
Nor do we dismiss depreciation as an accounting nuisance. Changing the book life of otherwise identical equipment changes the timing of reported earnings. Equipment becoming economically obsolete sooner can require replacement spending, reduce useful capacity or leave an asset earning less than expected. Those are different events.
An older accelerator may remain useful for some workloads after a new generation arrives. That possibility is not a guarantee that its selling price, power consumption and maintenance requirements will support an attractive return indefinitely. The forecast must allow for replacement as well as expansion.
Demand still has to fit through the delivery schedule
Our AWS forecast limits realized revenue using estimated in-service equipment, facility readiness, deployment timing and productivity. Customer demand is not automatically recognized simply because it appears in an optimistic growth assumption.
The framework uses revenue-equivalent capacity estimates rather than claiming an independently verified count of every AWS rack or megawatt. A 10% throughput and product-mix buffer allows for performance and utilization variation around the reference capital program. It is our assumption, not a company disclosure of 10% spare physical capacity.
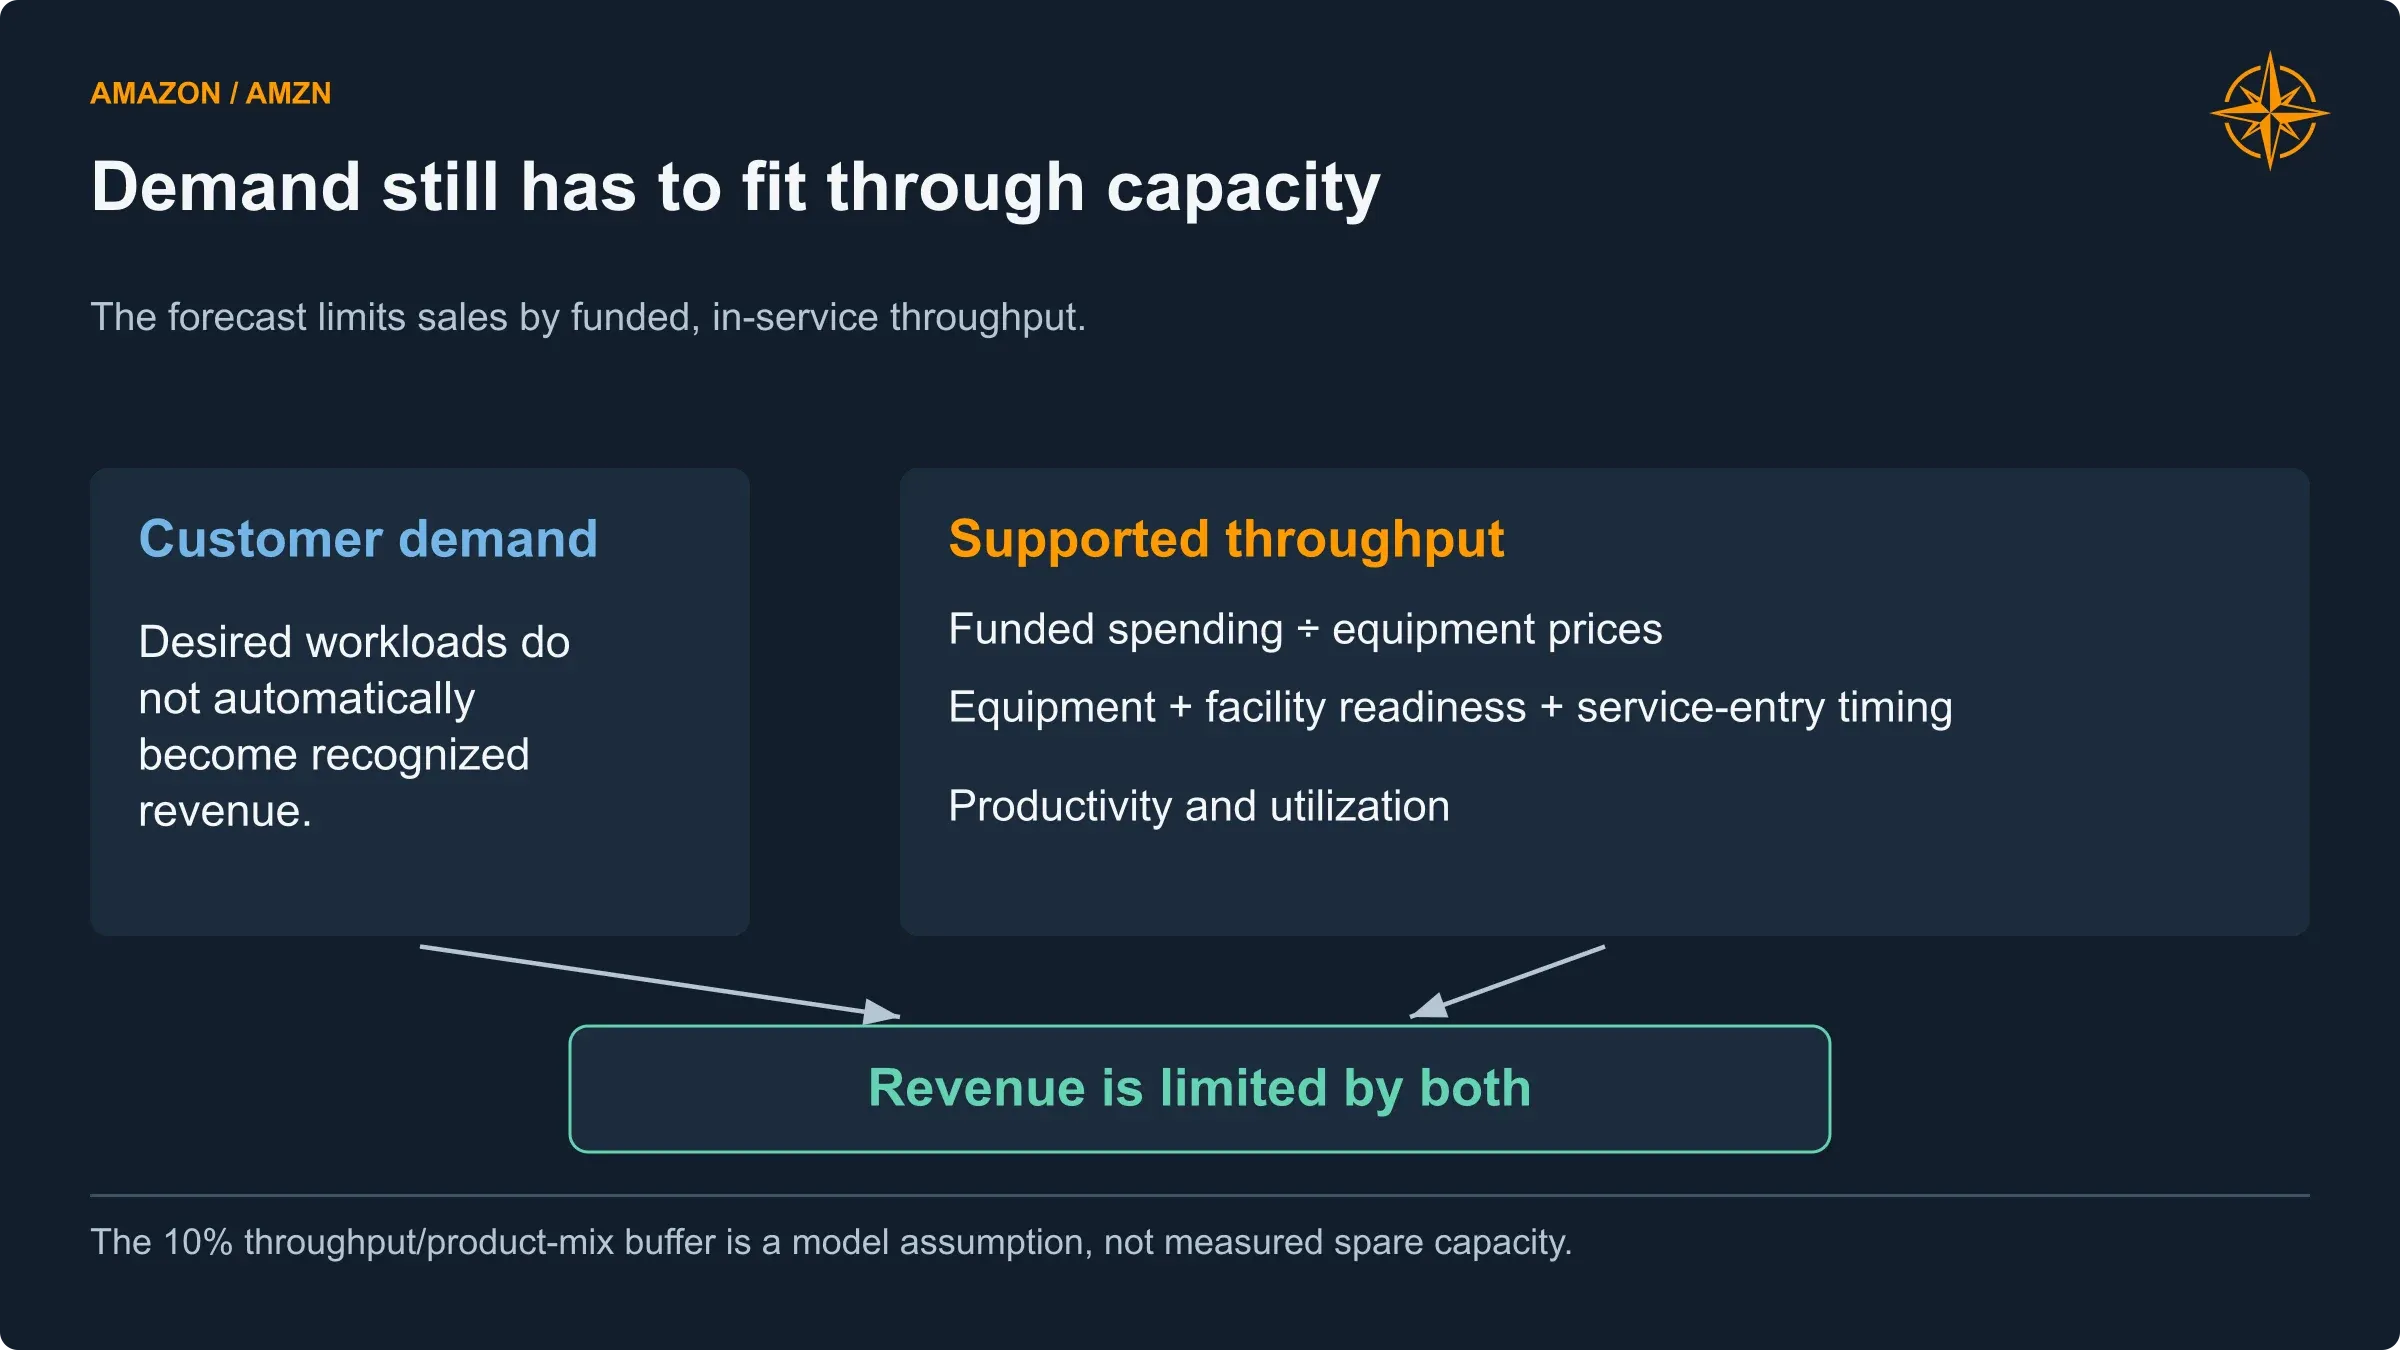
The capacity framework limits revenue using estimated equipment and facility readiness. It does not claim an independently measured AWS rack or megawatt inventory.
Future procurement can also respond to demand. Near-term commitments are relatively difficult to change; equipment orders several years away are more adjustable. This gives a disappointing-growth scenario a route to lower spending without pretending that unfinished facilities can be unwound at no cost.
The central AWS margin falls from 37.6% in 2026 to 34.2% in 2028 before recovering to 36.8% in 2030. The recovery depends on the larger revenue base, cost discipline and improving utilization. It is not based on the idea that AI workloads must be more profitable than everything AWS sold before them.
The customer on both sides of the cash flow
A $496 billion backlog is powerful evidence of demand. It is not $496 billion sitting in Amazon’s bank account.
Amazon’s remaining performance obligations, primarily related to AWS, have expanded alongside their duration:
Reporting date | Remaining performance obligations | Weighted-average remaining contract life |
|---|---|---|
December 2025 | $244B | 4.1 years |
March 2026 | $364B | 5.5 years |
June 2026 | $496B | 6.4 years |
Revenue recognition depends on customer usage and Amazon fulfilling its contractual obligations.
The longer commitments improve visibility, but they also push more of the opportunity beyond the next few quarters. Dividing backlog by average contract duration would not reproduce the actual revenue schedule.
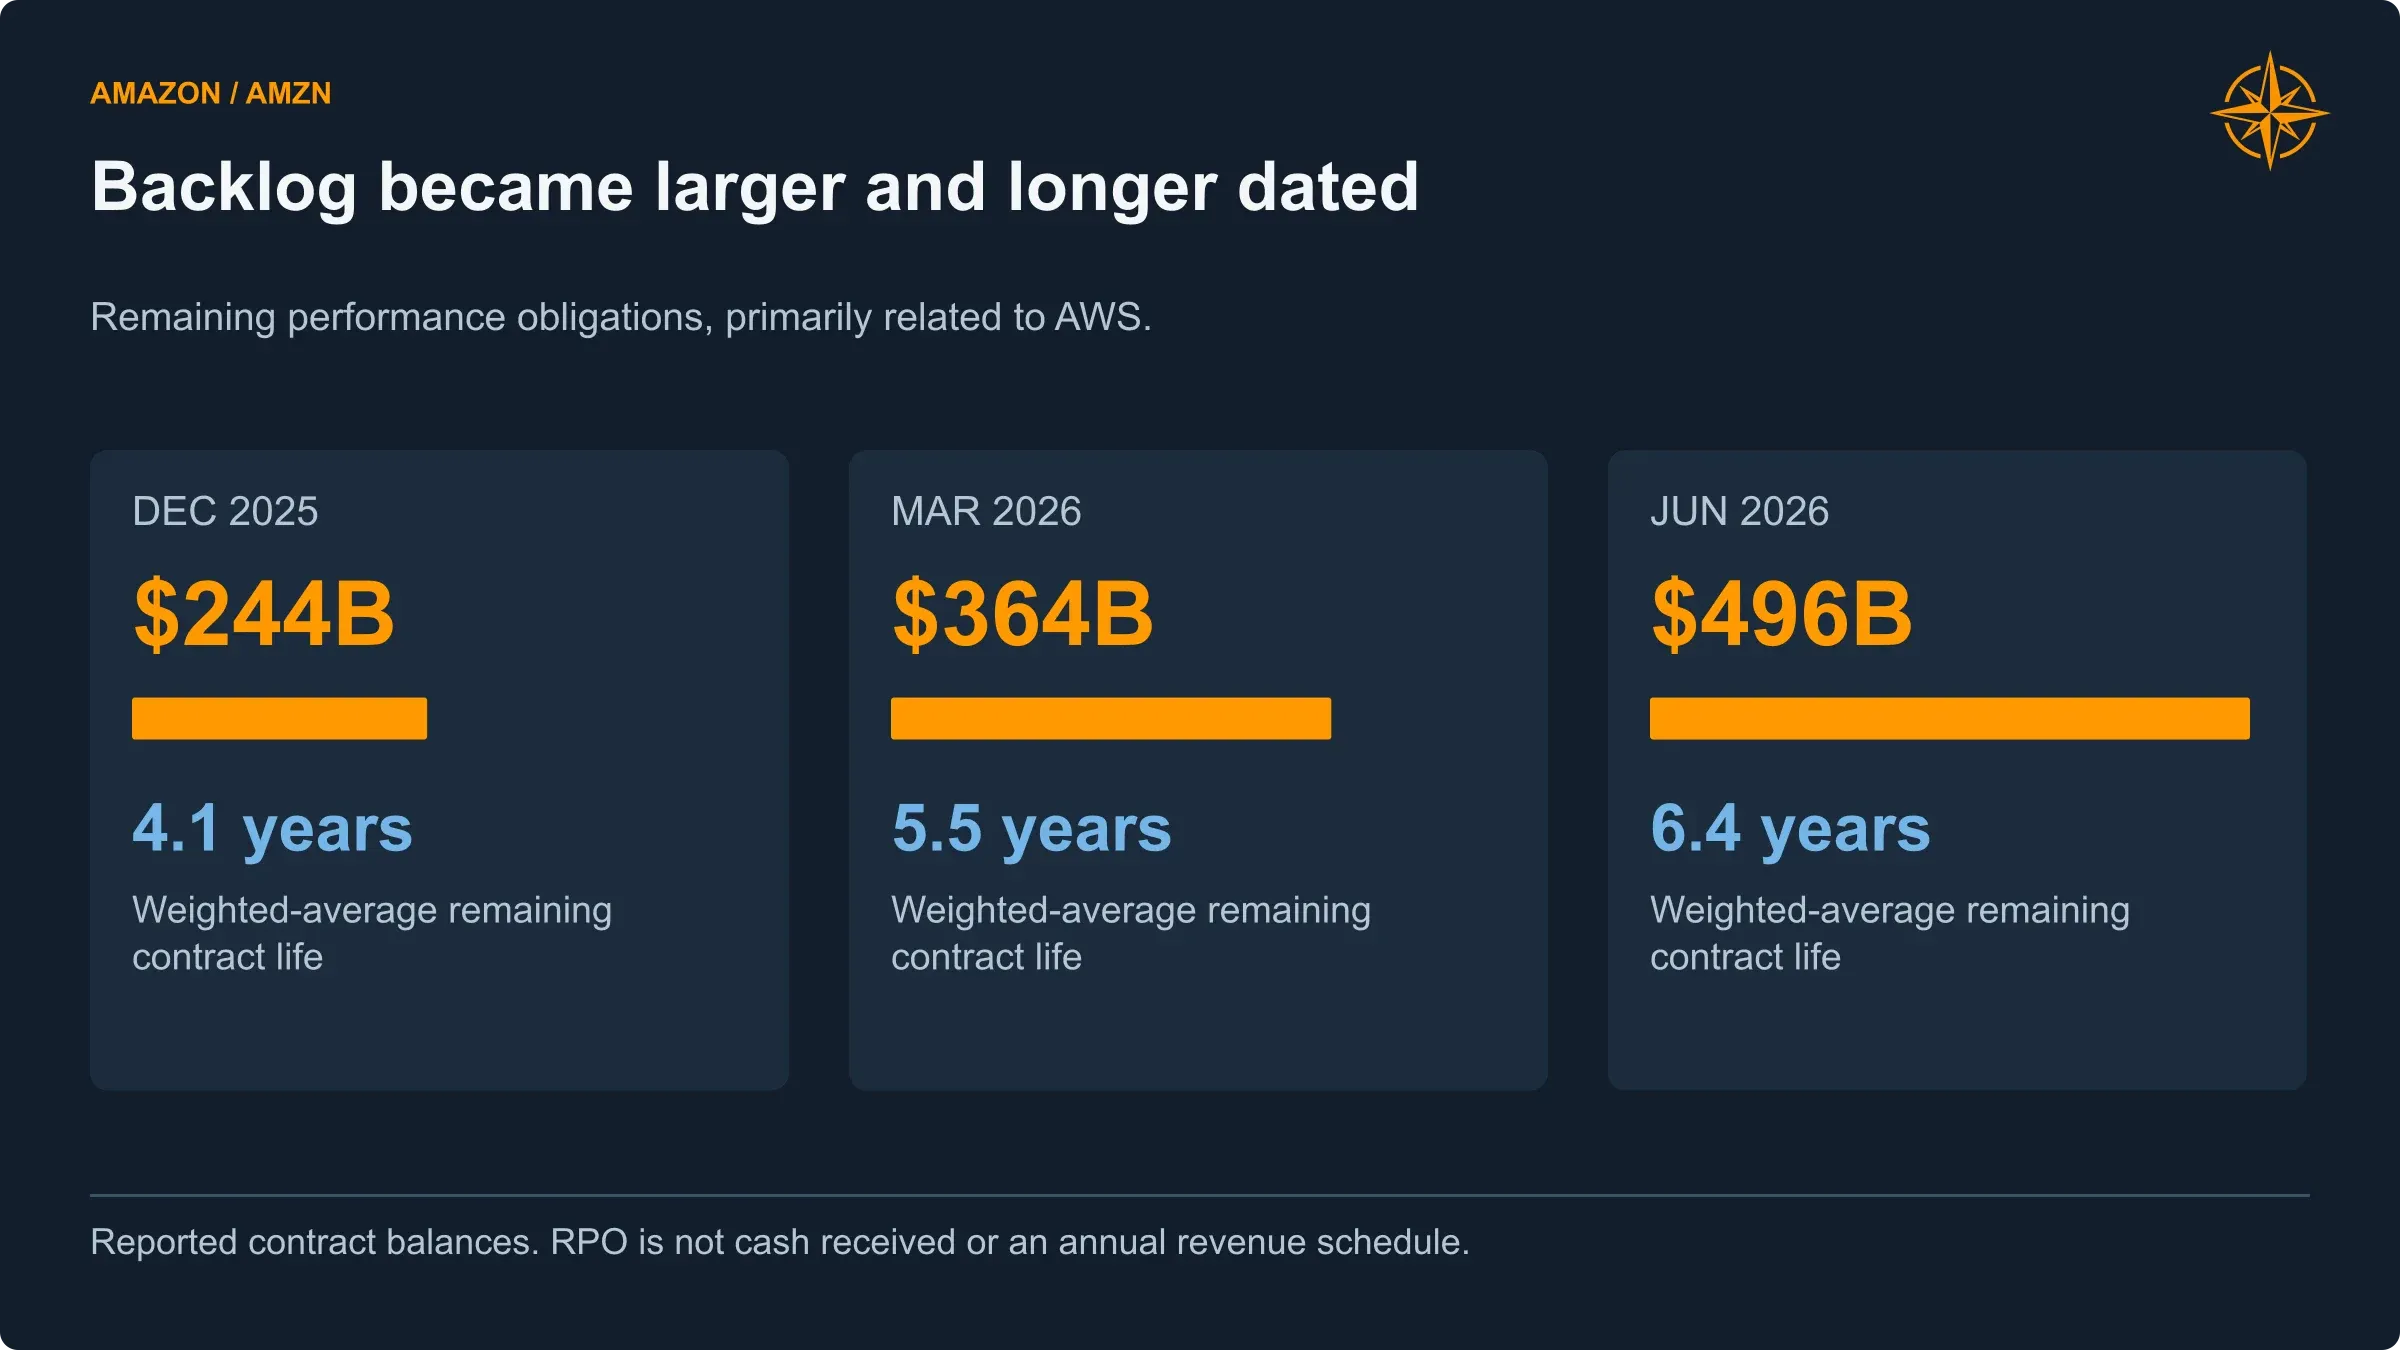
Remaining performance obligations rose from $244 billion to $496 billion as average remaining contract life extended from 4.1 to 6.4 years.
The named AI agreements make that clear. The expanded OpenAI arrangement adds $100 billion over eight years to an existing $38 billion commitment. The expanded Anthropic collaboration adds more than $100 billion over ten years. Both include obligations relating to the performance of AWS chips. These agreements overlap the reported backlog; they are not separate amounts to add to it again.
Our 2030 forecast consequently requires more than successful delivery against the contracts already signed. It requires additional consumption, new workloads and further customer commitments.
There is another complication: Amazon also sends money to some of these customers.
At June 30, Amazon carried approximately $92.5 billion of Anthropic preferred stock and $97.9 billion of convertible notes. The combined $190.4 billion is a carrying value, not the amount of cash Amazon originally invested. A financing arrangement could make further capital available as Amazon reaches specified compute-delivery milestones, with $15 billion remaining under the facility after the disclosed investments. (Amazon Q2 10-Q, investments note).
Amazon had invested $28.7 billion in OpenAI by June and disclosed investing the remaining $21.3 billion subsequently, completing the $50 billion commitment. That is a real use of cash alongside the spending required to build the infrastructure. (Amazon Q2 10-Q, OpenAI investment).
These relationships can be valuable. They can help secure demand, strengthen collaboration and give Amazon an ownership interest in successful customers. They also create correlated exposure. A deterioration in an AI customer’s economics could reduce future cloud consumption, lower the value of Amazon’s investment and increase pressure for further funding at the same time.
Calling all of this “fake revenue” would be too crude. Treating the customer, investment and financing exposures as unrelated would be equally unhelpful.
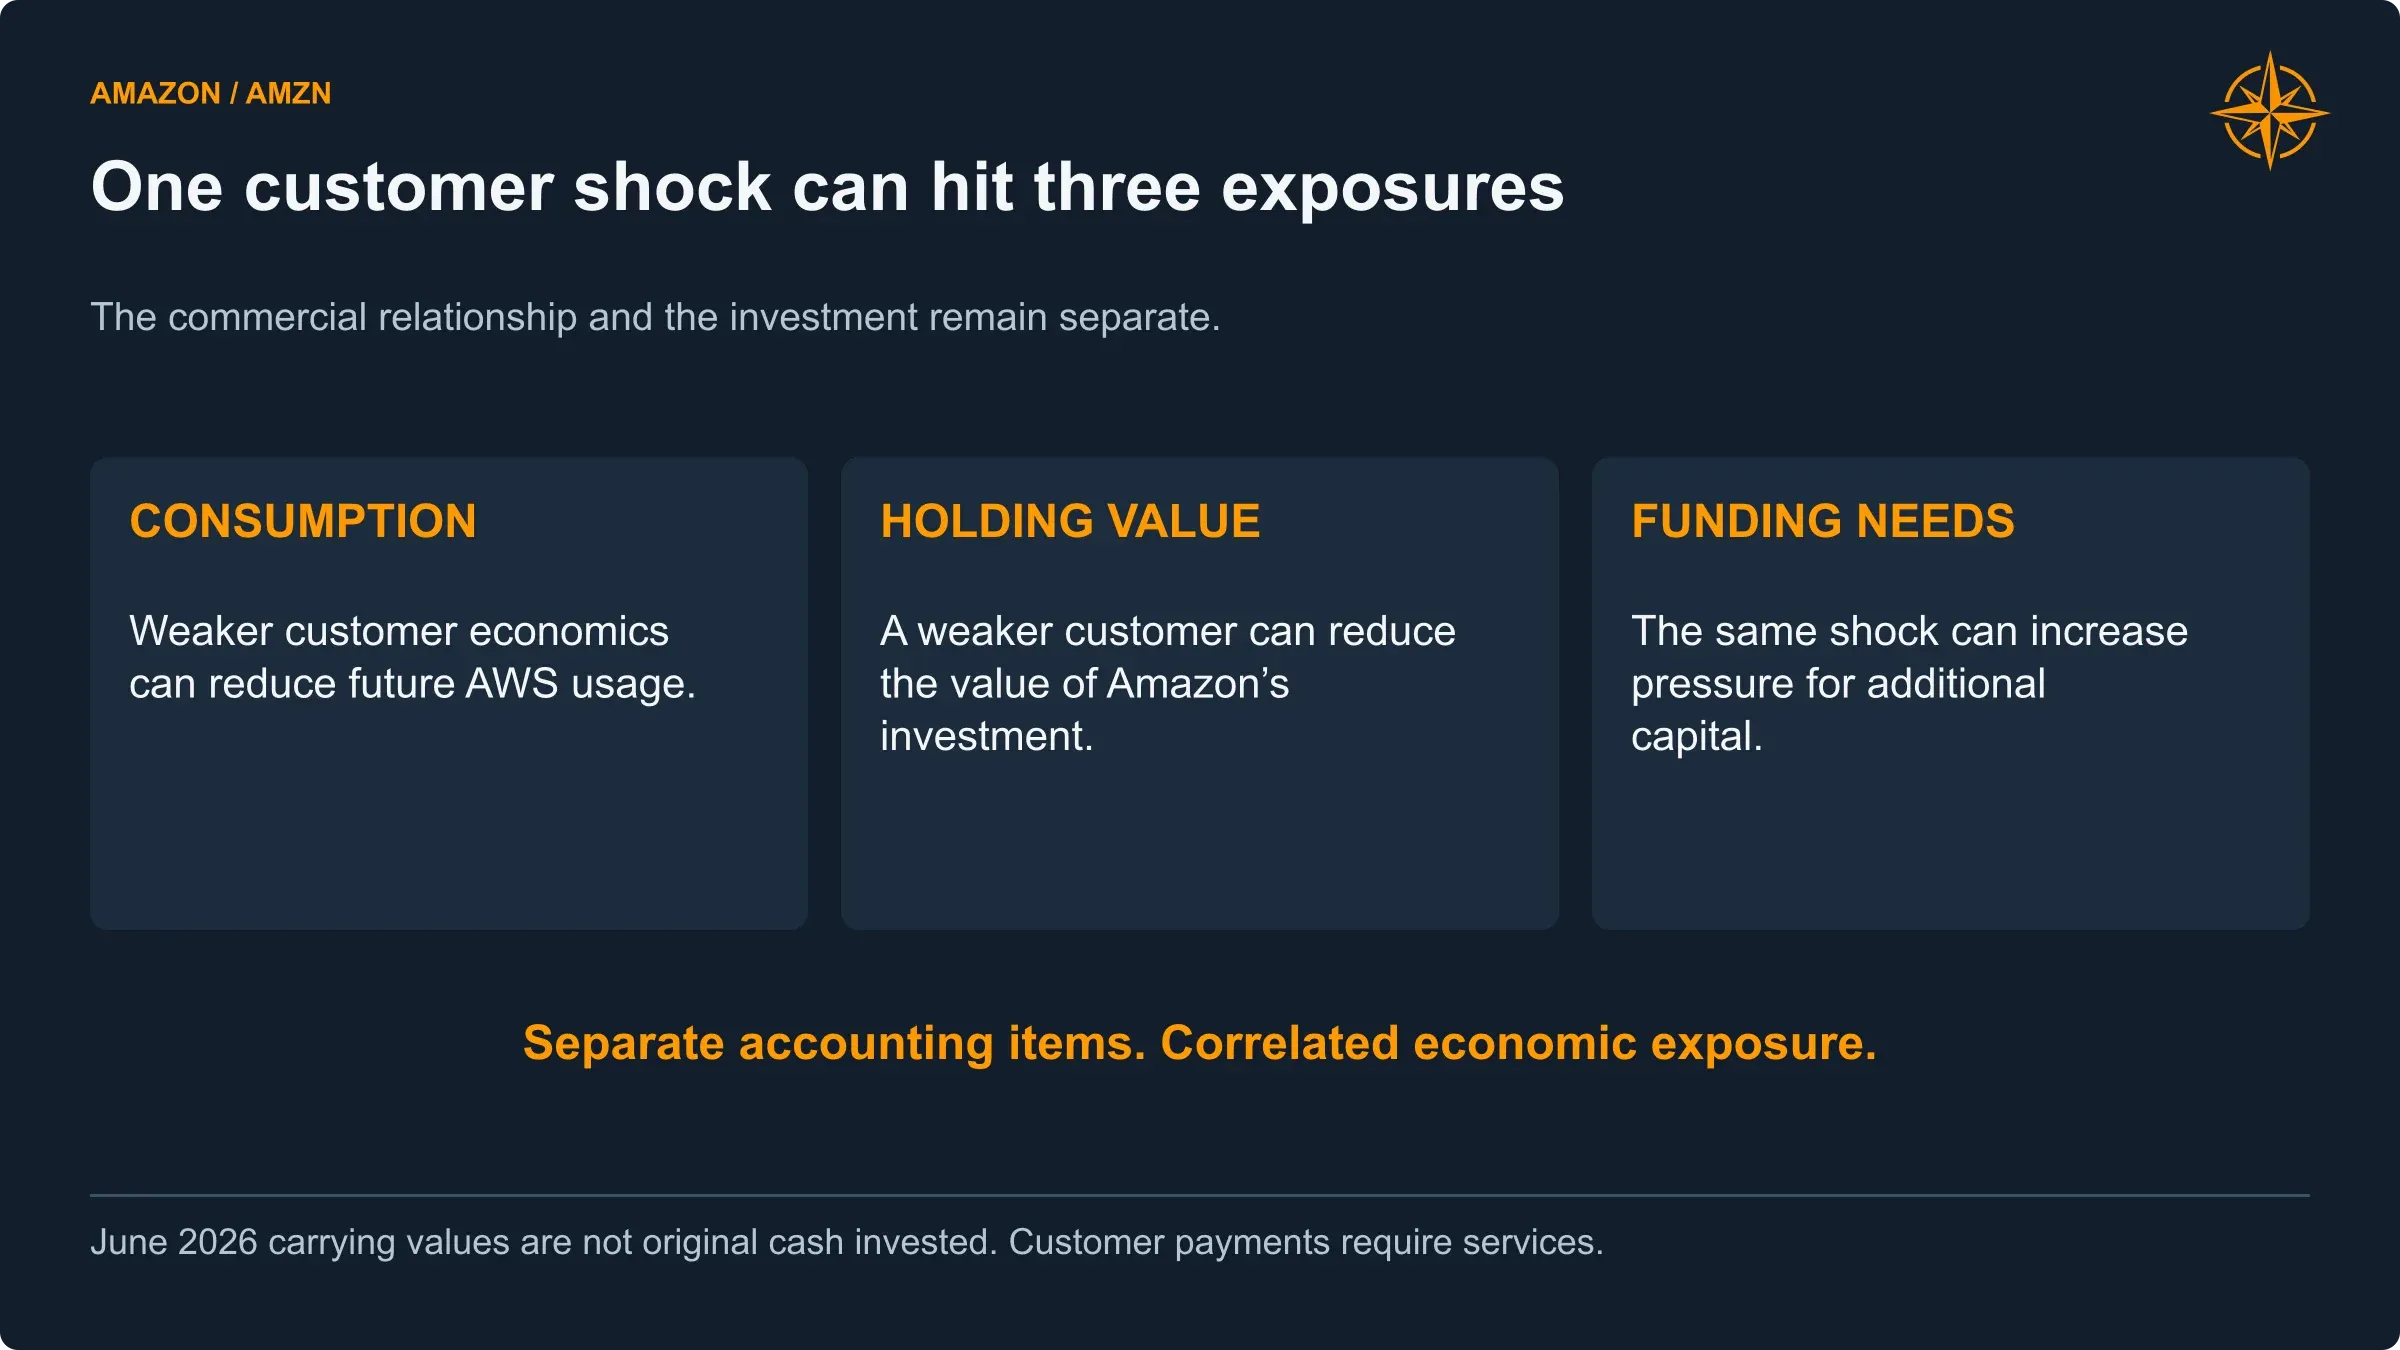
A deterioration in an AI customer can affect AWS consumption, the value of Amazon’s holdings and potential additional funding needs together.
The relationships are not exclusive, either. Anthropic explicitly describes using AWS Trainium, Google TPUs and NVIDIA GPUs, while identifying Amazon as its primary cloud provider and training partner. Amazon’s investment does not entitle it to every future compute dollar Anthropic spends. (Anthropic)
Our view is that the commercial relationships strengthen the AWS opportunity, but their value has to survive a cash-flow analysis. A customer contract, an investment mark-up and a payment received are three different things.
The package still matters
The cloud discussion can make Amazon’s stores sound like the old business. The operating evidence suggests a business still changing in important ways.
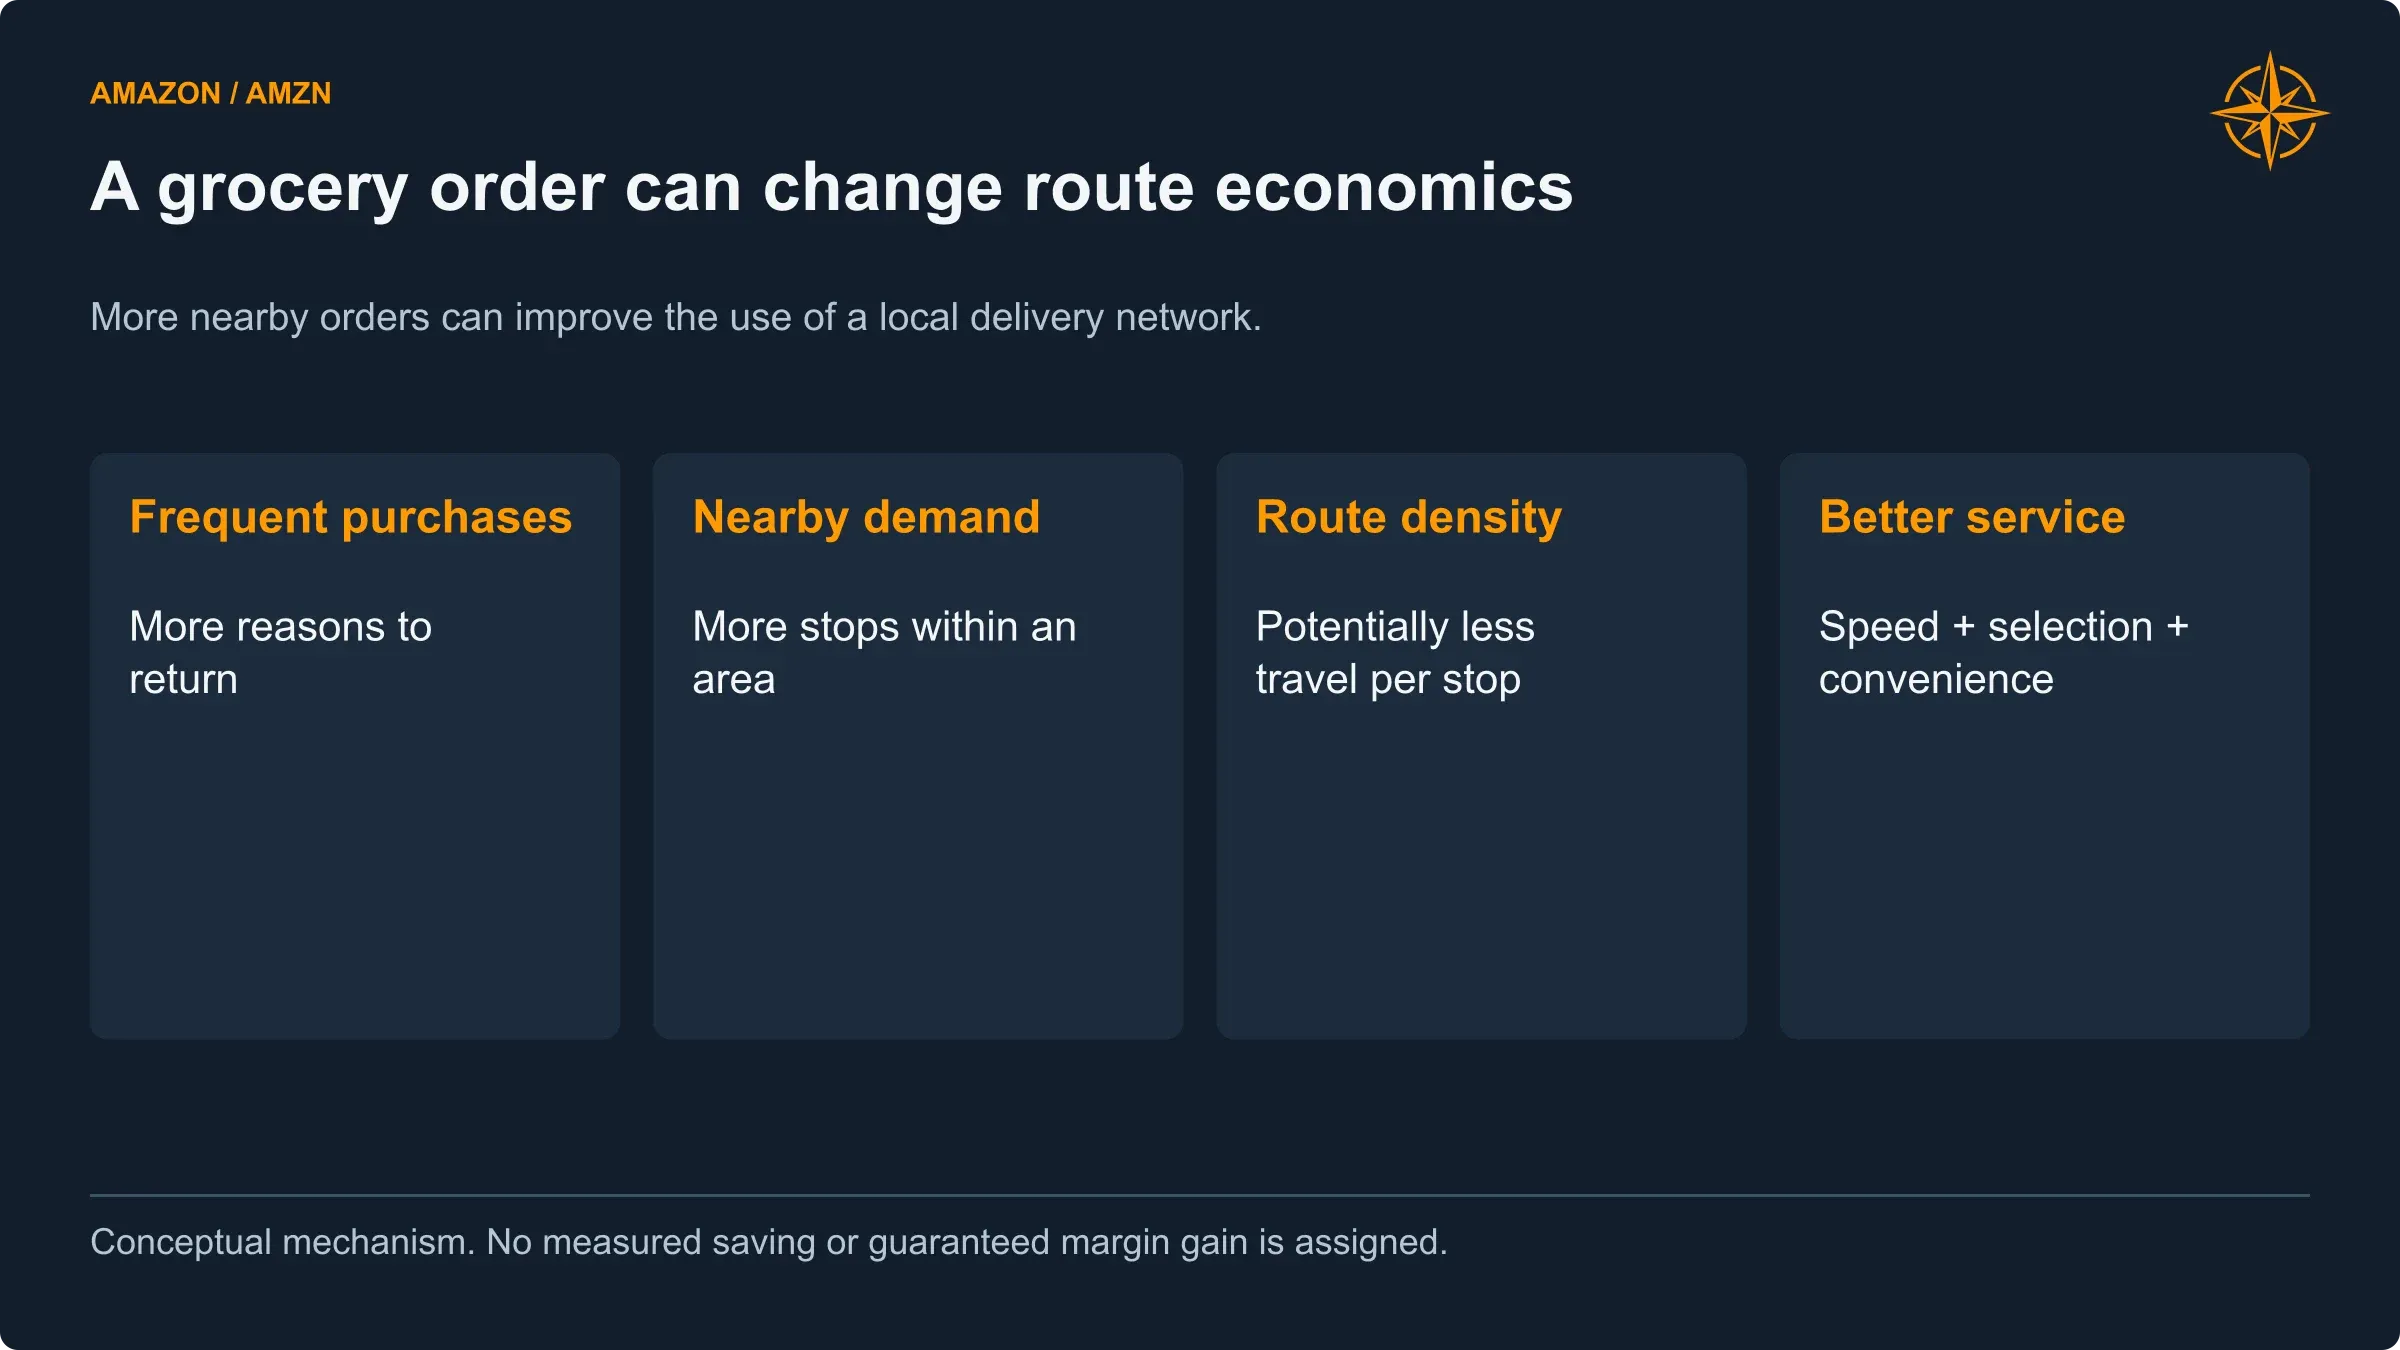
Frequent grocery purchases can increase delivery density and customer engagement. The benefit still depends on order economics and fulfillment execution.
Worldwide paid units grew 17% in the second quarter. Shipping costs grew 19%. Third-party sellers accounted for 61% of paid units, compared with 62% a year earlier. That is not a quarter in which every efficiency and mix indicator moved effortlessly in Amazon’s favor. Management attributed pressure to fuel inflation and line-haul costs while describing continued gains from inventory placement, shorter shipping distances, consolidation and automation.
The distinction between a unit, an order and a delivery matters economically. More items in an order can increase revenue without requiring a proportional increase in delivery trips. Locating inventory closer to customers can improve service and reduce transportation work. Shipping one missing item separately can undo part of that benefit.
Grocery is an instructive example. Management reported that monthly active perishables customers grew more than 50% from the start of the year and that same-day orders containing perishables had more than three times as many units per order. The service was available in more than 2,300 U.S. cities and towns. These are customer-cohort observations, not proof that adding groceries caused every dollar of higher spending, but they show why everyday purchases matter to the network.
A retailer used for occasional electronics purchases has a different relationship with a household from one used for groceries and other routine needs. We see the latter as a route to more frequent activity, better delivery density and additional opportunities for seller services and advertising. It also creates more demanding expectations for price, speed and reliability.
Our forecast allows online-store growth to moderate from 11% in 2027 to 9.5% in 2030. Third-party seller-services growth moves from 14% to 12% over the same period. We do not assume that merchant fees can rise indefinitely without affecting seller behavior, or that every robotics improvement becomes additional operating profit.
North America commerce, excluding advertising, Leo and Zoox, reaches approximately $38.9 billion of operating income in 2030. That is substantial profit from the commerce business itself, after allocated costs, rather than a geographic segment margin that quietly includes advertising.
International requires a different pace. Currency can change the headline before anything changes at the warehouse: first-quarter International revenue grew 19% in reported dollars but 11% excluding currency effects. In our analytical commerce-only view, International begins with an operating loss of about $1.3 billion in 2026 and reaches $7.5 billion of profit in 2030. The reported International segment also includes advertising, so these are not forecasts of reported segment losses.
Local competition, delivery density, regulation and customer spending patterns will not improve uniformly across countries. We allow progress without assuming the international network simply acquires North America’s economics on a fixed timetable.
Prime and advertising earn their place together
Prime helps explain why product sales alone are an incomplete measure of customer economics. Delivery benefits, video and other services can influence membership, purchase frequency and retention. But a subscription fee is not pure incremental profit. The benefits have to remain useful enough for customers to keep paying.
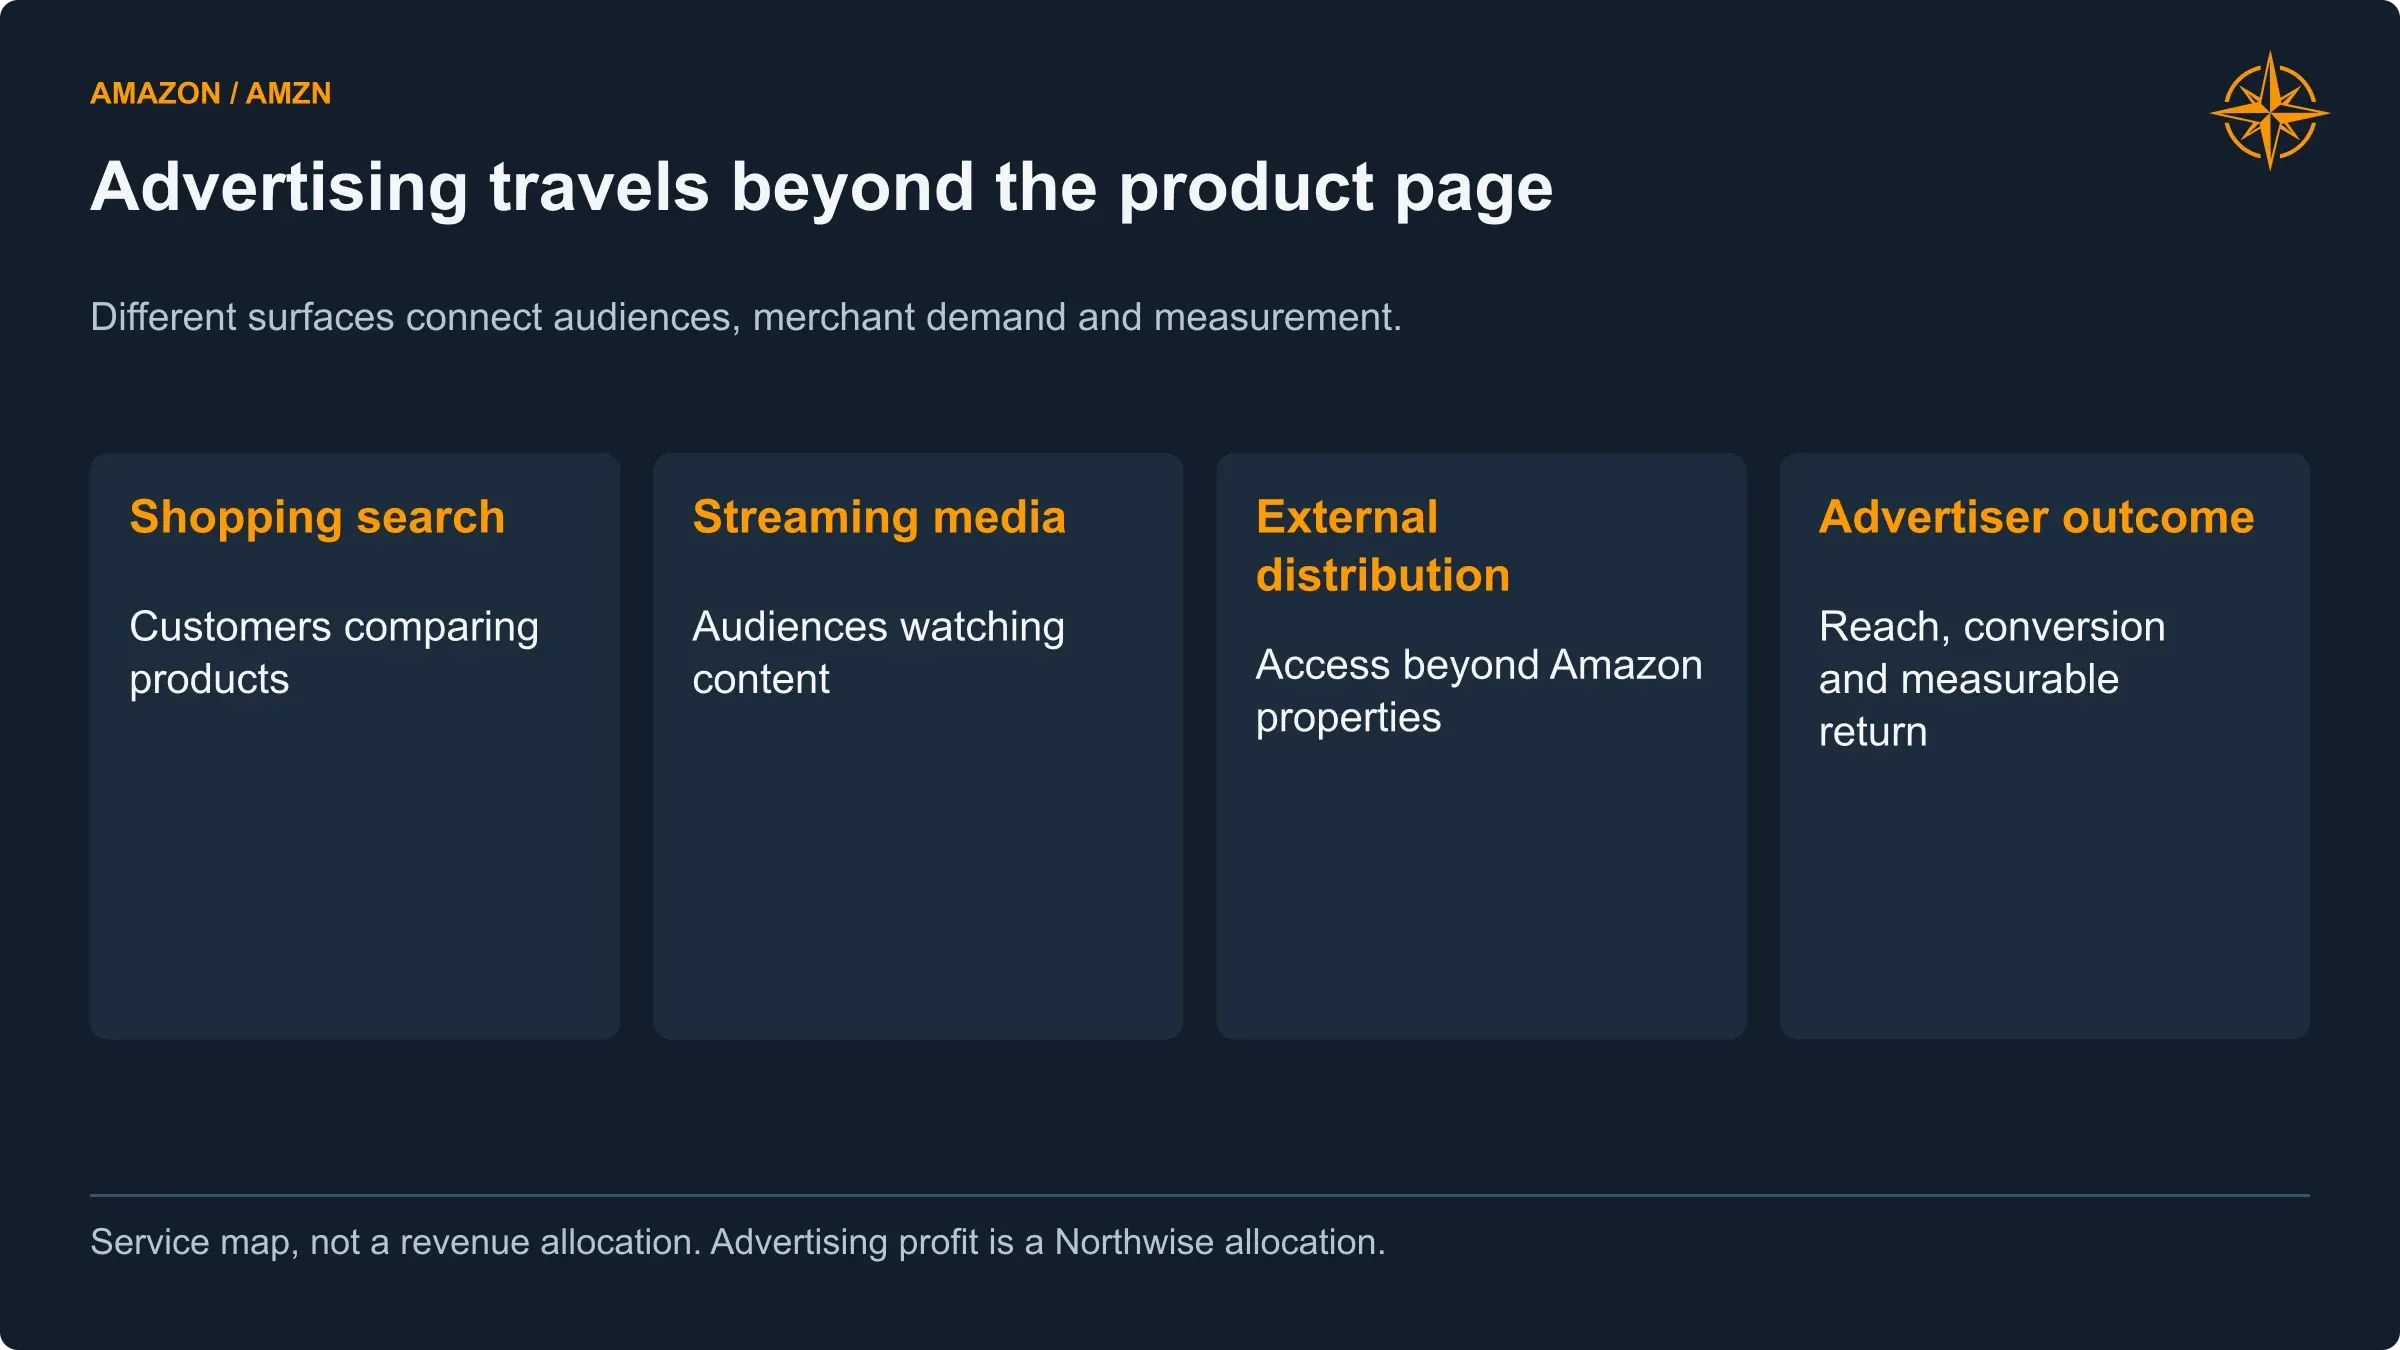
Amazon’s advertising opportunity extends across shopping, video and external distribution. The model includes the costs of content, traffic and delivery.
We forecast subscription-services revenue rising from $55.5 billion in 2026 to $85.8 billion in 2030. That category includes Prime membership fees and other digital subscriptions; it should not be interpreted as a forecast of Prime members multiplied by an invented average membership price.
Advertising benefits from the same commercial activity. A shopper comparing products is already close to making a purchase, which gives a relevant placement a different role from an advertisement shown to someone with no immediate intention to buy. Sponsored Products remains Amazon’s largest advertising offering, according to management, while video, sports and external distribution broaden the inventory.
The scale is already considerable. Advertising generated $19.8 billion in the second quarter, growing approximately 26%. We model $84.5 billion in 2026 revenue and $185.6 billion in 2030, with operating income rising from $35.5 billion to $81.0 billion. The implied operating margin increases from about 42% to 43.6%. Those margins are our allocations, not a standalone advertising margin disclosed by Amazon.
It would be easy to make this business look even more profitable by assigning every shared cost somewhere else. We do not do that. Amazon incurred $12.9 billion of video and music expense in the first half. Content helps attract subscribers and audiences, and audiences help attract advertisers. The expense cannot disappear simply because the revenue is attractive.
AI could improve advertising in two ways: making campaigns easier to create and manage, and helping customers discover relevant products. It could also change where discovery happens. Amazon’s September pilot allowing selected U.S. advertisers to extend campaigns into ChatGPT is an example of pursuing customers outside its own storefront. The announcement does not disclose the revenue-sharing economics needed to create a separate financial forecast. (Amazon Ads)
We also resist turning engagement statistics into guaranteed revenue uplifts. Management reported higher conversion and spending among shoppers who clicked sponsored prompts. Those shoppers may already have been more motivated to buy. The comparisons are encouraging, but they are not a controlled experiment proving that the prompt created the entire difference.
New services do not require new accounting fantasies
Amazon’s distribution infrastructure creates adjacent opportunities beyond its own retail sales. The company launched Amazon Supply Chain Services with early customers including Procter & Gamble, 3M, Lands’ End and American Eagle Outfitters. Pharmacy customer acquisition and same-day prescription delivery also accelerated in the first half.
We include these activities within the appropriate existing revenue and cost categories. We do not add Amazon Business’s $60 billion annualized gross-sales figure to consolidated revenue, nor do we create a separately “validated” healthcare profit stream without the disclosures needed to support one.
The same discipline applies to internal AI productivity. Better software development, customer support, inventory decisions and advertising workflows could improve Amazon’s costs. Management’s examples suggest real possibilities, but an anecdote about one engineering project is not a company-wide payroll reduction forecast. We reflect operating improvement through the relevant expense assumptions rather than adding an extra AI savings line on top.
Leo needs customers as well as satellites
Leo is easiest to misunderstand when it is described only as a satellite count.
A broadband customer needs a working connection, a terminal, usable coverage, local authorization, installation and support. An enterprise may care about resilience or linking remote assets to its existing systems. An airline must install equipment across its fleet. A mobile-network partner has its own service and customer rollout to manage.
A satellite launch advances all of those possibilities. It does not complete them.
Amazon reported nearly 400 Leo satellites in orbit with its second-quarter results. Its expanded Arianespace agreement added six launches, bringing that commitment to twenty-four. These are meaningful deployment milestones, but launch procurement, successful deployment and paid service remain separate steps. (Amazon News)
Australia’s NBN provides a useful example. Its August update described testing later in 2026 and progressive customer transitions from around mid-2027, subject to readiness. Even with an established distribution partner, commercialization follows testing, installation and available capacity rather than a simple count of spacecraft already launched. (NBN Co)
We give Leo a substantial operating forecast because its potential customer base now spans several distinct services. We also charge it for building those services.
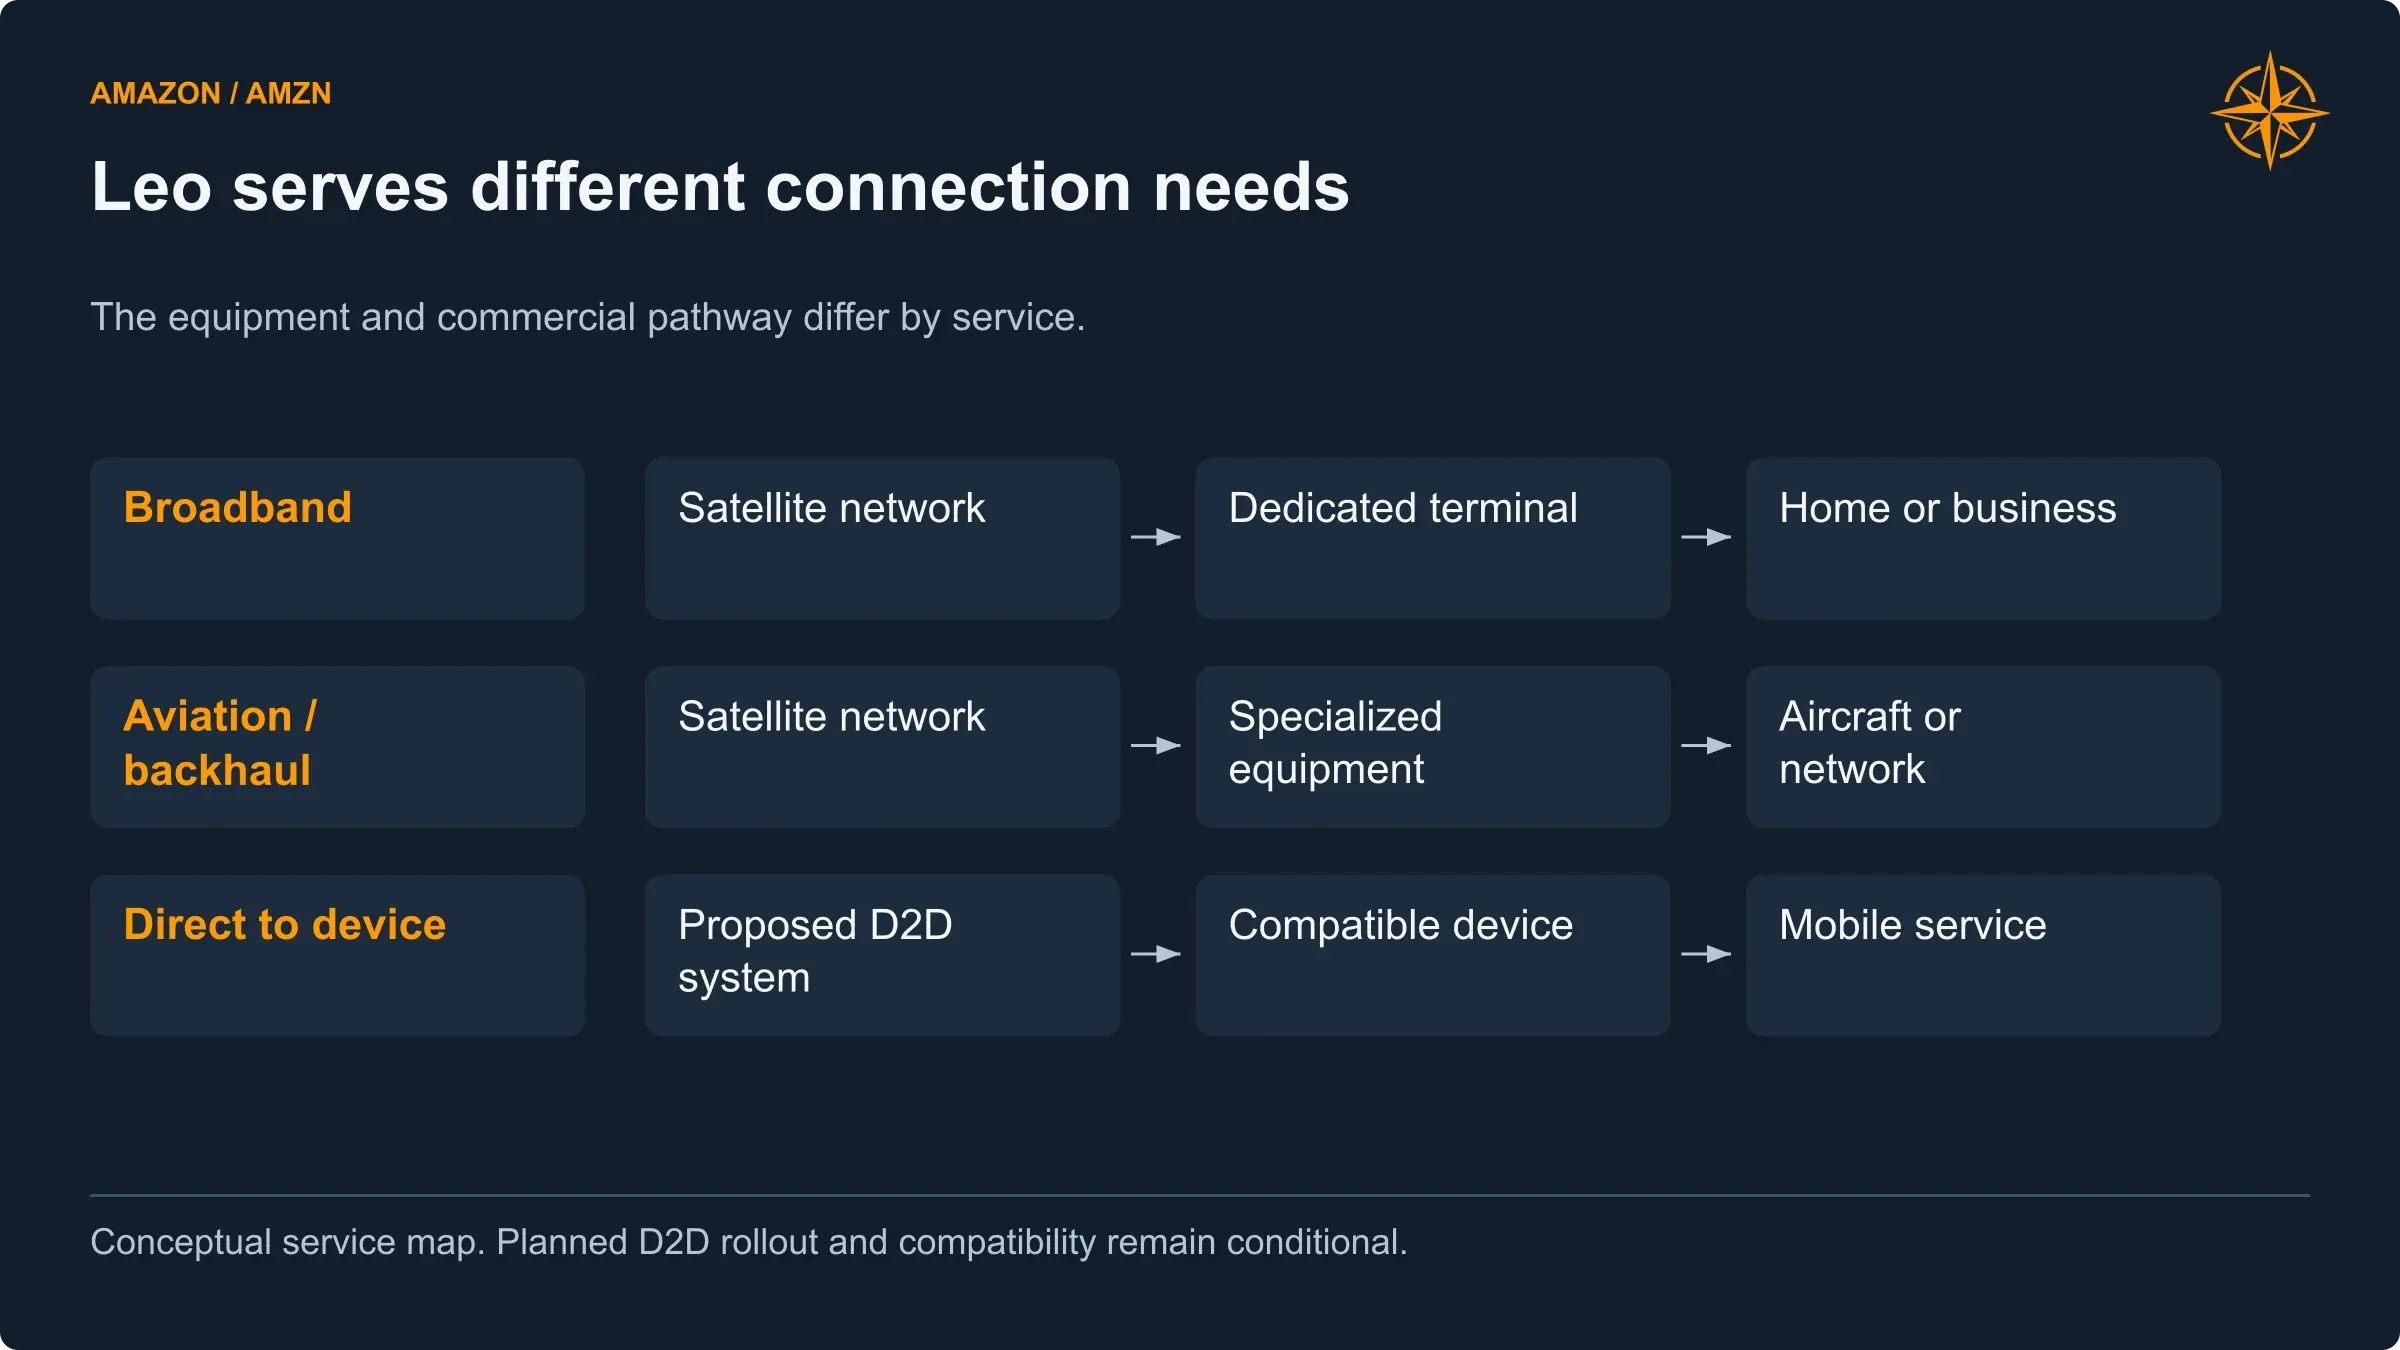
Terminal-based broadband, aviation and backhaul, and proposed direct-to-device services require different equipment and commercial arrangements.
Leo central forecast | 2026E | 2027E | 2028E | 2029E | 2030E |
|---|---|---|---|---|---|
Broadband revenue | 0.012 | 0.265 | 0.988 | 2.195 | 3.830 |
Enterprise, government and backhaul | 0.100 | 0.600 | 1.700 | 3.100 | 4.600 |
Aviation | 0 | 0.015 | 0.065 | 0.180 | 0.360 |
New direct-to-device services | 0 | 0 | 0.150 | 1.100 | 3.000 |
Acquired Globalstar legacy services | 0 | 0.160 | 0.370 | 0.430 | 0.500 |
Hardware | 0.025 | 0.180 | 0.550 | 0.950 | 1.400 |
Total revenue | 0.137 | 1.220 | 3.823 | 7.955 | 13.690 |
Operating income | (4.135) | (3.088) | (2.446) | (0.965) | 1.492 |
Net cash capital expenditure | 2.000 | 5.500 | 7.000 | 8.500 | 10.000 |
Northwise estimates. Future service prices and customer adoption are assumptions, not disclosed contract terms.
Broadband revenue is built from average billed accounts, not year-end installations. Our forecast grows from 15,000 average accounts in 2026 to 5.6 million in 2030, while monthly net revenue per account declines from $65 to $57. The 2030 calculation is therefore approximately $3.83 billion of annual broadband revenue.
Enterprise, government and mobile-network backhaul contribute $4.6 billion by 2030. These customers provide a different route to scale from signing up households one at a time, but the public disclosures do not support a contract-by-contract reconstruction of that revenue. It remains an explicit top-line assumption.
Direct-to-device services are a separate opportunity from broadband delivered through a dedicated terminal. Amazon has proposed up to 5,105 additional D2D satellites, with deployment beginning in 2028, and has announced an agreement supporting compatible Apple devices and future satellite services. The proposal does not establish completed deployment, universal coverage or a wholesale payment rate. (Amazon News)
Our $3 billion D2D forecast is equivalent to roughly 150 million covered-device equivalents generating $1.67 a month. That is a way to understand the scale of the assumption, not a claim that Apple has agreed to pay that amount or that each device owner will buy a separate retail subscription.
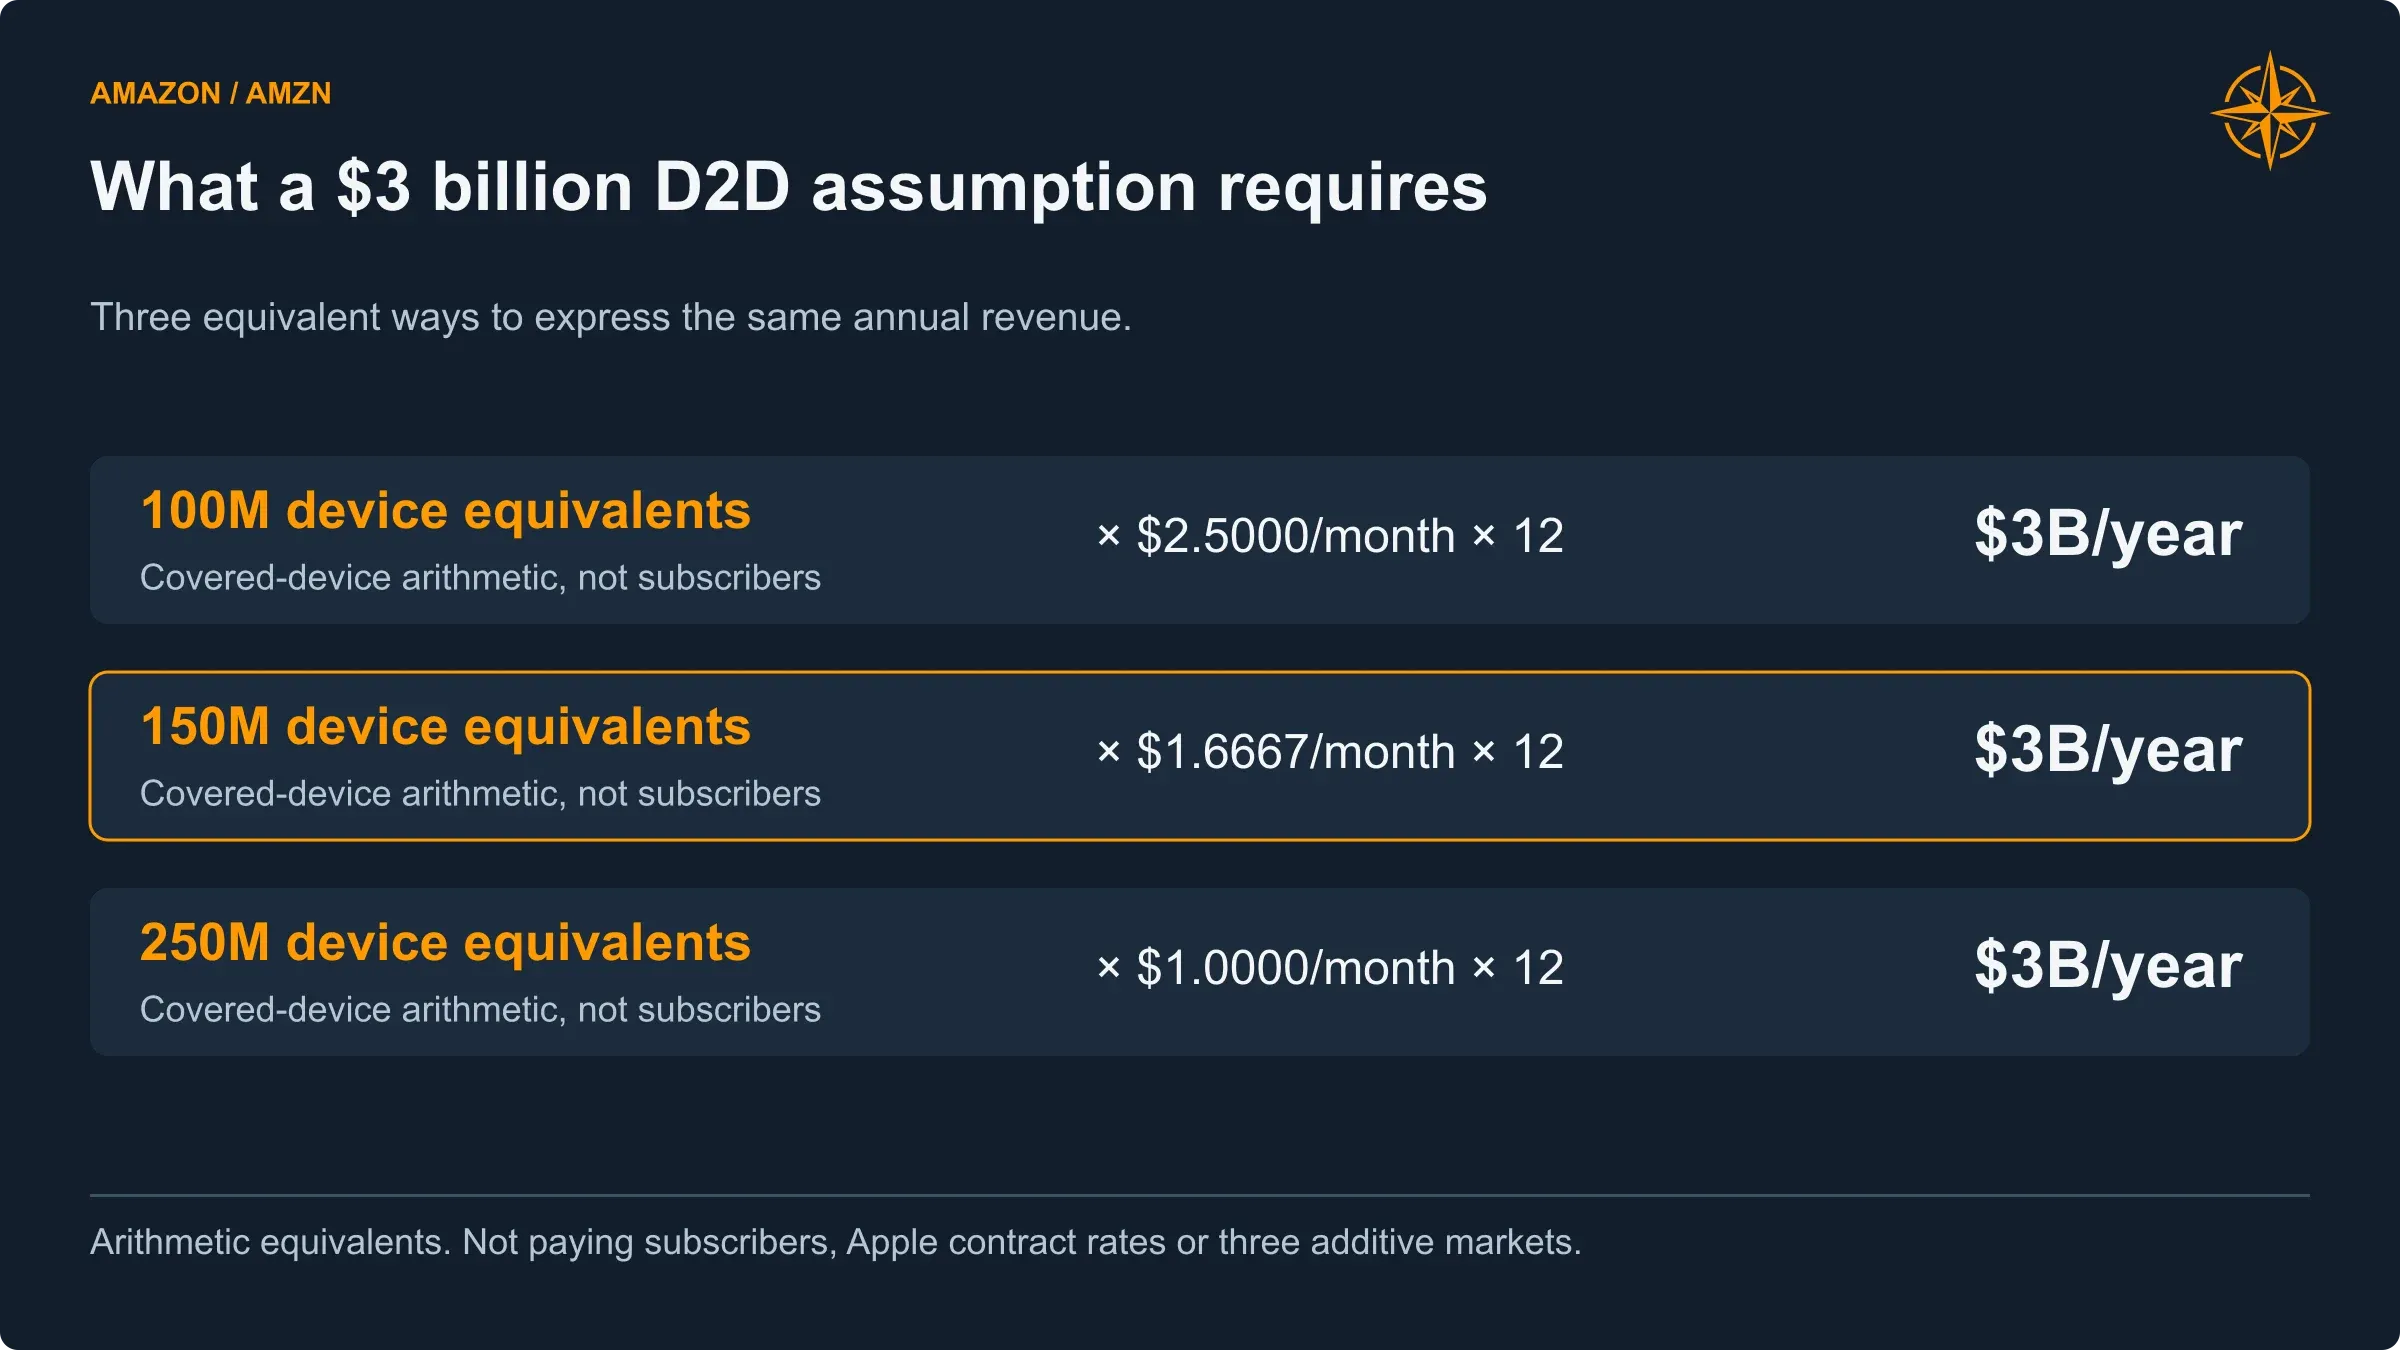
The $3 billion annual forecast is equivalent to 150 million covered-device equivalents at about $1.67 a month. Public disclosures do not establish that rate.
Likewise, the $360 million aviation forecast is equivalent to 1,800 average installed aircraft generating $200,000 annually. The illustration makes the commercial requirement tangible; it is not a disclosed aircraft-level contract schedule.
The operating model includes service delivery, terminals, personnel, ground infrastructure and depreciation. Hardware is initially sold below its modeled cost, with hardware costs equal to 105% of related revenue. Satellites and capitalized launch costs use a seven-year life, while ground infrastructure uses twelve years.
Leo remains loss-making through 2029 in our central forecast and produces only about $1.5 billion of operating income in 2030, while spending $10 billion of cash capital. Calling it a promising business should not require pretending it has already become a profitable one.
There is also an accounting transition ahead. Amazon has been expensing much of its satellite-development and launch spending and expects to capitalize certain costs once commercial viability is established. Moving an expenditure onto the balance sheet can improve current reported profit without improving the cash economics of the expenditure itself.
What Globalstar adds, and what Amazon has to pay
Globalstar expands the service opportunity through existing satellite operations, infrastructure and spectrum rights. It also brings a transaction whose cash requirements extend beyond the headline consideration for common shares. (Amazon News) (SEC)
The announced terms allow Globalstar shareholders to elect $90 in cash or Amazon shares, subject to the exchange terms, with aggregate cash elections capped at 40%. The approximately $10.9 billion announced value included debt and was measured at the time of the agreement. Closing is expected in 2027, subject to approvals and other conditions.
Our forecast assumes a mid-2027 close and approximately 25.4 million new Amazon shares. The modeled cash requirement is:
Globalstar closing cash estimate | Amount |
|---|---|
Common-share cash consideration | 4.752 |
Preferred-share payment | 0.152 |
Customer special-purpose-entity redemption allowance | 0.400 |
Initial customer-settlement allowance | 1.000 |
Transaction fees | 0.150 |
Less acquired cash | (0.400) |
Net closing cash requirement | 6.054 |
Northwise transaction estimates. The redemption and customer-settlement allowances are not confirmed final contractual payment amounts.
We also include $0.4 billion of assumed debt, acquired assets and amortization, and $0.25 billion of subsequent customer settlements. Transaction fees are expensed once; acquired customer liabilities are not treated as an excuse to recognize both revenue and a second cash receipt for payments collected before Amazon owned the business.
The precise closing amounts remain a source of uncertainty. That uncertainty is manageable only if it is visible in the funding schedule rather than hidden behind the strategic appeal of the acquisition.
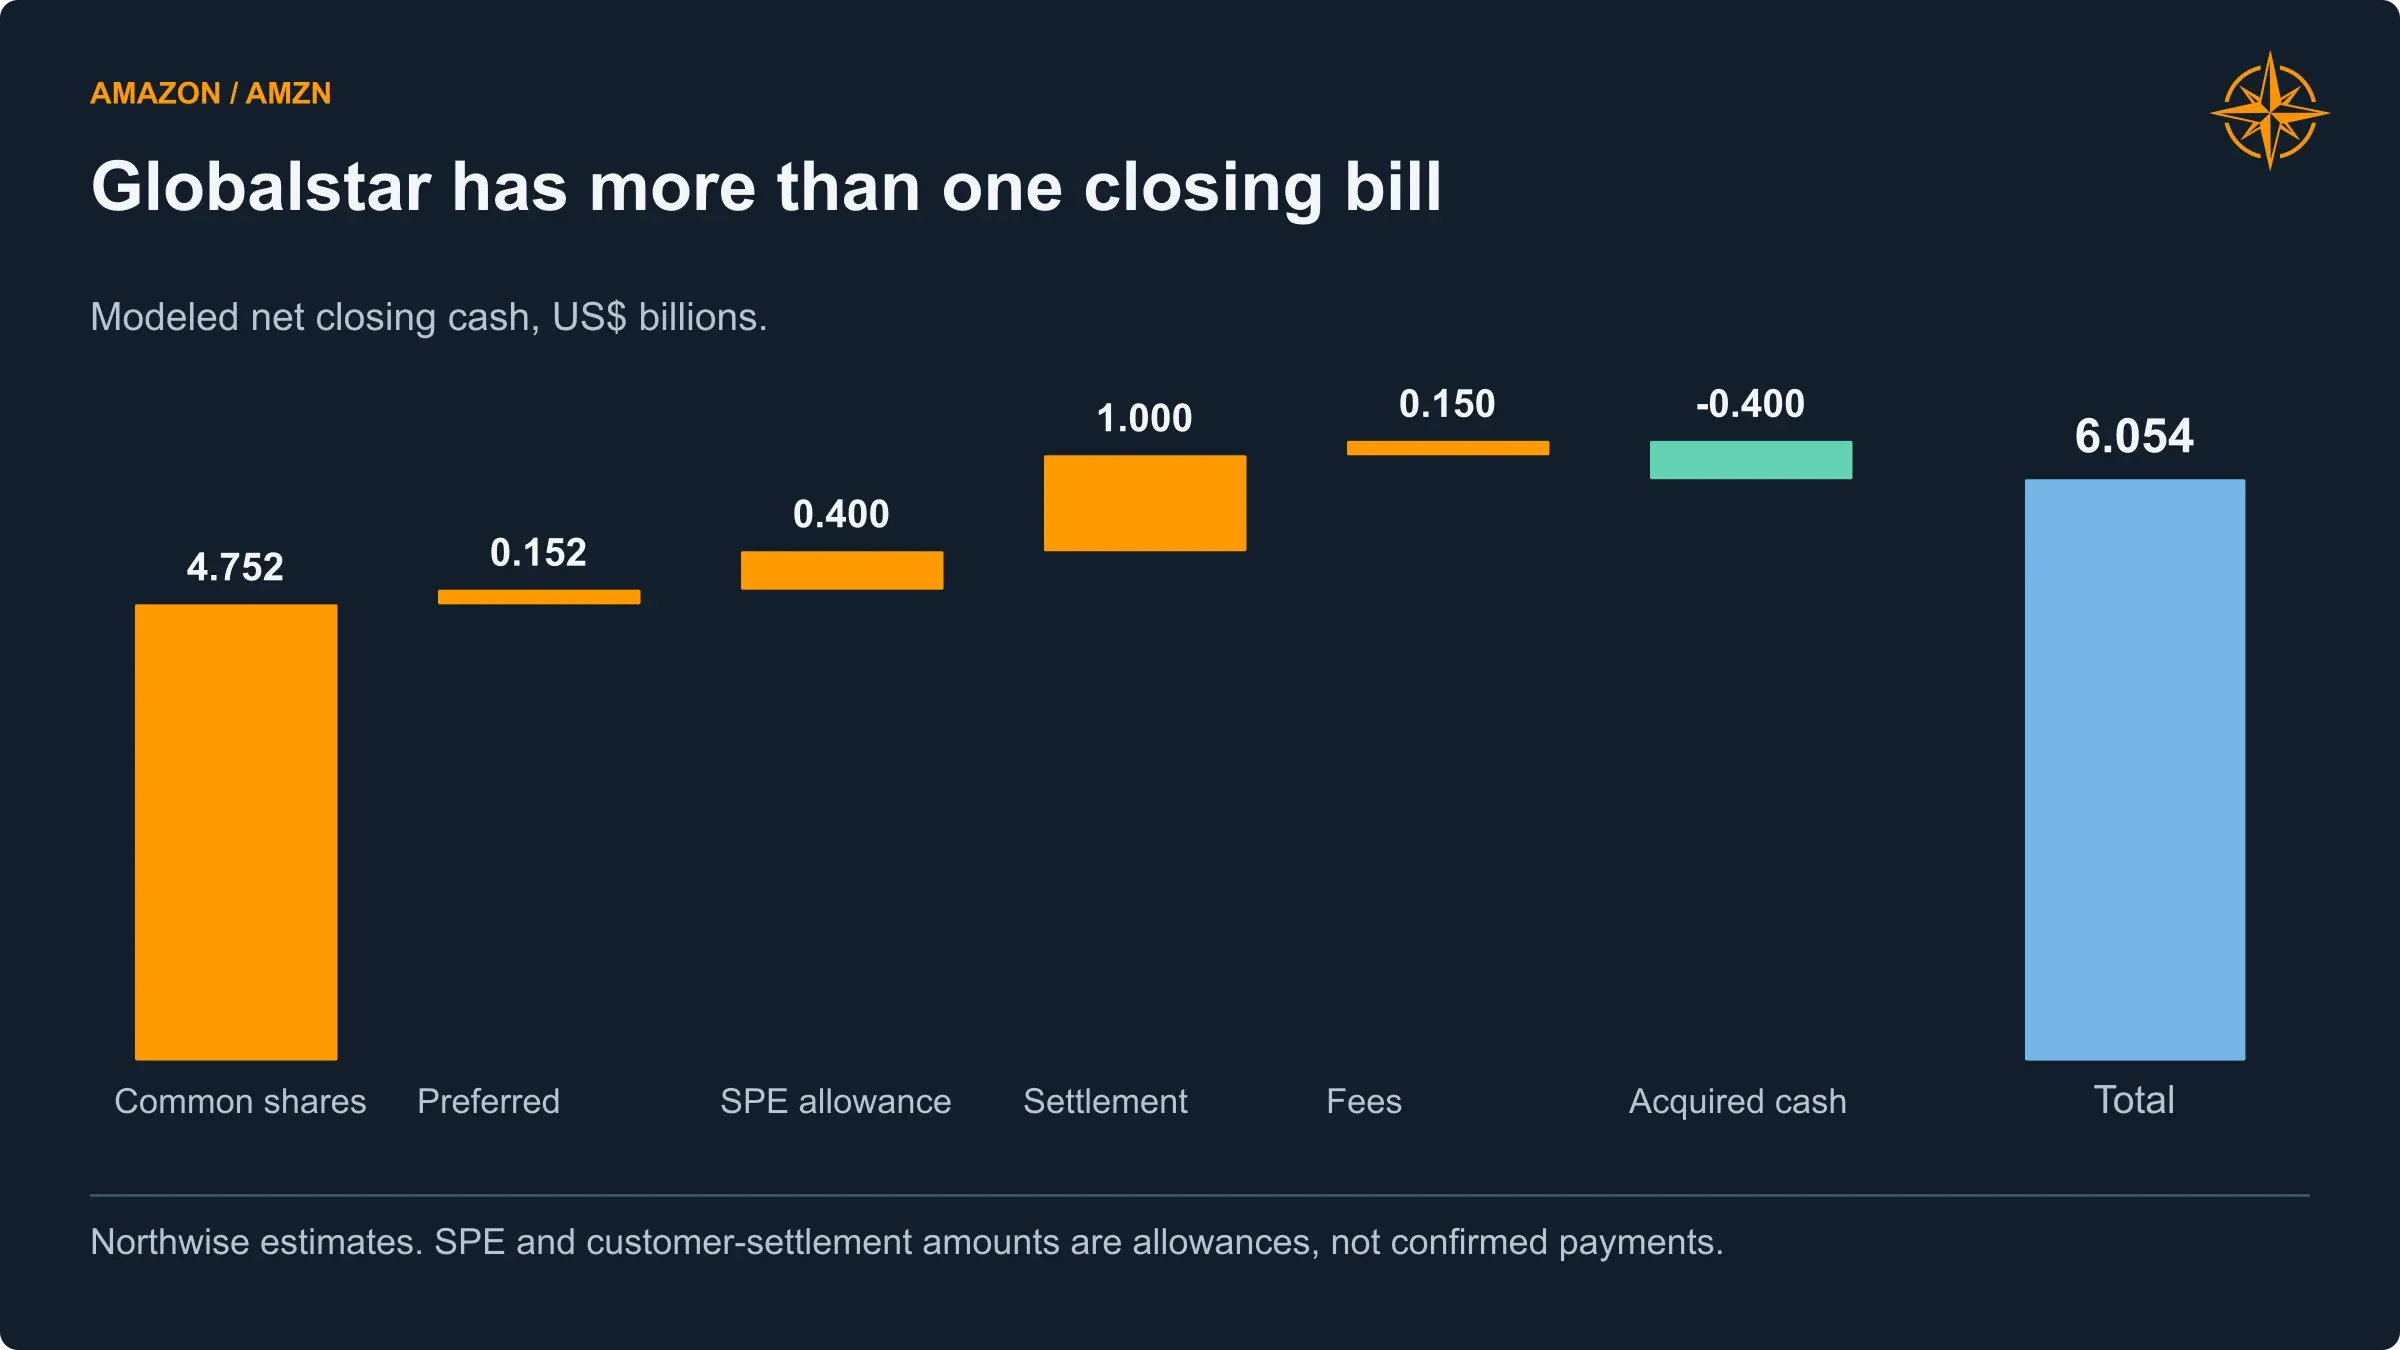
The modeled closing cash requirement is $6.054 billion, including fees. Stock issuance, assumed debt and later settlements are separate.
Zoox has to earn each ride
Zoox presents a different version of the same challenge: making something work technically is not the same as operating it economically at scale.
The July federal exemption allowed commercial deployment of up to 2,500 purpose-built vehicles annually for two years. It removed an important barrier, but it was not unlimited national authorization. Our larger deployment assumptions beyond that period require further permission and operating execution. (NHTSA)
The Uber partnership offers an additional route to customers alongside Zoox’s own app. Its announced rollout covers Las Vegas and a planned Los Angeles launch. Distribution can help fill a vehicle, but the agreement does not disclose a guaranteed ride volume or a commission we can simply insert into the forecast. (Uber Investor Relations)
The business therefore needs three separate measures of scale: vehicles produced during the year, the fleet owned at year-end, and vehicles commercially active on average throughout the year.
Zoox central forecast | 2026E | 2027E | 2028E | 2029E | 2030E |
|---|---|---|---|---|---|
Vehicles produced during the year | 300 | 2,500 | 7,500 | 15,000 | 25,000 |
Year-end fleet | 300 | 2,800 | 10,300 | 25,300 | 50,300 |
Average commercially active fleet | 50 | 1,200 | 5,500 | 15,000 | 33,000 |
Paid rides per active vehicle per day | 10 | 15 | 20 | 24 | 26 |
Average fare | $22.00 | $22.00 | $21.50 | $21.00 | $20.50 |
Revenue | 0.004 | 0.145 | 0.863 | 2.759 | 6.420 |
Operating income | (1.501) | (1.619) | (1.589) | (0.973) | 0.683 |
Net cash capital expenditure | 0.404 | 0.788 | 1.575 | 2.350 | 3.275 |
Northwise estimates. Later production and commercial deployment require expanded capacity and permissions.
In 2030, 33,000 average active vehicles completing twenty-six paid rides a day at a $20.50 average fare generate approximately $6.42 billion of revenue. That represents 313 million annual rides. The year-end fleet is larger because not every vehicle is available for paid service throughout the entire year.
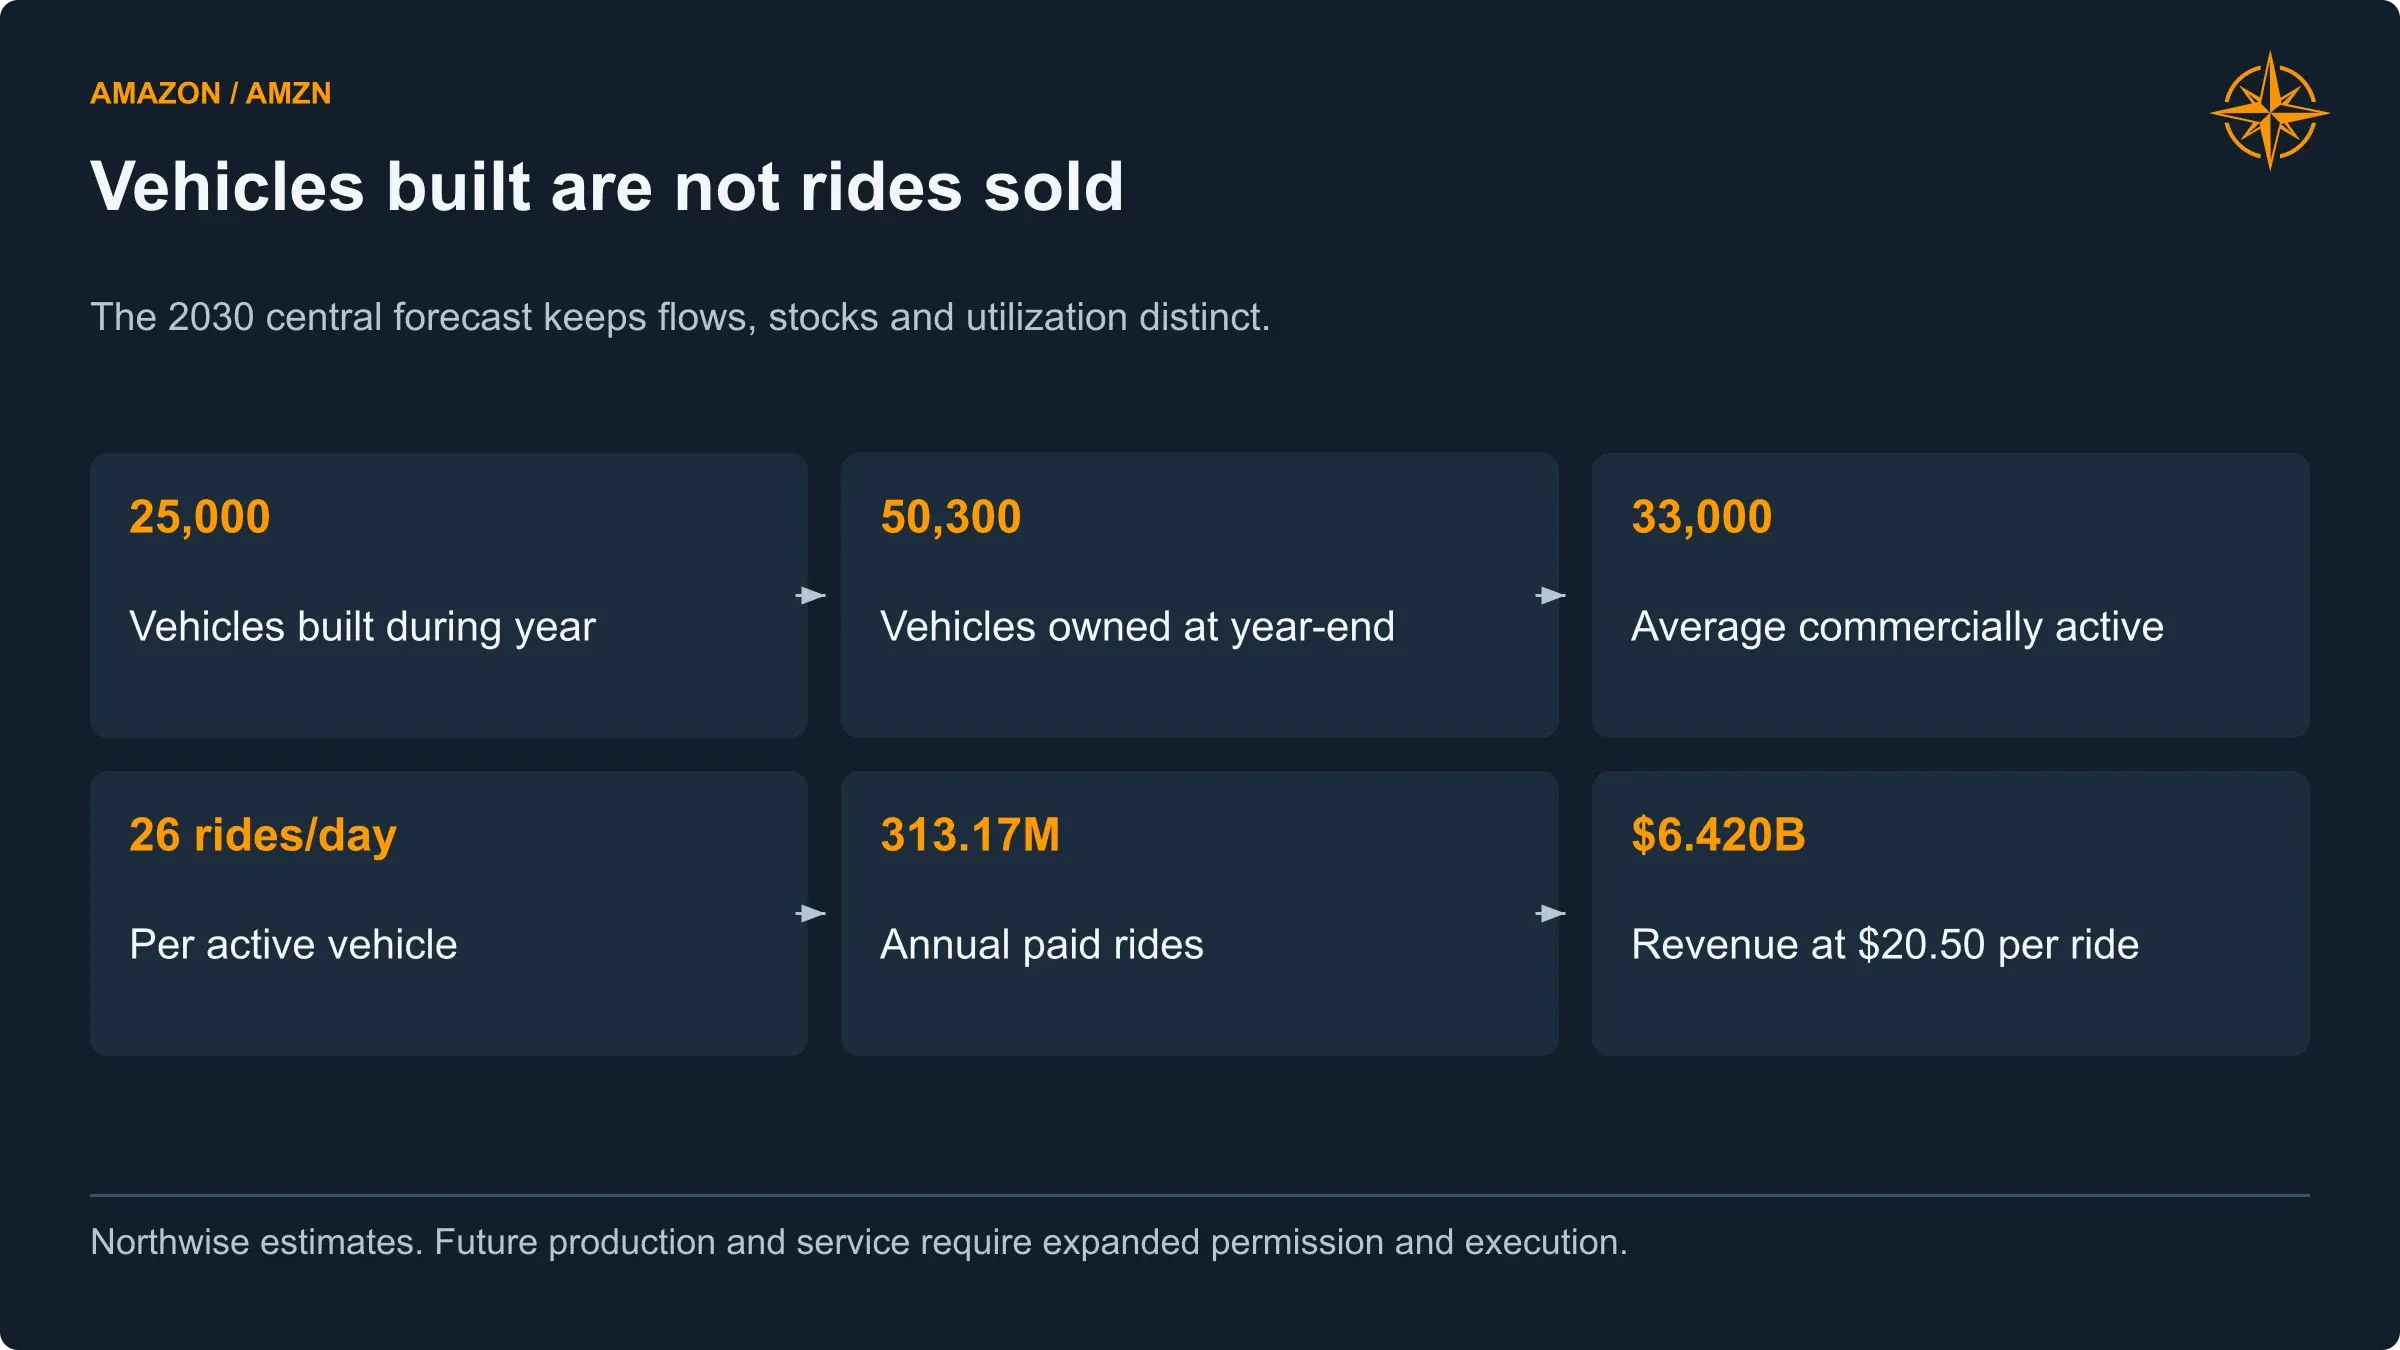
The central forecast uses 33,000 average active vehicles and 26 paid rides per day to produce 313 million annual rides. The 50,300 year-end fleet is a different measure.
A driverless car still has plenty of bills. Cleaning, charging, maintenance, insurance, customer support, remote assistance, depot operations and vehicle replacement all remain relevant. A car can be technically available without being conveniently located for the next paying customer.
We assume operating cost per ride declines from $16 in 2026 to $7 in 2030, before vehicle depreciation and distribution fees. A separate 7% blended distribution charge recognizes that customers acquired through a partner need not cost the same as customers using Zoox directly. That is our estimate, not an announced Uber rate.
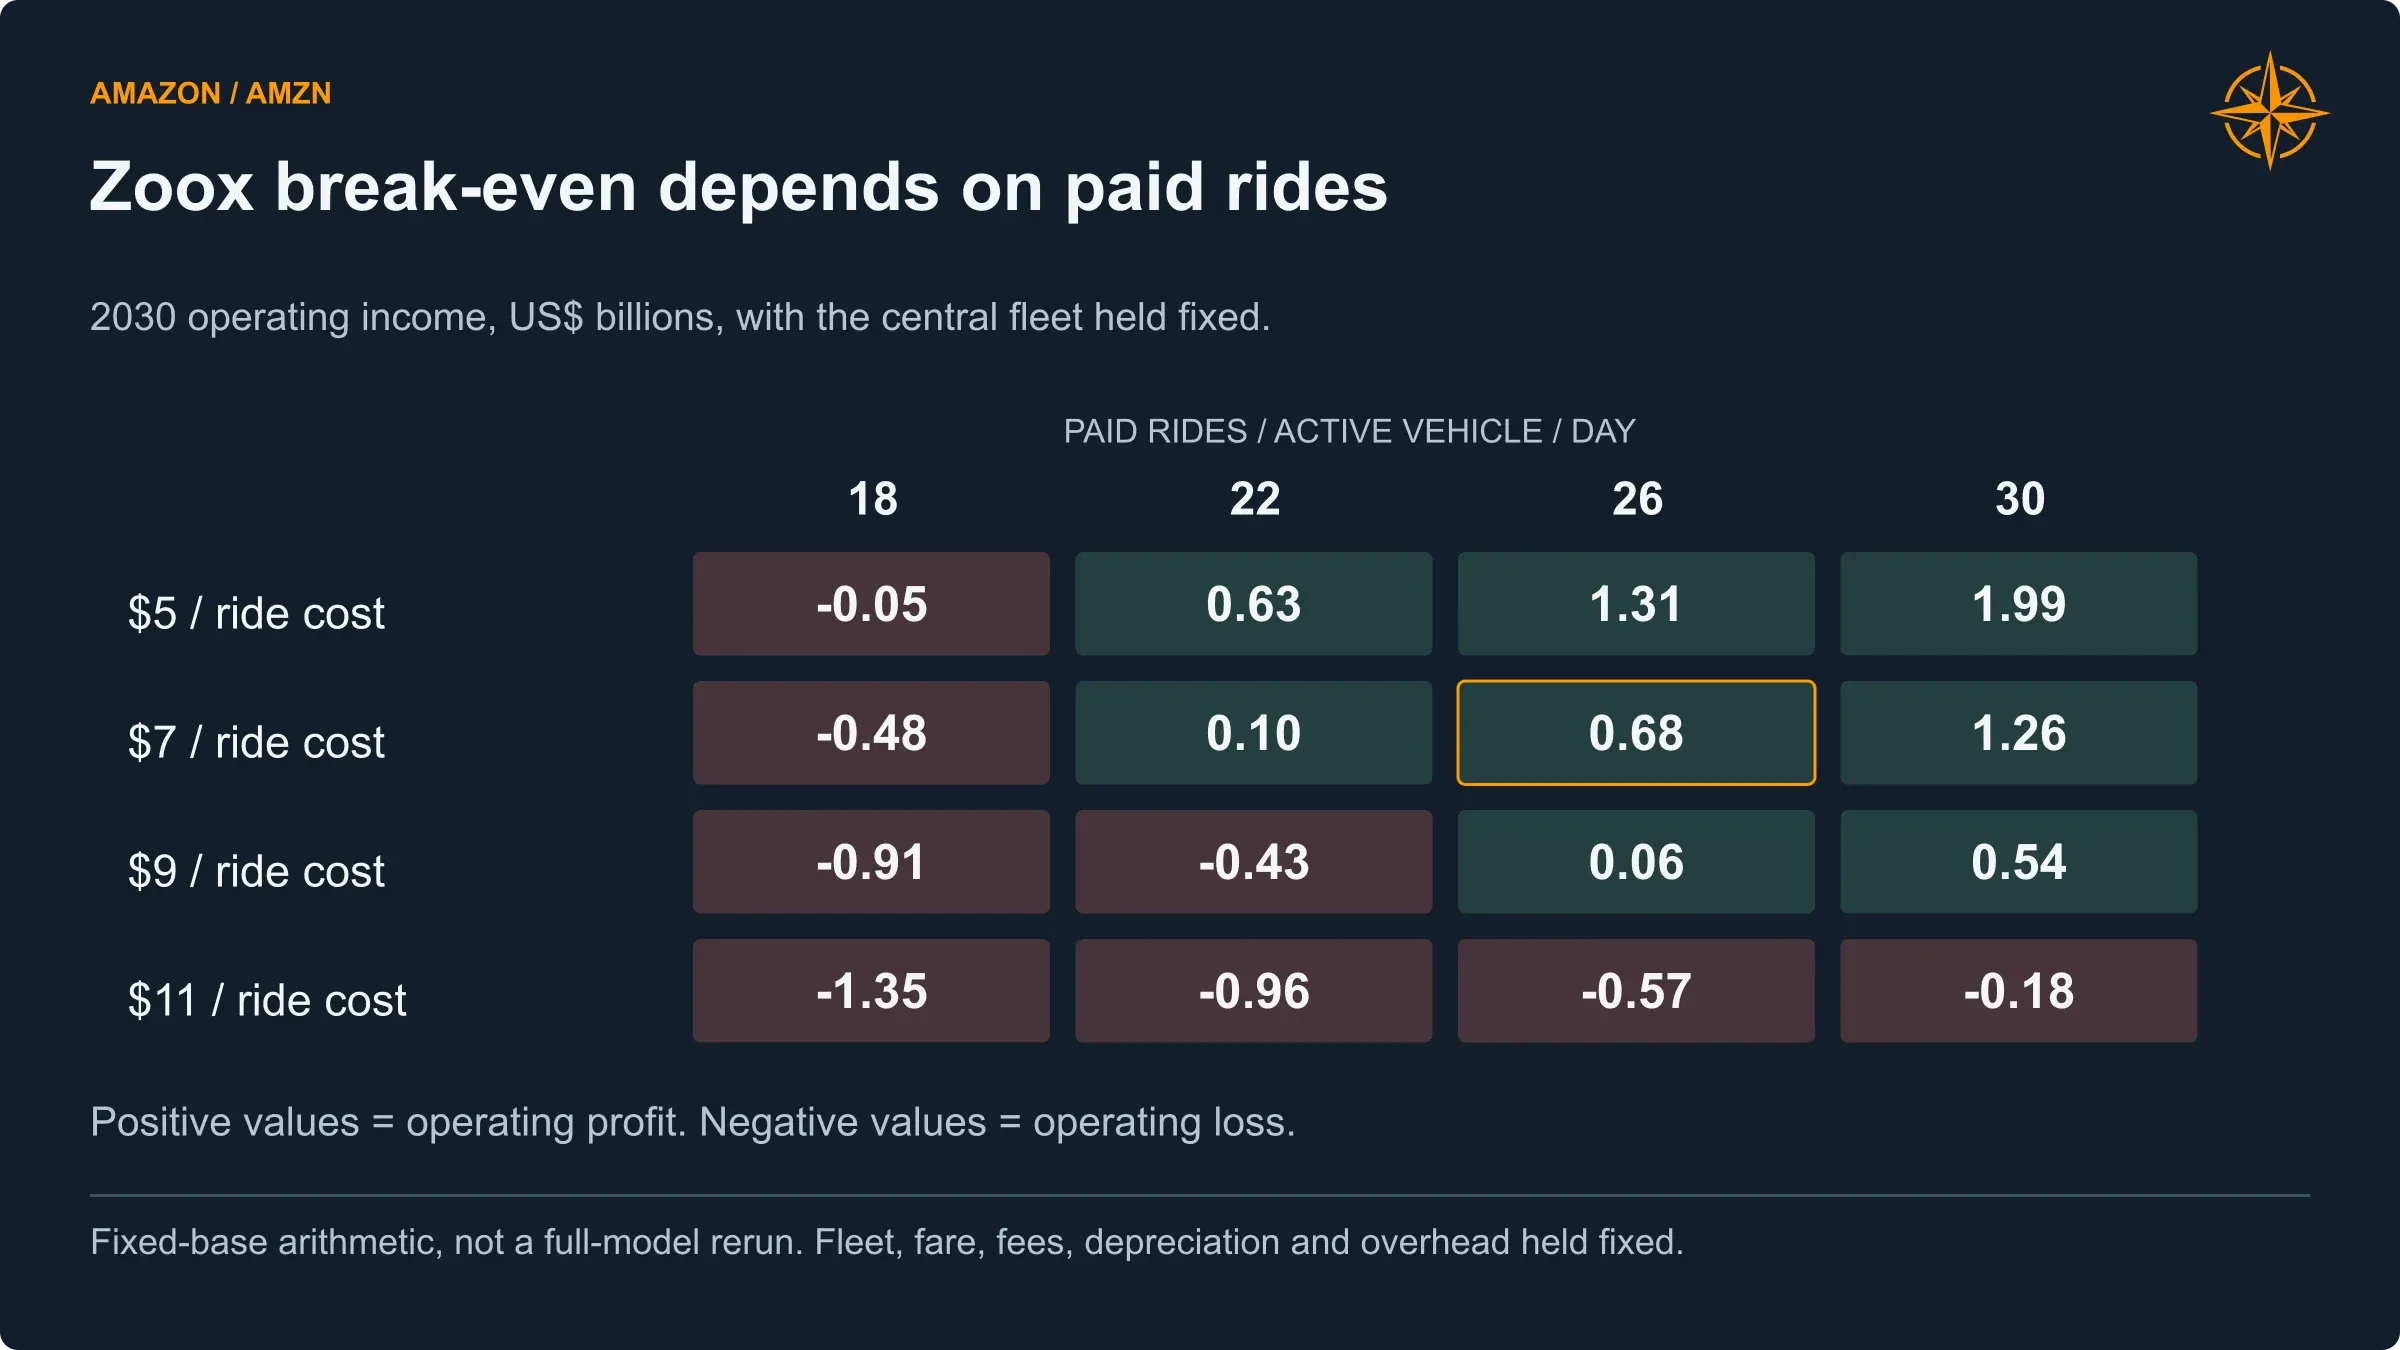
At 33,000 active vehicles, changes in daily paid rides and cost per ride can move Zoox between profit and loss. This illustration does not rerun financing or valuation.
Fixed engineering and administration rise to $1.95 billion by 2030. Vehicle acquisition cost falls from an estimated $180,000 to $95,000, while factory and depot investment is funded separately. The result is a business that reaches operating profitability in 2030 but is still spending much more on new capital than it earns in operating income.
We regard Zoox as worth modeling seriously because commercial progress changes what is possible. We do not regard the removal of a human driver as proof of an attractive return. Paid utilization and the cost of serving each ride will decide that.
What the growth means for Amazon’s accounts
The individual business forecasts produce a company increasingly weighted toward services and infrastructure, but not one in which retail disappears.
Revenue
Central revenue forecast | 2026E | 2027E | 2028E | 2029E | 2030E |
|---|---|---|---|---|---|
Online stores | 297.0 | 329.7 | 364.3 | 400.7 | 438.8 |
Physical stores | 23.5 | 24.7 | 25.9 | 27.2 | 28.3 |
Third-party seller services | 190.0 | 216.6 | 246.9 | 279.0 | 312.5 |
Advertising | 84.5 | 104.8 | 128.9 | 155.9 | 185.6 |
Subscription services | 55.5 | 62.7 | 70.2 | 78.0 | 85.8 |
Other, excluding Leo and Zoox | 7.4 | 9.0 | 11.0 | 13.1 | 15.5 |
Leo | 0.1 | 1.2 | 3.8 | 8.0 | 13.7 |
Zoox | <0.1 | 0.1 | 0.9 | 2.8 | 6.4 |
AWS | 178.8 | 251.0 | 340.9 | 443.6 | 556.4 |
Consolidated revenue | 836.8 | 999.8 | 1,192.8 | 1,408.3 | 1,643.0 |
Northwise estimates. Totals use unrounded values.
The 2026 forecast incorporates first-half actuals rather than extrapolating a recent quarter across the entire year.
That requires separating operating progress from accounting benefits and seasonal timing. Second-quarter operating income included a $640 million tariff refund and $551 million energy-derivative gain. Removing those items leaves approximately $26.27 billion of operating income, still a strong result. The first-half energy gain was $599 million, so the corresponding first-half normalized operating-income anchor is $50.07 billion, not a mechanical doubling of the quarterly adjustment. (Amazon Q2 10-Q).
Prime Day moved into the second quarter in most of Amazon’s largest markets. Management said that excluding Prime Day from both years would make its third-quarter revenue-growth guidance nearly four percentage points higher. A slower reported third-quarter growth comparison should therefore not be interpreted as an equivalent change in underlying customer demand.
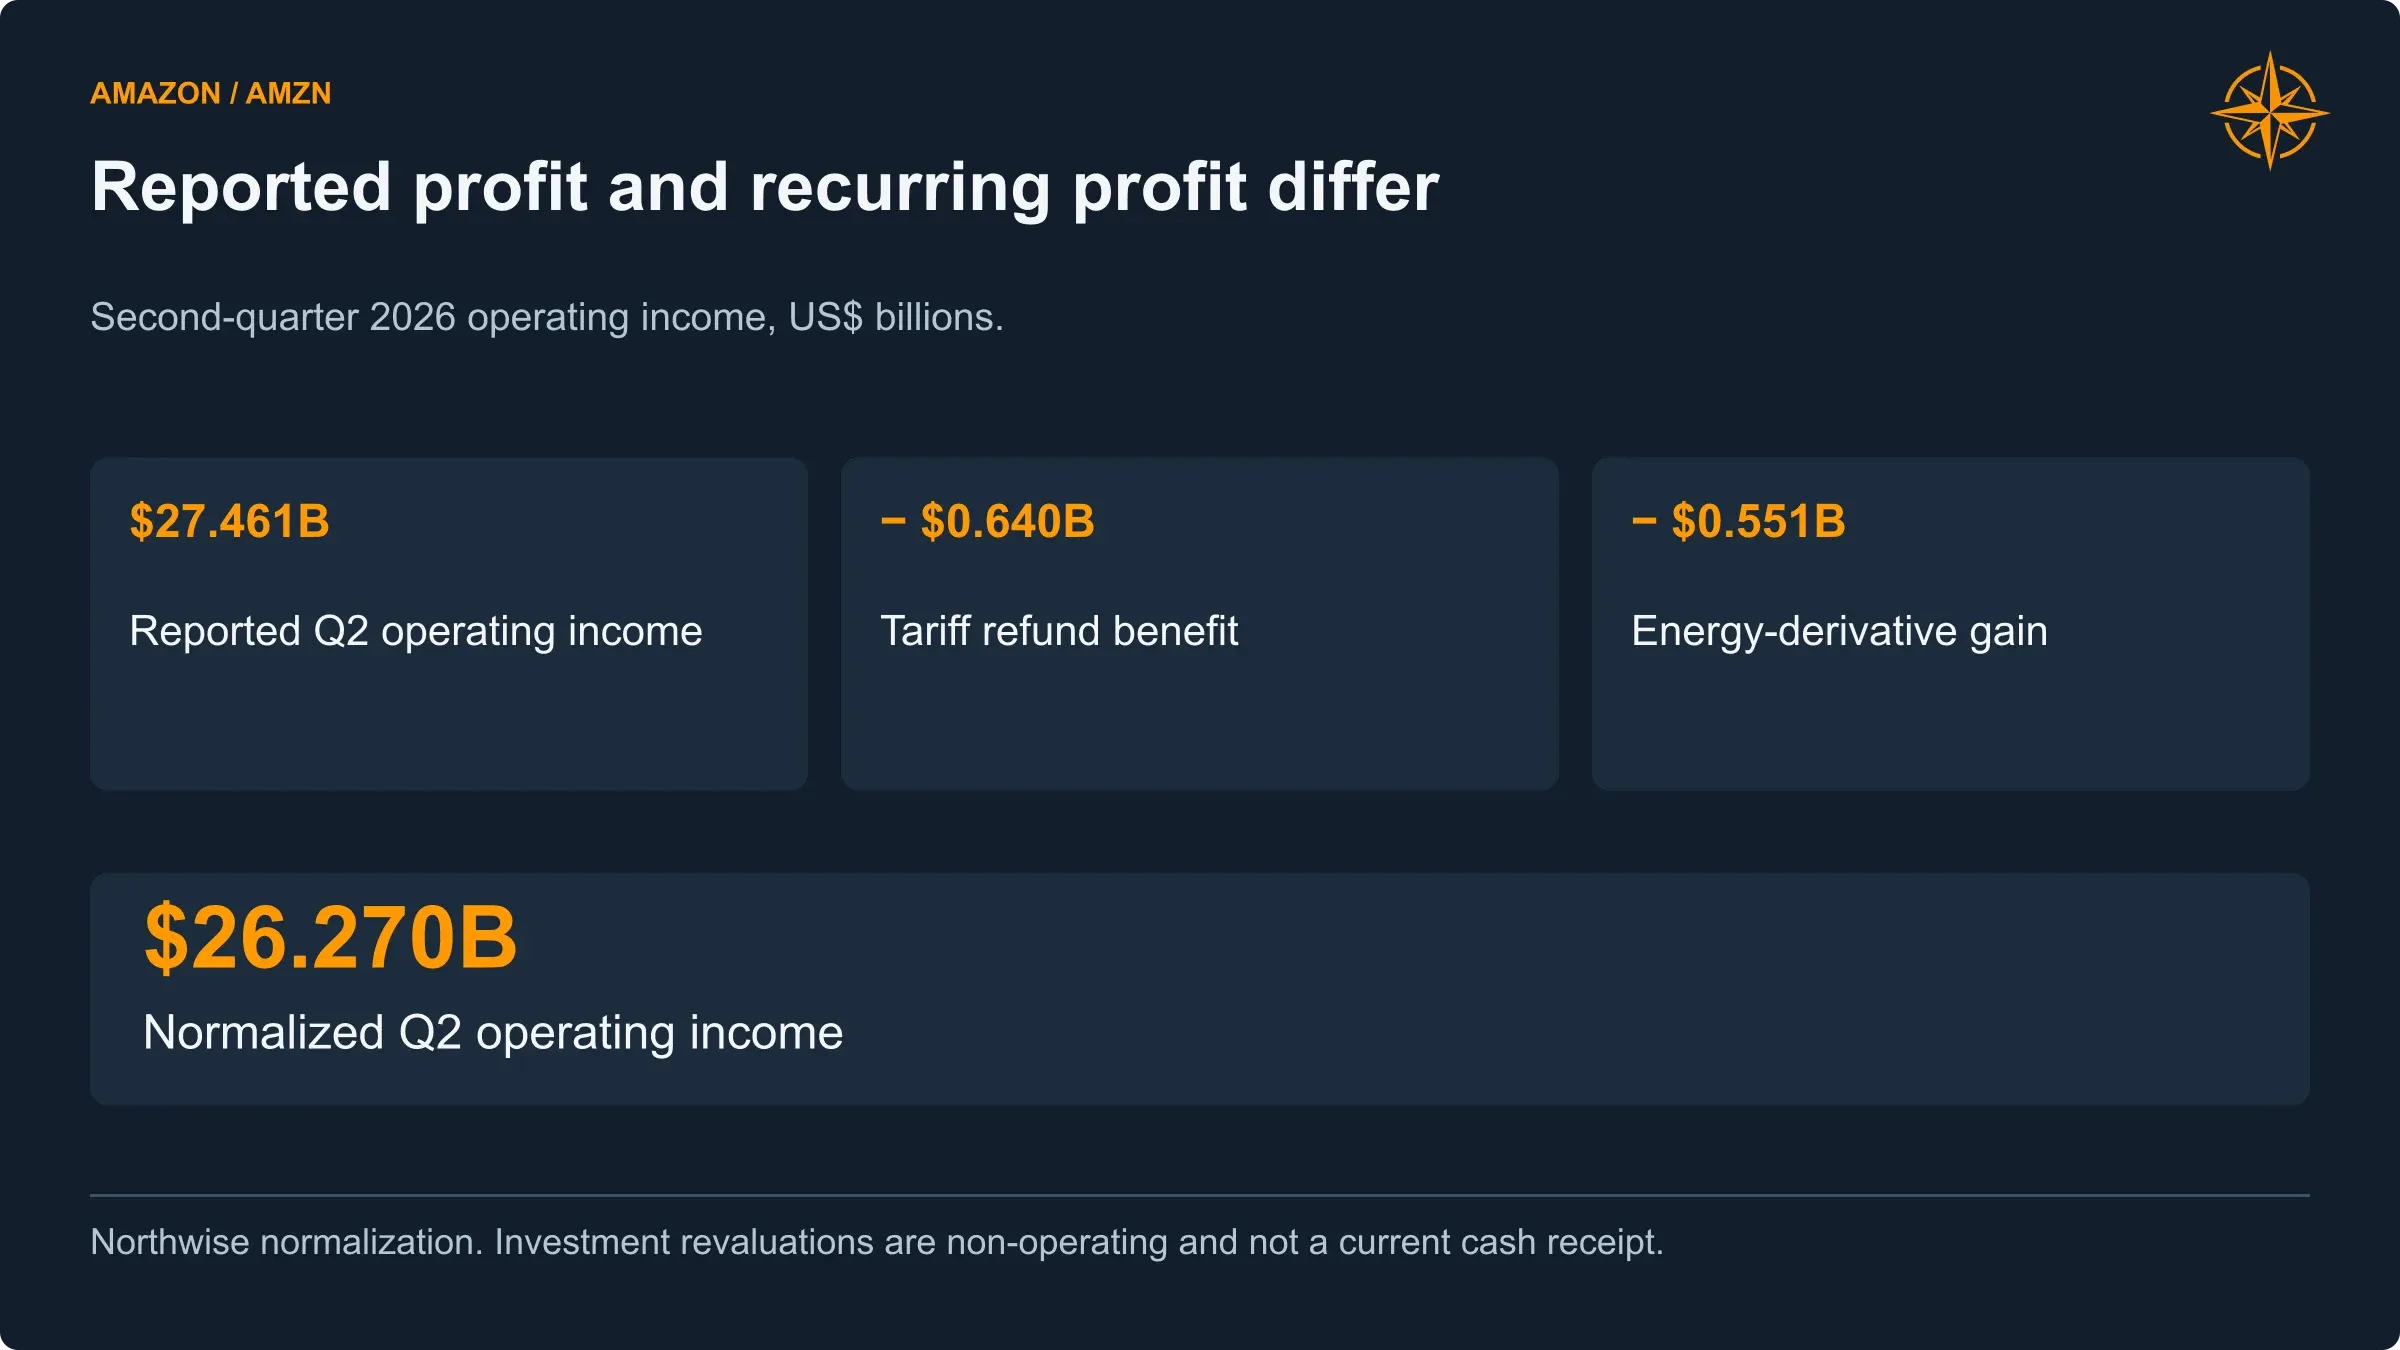
Removing the identified tariff and energy-contract benefits reduces Q2 operating income from $27.461 billion to $26.270 billion. Investment revaluations belong in a separate analysis.
Operating profit and earnings
Central income statement | 2026E | 2027E | 2028E | 2029E | 2030E |
|---|---|---|---|---|---|
AWS operating income | 67.3 | 87.1 | 116.6 | 159.5 | 204.6 |
Advertising operating income | 35.5 | 43.5 | 54.6 | 67.1 | 81.0 |
North America commerce operating income | 15.7 | 16.8 | 25.2 | 35.1 | 38.9 |
International commerce operating income | (1.3) | (0.6) | 2.3 | 5.7 | 7.5 |
Leo operating income | (4.1) | (3.1) | (2.4) | (1.0) | 1.5 |
Zoox operating income | (1.5) | (1.6) | (1.6) | (1.0) | 0.7 |
Normalized operating income | 111.6 | 142.1 | 194.7 | 265.4 | 334.1 |
Operating margin | 13.3% | 14.2% | 16.3% | 18.8% | 20.3% |
Interest expense | (5.2) | (7.3) | (9.4) | (9.6) | (8.7) |
Interest income | 4.3 | 3.0 | 2.7 | 2.6 | 3.9 |
Normalized pretax income | 110.8 | 137.8 | 188.1 | 258.5 | 329.3 |
Normalized income-tax expense | (24.4) | (30.3) | (41.4) | (56.9) | (72.4) |
Normalized net income | 86.4 | 107.5 | 146.7 | 201.6 | 256.9 |
Average diluted shares, billions | 10.916 | 11.029 | 11.137 | 11.232 | 11.326 |
Normalized diluted EPS | $7.92 | $9.75 | $13.17 | $17.95 | $22.68 |
Commerce operating profits exclude the separately shown advertising and emerging businesses. All operating profits include allocated costs and depreciation.
AWS and advertising together account for approximately 85% of our 2030 operating income, despite representing about 45% of revenue. That is where the forecast’s earnings concentration lies. Leo and Zoox broaden the opportunity, but they do not rescue the consolidated model from a fundamentally weak cloud outcome.
Normalized earnings also need to be kept separate from the large investment gains in reported results. Amazon recorded $69.1 billion of other income in the first half, including substantial upward adjustments to private-company investments. Those gains may reflect valuable assets, but they are not recurring cloud or retail earnings.
Our 2026 reported-basis projection is approximately $140.0 billion of net income and $12.83 of diluted EPS, assuming no additional speculative revaluations. The normalized figures are $86.4 billion and $7.92. The subsequent decline from reported-basis 2026 EPS to 2027 does not represent an equivalent deterioration in the operating business; it reflects not repeating those gains.
Taxes, working capital and ownership
We use a 22% normalized income-tax rate, with a separate cash-tax schedule that reflects timing differences during the investment cycle. Modeled cash taxes reach $59.3 billion in 2030, compared with $72.4 billion of normalized tax expense. That difference is a forecast of timing and deductions, not a permanent tax exemption.
Working capital is similarly explicit. Inventory scales with online-store activity. Receivables vary by business, including assumed collection periods of fifty-two days for AWS and sixty-five days for advertising. Operating payables and deferred service revenue help finance growth, but capital-equipment payables remain separate. The forecast produces a modest $3.6 billion operating working-capital cash contribution in 2030, rather than an unlimited release of cash from growing supplier balances.
Stock compensation remains an expense and a source of dilution. We forecast $31 billion of annual stock-based compensation by 2030 and use an average diluted share count of 11.326 billion for that year’s EPS. There are no assumed buybacks to erase the dilution automatically.
The financing is part of the thesis
Amazon’s scale makes financing possible. It does not make financing irrelevant.
The June filing disclosed approximately $133.0 billion of long-term debt face value, including the current portion, and a subsequent $25 billion note issuance. A separate $17.5 billion delayed-draw facility was undrawn at June 30. Availability is not the same as cash already received. (Amazon Q2 10-Q, debt note).
Our model uses estimated borrowing-rate groups for existing debt, the July issuance and subsequent funding. New borrowing retains its assumed cost rather than reverting to an older, cheaper rate the following year. Interest income is based on interest-bearing liquidity, not every asset categorized as a marketable security.
The capital-allocation policy maintains an annual liquidity target of the greater of $65 billion or 8% of revenue and allows some later excess cash to reduce debt. Those are Northwise assumptions, not Amazon’s contractual covenants.
Cash flow and the uses that follow it
Central cash-flow and funding schedule | 2026E | 2027E | 2028E | 2029E | 2030E |
|---|---|---|---|---|---|
Operating cash flow | 179.7 | 236.1 | 309.9 | 394.1 | 490.3 |
Net cash capital expenditure | (220.0) | (283.8) | (329.6) | (366.4) | (401.3) |
Free cash flow | (40.3) | (47.7) | (19.7) | 27.7 | 89.1 |
Opening cash and marketable securities | 123.0 | 109.7 | 80.0 | 95.4 | 112.7 |
Investment funding | (61.1) | (7.5) | (7.5) | 0 | 0 |
Acquisition investment cash | 0 | (5.9) | 0 | 0 | 0 |
Subsequent customer settlements | 0 | 0 | (0.1) | (0.1) | 0 |
New borrowings | 92.0 | 42.4 | 56.1 | 2.4 | 0 |
Debt repayments | (2.8) | (8.0) | (10.0) | (9.0) | (37.1) |
Finance-lease and financing principal | (2.1) | (2.0) | (2.2) | (2.4) | (2.6) |
Share-tax cash withholding | (0.5) | (1.1) | (1.3) | (1.4) | (1.6) |
Other historical liquidity movements | 1.4 | 0 | 0 | 0 | 0 |
Ending cash and marketable securities | 109.7 | 80.0 | 95.4 | 112.7 | 160.5 |
Ending financial borrowings | 157.5 | 192.4 | 238.5 | 231.9 | 194.9 |
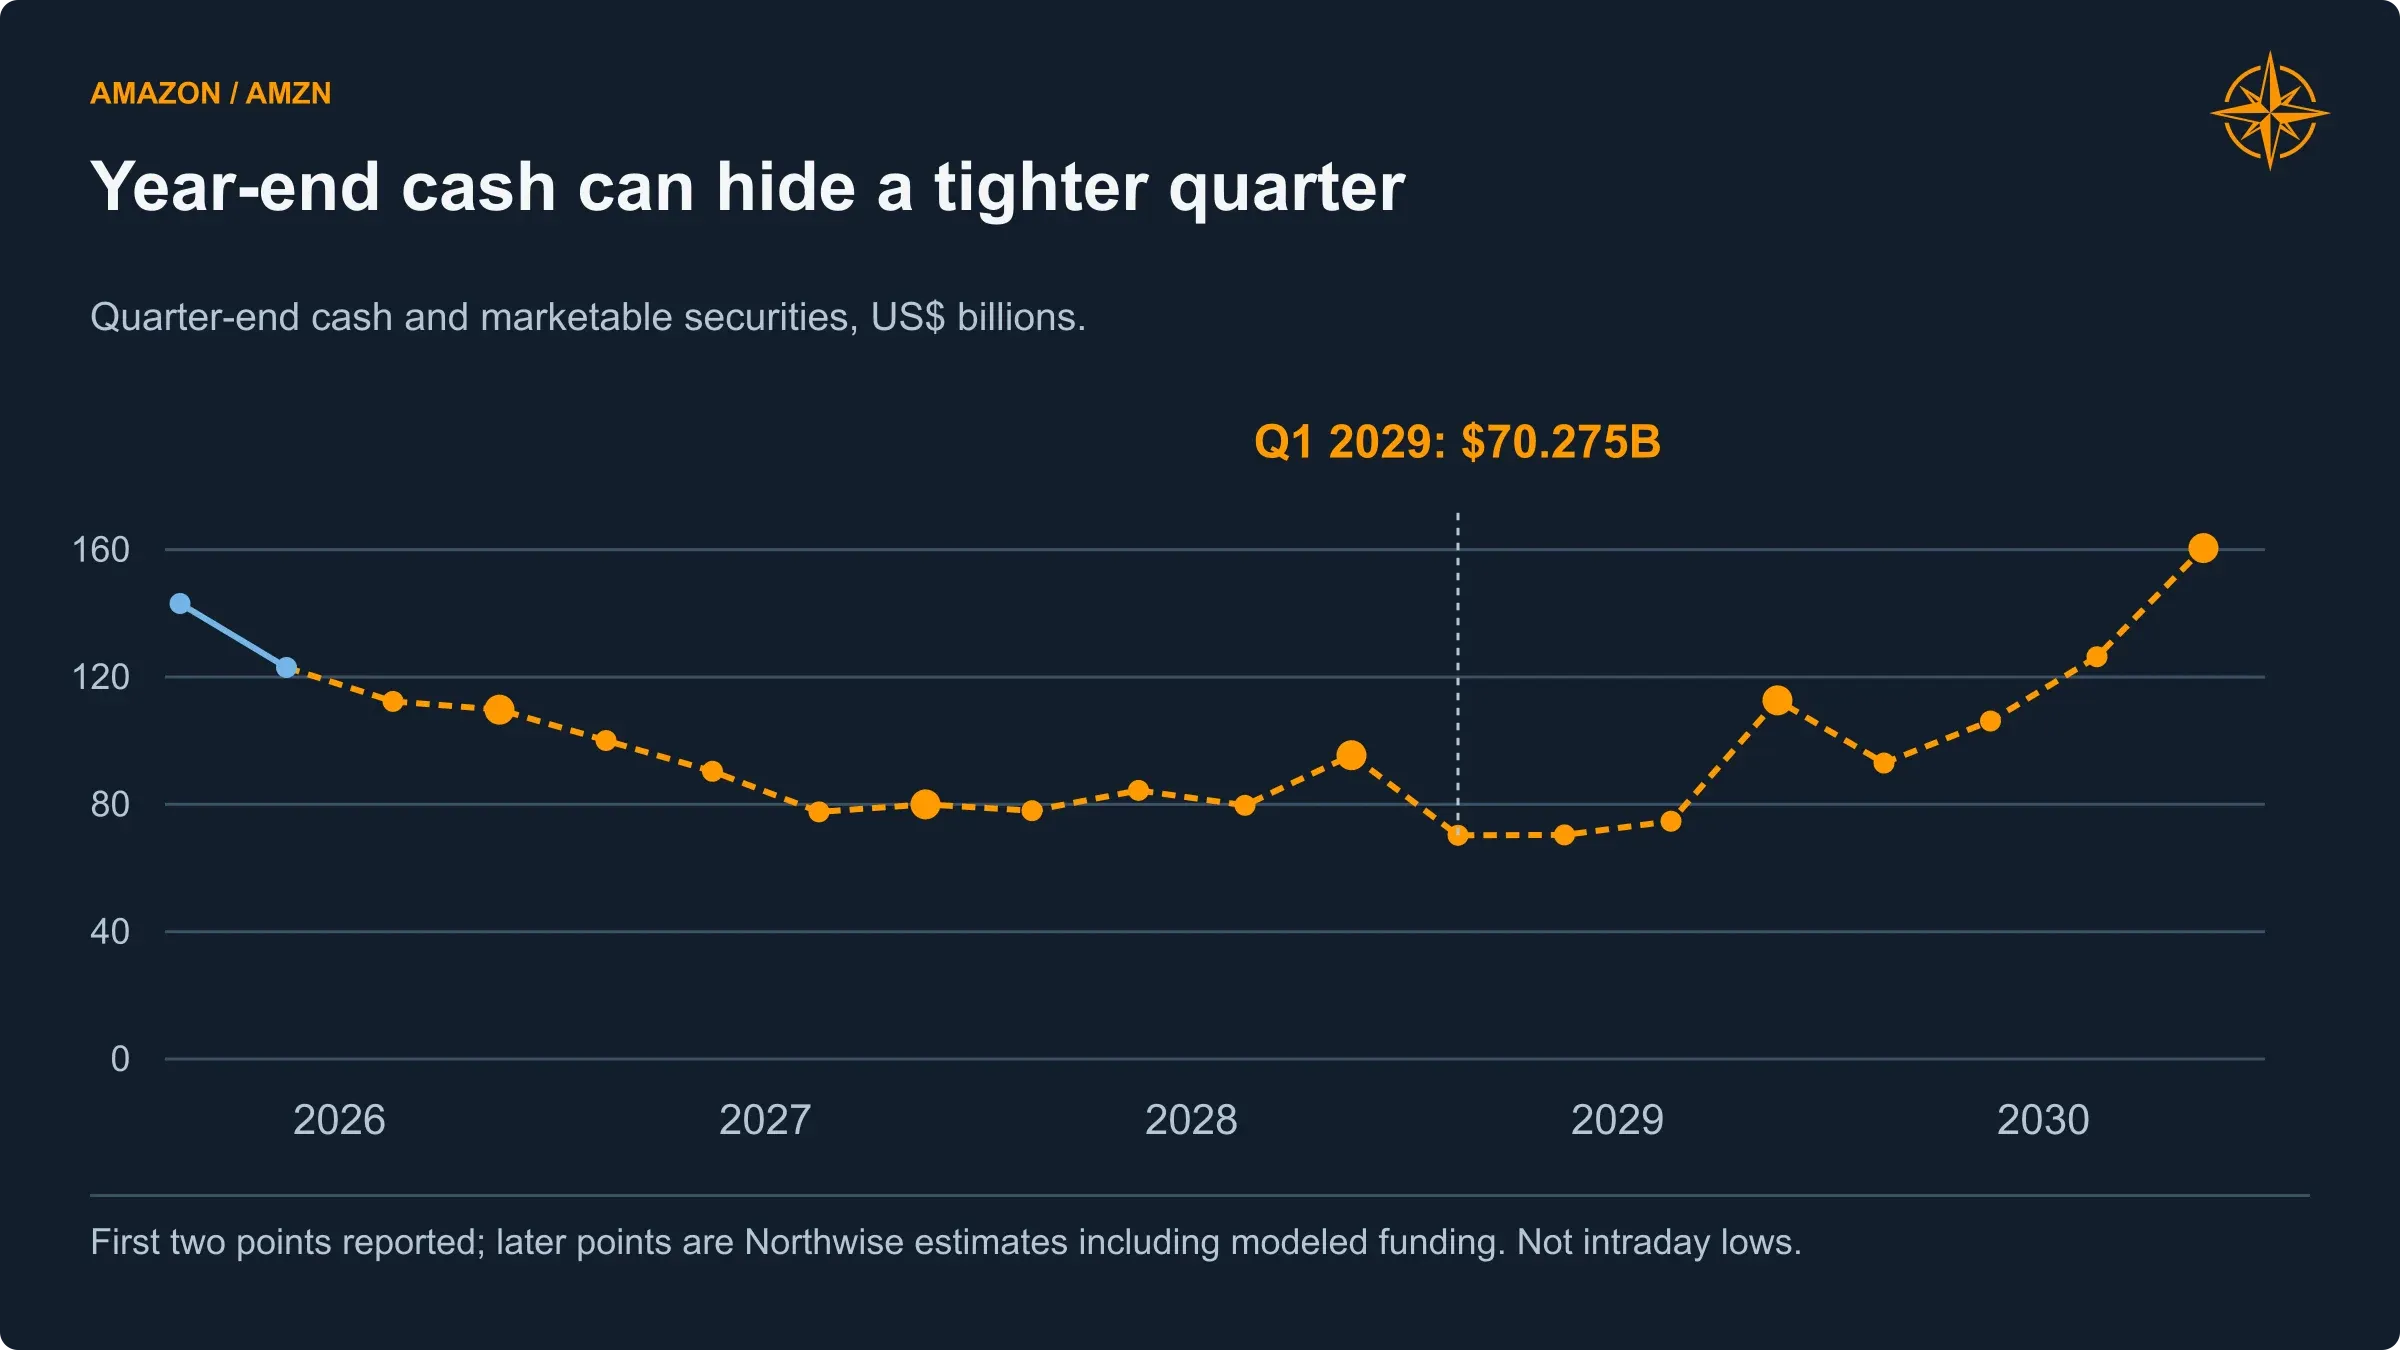
The central forecast reaches its smallest quarter-end liquid balance of $70.275 billion in Q1 2029. Its funding timing matters as well as the annual balance.
Free cash flow is operating cash flow less net cash capital expenditure. The cash-balance reconciliation also includes the subsequent investment and financing items shown. Totals use unrounded figures.
This is why free cash flow is not synonymous with cash available for repurchases. Amazon’s definition does not deduct acquisitions, minority investments or debt principal repayments. Those uses can be large even when the operating business is performing well.
The central forecast requires further borrowing through the investment-heavy years. Financial debt peaks at approximately $238.5 billion in 2028, then falls to $194.9 billion by 2030. It is not a model in which Amazon finances the entire expansion effortlessly from current cash generation.
Annual balances also conceal tighter quarters. Estimated cash and marketable securities fall to about $70.3 billion in the first quarter of 2029 before recovering to $112.7 billion at year-end. Those quarterly estimates use assumed seasonality and funding dates, and do not capture every possible intra-quarter swing.
The balance sheet after the buildout
Central year-end balance sheet | 2026E | 2027E | 2028E | 2029E | 2030E |
|---|---|---|---|---|---|
Cash and marketable securities | 109.7 | 80.0 | 95.4 | 112.7 | 160.5 |
Inventory | 40.1 | 44.5 | 49.2 | 54.1 | 59.2 |
Receivables and other current assets | 84.4 | 103.2 | 125.9 | 151.4 | 179.2 |
Net property and equipment | 552.3 | 762.9 | 986.7 | 1,219.0 | 1,444.3 |
Operating right-of-use assets | 98.5 | 115.5 | 135.7 | 158.6 | 182.0 |
Nonmarketable investments, carrying basis | 246.2 | 253.7 | 261.2 | 261.2 | 261.2 |
Goodwill and other noncurrent assets | 83.7 | 97.8 | 100.0 | 102.8 | 106.0 |
Total assets | 1,215.0 | 1,457.7 | 1,754.1 | 2,059.7 | 2,392.5 |
Operating accounts payable | 109.8 | 122.8 | 137.0 | 152.0 | 167.6 |
Capital-expenditure payables | 56.4 | 64.4 | 72.4 | 78.4 | 83.4 |
Operating accrued expenses | 57.4 | 67.4 | 78.9 | 91.5 | 105.0 |
Unearned service revenue | 26.3 | 31.5 | 37.7 | 44.5 | 52.0 |
Operating lease liabilities | 102.0 | 119.1 | 139.3 | 162.2 | 185.6 |
Finance leases and financing obligations | 25.1 | 29.7 | 34.5 | 39.7 | 45.1 |
Financial borrowings | 157.5 | 192.4 | 238.5 | 231.9 | 194.9 |
Other liabilities and deferred taxes | 72.8 | 87.3 | 102.3 | 117.6 | 130.8 |
Total liabilities | 607.3 | 714.5 | 840.5 | 917.9 | 964.3 |
Shareholders’ equity | 607.7 | 743.2 | 913.6 | 1,141.9 | 1,428.2 |
Northwise estimates. The unrounded balance sheets reconcile; displayed totals may differ because of rounding.
The most conspicuous change is net property and equipment reaching approximately $1.44 trillion. Amazon is not becoming less dependent on physical assets. The investment case requires those assets to become productive enough to support a much larger earnings base.
Three operating outcomes, not three slogans
A single forecast cannot describe the range of businesses Amazon might become.
We evaluate fifty thousand operating paths, varying cloud demand, deployment, cost efficiency, commerce activity, Leo adoption and Zoox commercialization. Common factors connect related outcomes. Weak customer economics can affect both AWS demand and investment holdings; delayed deployment can reduce revenue while leaving some spending intact.
The starting probabilities for specific events are analyst assumptions. They include a 72% probability of an expanded Zoox permission pathway, 82% for a timely D2D commercial pathway, and starting priors of 10% for AI-customer funding disruption and 6% for a persistent cloud downturn, with the latter two varying with cloud conditions. These are not probabilities supplied by regulators or inferred from an established historical sample of comparable AI investment cycles.
The scenario definitions are based on operating results. Bear includes 2030 AWS revenue below $450 billion, an AWS operating margin below 30%, or an unresolved funding failure. Bull requires at least $650 billion of AWS revenue and at least a 37% margin, without meeting the Bear definition. Base contains the remaining paths.
Those conditions produce probabilities of 23.76% Bear, 65.15% Base and 11.09% Bull. The percentages are calculated from the model, but remain conditional on its inputs and structure.
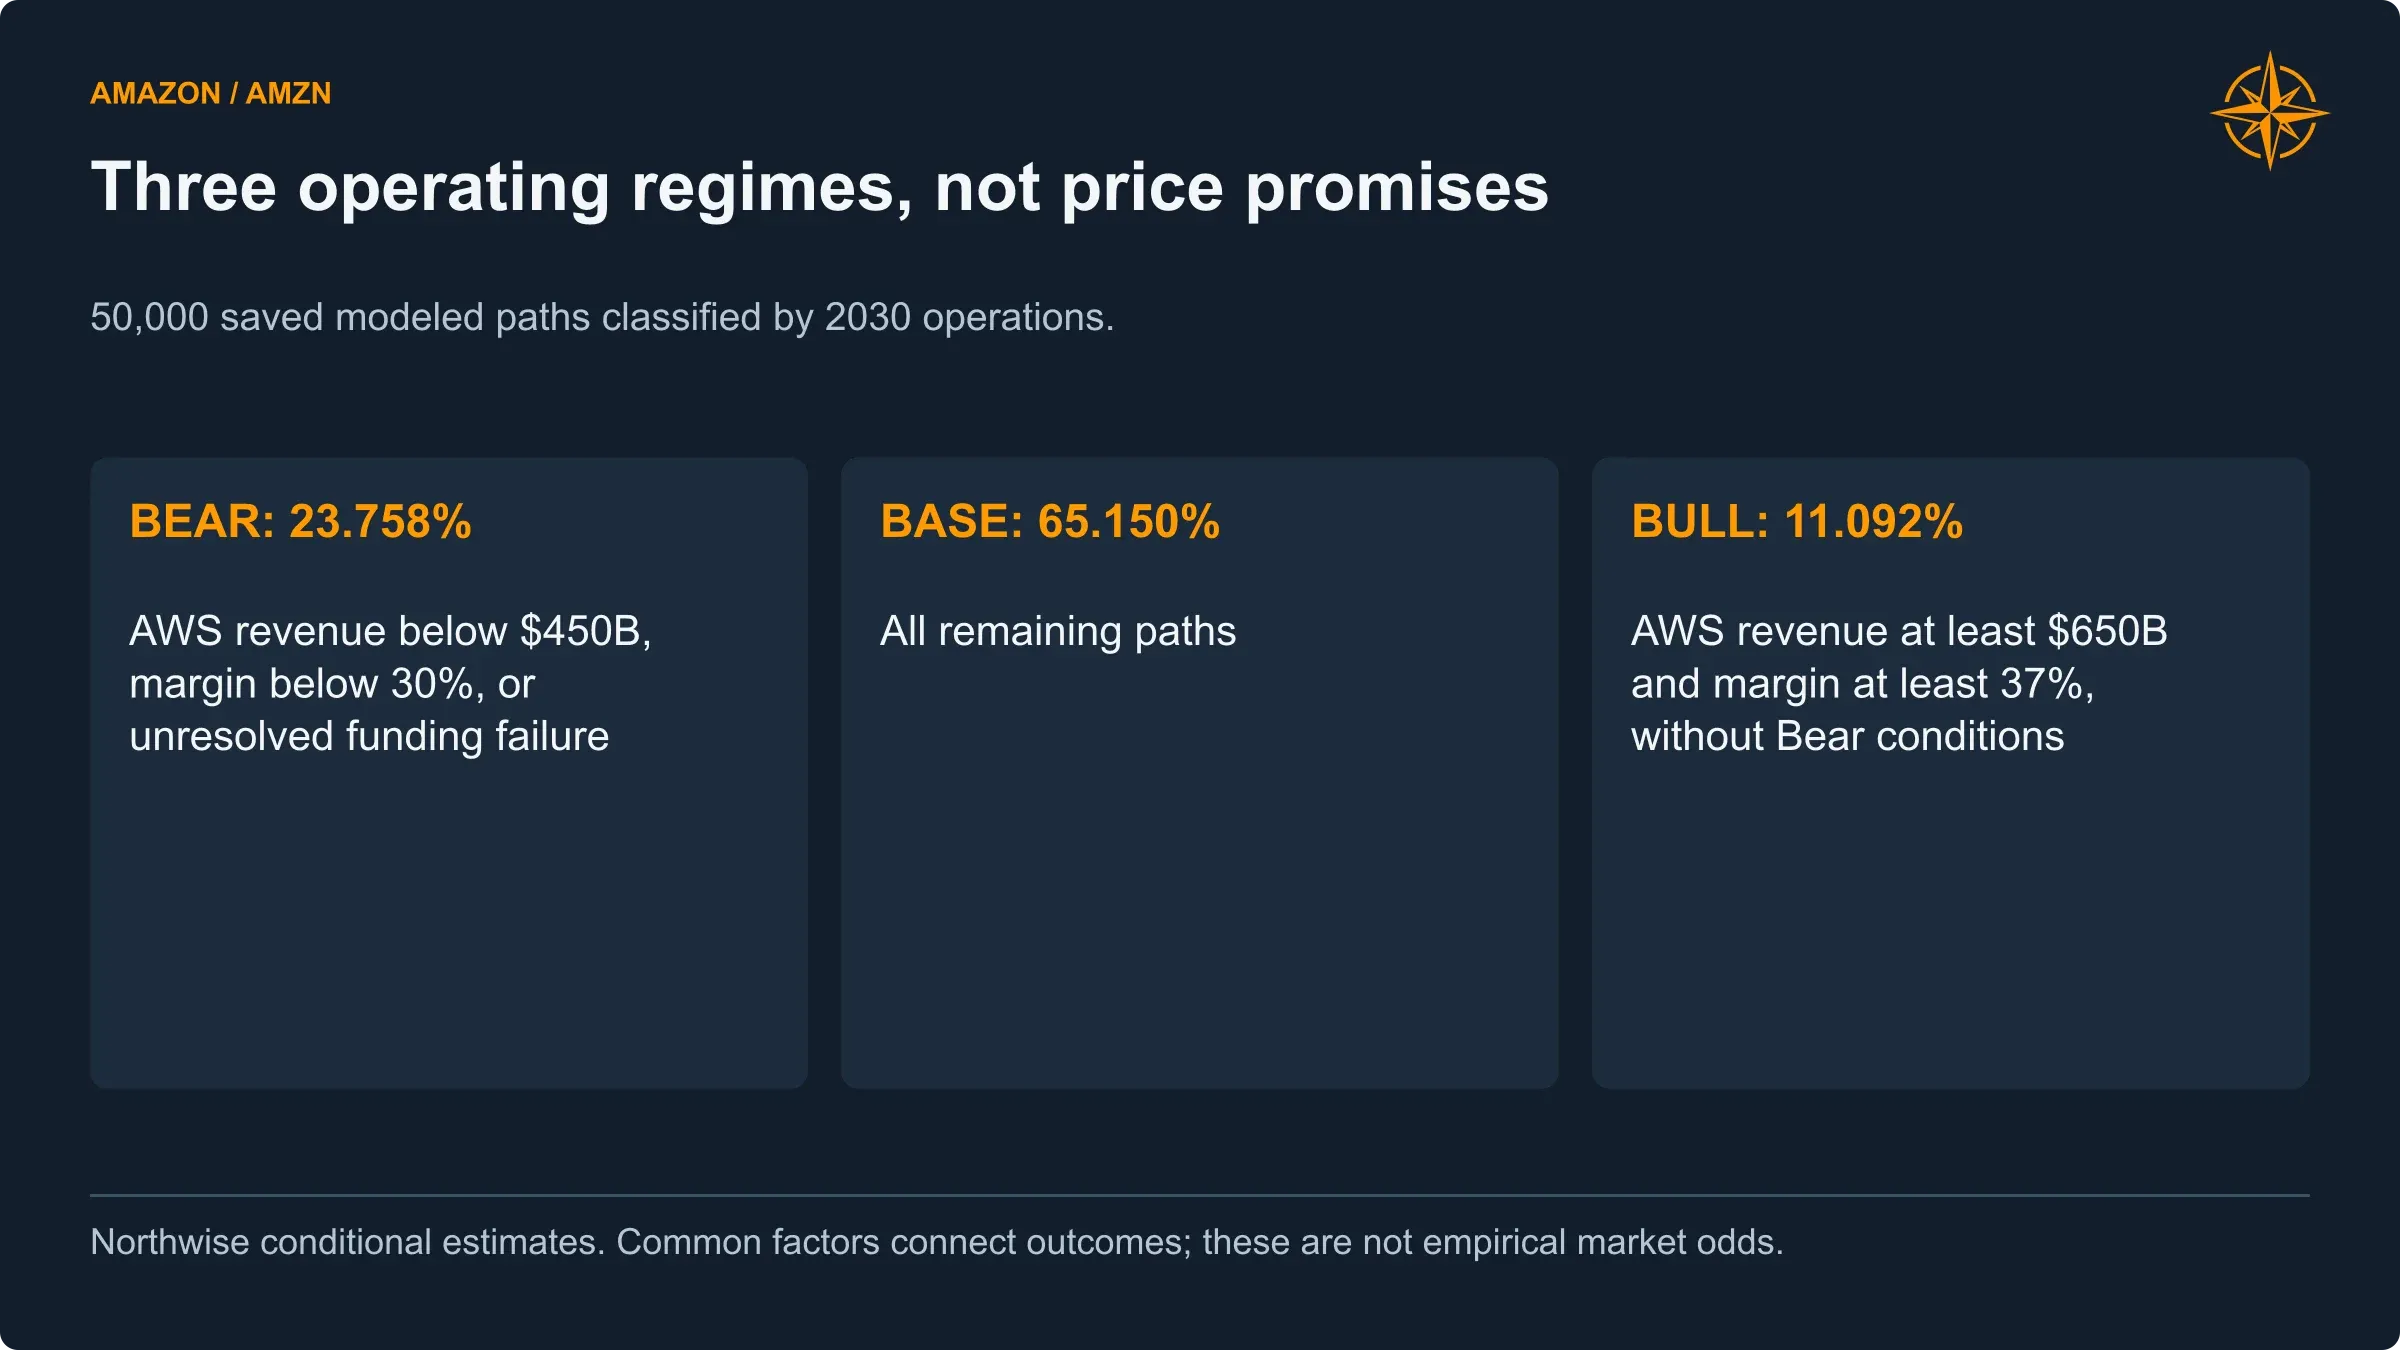
Bear, Base and Bull are classifications of operating paths. Their calculated probabilities depend on the model’s judgmental inputs and structure.
Bear: growth continues, but the investment earns less
Bear conditional average | 2026E | 2027E | 2028E | 2029E | 2030E |
|---|---|---|---|---|---|
Revenue | 832.3 | 980.6 | 1,115.8 | 1,271.3 | 1,430.1 |
AWS revenue | 175.7 | 237.3 | 279.8 | 334.7 | 385.8 |
Operating income | 109.0 | 131.4 | 149.3 | 186.6 | 214.7 |
Normalized EPS | $7.73 | $8.98 | $9.95 | $12.36 | $14.28 |
Operating cash flow | 177.4 | 226.0 | 269.6 | 320.9 | 377.1 |
Net cash capital expenditure | 218.4 | 277.1 | 307.9 | 317.3 | 319.1 |
Free cash flow | (41.1) | (51.1) | (38.3) | 3.6 | 58.0 |
Financial borrowings | 157.5 | 194.9 | 255.0 | 269.7 | 246.5 |
Average of paths classified as Bear, not a worst-case floor.
Base: substantial execution, with continuing funding demands
Base conditional average | 2026E | 2027E | 2028E | 2029E | 2030E |
|---|---|---|---|---|---|
Revenue | 837.5 | 1,003.0 | 1,196.8 | 1,414.6 | 1,652.5 |
AWS revenue | 179.3 | 253.1 | 342.2 | 444.6 | 556.9 |
Operating income | 112.0 | 143.6 | 195.3 | 265.1 | 332.1 |
Normalized EPS | $7.94 | $9.85 | $13.20 | $17.89 | $22.47 |
Operating cash flow | 180.0 | 237.6 | 311.2 | 395.1 | 491.3 |
Net cash capital expenditure | 220.3 | 286.1 | 333.8 | 375.1 | 416.1 |
Free cash flow | (40.3) | (48.6) | (22.6) | 20.0 | 75.2 |
Financial borrowings | 157.5 | 193.4 | 242.6 | 246.8 | 218.0 |
The Base average differs from the central point forecast because it combines many different operating paths.
Bull: a larger opportunity keeps demanding capital
Bull conditional average | 2026E | 2027E | 2028E | 2029E | 2030E |
|---|---|---|---|---|---|
Revenue | 842.3 | 1,023.9 | 1,248.3 | 1,506.3 | 1,802.4 |
AWS revenue | 182.8 | 269.0 | 383.6 | 519.9 | 682.4 |
Operating income | 114.8 | 156.4 | 226.5 | 318.4 | 416.1 |
Normalized EPS | $8.14 | $10.76 | $15.41 | $21.60 | $28.23 |
Operating cash flow | 182.5 | 249.3 | 340.0 | 446.4 | 574.4 |
Net cash capital expenditure | 222.1 | 293.2 | 358.1 | 428.3 | 503.3 |
Free cash flow | (39.6) | (43.9) | (18.1) | 18.1 | 71.1 |
Financial borrowings | 157.5 | 189.7 | 236.8 | 246.2 | 223.5 |
Greater growth does not necessarily maximize free cash flow in the final forecast year.
The Bull average produces less 2030 free cash flow than Base despite much higher earnings. It also spends approximately $503 billion that year, against $416 billion in Base. A larger opportunity keeps the investment program running harder.
Conversely, Bear’s improving cash flow partly reflects a smaller spending program. Better near-term cash generation can come from giving up growth as well as from improving the business. Looking at free cash flow without its investment context can produce the wrong conclusion in either direction.
What would make us change the forecast
The most useful stress tests connect an operating change to the spending, earnings and funding that follow it.
Reducing equipment purchases should not leave the same revenue untouched. Higher costs should not automatically disappear after the explicit forecast. A financing shortfall should not be fixed by assigning a lower valuation multiple.
Selected operating results illustrate those relationships:
Deterministic operating stress | 2030 AWS revenue | 2030 normalized EPS | 2030 FCF | 2030 borrowings |
|---|---|---|---|---|
Central forecast | 556.4 | $22.68 | 89.1 | 194.9 |
AWS equipment quantity reduced 20% | 517.8 | $22.76 | 133.3 | 80.0 |
AWS equipment quantity increased 20% | 612.1 | $23.66 | 57.9 | 310.9 |
Persistent AWS input-cost increase of 10% | 556.4 | $20.48 | 43.9 | 340.2 |
Persistent AWS input-cost reduction of 10% | 556.4 | $24.84 | 133.8 | 80.0 |
Persistent AWS margin reduction of 3 percentage points | 556.4 | $21.40 | 73.9 | 230.8 |
Persistent AWS margin improvement of 3 percentage points | 556.4 | $23.95 | 104.1 | 161.5 |
Leo cash capital expenditure increased 50% | 556.4 | $22.52 | 83.7 | 209.7 |
Zoox cost per ride increased 25% persistently | 556.4 | $22.64 | 88.6 | 195.4 |
Cash-tax rates increased 5 percentage points | 556.4 | $22.53 | 70.9 | 238.4 |
These are specified stress scenarios, not probability percentiles.
The equipment examples are particularly revealing. Buying 20% less equipment improves near-term cash generation but sacrifices revenue. Buying more expands supported revenue, yet reduces free cash flow and increases borrowing. Both outcomes are economically plausible; neither permits an automatic conclusion that more or less investment is always preferable.
Capital access is the harder constraint. Prohibiting new borrowing in 2027–2028 and prohibiting equity issuance creates an approximately $0.8 billion annual cash shortfall under the central operating plan. Accelerating $20 billion of vendor payments from 2029 into 2028 increases that shortfall to approximately $20.9 billion. The quarterly schedule is tighter still. Those outcomes require a financing, spending or asset-sale response. They cannot be solved by confidence in a distant earnings forecast.
The model also contains risks that cannot responsibly be reduced to a single estimated charge. Cloud outages, security incidents, power availability, content commitments, competition, labor costs, marketplace regulation, satellite coordination, launch failures and robotaxi safety can affect costs, customer retention and deployment. A litigation reserve or insurance assumption does not cover every possible outcome.
For AWS, we would watch whether the extraordinary bookings translate into consumption at acceptable returns, whether new capacity arrives when customers need it, and whether equipment inflation is being recovered through future pricing or offset by productivity. For commerce, the useful evidence is not simply faster delivery, but what that speed does to customer frequency, order density and cost to serve.
Leo needs paid activations and useful coverage, not only launch milestones. Zoox needs commercially active vehicles completing paid rides at sustainable costs, not only a growing production count. Across all of them, cash receipts and financing must arrive before obligations become due.
The forecast does not end when the calendar reaches 2030
The investments made before 2030 will still be serving customers, requiring maintenance and facing replacement decisions afterward. We therefore extend the operating forecast rather than assuming the business becomes static at the endpoint.
The central continuation reaches approximately $4.06 trillion of revenue in 2040. AWS growth moderates from 23% in 2031 to 5% by 2040, with its operating margin settling at 38.5%. Advertising reaches a 45% operating margin. Leo and Zoox grow into larger businesses with 23% long-term operating margins. These are ambitious long-term assumptions, not company guidance.
Central operating continuation | 2031E | 2035E | 2040E |
|---|---|---|---|
AWS revenue | 684.4 | 1,281.6 | 1,897.9 |
Advertising revenue | 217.1 | 341.4 | 458.8 |
North America commerce revenue | 691.3 | 893.4 | 1,102.6 |
International commerce revenue | 271.3 | 362.2 | 453.5 |
Leo revenue | 19.9 | 49.4 | 80.1 |
Zoox revenue | 10.9 | 39.1 | 70.4 |
Consolidated revenue | 1,894.9 | 2,967.0 | 4,063.4 |
Unlevered cash flow after modeled reinvestment | 93.3 | 275.1 | 631.2 |
Northwise estimates. Unlevered cash flow is calculated before financial-debt interest and is not identical to Amazon’s reported free-cash-flow definition.
The continuation funds replacement and expansion. Where a broader growth-investment requirement exceeds the physical replacement minimum, the larger requirement controls. A minimum that does not bind in a particular year does not mean replacing equipment is free.
The complete editable financial model accompanies the Premium valuation section. It includes the assumptions, annual statements, quarterly liquidity, operating scenarios, longer-term schedules and full stress analysis. Its central forecast is formula-driven; the published simulation and stress results are dated analyses rather than simulations that rerun automatically whenever a cell changes.
Our operating conclusion is that Amazon has enough genuine demand and enough established earning power to justify a much larger investment program. That conclusion would weaken if usage failed to follow capacity, if customer economics deteriorated, or if financing became unavailable before the cash-flow recovery.
AWS remains the decisive business. Advertising improves the economics of the group. Commerce continues to create valuable customer activity and distribution. Leo and Zoox widen the opportunity, but we are paying for their development in the forecast rather than treating them as free additions.
Northwise Premium
Choose how to continue with Northwise
Join Northwise Premium
Unlock the rest of this report, its complete valuation, the downloadable model, portfolios, and action framework.
Join Northwise PremiumCreate a Free Account
Continue across Free Northwise research, follow companies, save reports, and receive updates.
Create a Free Account
Amazon Stock Forecast 2030
Amazon stock Forecast 2030 modeling Amazon’s AI capital cycle, AWS scale, depreciation wall, and 2030 price targets, buy zones, and valuation.

Amazon Zoox
Amazon Zoox: current rider access, federal commercial-deployment permission, vehicle production and the economic test for autonomous passenger service.

Amazon Leo
Amazon Leo: current satellite deployment, conditional FCC relief, the proposed direct-to-device network and the economics of commercial rollout.
Northwise Portfolios
See how the research becomes real decisions
Reader discussion
Discuss the research
Premium access is required to join this report's discussion.
Join Northwise Premium
No comments yet. Start a thoughtful discussion.