
AMD Stock Forecast 2030
This AMD Stock Forecast 2030 explores AMD's transition from a distant secondary supplier to an open compute superpower in Artificial Intelligence.
In this article
A premium AMD stock forecast 2030 valuation framework, rebuilt around multi-gigawatt AI factory deployments, system-level economics, dilution-adjusted EPS, and scenario-weighted present value.
Executive Summary
AMD has moved past the point where it can be accurately described as a cyclical semiconductor company selling discrete chips into traditional end markets. The business is increasingly participating in multi-gigawatt AI factory deployments at system scale, and the evidence base supporting that shift has strengthened materially since our prior model was published.
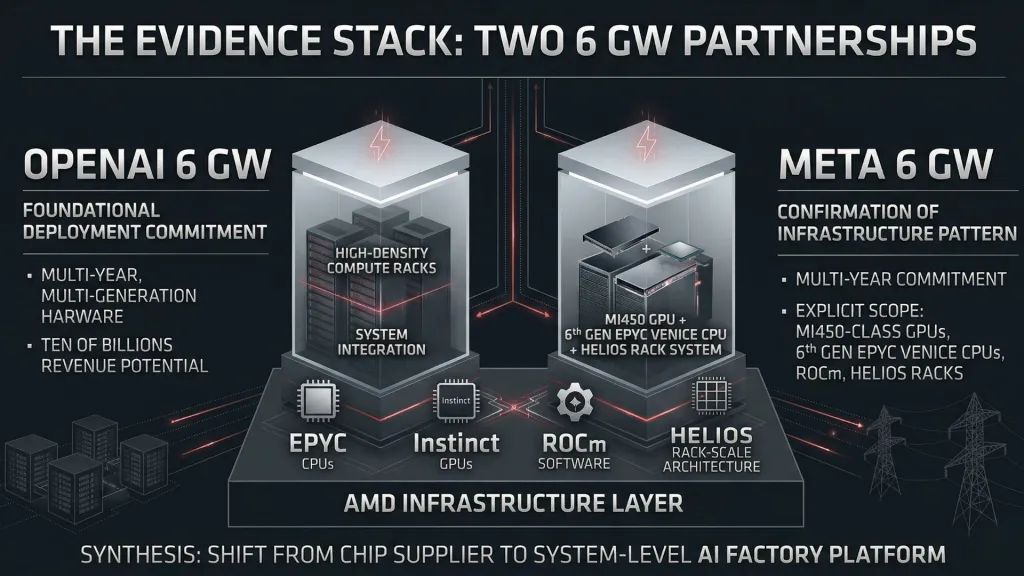
Two partnerships now anchor the revised thesis. AMD has disclosed 6 GW with OpenAI and 6 GW with Meta, both structured as multi-year, multi-generation commitments rather than ordinary chip procurement agreements. OpenAI's partnership is expected to deliver tens of billions of dollars in revenue over time. Meta's partnership explicitly includes MI450-class GPUs, 6th Gen EPYC Venice CPUs, ROCm, and the Helios rack-scale architecture, and AMD has said it should drive substantial multi-year revenue growth and be accretive to non-GAAP EPS over time.
The old model could not absorb this. The prior framework used a 2025 base and a revenue architecture that did not reflect the scale or structure of what AMD is now building toward. This report starts from AMD's actual FY2025 results, splits the model into two distinct engines, carries the dilution from 320M shares of strategic warrant overhang through every scenario, and still produces very large outcomes across the range.
These are aggressive numbers. The report does not attempt to hide that fact. The growth rates implied by the revenue ladder are exceptionally high. The multiple ranges lean on Nvidia's rerating history during its own AI hypergrowth period, discounted for the fact that AMD is not monopolistic. The warrant overhang is real. The execution requirements are demanding. All of that is allowed into the model and discussed openly.
The thesis rests on a specific structural claim: the market may still be treating AMD too much like a second-source semiconductor supplier rather than a scaling AI infrastructure platform. If that framing is wrong, the current price already reflects the opportunity. If it is right, the gap between perception and trajectory remains wide enough to matter.
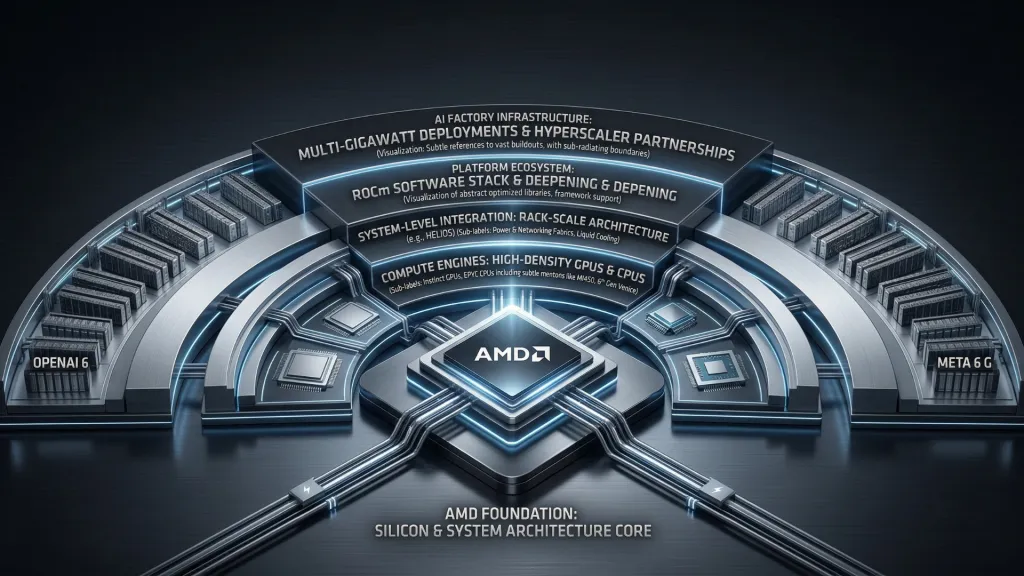
Table of Contents
- The Thesis Reset
1.1 Why the Old AMD Framework No Longer Works
1.2 What Changed Since the Prior Model
1.3 The Central Tension: Much Larger Opportunity, Still Real Complexity - The Evidence Stack That Forced the Model Higher
2.1 OpenAI: The First 6 GW Proof Point
2.2 Meta: Confirmation This Was Not a One-Off
2.3 GPU Scarcity and Pricing Still Support a Constrained Market
2.4 CPU Demand Is Stronger Than a Narrow GPU Story Would Imply - What Management Had Already Been Building Toward
3.1 Financial Analyst Day as the Strategic Base Layer
3.2 Lisa Su’s Pattern of Disciplined Guidance
3.3 Why That Matters for the Revised Model - Rebuilding the Revenue Model from the Correct Base
4.1 AMD’s Actual FY2025 Baseline
4.2 Split the Model into Two Engines
4.3 Why We Modeled AI Factory Economics the Way We Did
4.4 Why We Raised the Rest of the Business
4.5 Where the Revenue Model Is Most Sensitive - The Dilution Reality
5.1 OpenAI Warrant
5.2 Meta Warrant
5.3 Why We Modeled Full Execution
5.4 Buybacks as Only a Partial Offset
5.5 Why the Correct Answer Is Future Diluted EPS, Not Clean EPS - Scenario Revenue Ladder
6.1 Bear
6.2 Base
6.3 Bull
6.4 Goldilocks
6.5 Why the Bear Case Is Still a Very Good Business Outcome - Margin Structure and Earnings Conversion
7.1 Why We Lowered Margins from the Hotter First Pass
7.2 End-State Net Margin Assumptions by Case
7.3 Revenue-to-Net-Income Logic - Diluted Share Count and EPS Construction
8.1 Share-Count Assumptions by Case
8.2 EPS Outputs by Case
8.3 Sensitivity to AI Factory Economics
8.4 What the EPS Build Actually Says - Transition to Valuation
- Valuation Framework
10.1 Why AMD Deserves a Higher Multiple Than Our Earlier Draft Used
10.2 Nvidia as a Guide, with a Conservative Haircut
10.3 Final P/E Ranges by Case
10.4 Final 2030 Price Target Ranges
10.5 Weighted 2030 Price Target - Present Value and Margin of Safety
11.1 Present Value of the Weighted Target
11.2 Present Value of Each Scenario Midpoint
11.3 Discount-Rate Ranges for Different Investor Temperaments
11.4 What This Means for Margin of Safety - Northwise Portfolio Positioning
12.1 Why AMD Remains a Core Conviction Name
12.2 What Would Make Us Add, Trim, or Reevaluate
12.3 AMD Relative to the Rest of the AI Infrastructure Basket
12.4 What Would Break the Thesis - Final Conclusion
13.1 What the Revised Model Proves
13.2 Why the Upside Can Still Be Enormous After Dilution
13.3 Why the Bear Case Still Matters
13.4 Final Northwise Synthesis
1. The Thesis Reset
1.1 Why the Old AMD Framework No Longer Works
The prior AMD model was built for a different version of the company. It used a stale FY2025 base, modeled revenue through conventional segment growth assumptions, and treated AMD's AI opportunity as a large incremental tailwind layered onto an existing semiconductor business. That framing was reasonable at the time. It is no longer sufficient.
What changed is structural. AMD is no longer selling chips into a broad market and hoping for AI share gains at the margin. It is increasingly deploying system-level AI infrastructure into multi-gigawatt factory-scale commitments with the largest compute buyers on the planet. The revenue architecture, the contract structure, the product scope, and the capital relationships all look materially different than what the old model was designed to capture.
Rebuilding from scratch was the only honest response. Adjusting the old framework upward would have produced numbers without producing understanding. The model needed a new engine, a new base, and a new way of thinking about what AMD's revenue actually represents when it shows up inside a 6 GW deployment that includes GPUs, CPUs, rack-scale systems, and software.
1.2 What Changed Since the Prior Model
Three developments forced the reset.
First, AMD disclosed the OpenAI partnership at 6 GW, structured as a multi-year, multi-generation commitment expected to deliver tens of billions in revenue over time. That alone would have been enough to require a new model. A single customer relationship of that magnitude changes the shape of the business.
Second, AMD disclosed the Meta partnership, also at 6 GW, with explicit product scope covering MI450-class GPUs, 6th Gen EPYC Venice CPUs, ROCm, and the Helios rack-scale architecture. Meta's deal is important for a different reason than OpenAI's. It confirmed that the first partnership was not an isolated event. Two of the most important AI infrastructure buyers in the world chose AMD for multi-gigawatt deployments within a short window. That pattern carries more weight than either deal alone.
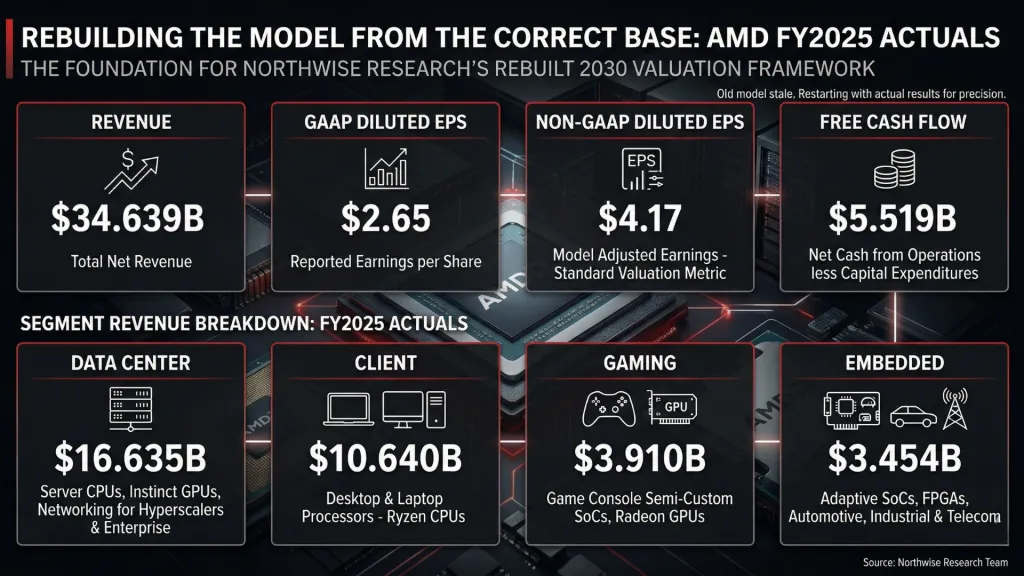
Third, AMD reported actual FY2025 results that confirmed the business was already growing faster and more profitably than the old model's base assumed. Revenue of $34.639B, non-GAAP diluted EPS of $4.17, and free cash flow of $5.519B all exceeded the stale anchors embedded in the prior framework.
Together, these developments moved the thesis from "AMD is gaining meaningful share in AI compute" to "AMD is becoming a system-level AI infrastructure supplier participating in the largest deployment contracts in the industry." That shift required a model capable of expressing it.
1.3 The Central Tension: Much Larger Opportunity, Still Real Complexity
The revised model produces very large outcomes. That is the point of rebuilding it. The opportunity disclosed through OpenAI and Meta alone, before any additional customer expansion, represents 12 GW of committed AI factory capacity flowing through AMD's product stack over multiple years and multiple hardware generations.
The complexity is equally real. AMD is not a monopolist. Nvidia remains dominant in training infrastructure and carries deeper software ecosystem lock-in through CUDA. The strategic warrants issued to OpenAI and Meta create 320M shares of dilutive overhang that must be absorbed before any EPS number means anything. The growth rates implied by the revenue ladder are exceptionally high, and history offers very few examples of semiconductor companies sustaining anything close to those rates for five consecutive years.
The report holds both of those realities at the same time. The opportunity is much larger than the market may appreciate. The execution requirements are also much more demanding than a simple "AMD is the second source" narrative would suggest. The model is built to capture the upside without pretending the path is clean.
2. The Evidence Stack That Forced the Model Higher
2.1 OpenAI: The First 6 GW Proof Point
The OpenAI partnership was the first signal that AMD's AI trajectory had shifted categories. A 6 GW commitment from the company most responsible for the current wave of AI infrastructure demand is not an incremental GPU order. It is a foundational deployment relationship.
The scale matters for several reasons. 6 GW of AI factory capacity implies an enormous volume of compute hardware, attached CPU and networking infrastructure, and system-level integration work flowing through AMD over multiple years and multiple product generations. OpenAI has said the partnership is expected to deliver tens of billions of dollars in revenue to AMD over time. That kind of language from a customer of that importance changes what the revenue model needs to accommodate.
It also changes the strategic framing. A company receiving a 6 GW commitment from OpenAI is no longer best understood as a challenger trying to take share from the incumbent. It is a structurally necessary infrastructure supplier operating at a scale where the customer has already made significant architectural and commercial decisions around AMD's product roadmap. That level of commitment creates multi-year revenue visibility that is qualitatively different from ordinary chip procurement cycles.
2.2 Meta: Confirmation This Was Not a One-Off
Meta's 6 GW partnership landed shortly after OpenAI's and confirmed that the first deal was a pattern rather than an exception. That distinction matters enormously for the model.
A single large partnership, no matter how impressive, can always be explained away as idiosyncratic. Maybe OpenAI had unique constraints. Maybe the deal reflected temporary supply dynamics. Maybe it was a one-time diversification move that would not repeat elsewhere. Meta's commitment closed that line of reasoning.
The product scope disclosed in Meta's deal also strengthened the all-in AI factory framing. This is not a GPU-only relationship. Meta's deployment explicitly includes MI450-class GPUs, 6th Gen EPYC Venice CPUs, ROCm software, and the Helios rack-scale architecture. AMD has said the deal should drive substantial multi-year revenue growth and be accretive to non-GAAP EPS over time. That breadth of product engagement supports the decision to model these partnerships as system-level AI factory economics rather than discrete chip revenue.
Two customers at 6 GW each. Both among the largest AI infrastructure builders in the world. Both committing across multiple product generations. The model reflects that evidence.
2.3 GPU Scarcity and Pricing Still Support a Constrained Market
The demand environment remains favorable for a second major AI compute supplier. GPU scarcity has not meaningfully eased. The largest buyers continue to invest at unprecedented scale, and the competition for available capacity remains intense enough that having a credible second source carries real strategic value.
That scarcity dynamic is part of what makes the current partnerships possible at the terms they appear to carry. In a fully supplied market, the largest customers would have less reason to make multi-gigawatt commitments to a second infrastructure provider. In the current market, the logic runs in the opposite direction. Diversifying compute supply across multiple architectures reduces concentration risk, improves negotiating leverage against any single vendor, and creates optionality around future hardware generations.
AMD benefits from that dynamic today. The question is how long the constrained environment persists and whether AMD can convert enough of the current opportunity into durable infrastructure relationships before the supply picture eventually normalizes. The model assumes the window remains open through the forecast period, which is a favorable assumption supported by the sheer scale of announced AI infrastructure investment globally.
2.4 CPU Demand Is Stronger Than a Narrow GPU Story Would Imply
The GPU headlines dominate investor attention, though the CPU story underneath is stronger than the market seems to appreciate.
AMD's server CPU business has been gaining share steadily, and that trajectory should accelerate as AI factory deployments pull enormous volumes of EPYC processors alongside GPUs. A 6 GW AI factory deployment does not run on GPUs alone. Every rack needs attached compute. Every inference cluster needs host processors. Every training system needs CPU infrastructure for data movement, orchestration, and surrounding workloads. Meta's partnership makes this explicit by including 6th Gen EPYC Venice alongside the GPU and rack-scale components.
That means the AI factory thesis is inherently a CPU story as well as a GPU story. The model treats it that way by embedding CPU content inside the all-in per-GW revenue assumption rather than modeling it separately and risking double-counting. The non-overlapping CPU bucket in the model captures server and general-purpose compute demand that sits outside these giant AI factory deployments.
3. What Management Had Already Been Building Toward
3.1 Financial Analyst Day as the Strategic Base Layer
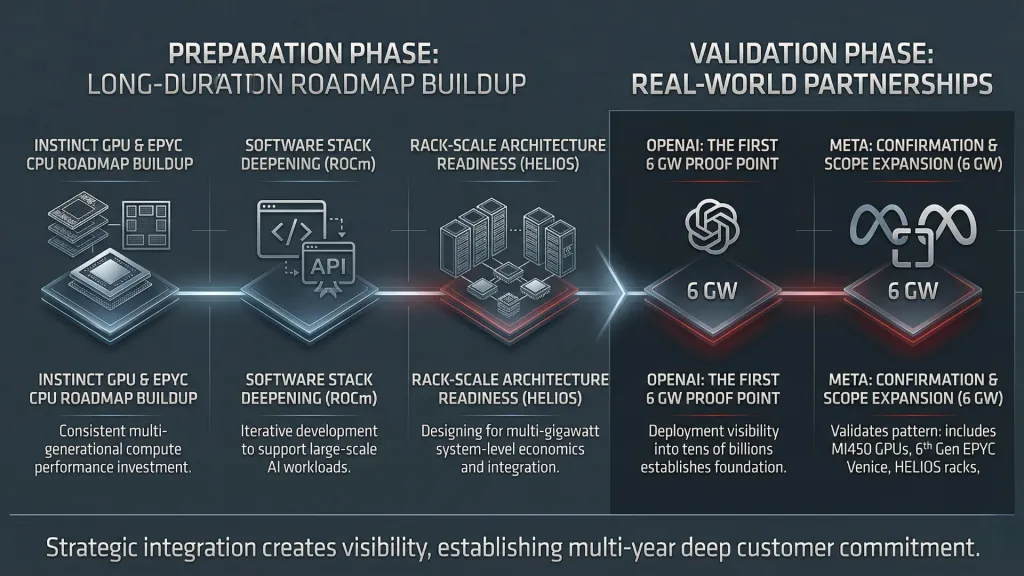
AMD's Financial Analyst Day laid groundwork that only became fully legible once the OpenAI and Meta partnerships were announced. The product roadmap presented at that event, including Instinct GPU progression, EPYC generational cadence, ROCm software investment, and Helios rack-scale architecture, now reads as the infrastructure layer underneath multi-gigawatt AI factory commitments rather than an aspirational product showcase.
That matters for calibrating confidence in the model. Management was already investing toward this outcome before the market had evidence that deals of this scale were coming. The product development, the software stack deepening, and the system-level architecture work all preceded the partnership announcements. What looked like ambitious roadmap slides at the time now looks like the engineering base required to support exactly the kind of deployments AMD has since disclosed.
3.2 Lisa Su's Pattern of Disciplined Guidance
Lisa Su has built a track record of guiding conservatively and delivering above expectations. That pattern is relevant here for a specific reason: the language AMD has used around these partnerships, including "tens of billions of dollars" for OpenAI and "substantial multi-year revenue growth" for Meta, likely reflects the same disciplined communication approach.
If that pattern holds, the actual revenue contribution from these partnerships may exceed what the public language implies. The model does not depend on that being true. It is built around the disclosed evidence and reasonable extensions of it. Still, the historical pattern of underpromise and overdelivery provides some comfort that the disclosed scale is not the ceiling.
3.3 Why That Matters for the Revised Model
The connection between management's long-duration product investment and the partnerships that followed gives the model a stronger foundation than it would have if these deals had arrived without visible preparation.
A company that stumbles into a large contract through luck or temporary circumstances is harder to model forward with confidence. A company that built the product stack, deepened the software layer, developed the system architecture, and then landed the partnerships that those investments were designed to support tells a more coherent story. The model still carries real uncertainty. The execution requirements are still demanding. The strategic preparation underneath the disclosed partnerships simply makes the forward assumptions more defensible than they would otherwise be.
4. Rebuilding the Revenue Model from the Correct Base
4.1 AMD's Actual FY2025 Baseline
The old model used a stale 2025 estimate. The new model starts from AMD's actual FY2025 results.
Metric | FY2025 Actual |
|---|---|
Revenue | $34.639B |
GAAP Diluted EPS | $2.65 |
Non-GAAP Diluted EPS | $4.17 |
Free Cash Flow | $5.519B |
Data Center Revenue | $16.635B |
Client Revenue | $10.640B |
Gaming Revenue | $3.910B |
Embedded Revenue | $3.454B |
AMD guided Q1 2026 to approximately $9.8B in revenue, plus or minus $300M, with roughly 55% non-GAAP gross margin. That guidance is relevant for calibrating the near-term trajectory. Q4 FY2025 carried temporary margin benefit from approximately $360M in reserve release and $390M of MI308 China revenue. Excluding those items, the underlying non-GAAP gross margin would have been closer to 55% than the reported 57%. The model uses the lower figure as the honest starting point for margin assumptions.
4.2 Split the Model into Two Engines
The revised model separates AMD's revenue into two distinct engines. That separation is the most important structural decision in the entire framework.
Engine 1 is AI factory deployment revenue. This is the large deployment bucket tied to multi-gigawatt AI infrastructure rollouts with customers like OpenAI and Meta. It is not pure GPU revenue. It should be understood as all-in AI factory economics, which may include GPUs, attached CPUs, rack-scale systems, and tightly attached software or platform value where appropriate. Meta's deployment explicitly includes GPUs, CPUs, ROCm, and Helios. Modeling these partnerships as narrow GPU shipments would understate both the revenue density and the strategic depth of the relationship.
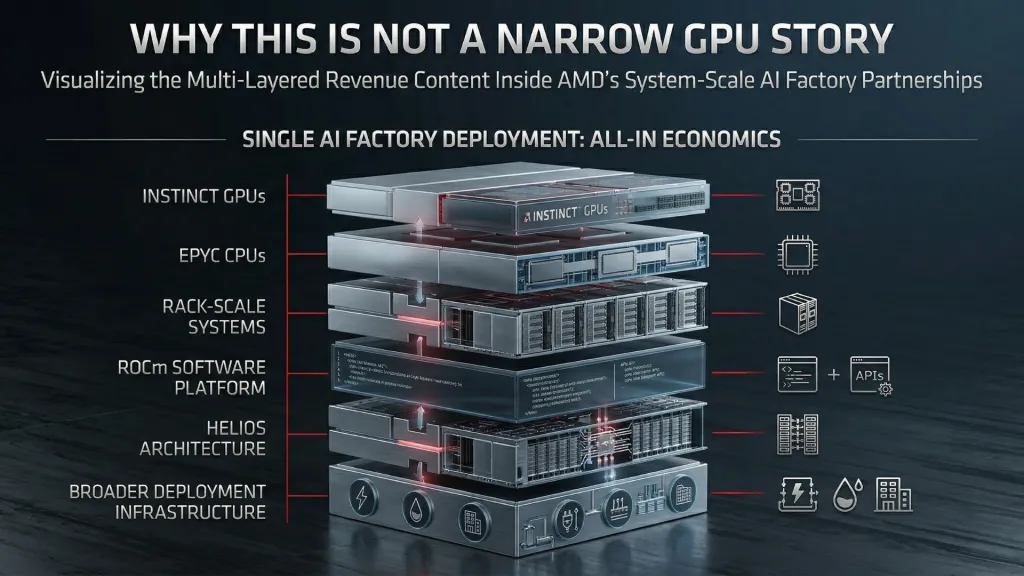
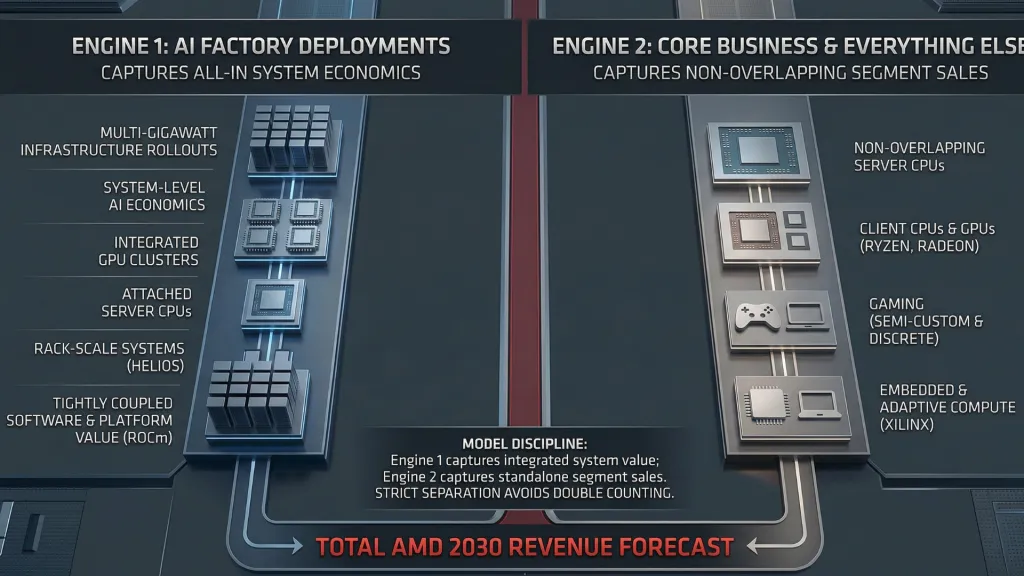
Engine 2 is everything else. Non-overlapping server CPUs, Client, Gaming, and Embedded. These businesses are modeled separately to avoid double-counting the CPU and system content already embedded inside the 18 GW AI factory deployment bucket. The non-overlapping CPU category explicitly excludes CPU revenue that is already captured in Engine 1.
That split keeps the model clean. Revenue from giant AI factory deployments flows through one engine with its own per-GW economics. Revenue from AMD's broader product portfolio flows through a second engine with segment-level assumptions. The two engines add together to produce total company revenue without overlap.
4.3 Why We Modeled AI Factory Economics the Way We Did
The AI factory deployment engine assumes 12 GW disclosed today (6 GW OpenAI, 6 GW Meta) and 18 GW modeled by 2030, with the additional 6 GW assumed from expansion at OpenAI, Meta, or other customers.
The all-in revenue per GW assumption is modeled across a range:
Revenue per GW | Low | Central | High |
|---|---|---|---|
All-In per GW | $20B | $25B | $30B |
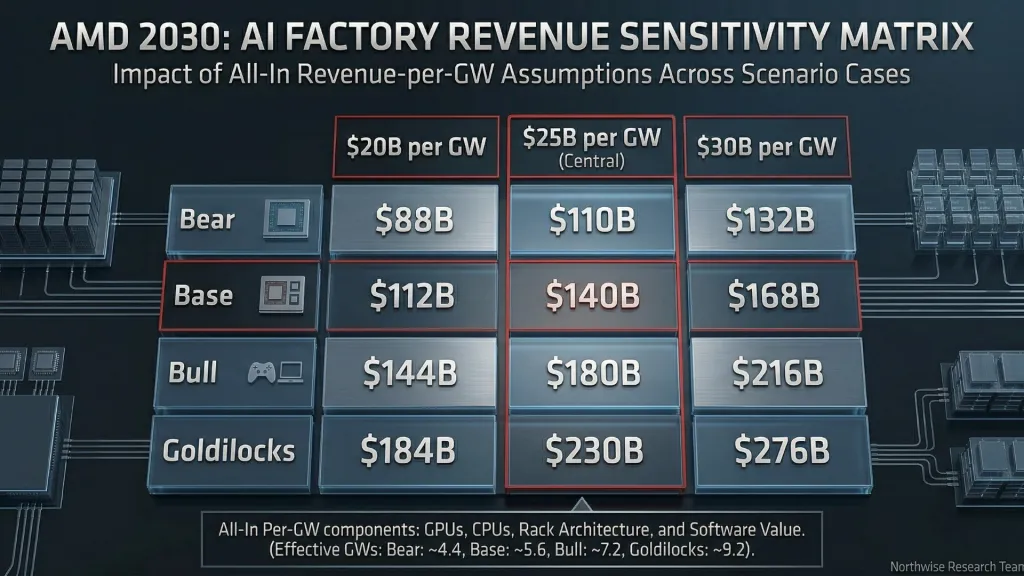
An important note: $25B per GW is a Northwise modeling framework, not a company-published figure. It is justified by the nature of these deployments. These are increasingly system-level, multi-component, multi-generation partnerships rather than ordinary chip shipments. The revenue flowing through a single gigawatt of AI factory capacity includes GPUs, attached CPUs, rack architecture, software, and potentially other system-level value. Treating these as narrow semiconductor transactions would undercount the economic content of the relationship.
We do believe that the 450 series could near these numbers alone, but they also also assume 500 series ramp later in the cycle pulls up overall ASPs. This leaves us with a blended rate that we feel comfortable building the model around.
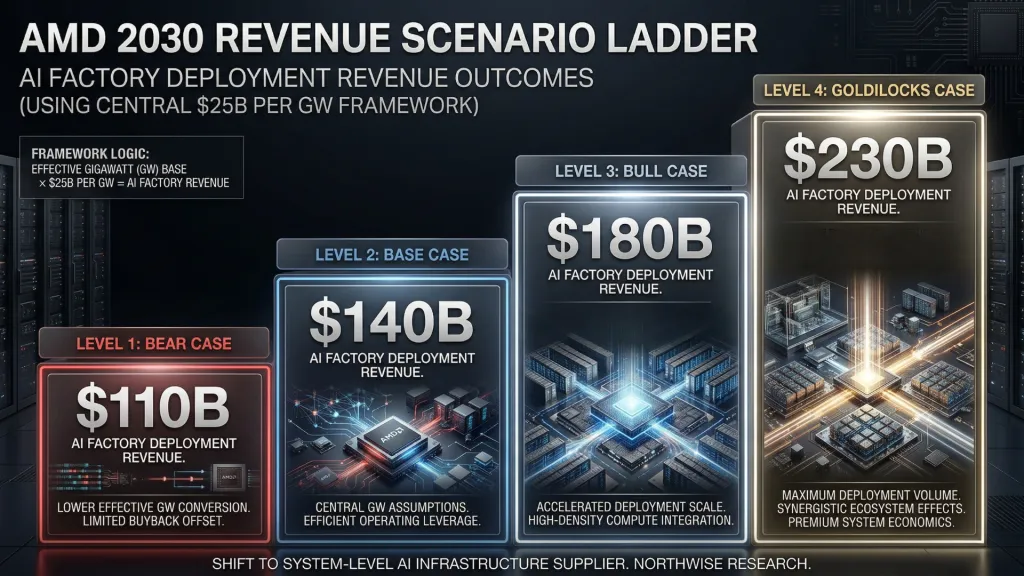
Using the central $25B per GW assumption, the 2030 AI factory bucket by case is:
Case | GW Modeled | Revenue |
|---|---|---|
Bear | ~4.4 GW effective | $110B |
Base | ~5.6 GW effective | $140B |
Bull | ~7.2 GW effective | $180B |
Goldilocks | ~9.2 GW effective | $230B |
The sensitivity around per-GW economics is meaningful and worth stating clearly:
Case | At $20B/GW | At $25B/GW | At $30B/GW |
|---|---|---|---|
Bear | $88B | $110B | $132B |
Base | $112B | $140B | $168B |
Bull | $144B | $180B | $216B |
Goldilocks | $184B | $230B | $276B |
4.4 Why We Raised the Rest of the Business
Engine 2 captures AMD's non-AI-factory businesses. Each segment has its own logic for why the 2030 assumptions sit materially above the FY2025 base.
Non-Overlapping CPUs
This category captures server CPU and general-purpose compute revenue that sits outside the giant AI factory deployment bucket. It benefits from continued server CPU share gains, AI-adjacent infrastructure demand in enterprise and cloud, and broader compute demand growth driven by workloads that run alongside AI systems without being part of a multi-gigawatt factory contract.
Client
AMD's Client segment produced $10.640B in FY2025. The model assumes this more than doubles through 2030 via Ryzen AI, the broader AI PC adoption cycle, premium notebook and desktop share gains, and a refresh cycle that is still in relatively early stages. The AI PC transition creates a product differentiation opportunity that should support higher ASPs and stronger unit demand simultaneously.
Gaming
Gaming revenue of $3.910B in FY2025 already included a meaningful recovery, with Q4 FY2025 up 50% year-over-year driven by semi-custom and Radeon demand. The forward model assumes further recovery through the console cycle reset, stronger semi-custom conditions, tighter gaming GPU supply, and healthier discrete GPU economics. AMD remains well-positioned in semi-custom through its console relationships and has room to improve discrete GPU market share as the product stack matures.
Embedded
The Embedded segment produced $3.454B in FY2025 and should become a larger contributor over time as inference broadens into edge environments, Xilinx-driven adaptive compute matures, and automotive, industrial, telecom, and edge AI use cases expand. This is the segment with the longest development timeline and the widest range of possible outcomes, though the secular trends supporting it are durable.
The 2030 assumptions for Engine 2 by case:
Segment | Bear | Base | Bull | Goldilocks |
|---|---|---|---|---|
Non-Overlapping CPUs | $35B | $45B | $60B | $75B |
Client | $17B | $22B | $28B | $35B |
Gaming | $7B | $10B | $12B | $15B |
Embedded | $10B | $14B | $18B | $24B |
Total Engine 2 | $69B | $91B | $118B | $149B |
4.5 Where the Revenue Model Is Most Sensitive
The single most important variable in the model is the all-in revenue per GW assumption for AI factory deployments. Moving from $20B to $30B per GW shifts the base case AI factory revenue from $112B to $168B, a $56B swing on a single input. That sensitivity is inherent to the structure of these partnerships. When a small number of very large deployments drive the majority of incremental revenue, the economics attached to each deployment carry outsized influence on the total.
The second most sensitive variable is the number of gigawatts that ultimately flow through the model. The current framework assumes 18 GW by 2030, with 12 GW already disclosed. If additional customers materialize at similar scale, or if OpenAI and Meta expand beyond initial commitments, the GW base could move higher. If execution delays or partnership complications reduce the effective deployment volume, it could come in lower than modeled.
Revenue per GW and total GW deployed are the two levers that matter most. The rest of the model, including Engine 2 segments, margins, dilution, and multiples, all contribute to the final output. None of them move the needle as much as the core AI factory economics.
5. The Dilution Reality
5.1 OpenAI Warrant
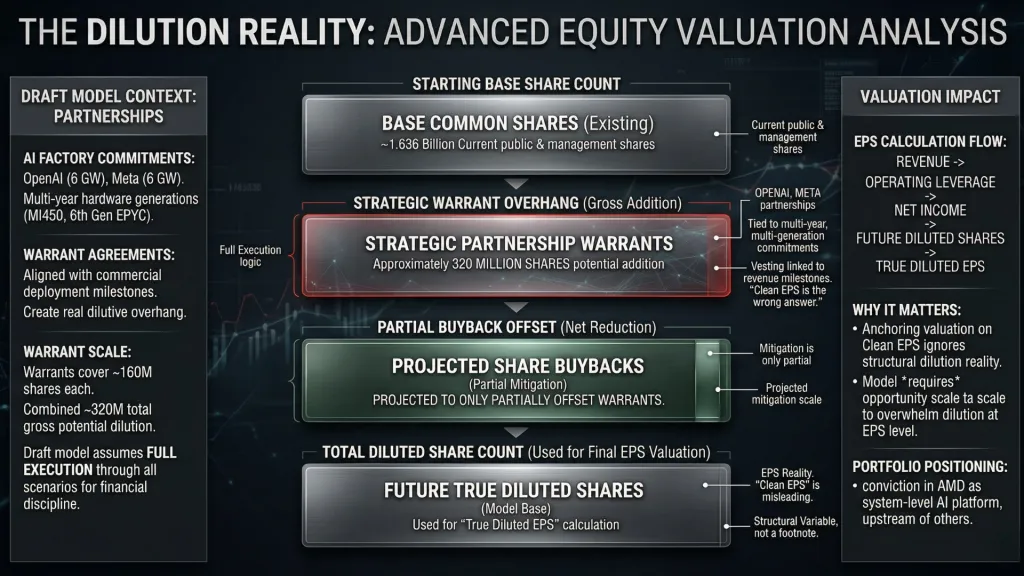
AMD issued warrants to OpenAI covering 160M shares. These warrants are tied to the commercial relationship and create real dilutive overhang that must be absorbed in any honest valuation framework.
5.2 Meta Warrant
AMD issued a parallel warrant structure to Meta, also covering 160M shares. The combined gross warrant overhang across both partnerships is 320M shares.
5.3 Why We Modeled Full Execution
The model assumes 100% execution of both warrants in all cases. That is the conservative and correct approach.
Both partnerships are structured as multi-year, multi-generation commitments at enormous scale. The commercial conditions that would trigger full warrant execution are the same conditions that support the revenue model. If AMD delivers on these partnerships, the warrants vest. If the partnerships underperform dramatically enough to prevent warrant execution, the revenue model also needs to come down. Modeling partial execution while keeping the revenue assumptions intact would create an internally inconsistent framework.
Full execution is the honest default. It also forces the model to prove that the opportunity is large enough to absorb 320M shares of dilution and still produce attractive per-share outcomes. That is a higher bar than pretending the dilution might not arrive.
5.4 Buybacks as Only a Partial Offset
AMD ended FY2025 with approximately $9.4B remaining under its share repurchase authorization. That is meaningful capital, though it is not enough on its own to fully erase the warrant overhang.
The model assumes varying buyback offsets by case, supported by growing free cash flow over time. In stronger scenarios, the company generates enough cash to fund more aggressive repurchases alongside the warrant dilution. In weaker scenarios, the buyback offset is smaller. That tiered approach keeps the share count assumptions tied to the operating quality of each scenario rather than assuming a fixed buyback regardless of business performance.
5.5 Why the Correct Answer Is Future Diluted EPS, Not Clean EPS
The correct analytical sequence is revenue, then margin, then net income, then future diluted shares, then diluted EPS. Anchoring valuation on a pre-dilution EPS number would produce a fantasy that flatters the thesis without reflecting what shareholders actually receive.
AMD's FY2025 diluted weighted-average share count was approximately 1.636B, and the company had approximately 1.630B shares outstanding as of late January 2026. The model starts from that base, adds the full 320M warrant overhang, and applies buyback offsets that vary by scenario to arrive at future diluted share counts that reflect the real capital structure.
Every EPS figure in this report is a diluted figure. Every price target is built on diluted EPS. There is no pre-dilution version of the thesis hiding underneath. That discipline is what gives the outputs credibility even at the scale they reach.
6. Scenario Revenue Ladder
6.1 Bear
The bear case combines $110B in AI factory deployment revenue (central $25B/GW assumption, lower GW conversion) with $69B from Engine 2, producing total 2030 revenue of $180B.
This outcome implies a 2025-to-2030 CAGR of 39.0% from the FY2025 base of $34.639B. That is an exceptionally high growth rate, and it is the bear case. The framework acknowledges that directly. Even the most conservative scenario in the model describes a business compounding revenue at close to 40% annually for five consecutive years. That is a function of how large the disclosed opportunity is. The bear case does not assume the partnerships fail. It assumes they execute more slowly, convert at lower per-GW economics, and produce a smaller overall outcome than the central path.
6.2 Base
The base case combines $140B in AI factory deployment revenue with $91B from Engine 2, producing total 2030 revenue of $230B and a 2025-to-2030 CAGR of 46.0%.
This is the scenario that carries the most weight in the probability framework. It assumes AMD converts a meaningful share of the disclosed 12 GW plus reasonable additional customer or expansion volume, achieves per-GW economics close to the central assumption, and grows the rest of the business at rates supported by the underlying product and share-gain trajectories. The base case is demanding. It is also the outcome most consistent with the evidence currently available.
6.3 Bull
The bull case combines $180B in AI factory deployment revenue with $118B from Engine 2, producing total 2030 revenue of $300B and a 2025-to-2030 CAGR of 54.0%.
This path requires stronger execution across AI factory conversions, higher per-GW economics, faster growth in the non-AI-factory segments, and a market environment that remains favorable enough to support premium economics throughout the forecast window. The bull case does not assume anything unreasonable. It assumes that multiple favorable conditions align simultaneously, which is possible and has precedent in technology platform buildouts of this scale.
6.4 Goldilocks
The Goldilocks case combines $230B in AI factory deployment revenue with $149B from Engine 2, producing total 2030 revenue of $379B and a 2025-to-2030 CAGR of 61.4%.
This is the outer bound. It is included to capture the tail scenario where AMD's AI factory opportunity proves even larger than current evidence suggests, additional customers contribute at similar scale, per-GW economics run toward the high end, and the broader business accelerates faster than the base assumptions imply. The probability weight assigned to this case reflects its status as an exceptional outcome rather than a likely one.
6.5 Why the Bear Case Is Still a Very Good Business Outcome
The revenue ladder deserves a moment of honest framing. A business generating $180B in annual revenue by 2030, up from $34.639B in FY2025, is an extraordinary outcome by any reasonable standard. The bear case in this model would make AMD one of the largest technology companies in the world by revenue. It would imply a business that successfully converted scarce AI infrastructure relationships into enormous commercial value over a five-year period.
The reason it is called the bear case is that it represents the lower end of the range implied by the disclosed evidence. Relative to the opportunity, it reflects meaningful slippage, lower economics, and a less favorable outcome than the central path. Relative to the starting point, it is still a transformation of the business.
That framing matters for how investors should think about the risk profile. The downside scenario in this model is not "AMD fails." It is "AMD succeeds at a much larger scale than anything in its history, though less dramatically than the evidence might support." That is a different kind of risk than what most semiconductor frameworks describe.
7. Margin Structure and Earnings Conversion
7.1 Why We Lowered Margins from the Hotter First Pass
An earlier version of the model used higher end-state net margins. This version applies a conservative correction, lowering the margin stack by 2 points across all cases. That decision reflects several practical realities.
First, AMD's Q4 FY2025 margin included temporary items. The approximately $360M reserve release and $390M of MI308 China revenue both flattered the reported gross margin. Stripping those out pointed to underlying economics closer to 55%. Starting from the hotter number and projecting forward would have embedded a margin assumption that was already inflated.
Second, system-level AI factory deployments are not pure semiconductor margin business. When the revenue content of a partnership includes GPUs, CPUs, rack-scale systems, software, and integration work, the blended margin profile may be different from what AMD earns on a standalone chip sale. Higher revenue per deployment is the trade-off for a margin structure that reflects the broader product mix.
Third, conservative margins make the model more defensible. If the EPS outputs are still very large with lower margins, the thesis does not depend on AMD achieving best-case profitability. That reduces the number of things that need to go right simultaneously for the model to work.
7.2 End-State Net Margin Assumptions by Case
Case | Net Margin |
|---|---|
Bear | 25% |
Base | 27% |
Bull | 29% |
Goldilocks | 31% |
These are end-state assumptions for 2030. They reflect a business that has scaled into its AI factory deployment relationships, achieved mature operating leverage, and absorbed the blended margin impact of system-level revenue. The bear case at 25% is conservative for a semiconductor company at this scale. The Goldilocks case at 31% reflects an outcome where product mix, pricing power, and operating discipline all run at the favorable end of the range.
7.3 Revenue-to-Net-Income Logic
The path from revenue to net income is simple multiplication. For the base case: $230B in revenue at a 27% net margin produces $62.1B in net income. That figure then flows into the diluted share count to produce EPS.
The simplicity is intentional. The model does not attempt to build a full income statement with line-by-line operating expense assumptions, interest income offsets, and tax-rate sensitivity. Those details matter at the quarterly level. At the five-year strategic level, the net margin assumption captures the aggregate effect of all those components. If the margin assumption is reasonable, the net income output is reasonable. If the margin assumption is wrong, adjusting it by a point or two is cleaner than rebuilding a dozen line items.
8. Diluted Share Count and EPS Construction
8.1 Share-Count Assumptions by Case
Case | Future Diluted Shares |
|---|---|
Bear | 1.90B |
Base | 1.84B |
Bull | 1.76B |
Goldilocks | 1.68B |
These figures reflect the current diluted base, full execution of both the OpenAI and Meta warrants (320M shares gross), and varying buyback offsets by case. In the bear case, weaker cash flow limits the buyback offset, and the diluted share count rises to 1.90B. In the Goldilocks case, stronger cash generation supports more aggressive repurchases, bringing the diluted count down to 1.68B. The range between best and worst case is 220M shares, which is meaningful enough to affect EPS by roughly 10-15% at any given revenue and margin level.
8.2 EPS Outputs by Case
Using the central $25B per GW assumption for AI factory economics:
Case | Revenue | Net Margin | Net Income | Diluted Shares | Diluted EPS |
|---|---|---|---|---|---|
Bear | $180B | 25% | $45.0B | 1.90B | $23.6 |
Base | $230B | 27% | $62.1B | 1.84B | $33.9 |
Bull | $300B | 29% | $87.0B | 1.76B | $49.1 |
Goldilocks | $379B | 31% | $117.5B | 1.68B | $69.9 |
These are fully diluted figures. Every share of warrant overhang has been absorbed. Every buyback offset has been applied. What remains is the EPS that would flow to common shareholders under each scenario, assuming the model's revenue, margin, and share-count assumptions hold.
8.3 Sensitivity to AI Factory Economics
The per-GW assumption is the single largest source of model sensitivity. Here is how diluted EPS changes as that input moves:
At $20B per GW:
Case | Diluted EPS |
|---|---|
Bear | $20.7 |
Base | $29.8 |
Bull | $43.2 |
Goldilocks | $61.4 |
At $25B per GW:
Case | Diluted EPS |
|---|---|
Bear | $23.6 |
Base | $33.9 |
Bull | $49.1 |
Goldilocks | $69.9 |
At $30B per GW:
Case | Diluted EPS |
|---|---|
Bear | $26.4 |
Base | $38.0 |
Bull | $55.0 |
Goldilocks | $78.4 |
The range from the lowest combination ($20.7 bear at $20B/GW) to the highest ($78.4 Goldilocks at $30B/GW) is enormous. That is a feature of the model, not a flaw. It reflects the genuine uncertainty around how much economic value flows through each gigawatt of AI factory capacity. What matters is that even the most conservative corner of the sensitivity table, the bear case at the lowest per-GW assumption, still produces diluted EPS above $20. That outcome, after absorbing full warrant dilution, describes a business earning more than four times its FY2025 non-GAAP EPS of $4.17.
8.4 What the EPS Build Actually Says
The EPS construction tells a specific story. AMD's disclosed AI factory partnerships, combined with reasonable growth in the rest of the business, can produce diluted earnings power that is multiples of the current base even after absorbing very real dilution from the strategic warrant overhang.
That conclusion holds across every per-GW sensitivity and every scenario case. The magnitude varies widely. The direction does not. Whether per-GW economics come in at $20B or $30B, whether the scenario is bear or Goldilocks, the model consistently shows a business whose future earnings power has stepped into a different category than what the current share price reflects.
The question that remains is what those earnings are worth. That depends on the multiple framework, the probability weighting, and the discount rate, all of which belong in the next section of the report.
9. Transition to our AMD Stock Forecast 2030 Valuation
The free section of this report has now established the following:
The strategic thesis has been reset around AMD's transition from semiconductor supplier to system-level AI infrastructure platform, anchored by 12 GW of disclosed multi-gigawatt partnerships with OpenAI and Meta.
The revenue model has been rebuilt from AMD's actual FY2025 baseline using a two-engine architecture that separates AI factory deployment economics from the rest of the business. The locked 2030 revenue ladder ranges from $180B (bear) to $379B (Goldilocks), implying five-year CAGRs between 39% and 61%.
The dilution framework carries full execution of the 320M-share warrant overhang through every case, with buyback offsets that vary by operating quality.
The EPS construction, using conservative net margins lowered by 2 points from the initial pass, produces diluted EPS ranging from $23.6 (bear, central per-GW) to $69.9 (Goldilocks, central per-GW). Even the most conservative corner of the sensitivity table, the bear case at $20B per GW, produces diluted EPS above $20.
The remaining question is what those outputs are worth. What multiple range does AMD deserve given this growth trajectory and these risk characteristics? What does probability-weighted fair value look like when the bear, base, bull, and Goldilocks cases are combined? And what is the present value of that future outcome for an investor buying the stock today?
That is where our premium analysis begins. Premium subscribers will find the full valuation framework, scenario price targets, probability-weighted 2030 fair value, present value at multiple discount rates, Northwise portfolio positioning, and our final synthesis on what the revised model means for AMD as a long-duration holding.
Northwise Premium
Choose how to continue with Northwise
Join Northwise Premium
Unlock the rest of this report, its complete valuation, the downloadable model, portfolios, and action framework.
Join Northwise PremiumCreate a Free Account
Continue across Free Northwise research, follow companies, save reports, and receive updates.
Create a Free Account
AMD Revenue per Gigawatt: What the Hardware Is Worth
How much revenue can AMD earn per gigawatt? We examine GPU pricing, EPYC, Helios component content, delivery costs and the assumptions in our financial model.
AMD Sovereign AI Infrastructure
AMD sovereign AI: live HUMAIN systems, future Saudi capacity, LUMI-AI procurement, Korea's partnership and the path from infrastructure plans to revenue.

AMD Total Addressable Market
AMD’s total addressable market is shaped by a $500B AI accelerator market and a $1.7T compute stack driven by scale, power, and supply.
Northwise Portfolios
See how the research becomes real decisions
Reader discussion
Discuss the research
Premium access is required to join this report's discussion.
Join Northwise Premium
No comments yet. Start a thoughtful discussion.