AMD Revenue per Gigawatt: What the Hardware Is Worth
How much revenue can AMD earn per gigawatt? We examine GPU pricing, EPYC, Helios component content, delivery costs and the assumptions in our financial model.
In this article
AMD’s customers are preparing to buy far more computing power. We believe the company can earn more from each deployment, expand its CPU business and turn that growth into substantial earnings. The harder question is how much of the opportunity survives the cost of delivering it.
Imagine being responsible for the next major AI hardware purchase. The equipment is expensive, the software has to work, and the team waiting to use it has little patience for a product that performs beautifully in a presentation but takes months to make useful.
A lower chip price helps. So does having another supplier to negotiate with. Neither is enough to justify changing the machinery underneath a business that customers expect to run every day.
That is the sale AMD has to win.
The bullish argument is that the largest computing customers need more supply and want alternatives to NVIDIA. The skeptical argument is that those customers can encourage AMD, extract better terms from both companies and leave AMD shareholders with less of the benefit than the headlines suggest. Both arguments are plausible. We think the customer relationships and operating progress now justify a much larger AMD forecast, but we would not build that forecast on customers wanting an alternative alone.
We need them to keep choosing the products after they have used them.
The evidence has become harder to dismiss. AMD’s second-quarter revenue reached $11.54 billion, and management expects its Data Center business to more than double in 2027. During the earnings call, an analyst suggested roughly $30 billion of Instinct accelerator revenue for that year. Lisa Su responded that the estimate was “probably too low.” Our own estimate is $49.92 billion, which is a Northwise forecast, not a number management supplied. (AMD Q2 results)
The most important change in this refresh, however, is not another customer name or a larger market estimate. It is our treatment of what AMD earns from the hardware inside a deployment.
Our previous framework used approximately $25 billion of revenue per gigawatt. That was our assumption. This forecast replaces it with a curve that rises from $24.92 billion in 2026 to $38.70 billion in 2030, reflecting the estimated value of AMD’s accelerators, attached processors and networking. The number of devices, their selling prices and the power they require are all visible.
The resulting Base case reaches $387.75 billion of revenue, $60.63 of normalized diluted earnings per share and $96.42 billion of free cash flow in 2030. These are aggressive estimates. We are comfortable publishing them because the assumptions can be examined individually, not because large AI forecasts have become fashionable.
Our position is bullish. AMD has a credible opportunity to become a much larger supplier of profitable computing equipment without displacing NVIDIA from its leading position. Whether shareholders receive the outcome we expect will depend on the prices customers pay, the hardware AMD delivers and the capital and ownership it commits along the way.
This is a new AMD report and model revision. The earlier AMD stock forecast remains available as historical research.
Research and model date: September 23, 2026. Forward figures are Northwise estimates unless identified as company guidance. Financial forecasts follow AMD’s fiscal years. Dollar amounts in financial tables are billions unless stated otherwise. Figures may not sum precisely because of rounding.
1. The Sale AMD Has to Win
Before getting into gigawatts, it helps to understand what AMD is supplying.
The company designs processors. Some sit in personal computers or game consoles. Others run enterprise servers, control industrial equipment or perform the calculations behind AI systems. Our forecast separates those businesses because their customers, purchasing cycles and economics differ.
The Data Center business contains the largest opportunity. Here, AMD’s Instinct accelerators handle the highly parallel mathematics used in AI. EPYC is its server CPU family, responsible for general-purpose processing and the surrounding work required to keep applications running. Networking products move information among the processors. These products are different pieces of a computing system, not interchangeable names for the same chip.
Training and inference are also different jobs. Training develops a model’s capabilities by processing data and adjusting its parameters. Inference uses the resulting model to answer a question, generate an image, write code or perform another task. A customer building an AI application may need both, but the hardware requirements and purchasing decisions need not be identical.
That creates opportunities for specialization. It also makes a simple ranking of chips less useful than it first appears.
A processor’s advertised performance tells us what it might do under specified conditions. A buyer cares about what the whole system delivers after accounting for software, communication between processors, reliability and the work needed to operate it. Expensive accelerators spend their time waiting when the surrounding system cannot keep them supplied with data or coordinate their work.
AMD’s Helios platform is an effort to solve more of that problem before the equipment reaches the customer. It brings Instinct GPUs, EPYC CPUs, Pensando networking and ROCm software into a coordinated rack-scale design. A rack is the physical cabinet containing multiple connected computing systems; at this scale, the cabinet and its interconnections become part of the product’s performance. (AMD)
This is where AMD’s broader portfolio becomes valuable. A customer buying an accelerator also needs a working system around it. AMD can participate in more of that purchase and take greater responsibility for how the components fit together.
There is an accounting boundary, though. AMD states that it supplies components and develops and licenses the Helios architecture, but does not manufacture or sell the completed Helios racks. Partner assembly, cooling, electrical equipment and other vendors’ hardware therefore do not belong in AMD’s revenue just because the installation carries AMD processors. (AMD Q2 2026 filing)
We are enthusiastic about the systems strategy precisely because it can help AMD sell more of its own products. We do not need to award it everybody else’s invoice to make that strategy attractive.
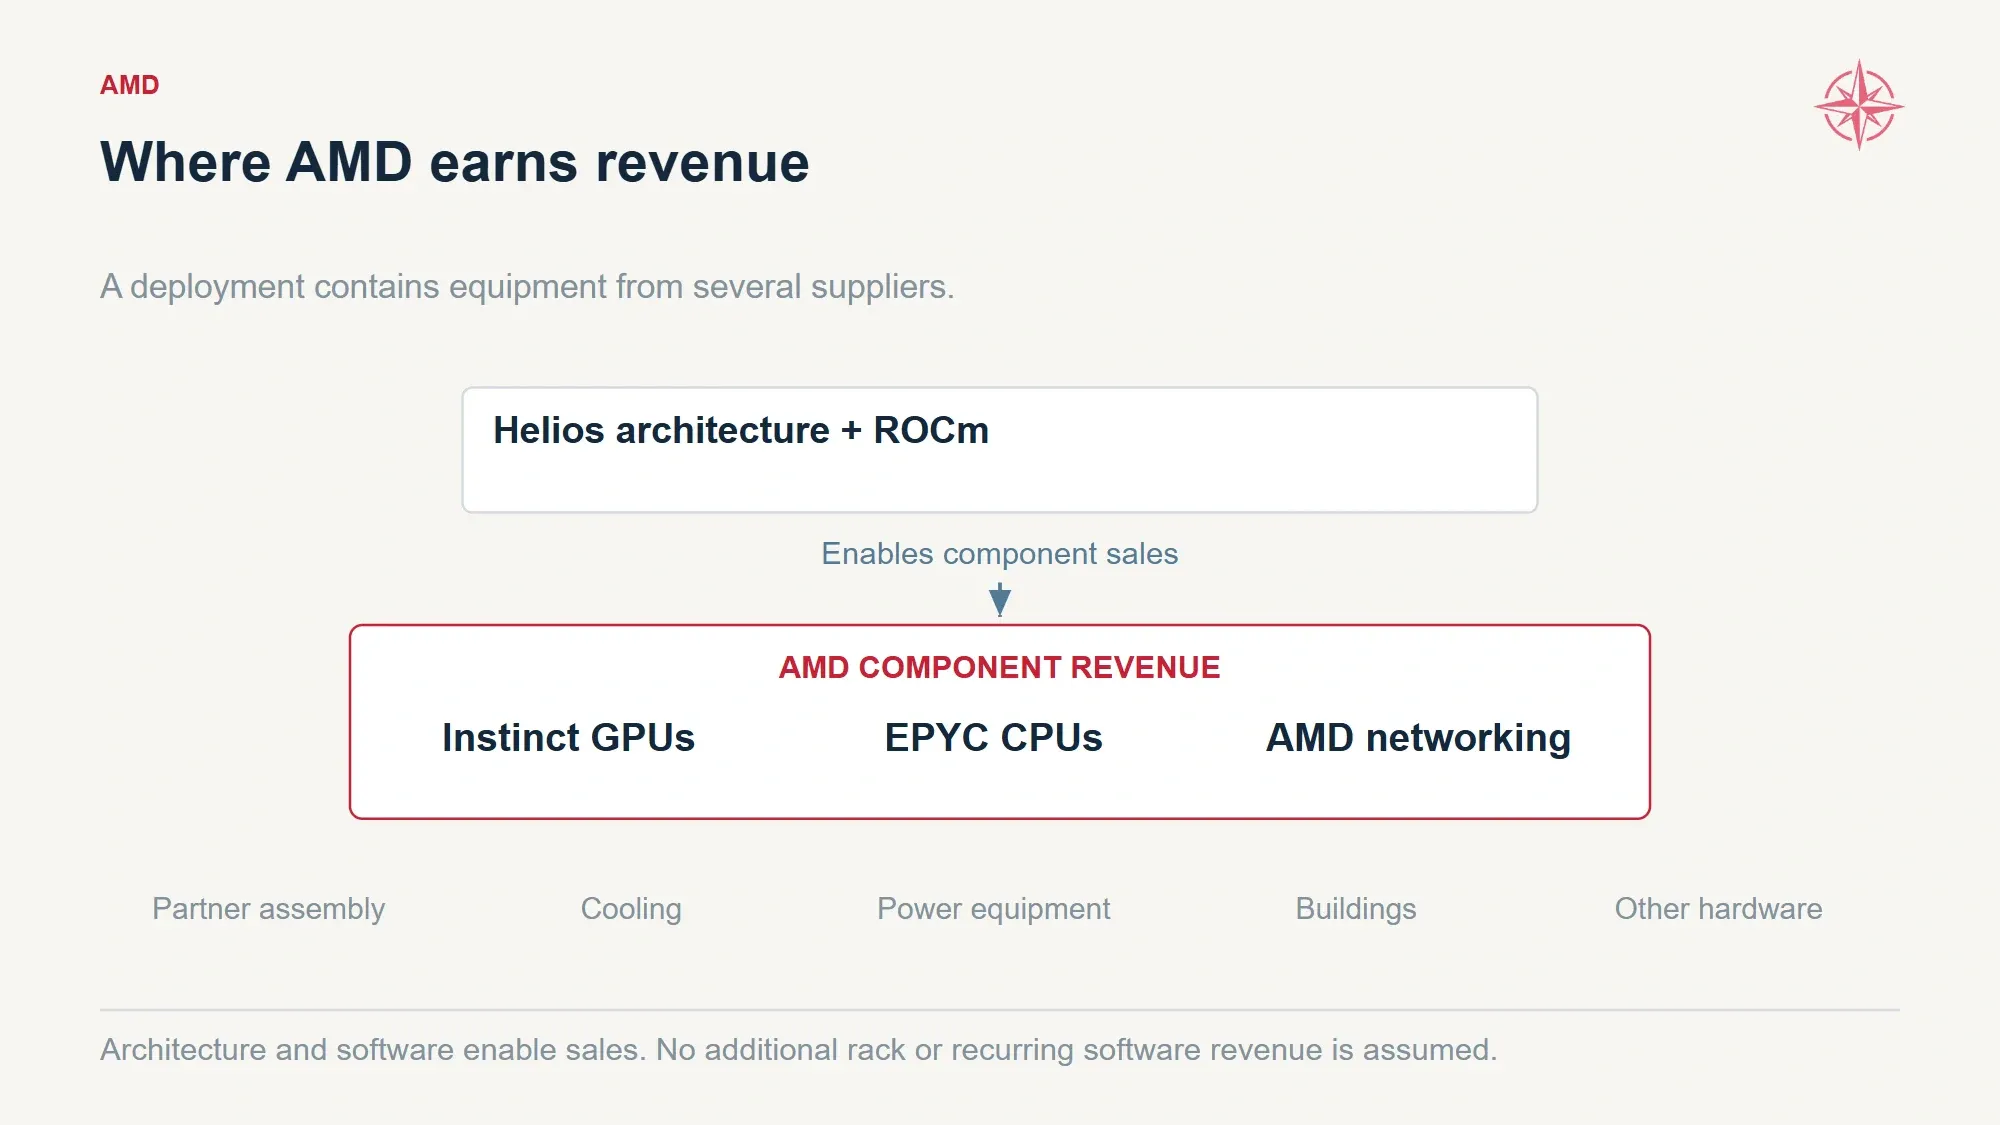
AMD’s modeled revenue includes its component content. Partner infrastructure and enabling software do not become additional revenue merely because the deployment uses AMD.
Software presents a similar issue.
ROCm is the software environment developers use to run and optimize workloads on AMD accelerators. Its importance is easiest to see from the customer’s side. Buying equipment that is cheaper upfront accomplishes little if the engineering team then spends months adapting software, fixing errors or working around missing capabilities.
AMD says more than three million models now run out of the box on its platform, and it is working with major AI laboratories to improve performance and development tools. We regard that as evidence of a much broader effort to make the hardware usable. It is not proof that every supported model runs equally well in a large production environment.
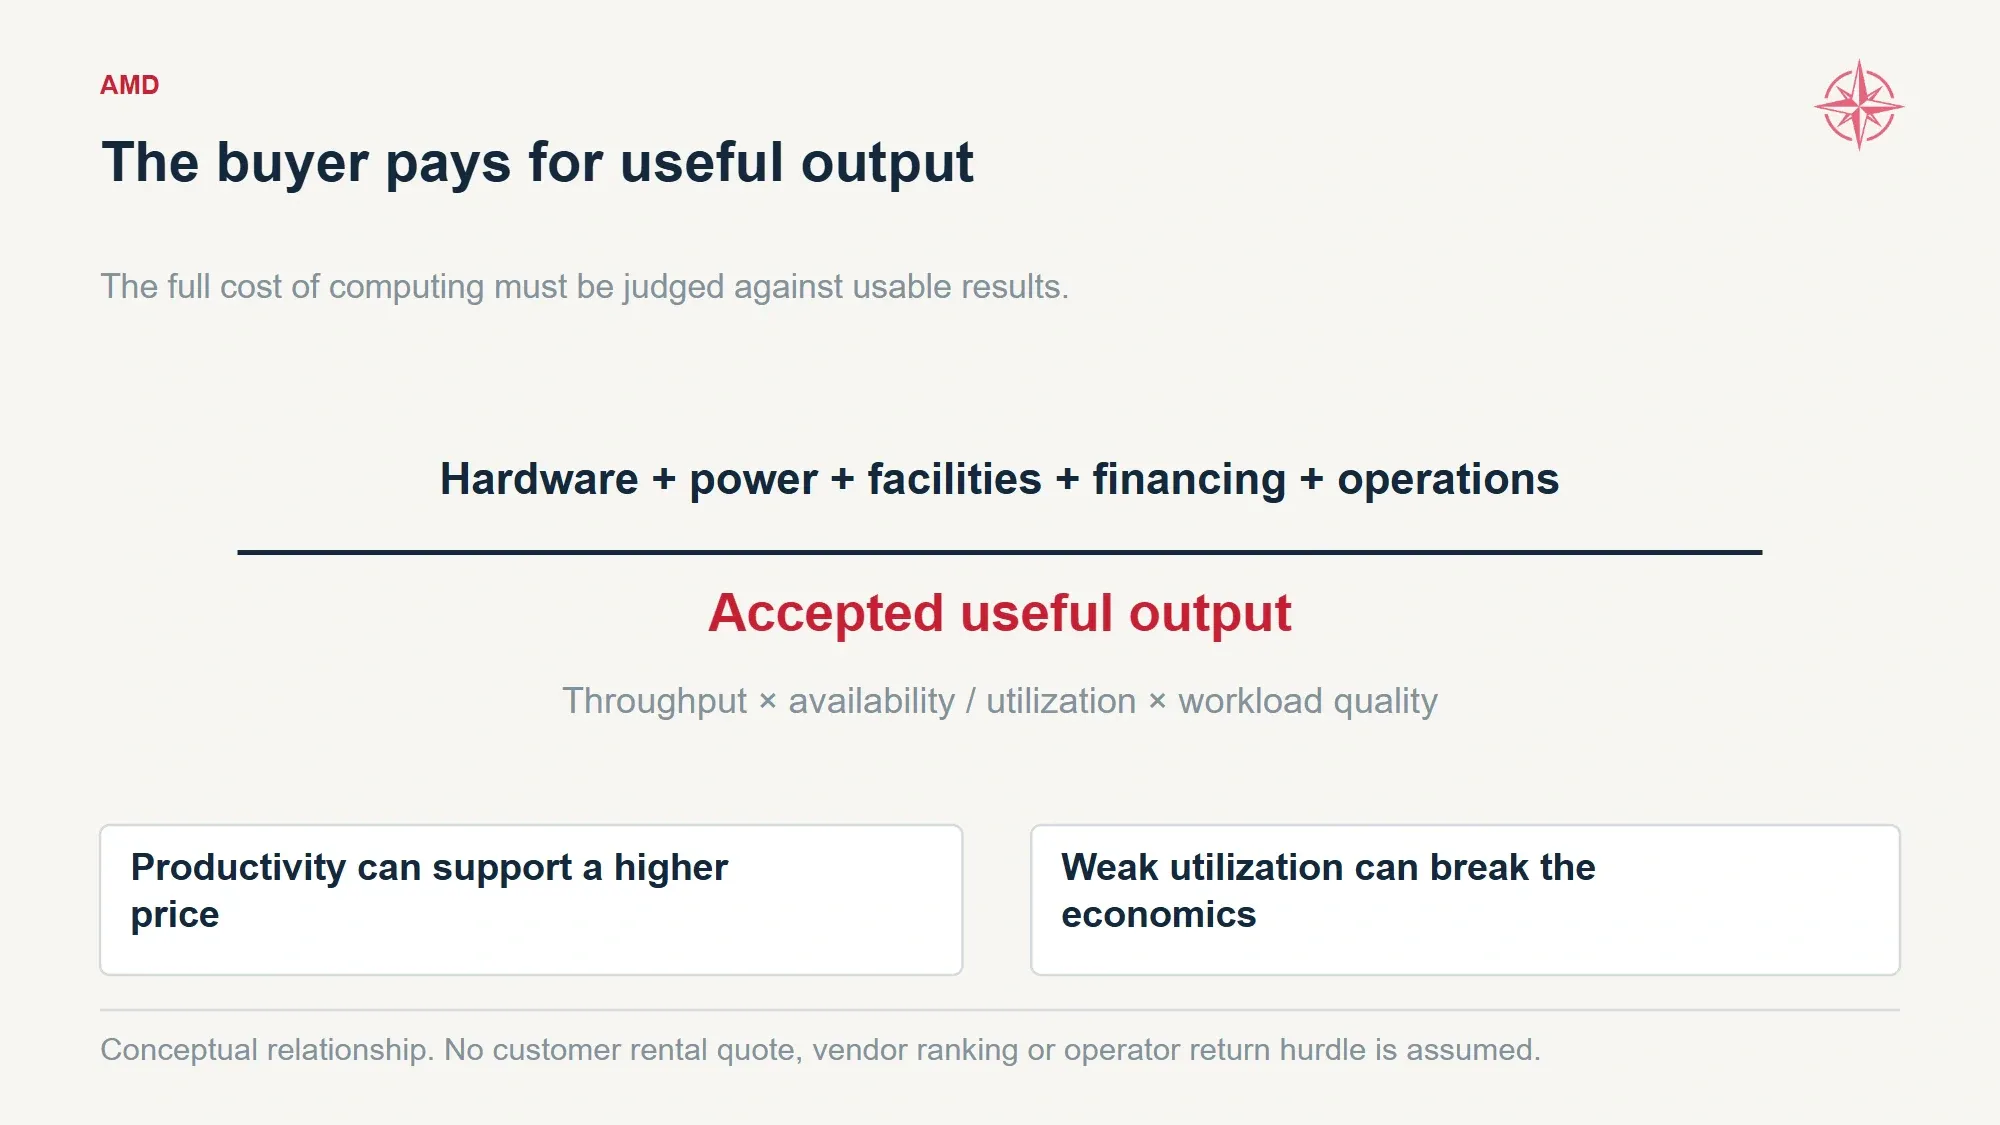
A hardware premium is sustainable only when the buyer’s useful-output economics support it. Price and productivity are related but not interchangeable.
For us, repeat purchases are ultimately more persuasive than compatibility counts. A customer that expands after operating the equipment has learned something that a benchmark alone cannot show.
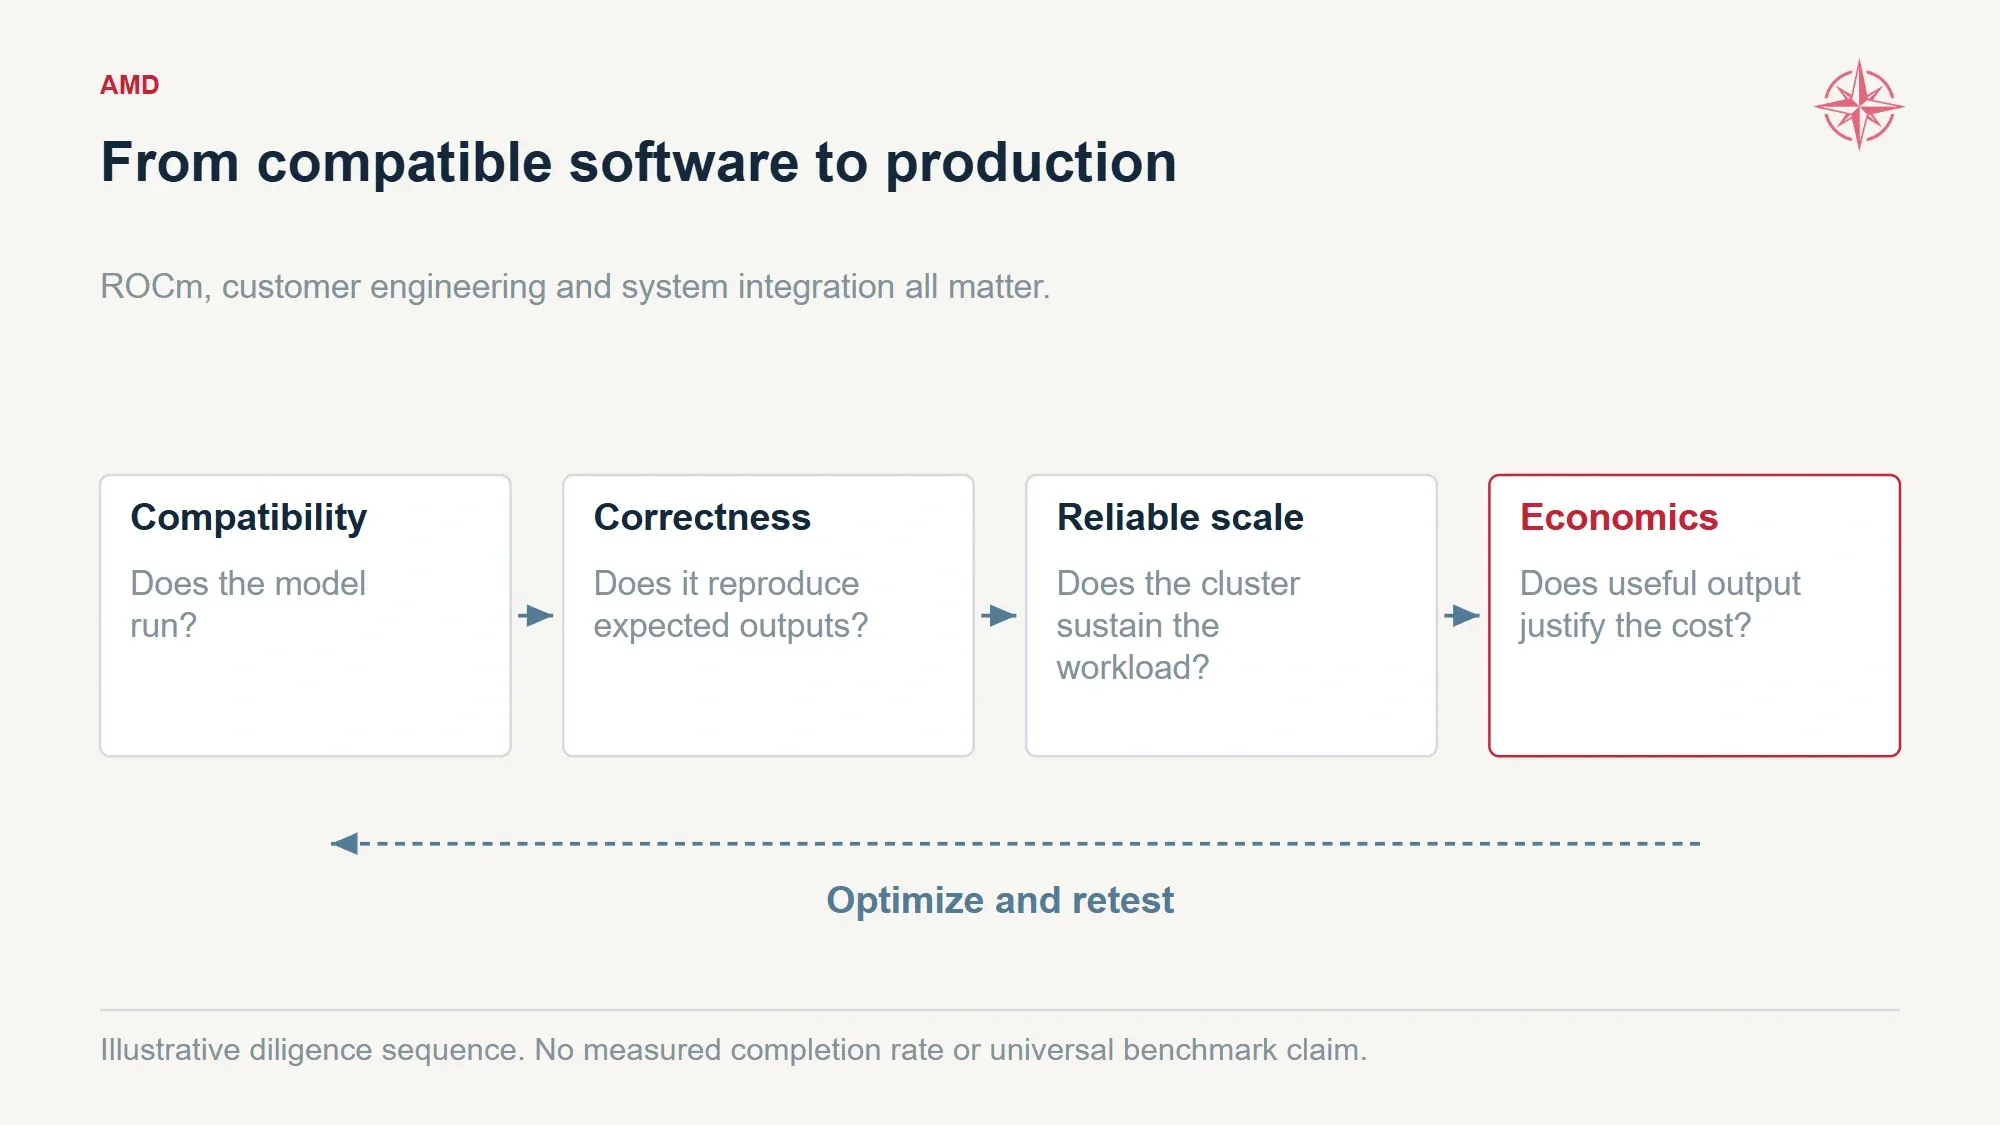
Production competitiveness depends on correctness, reliability and workload economics, not model compatibility alone.
NVIDIA has earned the right to be taken seriously on that front. It reported approximately $96.2 billion of revenue in its second quarter of fiscal 2027, including $89 billion from Data Center, with gross margin around 75%. AMD is competing against a company already delivering at a scale that its own forecast is still working toward. (NVIDIA Newsroom)
Respecting that lead does not require treating every future computing purchase as already decided. A customer can increase spending with NVIDIA and still become a much larger AMD customer. Our NVIDIA and AMD comparison considers their different competitive positions. Our thesis benefits from an expanding market as well as share gains.
It also leaves room for mixed systems. The AMD and Cerebras collaboration, for example, combines AMD hardware for high-throughput processing of incoming prompts with Cerebras technology for fast generation of the response. Different parts of the same AI task can favor different equipment. AMD can benefit from participating without supplying every component. (Cerebras)
We would rather see AMD become very useful across a growing set of workloads than insist it must win every benchmark before its business can become valuable.
2. The Customer List Is Becoming Harder to Dismiss
There is a substantial difference between a customer evaluating a product and planning infrastructure around it.
AMD’s largest relationships increasingly fall into the second category. OpenAI and Meta each have broader arrangements reaching up to six gigawatts, while Anthropic has announced a partnership covering up to two gigawatts. Those commitments deserve more weight than a collection of successful demonstrations. They also deserve a closer reading than the largest number in the press release. (AMD OpenAI agreement; AMD Meta agreement; AMD Anthropic announcement)
The original OpenAI filing specifies a binding initial one-gigawatt purchase commitment. Meta’s filing similarly identifies a binding initial one-gigawatt equivalent. The broader arrangements describe a much larger opportunity, but the public documents do not establish that every later gigawatt is equally unconditional. (AMD OpenAI agreement; AMD Meta agreement)
We are not willing to call the entire headline capacity guaranteed revenue. We are equally unwilling to dismiss binding purchases and multigeneration engineering relationships as though the customers have committed nothing.
Anthropic’s announcement is particularly useful because it adds both another major buyer and direct engineering cooperation. The first gigawatt begins deployment in the first half of 2027, with work to optimize workloads and improve ROCm. “Begins deployment” is not the same as “fully delivered,” which is why our annual forecast does not place the entire first gigawatt into the first year. (Advanced Micro Devices, Inc.)
Microsoft adds another route to market. AMD described planned Helios deployments on Azure for Microsoft, its AI customers and Azure services. Management also explained that frontier-model companies will consume AMD infrastructure through multiple cloud providers.
That can make the customer map look more diversified than the underlying demand really is.
Suppose a model developer rents capacity from a cloud operator, which purchases AMD equipment installed in a third party’s data center. The developer, cloud operator and infrastructure provider may all appear in announcements. Economically, however, they can be three participants in one deployment. Adding each announcement as separate demand would count the same equipment more than once.
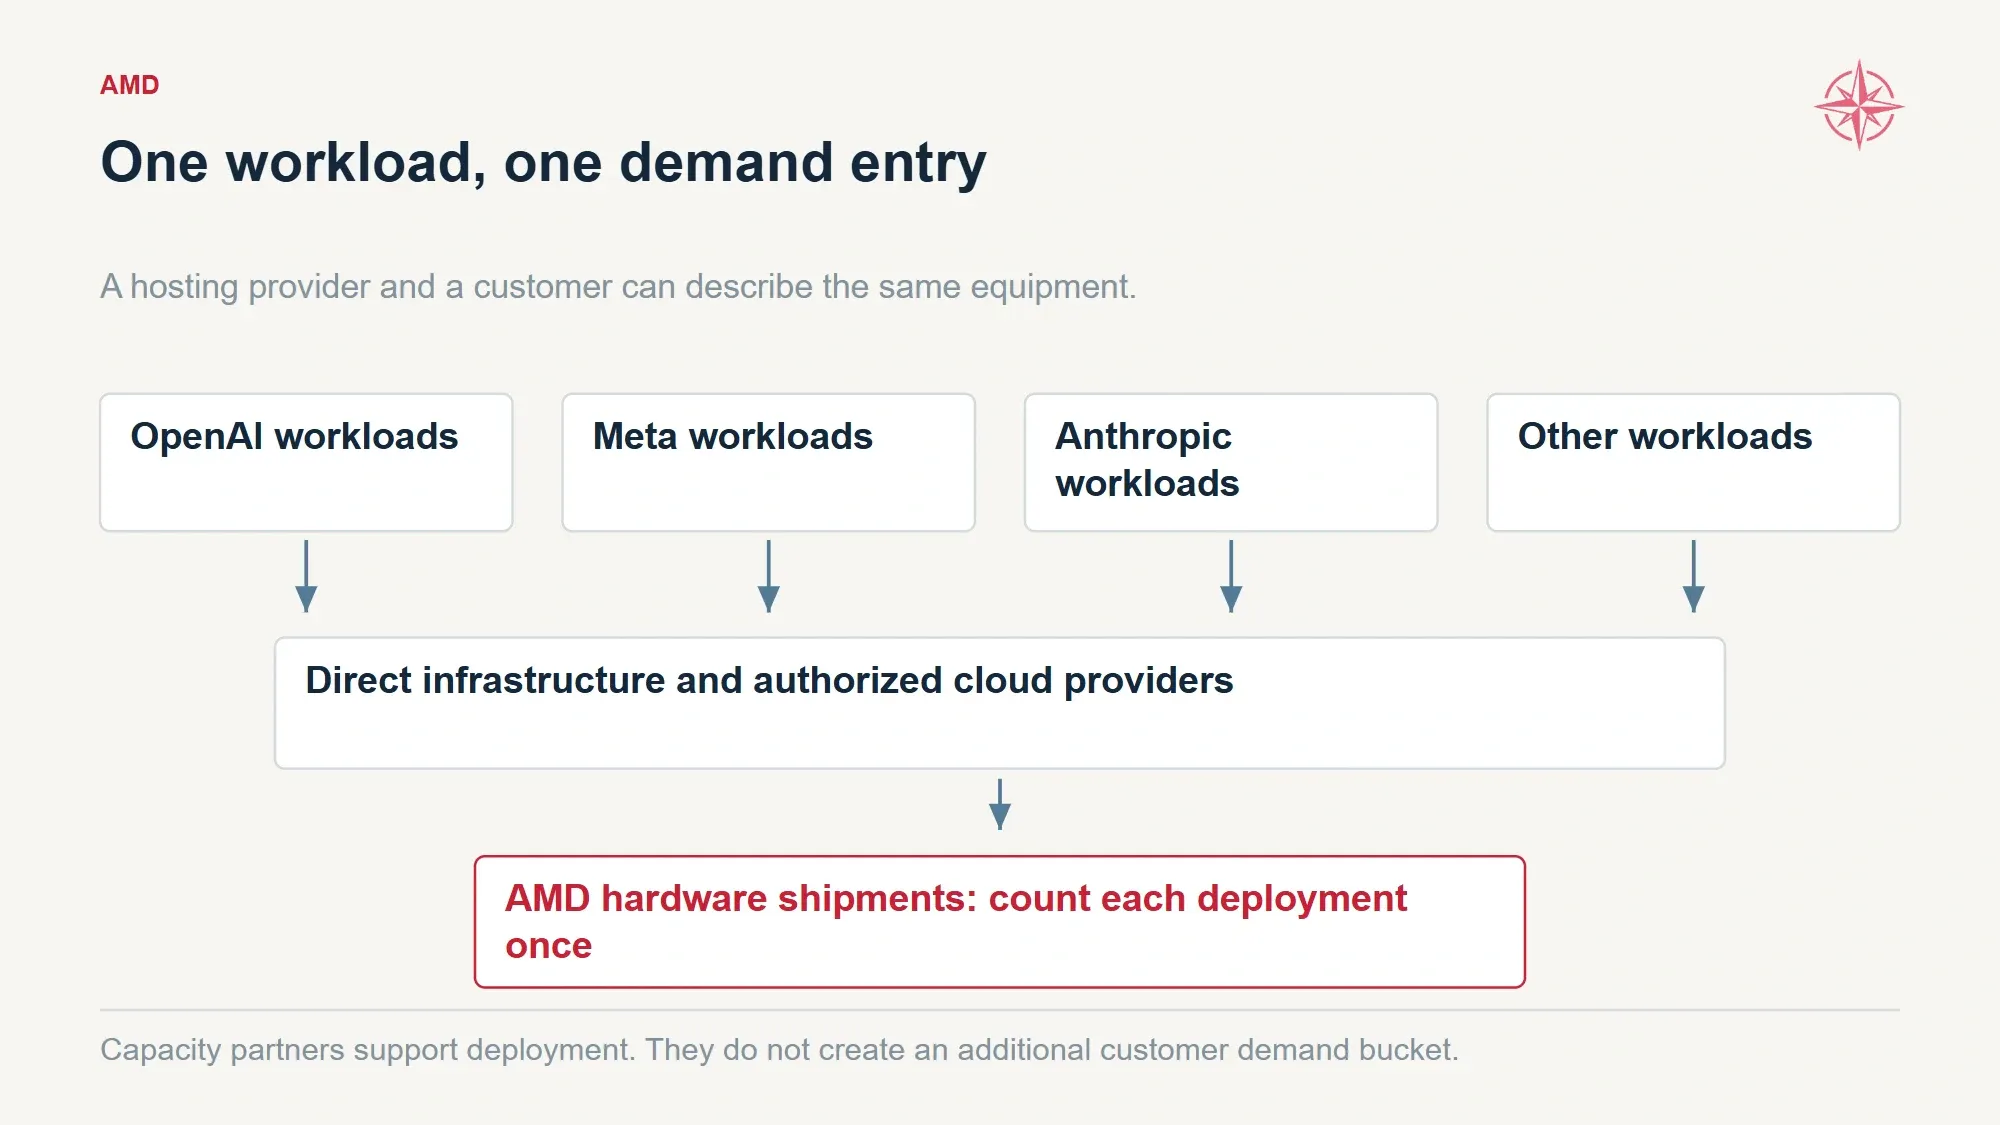
Workload owners, purchasing intermediaries and infrastructure providers can refer to the same physical deployment. The model counts it once.
Our successful-execution schedule therefore groups deliveries by the underlying customer workloads:
Modeled new installations, GW of IT capacity | 2026E | 2027E | 2028E | 2029E | 2030E |
|---|---|---|---|---|---|
OpenAI-related | 0.08 | 0.45 | 1.10 | 1.55 | 2.20 |
Meta-related | 0.08 | 0.40 | 0.90 | 1.40 | 1.80 |
Anthropic-related | 0.00 | 0.20 | 0.55 | 0.60 | 0.65 |
Other customers, excluding those workloads | 0.00 | 0.45 | 0.65 | 1.25 | 1.95 |
Total new installations | 0.16 | 1.50 | 3.20 | 4.80 | 6.60 |
These are Northwise shipment allocations, not customer-issued delivery calendars. Through 2030, they total 5.38 GW for OpenAI-related deployments, 4.58 GW for Meta, 2.00 GW for Anthropic and 4.30 GW for other workloads.
Infrastructure partnerships help make those deliveries possible.
Core Scientific’s agreement starts with more than 500 MW of infrastructure capacity in 2027 and includes an opportunity to expand to 2.5 GW. We view that as support for deployment readiness. It is not automatically another 2.5 GW of GPU demand to place on top of the customer schedule. AMD also receives warrants in Core Scientific, which are a potential asset for AMD rather than new AMD shares issued to a customer. (Core Scientific, Inc.)
The HUMAIN relationship in Saudi Arabia provides a different kind of validation. AMD, Cisco and HUMAIN reported systems live and serving customers, with a next phase of up to 250 MW within a broader plan reaching up to one gigawatt by 2030. The operating systems matter more to us than the size of an unbuilt campus. The 250 MW also remains part of the larger plan, not an extra amount to add to it. (Advanced Micro Devices, Inc.)
Our AMD sovereign AI research examines the national infrastructure opportunity in more detail.
Our reading is that AMD’s commercial position has strengthened considerably. The next test is no longer simply whether important customers will attach their names to its products. It is whether the installed systems earn enough for those customers to keep expanding.
3. How AMD Revenue per Gigawatt Can Change
A fixed revenue-per-gigawatt assumption feels reassuring because it makes the model easy to follow. It can also become an anchor long after the equipment underneath it has changed.
We previously used approximately $25 billion per gigawatt. That was our estimate of the AMD-related economic content of a large deployment, not a published customer price. The refreshed model keeps a similar starting point for 2026 but allows later generations to carry more value.
Before explaining the dollars, we need to be precise about the power.
A gigawatt is a measure of power capacity. Facility power includes cooling and other supporting systems. IT power refers to the computing equipment and related IT infrastructure. Power usage effectiveness, usually shortened to PUE, is the ratio connecting the two.
At a PUE of 1.12, a facility needs 1.12 GW to support 1.00 GW of IT equipment. Schneider Electric’s Helios reference design describes potential PUE near that level at full load and support for racks rated up to 246 kW. Those are design characteristics, not measured averages across AMD’s planned customer fleet. (Schneider Electric)
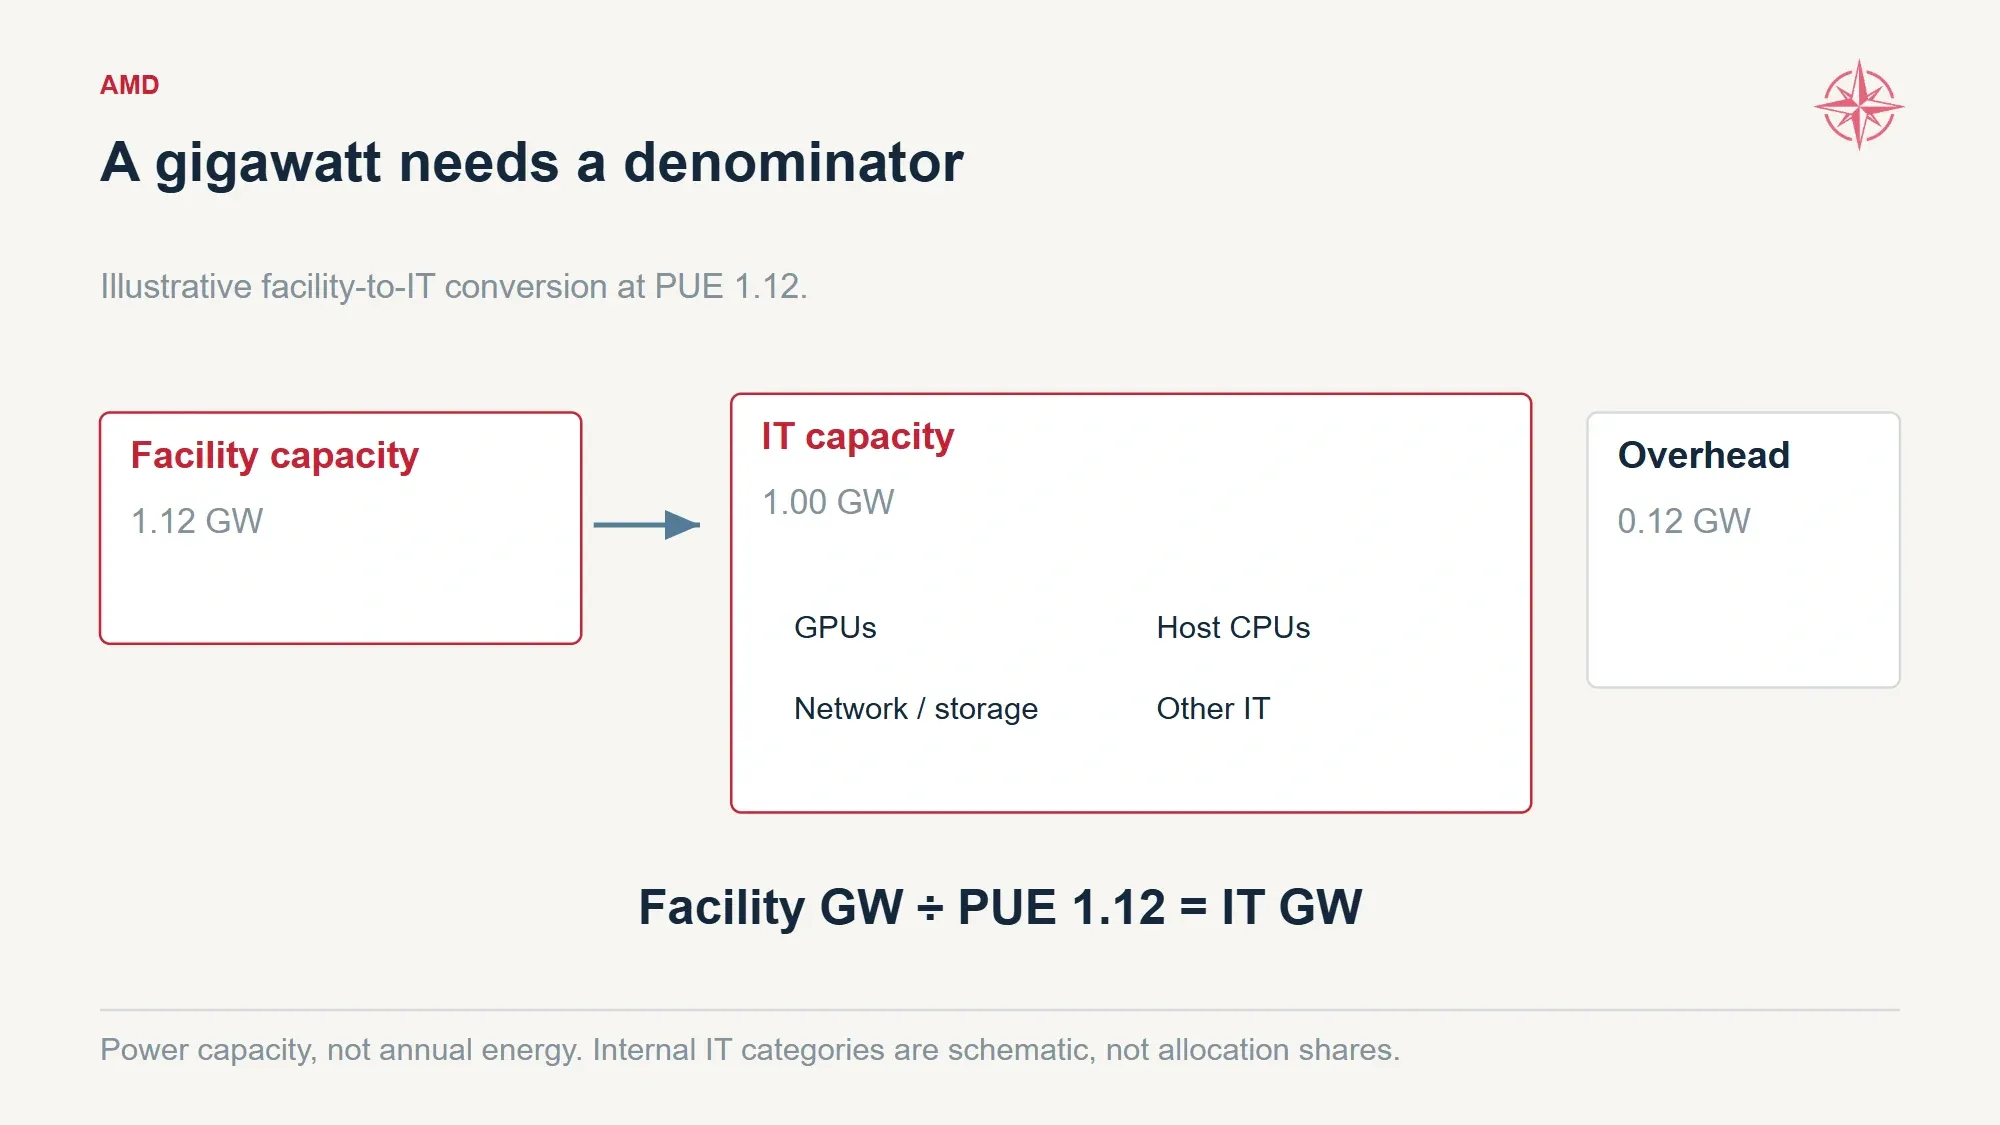
At an assumed PUE of 1.12, 1.12 GW of facility capacity corresponds to 1.00 GW of IT capacity. Actual operating performance and contract definitions may differ.
Our revenue-density calculation uses one gigawatt of IT capacity represented by delivered hardware. It estimates the AMD component revenue associated with equipping that amount of capacity. It is neither the cost of the entire data center nor annual rental income from operating it.
The equation is straightforward: how many GPUs fit into the IT power budget, multiplied by their selling price, plus the attached AMD CPUs and networking.
The difficult part is choosing the inputs.
Successive generations can use more electricity per accelerator. That can reduce the number of devices within a fixed power allowance. They can also perform more valuable work, contain more expensive components and support a higher selling price. Revenue per gigawatt rises when the value of the equipment increases faster than its power requirement.
NVIDIA’s management has described its own revenue opportunity progressing from approximately $18 billion per gigawatt with Hopper to $25 billion with Blackwell and $40 billion with Vera Rubin. The latest figure includes CPUs, GPUs, networking and other platform products. It is a useful indication of how much vendor content can change between generations, not an AMD selling-price disclosure. (StockAnalysis.com)
That evidence gives us a reason to revisit the old constant. It does not give us permission to copy NVIDIA’s number.
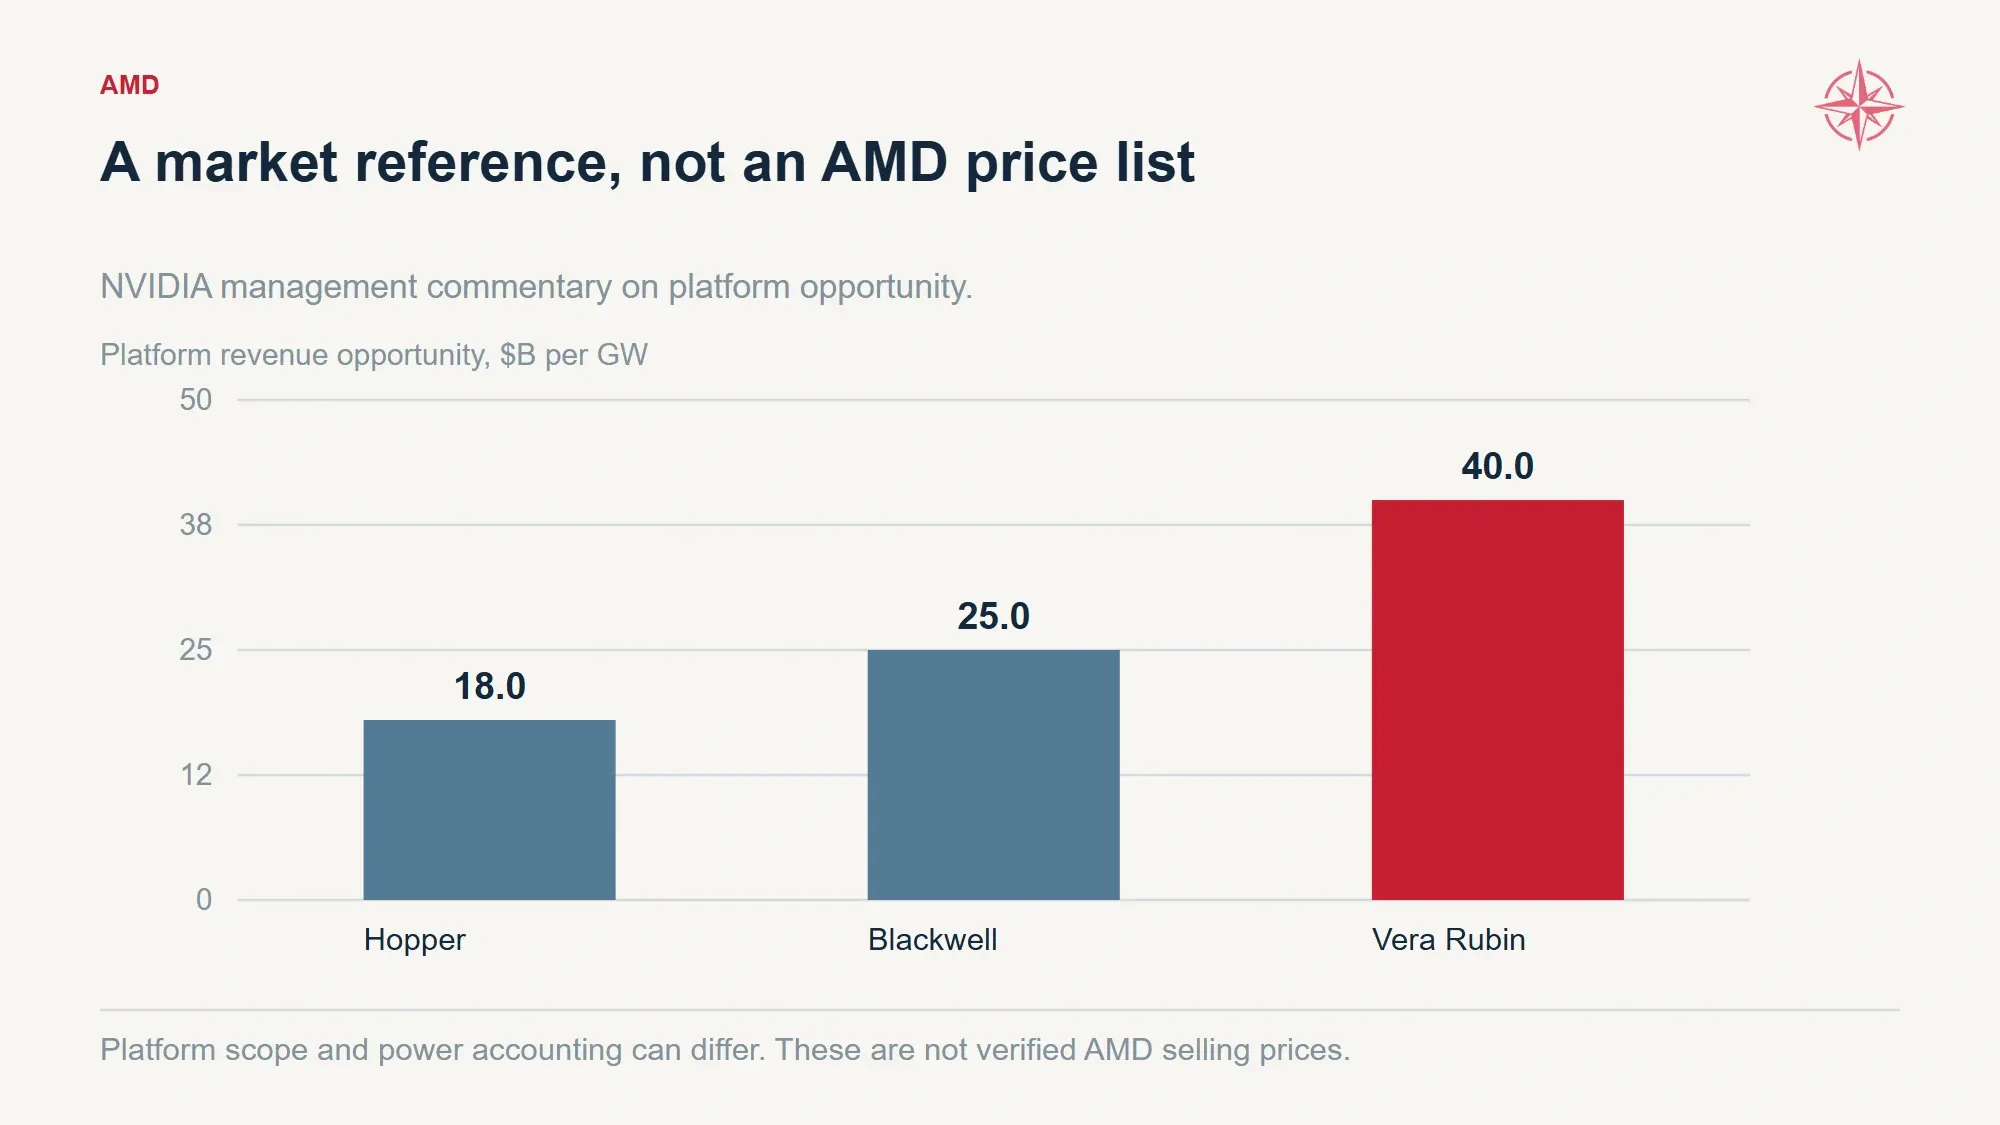
NVIDIA management’s generational platform opportunity is a reference for changing hardware content, not a direct AMD pricing input.
Here is our Base calculation:
Base hardware economics | 2026E | 2027E | 2028E | 2029E | 2030E |
|---|---|---|---|---|---|
GPUs per IT GW | 280,000 | 290,000 | 280,000 | 270,000 | 260,000 |
Modeled GPU selling price | $82,000 | $96,371 | $112,474 | $128,155 | $138,966 |
GPU revenue per IT GW | $22.96B | $27.95B | $31.49B | $34.60B | $36.13B |
Attached AMD CPU and networking revenue | $1.96B | $2.32B | $2.43B | $2.53B | $2.57B |
Total AMD component revenue per IT GW | $24.92B | $30.26B | $33.92B | $37.13B | $38.70B |
These are estimated economics for the newer-generation product mix. They are not AMD list prices or disclosed customer invoices.
For 2027, approximately 290,000 GPUs at a modeled average price of $96,371 generate about $27.95 billion. Attached AMD CPUs and networking add $2.32 billion, bringing total AMD component revenue to $30.26 billion per IT gigawatt.
The later years ask more of pricing. By 2030, the average modeled GPU price approaches $139,000, while the number of devices per IT gigawatt declines to 260,000. We are assuming more valuable hardware, not quietly increasing both device density and price forever.
The customer’s economics must support that progression. More expensive equipment can still be a better purchase when it produces enough additional useful output. A customer cares about the cost of training a model or serving an application, not merely the price printed beside a processor.
This is why we do not automatically regard better AI efficiency as bad for the hardware supplier. Efficiency can make new applications economical and expand demand. It can also reduce the equipment required for an existing task. Our forecast assumes the first effect remains strong enough to support the deployment schedule. We do not treat that response as a law of nature.
September channel reporting provides some support for earlier pricing realization. The report described an approximately 10% fourth-quarter increase affecting AI accelerators and selected other AMD products, with higher manufacturing costs cited as a factor. It was not an authenticated public schedule of AMD customer prices, and CPU coverage was insufficiently clear to apply it across EPYC or Ryzen. (PCWorld)
We use it to bring forward 25% of the following year’s anticipated GPU price improvement during 2027–2029. We do not stack another permanent 10% increase on top. The 2030 endpoint stays the same, and baseline unit costs advance with the accelerated price curve.
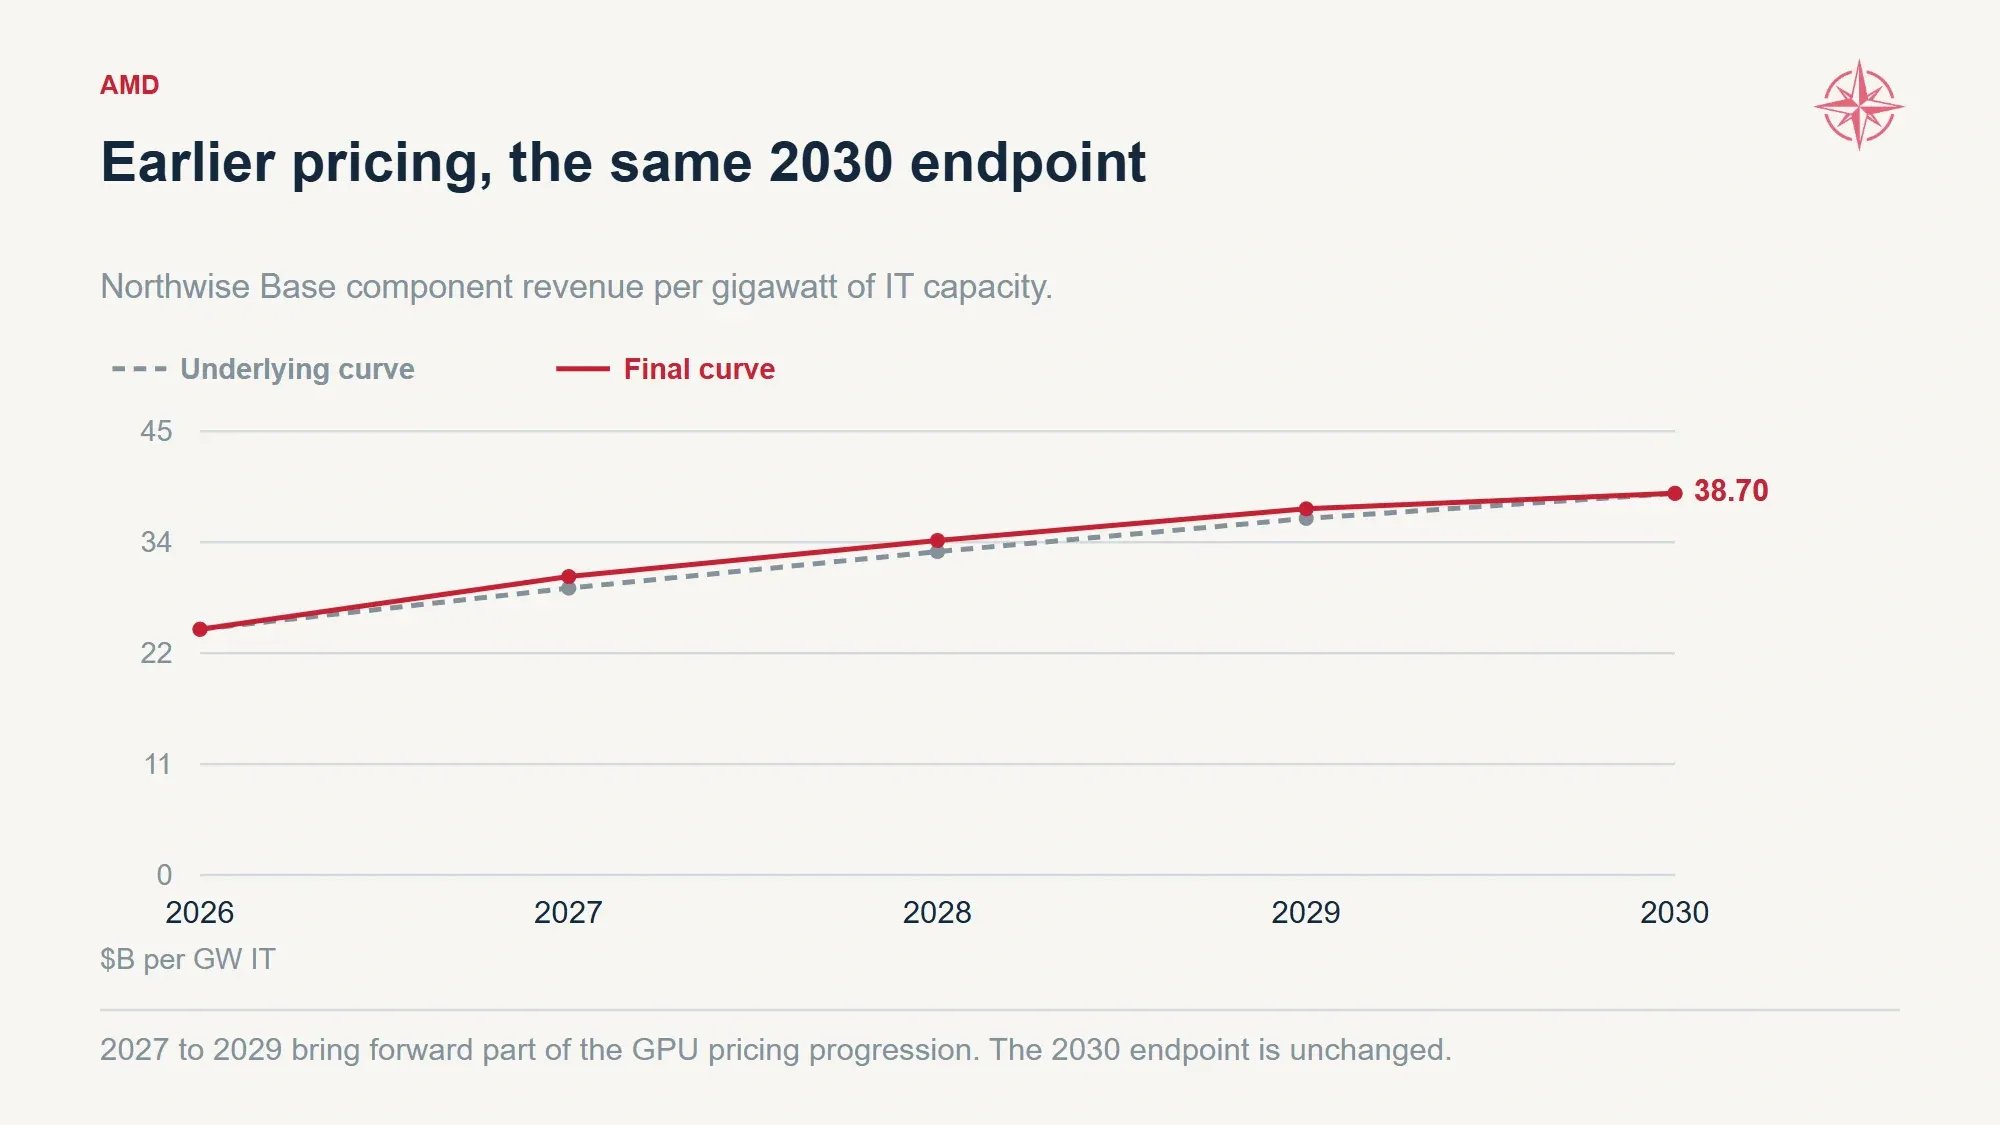
Northwise brings forward part of the anticipated GPU pricing progression during 2027–2029 while preserving the 2030 component-value assumption.
Leaving prices unchanged would also be a forecast. It would assume that several years of product development and changing system content produce little improvement in what AMD earns per unit of power. We no longer think that is the best central estimate.
The rising curve is more demanding to defend. It is also much easier to challenge intelligently because the prices, quantities and power assumptions are separate.
4. A Product Roadmap Is Not a Delivery Schedule
The next generation can be excellent and still arrive too late to make the year’s revenue forecast.
That risk becomes more important as AMD moves into large coordinated deployments. Finished accelerators need memory, packaging, networking and systems ready around them. Customers need facilities capable of powering and cooling the equipment. Software has to pass the buyer’s requirements before a planned installation becomes usable capacity.
AMD says Helios entered production with initial shipments expected in the second half of 2026, followed by a larger ramp in 2027. Management also intends to introduce a new rack-scale AI platform annually. We view that cadence as an opportunity to improve performance and product value, but it creates a demanding sequence of launches, qualifications and manufacturing ramps.
An annual release does not mean customers replace every system annually.
Hardware can remain useful after a newer generation arrives. Some customers will upgrade quickly; others will keep older equipment on workloads where it remains economical. Our model therefore separates new installations from replacement purchases rather than assigning every product launch an automatic retirement of the existing fleet.
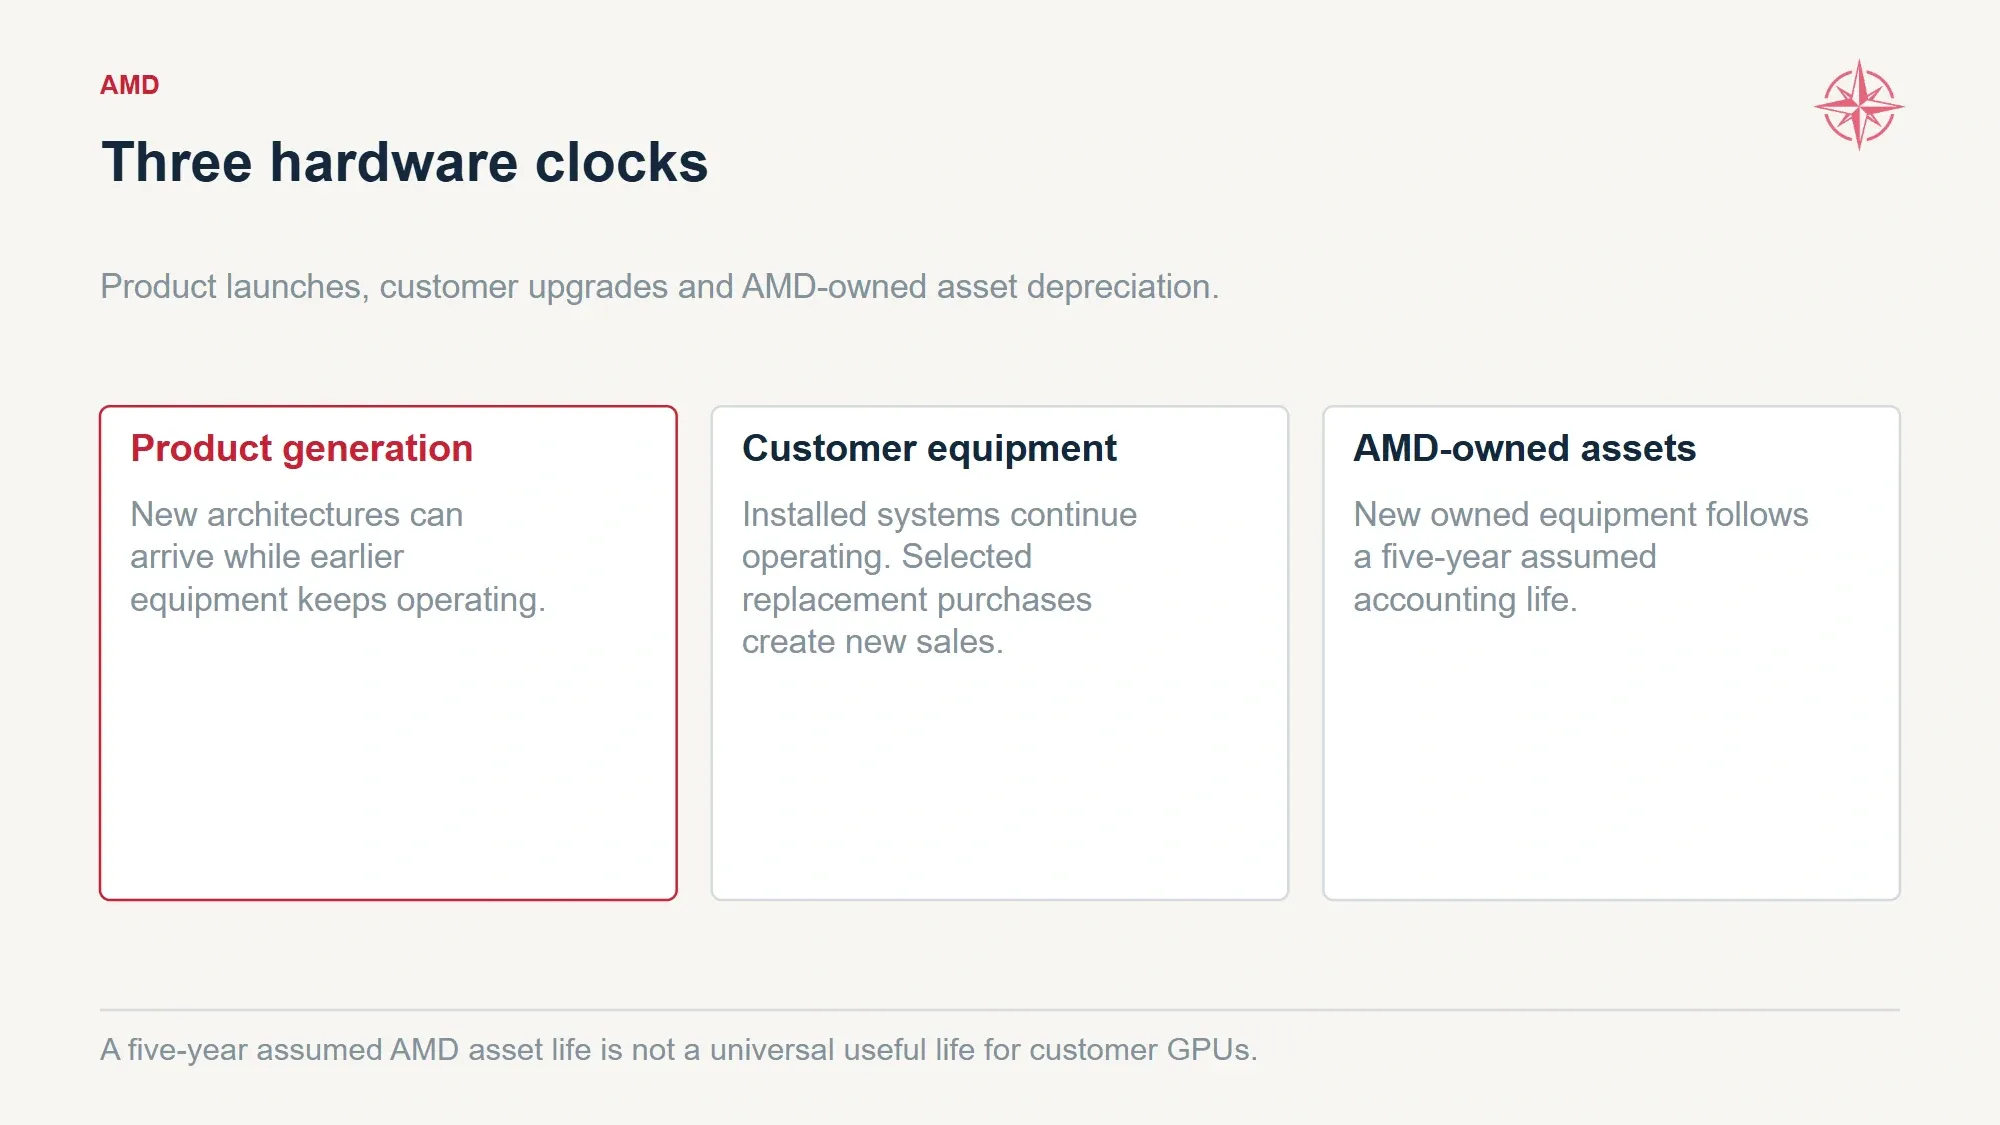
Architecture cadence, customer replacement purchases and AMD’s owned-asset depreciation are separate clocks in the model.
Hardware shipment schedule | 2026E | 2027E | 2028E | 2029E | 2030E |
|---|---|---|---|---|---|
New installations, GW IT | 0.16 | 1.50 | 3.20 | 4.80 | 6.60 |
Replacement and upgrade purchases, GW equivalent | 0.00 | 0.00 | 0.15 | 0.20 | 0.52 |
Total hardware shipment equivalent | 0.16 | 1.50 | 3.35 | 5.00 | 7.12 |
Cumulative new installations | 0.16 | 1.66 | 4.86 | 9.66 | 16.26 |
The cumulative row excludes replacements. The annual shipment rows determine hardware sales. A gigawatt installed in 2027 does not create another complete hardware invoice in 2028 simply because the equipment remains switched on.
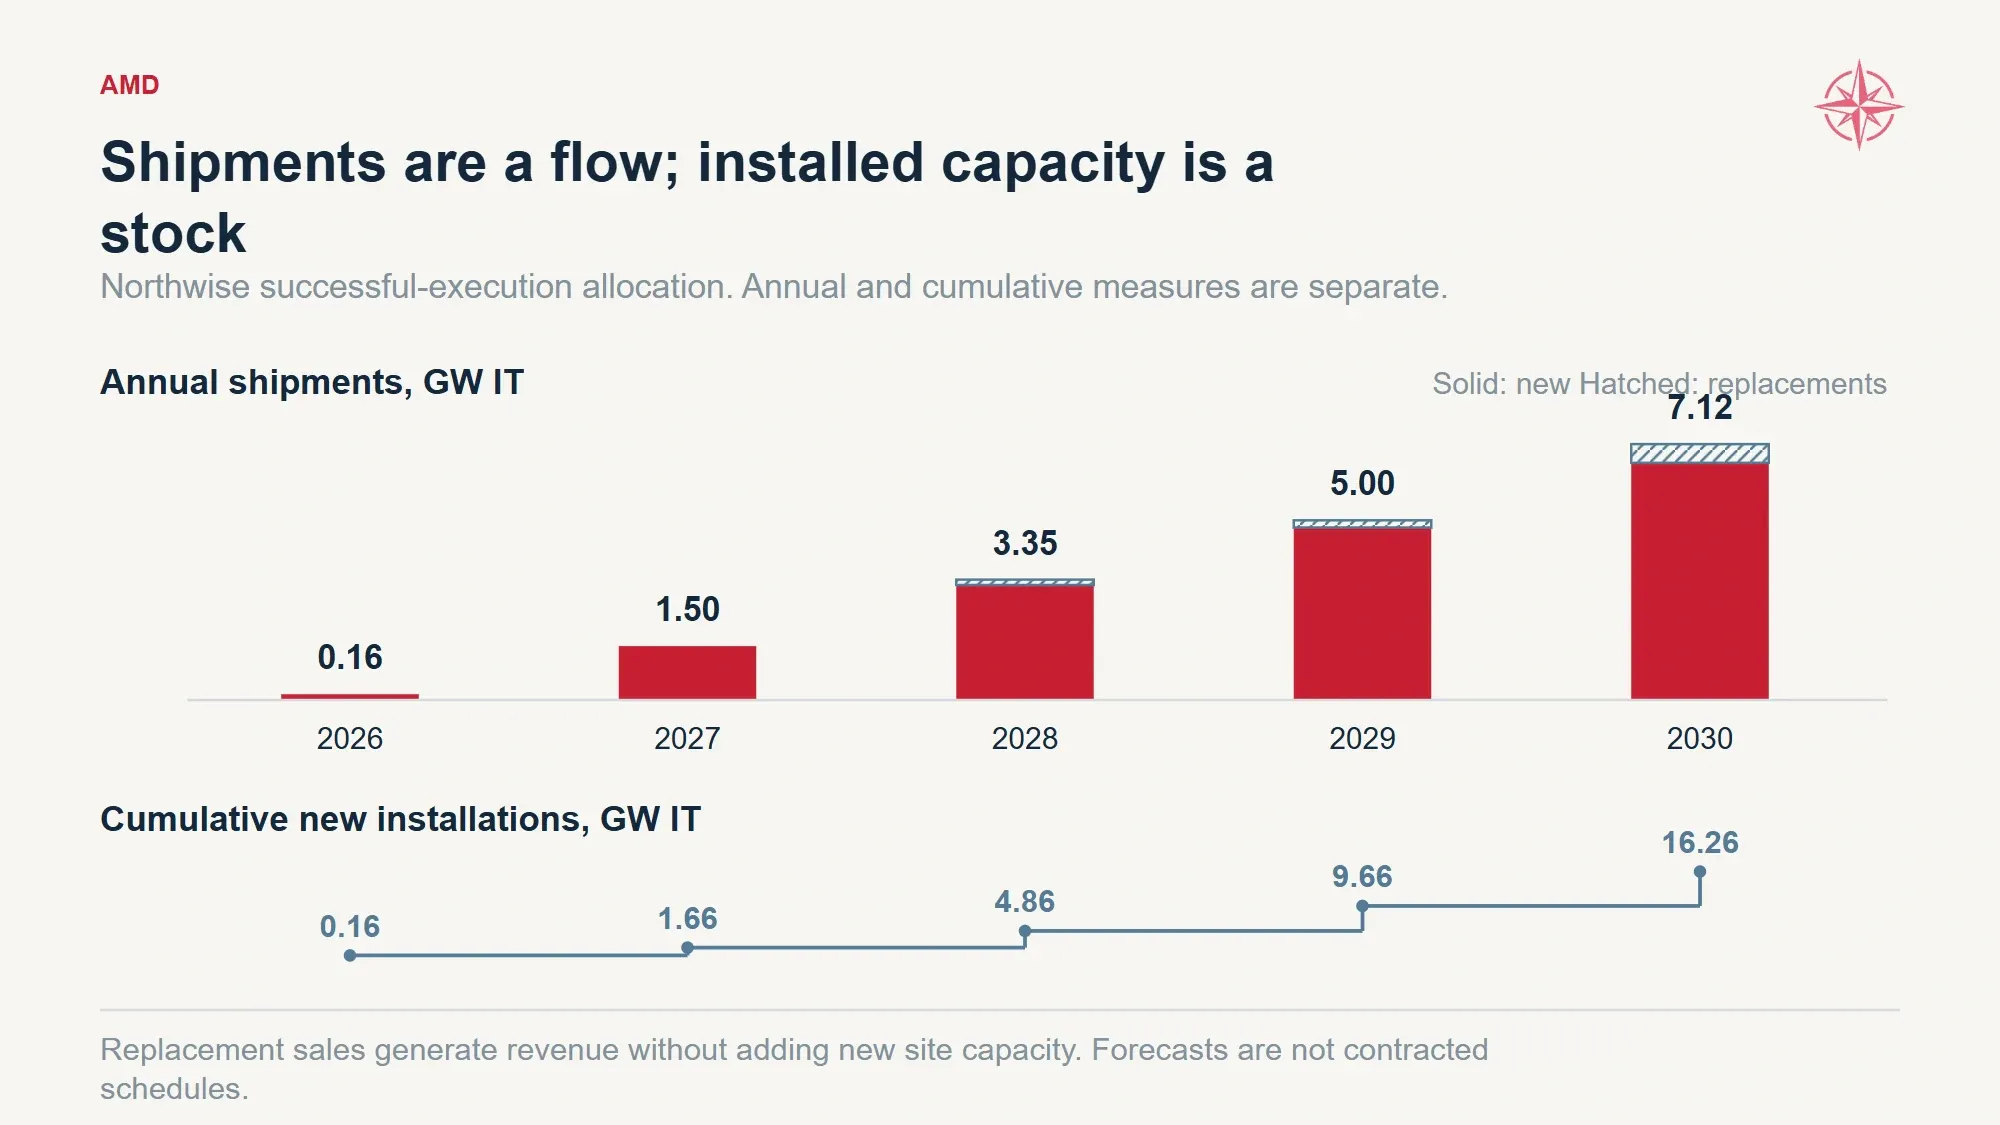
The shipment model recognizes annual hardware deliveries. Replacement purchases can generate revenue without adding new site capacity.
The physical requirements are substantial. Our successful-execution schedule implies approximately 435,000 newer-generation GPUs in 2027 and 1.851 million in 2030. Using the current Helios configuration of 72 GPUs per rack for illustration, that is roughly 6,000 rack equivalents in 2027 and 25,700 in 2030. Future systems may have a different layout. (AMD)
High-bandwidth memory, or HBM, is another part of the supply requirement. This is the fast memory placed close to an accelerator so that the processor can obtain the information needed for its calculations. Applying the current MI455X specification of up to 432 GB per device to our modeled quantities implies about 188 petabytes of memory-equivalent supply in 2027 and 800 petabytes in 2030. That calculation illustrates scale; it does not assert that future devices use the same memory configuration or that AMD has already secured the supply. (AMD)
These are the kinds of quantities that make a supply-chain discussion worth having. “Demand is strong” does not answer whether AMD has sufficient packaging capacity, suitable memory and completed customer facilities at the same time.
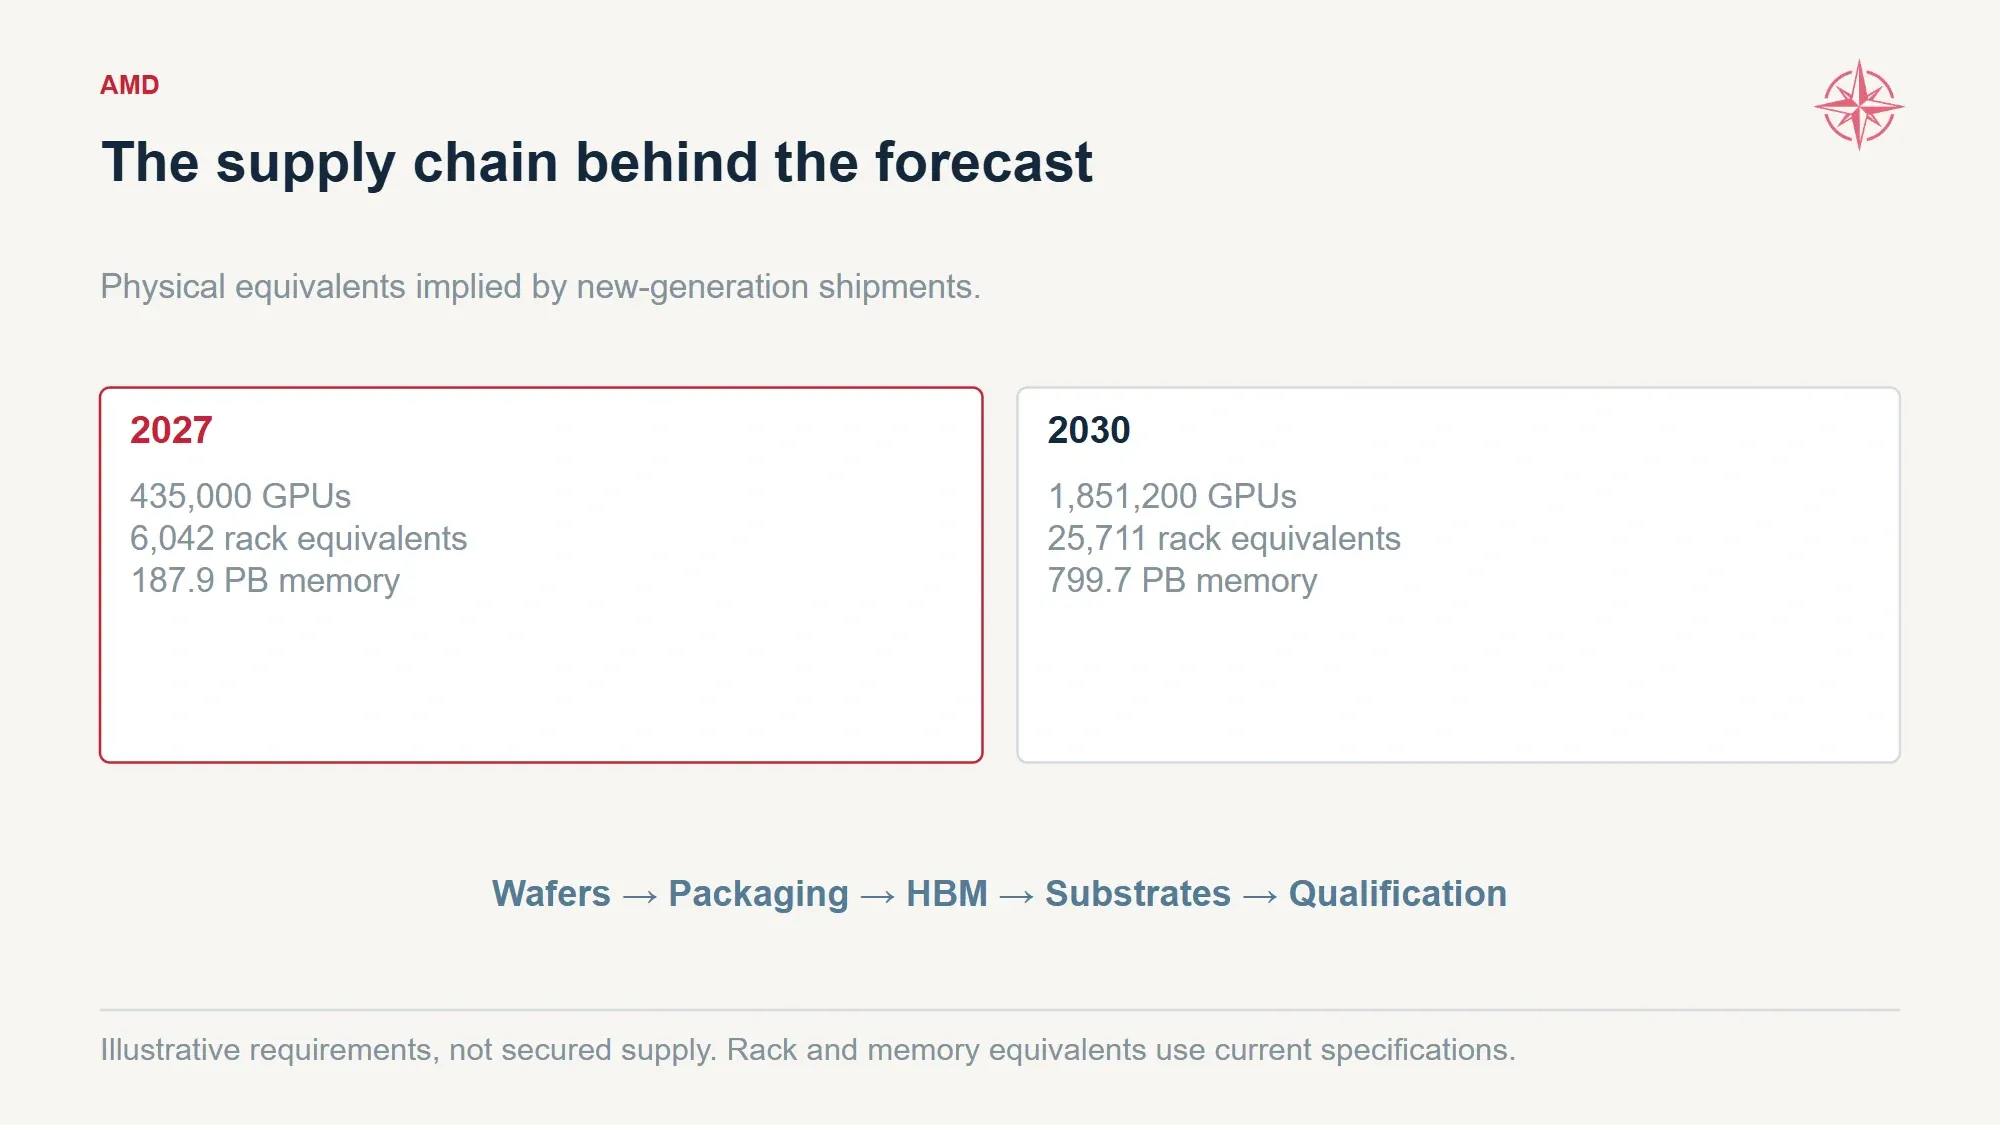
Current rack and memory specifications translate the shipment assumptions into an illustrative procurement burden. Future designs and secured allocations can differ.
Management expressed confidence in the component supply chain while acknowledging that additional upside depends on how quickly more data-center capacity becomes available. That is consistent with our approach: demand can be stronger than the revenue AMD is able to recognize in a given year.
We also test lower GPU density because the IT power budget must accommodate more than accelerators alone. The rack’s maximum power rating, actual average consumption and the supporting storage and networking allowance are different quantities. A model that mixes them can produce an impressive revenue figure from equipment that does not fit the stated power budget.
Our willingness to forecast a large ramp comes with a corresponding burden of evidence. We want to see successive deliveries, customer acceptance and repeat orders. The product roadmap tells us what AMD intends to sell. Those operating milestones tell us whether it can sell enough of it.
5. EPYC Deserves Its Own Investment Case
A GPU can perform the mathematical work inside an AI model without taking over everything the surrounding application needs.
Consider a software agent handling a business task. Generating an answer may use an accelerator. Looking up records, checking permissions, running conventional code, communicating with other applications and storing results still require general-purpose computing. The useful application consists of the whole process, not just the moment when the model generates text.
That is the reasoning behind our broader CPU forecast.
AMD’s EPYC processors sell into the host systems attached to GPU deployments, but also into conventional cloud and enterprise servers. Management has identified AI host nodes, denser agentic servers and general-purpose workloads as sources of demand. Its outlook calls for server revenue growth above 80% in the second half of 2026 and above 70% in 2027.
Our Base EPYC revenue rises from $17.90 billion in 2026 to $31.33 billion in 2027, approximately 75% growth, before reaching $75.12 billion in 2030. The first step is supported by management’s near-term outlook. The later steps require our own assumptions about adoption, product mix and market share.
Only about $9.19 billion of the 2030 CPU forecast comes from processors attached to the modeled accelerator deployments. Approximately $65.93 billion comes from other server demand. In other words, most of the CPU forecast cannot be explained by adding a fixed number of host processors to every GPU rack.
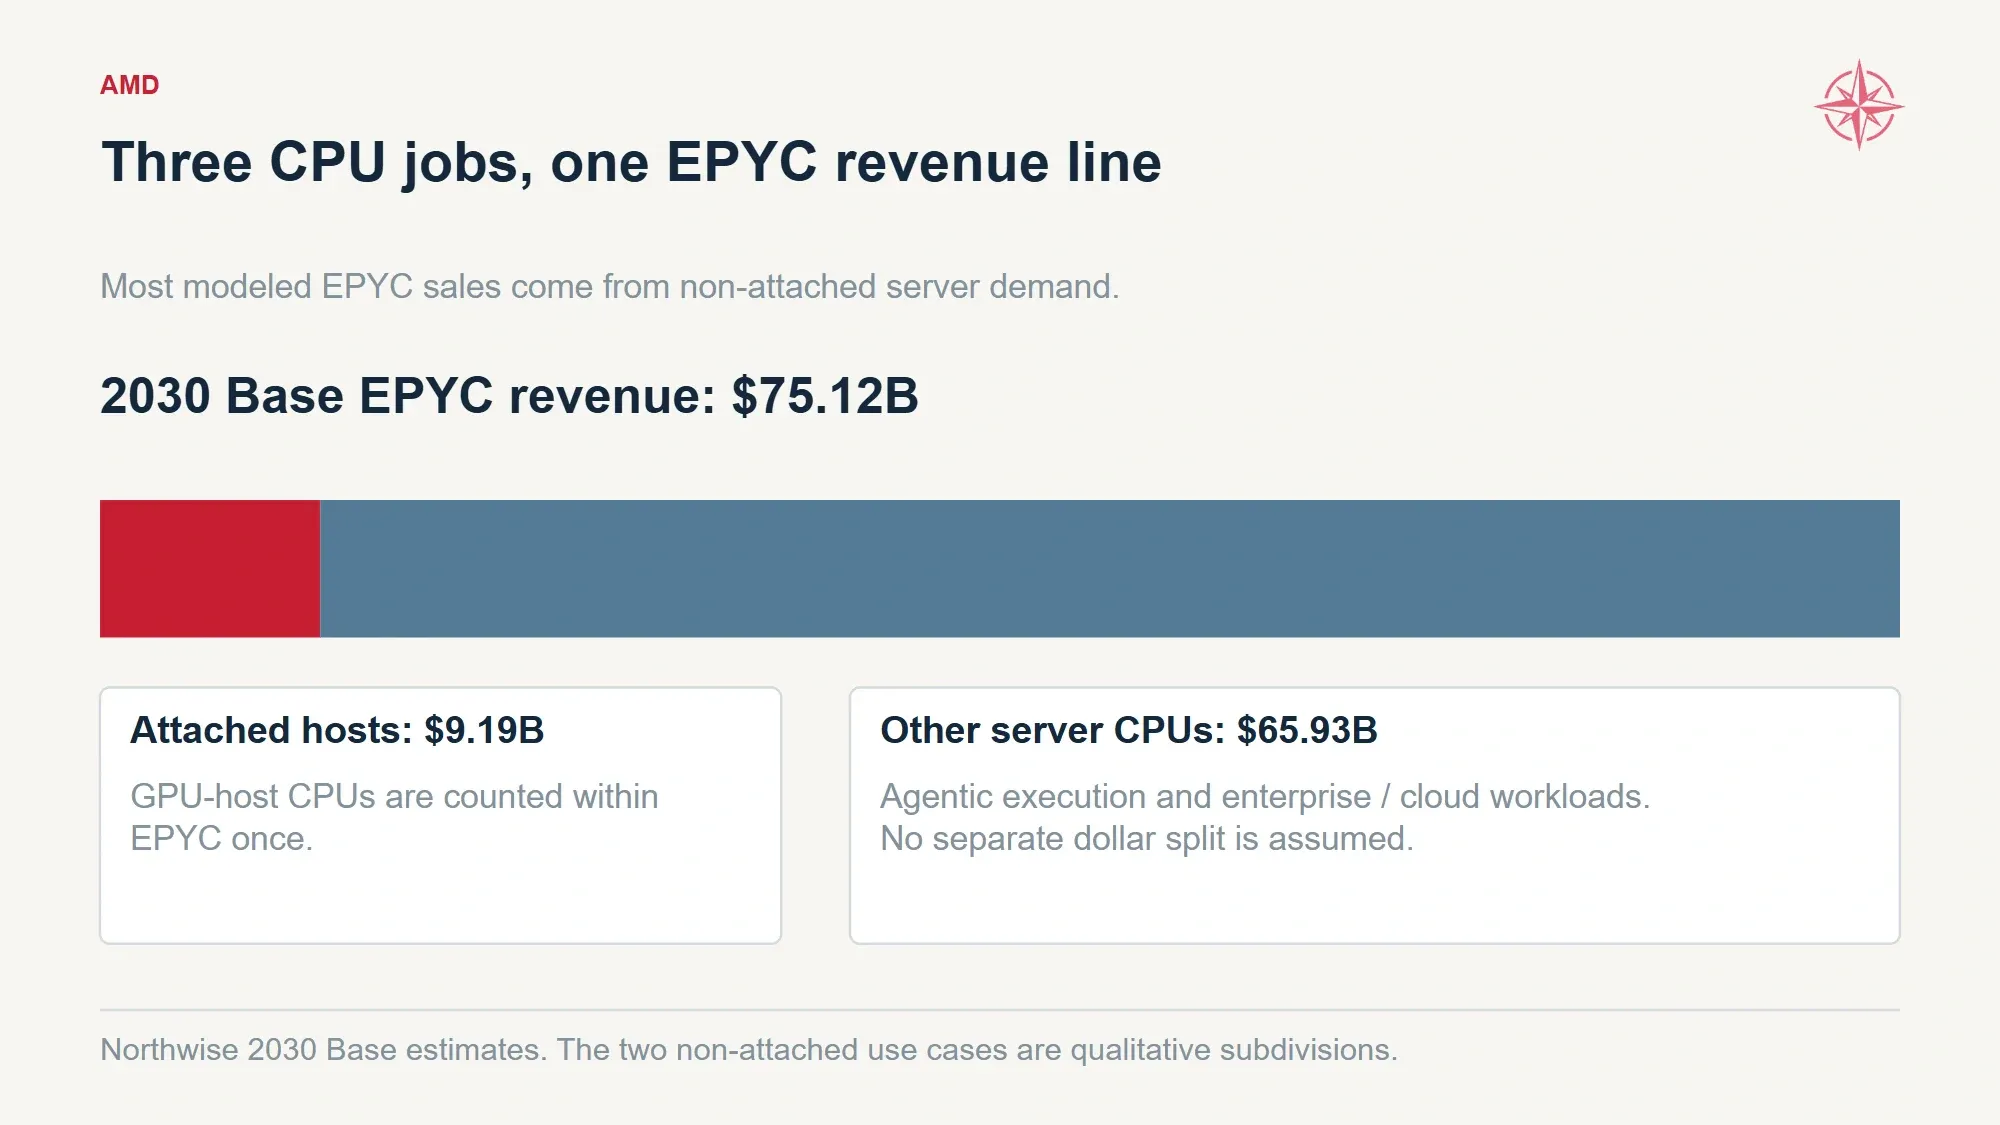
Host CPUs contribute to EPYC, but most modeled 2030 EPYC revenue comes from non-attached server demand.
That is a meaningful source of upside, and a separate obligation on our thesis. AMD has to keep winning broader server purchases. We cannot use success in accelerators as evidence that the entire CPU forecast has already been secured.
Management’s projected $220 billion server CPU market in 2030 provides a useful scale check. Our EPYC estimate represents approximately 34% of that market. Instinct’s $262.25 billion Base revenue represents roughly 19% of management’s projected $1.4 trillion accelerator opportunity. Neither comparison is independent validation because the market sizes are AMD forecasts themselves. Our AMD total addressable market analysis provides the broader market context.
The percentages are informative nonetheless. Our model does not require AMD to monopolize either market. It does require a much larger computing industry and a company capable of defending a substantial position within it.
EPYC also changes the quality of the growth. Management describes the CPU expansion as accretive to gross margin, while the initial Data Center AI ramp carries a margin slightly below the corporate average. More CPU revenue can therefore help support profitability while accelerators become a much larger proportion of sales.
This is one of the reasons we resist treating AMD as a single accelerator market-share calculation. A dollar of CPU sales and a dollar of accelerator sales do not necessarily leave the same gross profit behind.
Networking provides a smaller but increasingly useful contribution. Our Base rises from $1.23 billion in 2026 to $11.13 billion in 2030, including both attached AMD content and other networking revenue. It strengthens AMD’s offering and expands the invoice, while remaining a fraction of the CPU and accelerator businesses.
6. Three Other Businesses, Three Different Cycles
We do not apply an AI growth rate to every business carrying the AMD name.
Client sells processors into personal computers. Its prospects depend on the number of computers purchased, AMD’s share of those purchases and the product mix customers choose. Commercial adoption and premium systems can help, but an AI label does not make a household’s next laptop purchase immune to price.
The second-quarter discussion illustrated both sides. Client revenue grew 23%, and Ryzen PRO sales increased more than 50%. Management nevertheless planned for a softer PC market in the second half as higher memory and component costs weighed on demand.
We model Client revenue increasing from $12.12 billion in 2026 to $22.05 billion in 2030. That is a substantial expansion supported by continued adoption and a more valuable mix. It does not assume every existing PC gets replaced simply because more AI features become available.
Gaming follows a more cyclical path. AMD sells discrete graphics products and semi-custom chips, which are designed around a particular customer’s system, including game consoles. Once a console generation has been on sale for several years, its chip demand can look very different from the initial launch period.
Gaming revenue declined 31% in the second quarter to $779 million, primarily because of lower semi-custom sales at that stage of the console cycle. Management also reported weaker gaming graphics revenue as higher component costs contributed to higher card prices and softer demand.
Our Gaming forecast begins at $2.42 billion in 2026 and recovers to $6.70 billion in 2030. That recovery is an assumption about later demand and product cycles, not a description of current growth.
Embedded has a longer clock. These processors and adaptive devices are designed into equipment used in markets such as industrial systems, communications, aerospace and testing. A customer can choose the component well before its own product enters volume production.
AMD reported 19% Embedded growth in the second quarter and was tracking toward more than $18 billion of new design wins in 2026. The design-win figure is potential business over the associated programs, not revenue that can be dropped into next year’s forecast.
We carry Embedded from $4.15 billion to $10.50 billion through 2030. It remains an attractive contributor with a different product mix and margin profile, but we do not use it as a catch-all for unquantified AI opportunities.
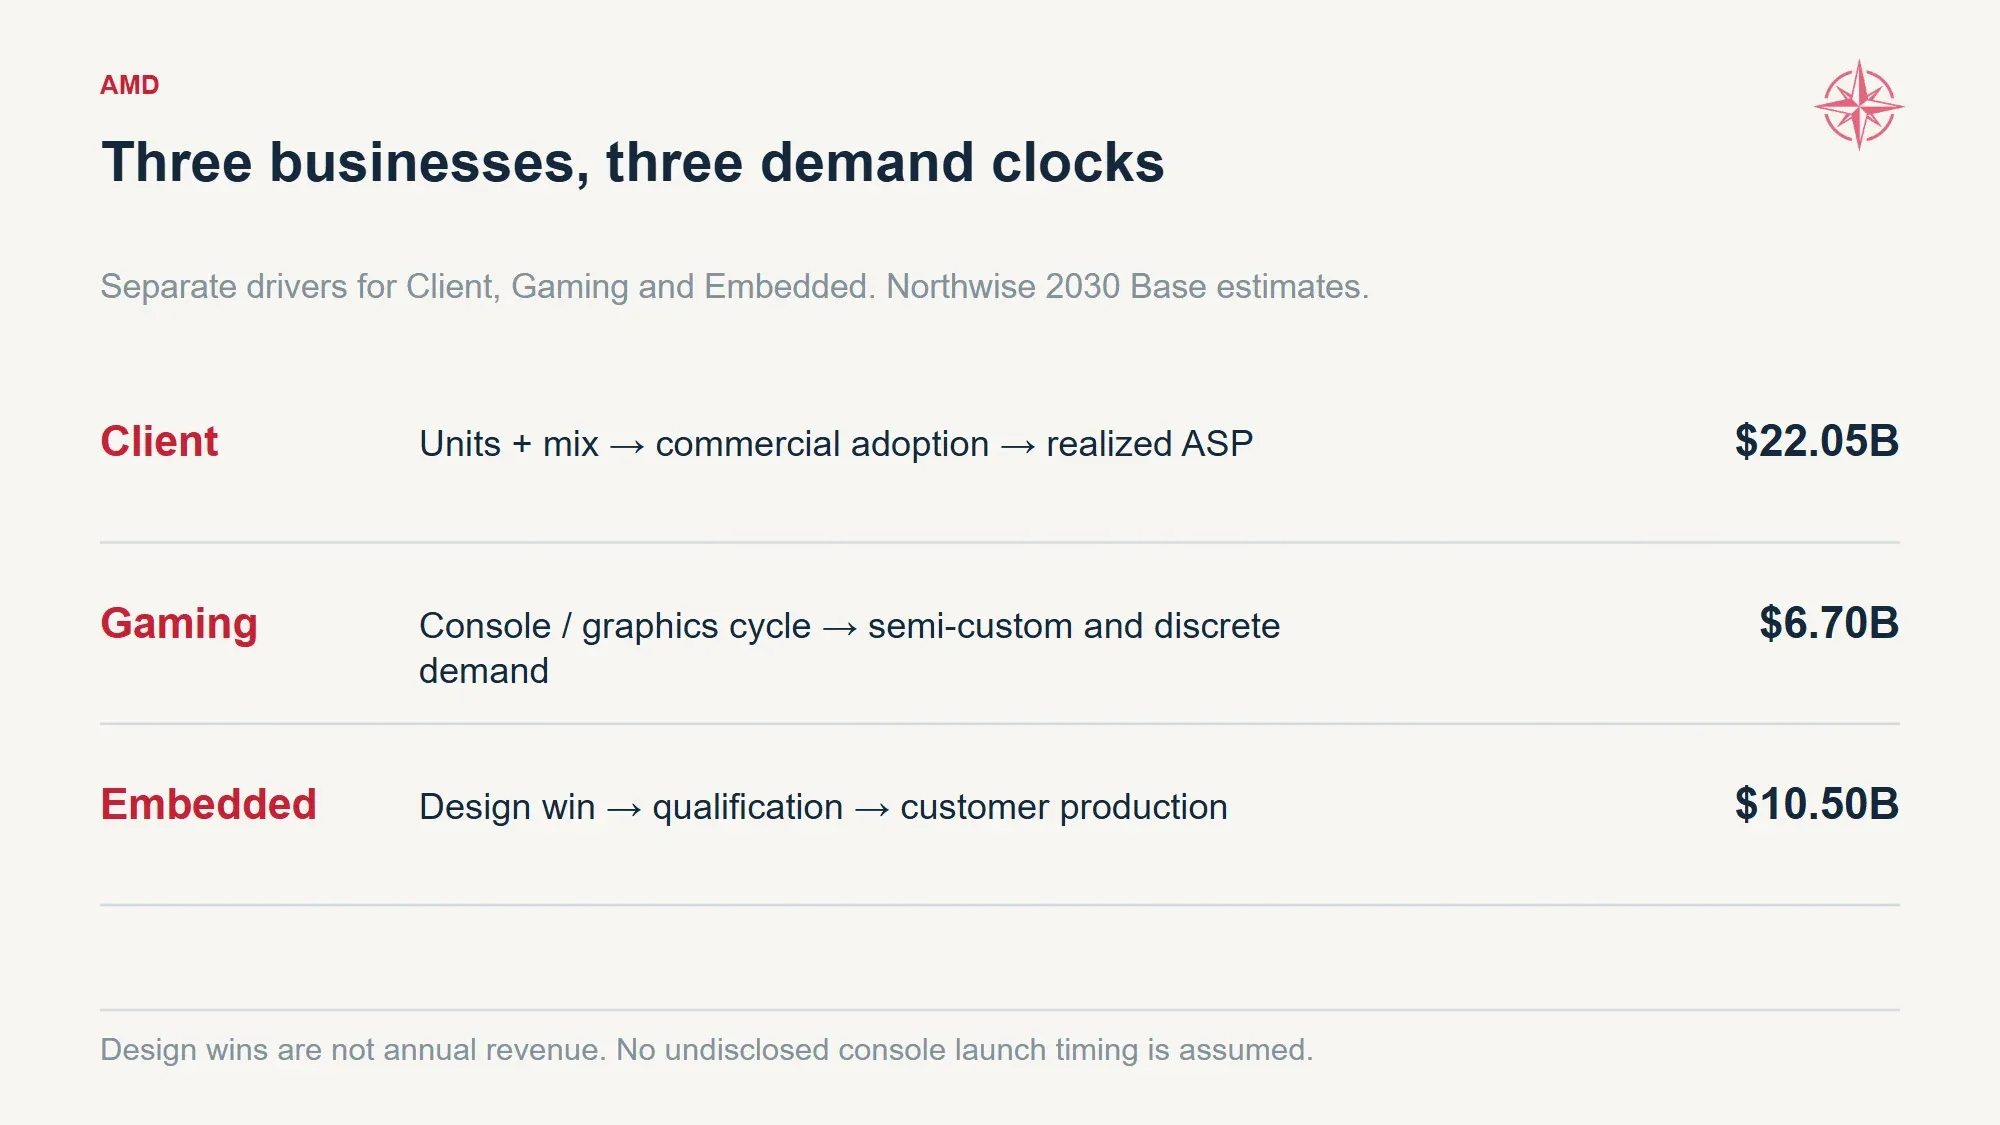
Client, Gaming and Embedded respond to different purchasing and production cycles, even within the same AI investment environment.
Taken together, these three businesses broaden AMD’s earnings base. They are too large to ignore and too small, relative to our future Data Center forecast, to rescue an accelerator thesis that proves fundamentally wrong.
7. A Larger Company Still Has to Pay Its Engineers
The full revenue forecast brings those businesses together:
Base revenue forecast | 2026E | 2027E | 2028E | 2029E | 2030E |
|---|---|---|---|---|---|
Instinct | $12.47 | $49.92 | $112.50 | $179.01 | $262.25 |
EPYC | 17.90 | 31.33 | 46.11 | 60.63 | 75.12 |
Networking | 1.23 | 2.89 | 5.35 | 7.84 | 11.13 |
Client | 12.12 | 13.86 | 16.65 | 19.38 | 22.05 |
Gaming | 2.42 | 2.70 | 4.20 | 5.80 | 6.70 |
Embedded | 4.15 | 5.20 | 6.60 | 8.40 | 10.50 |
Total revenue | $50.29 | $105.90 | $191.41 | $281.07 | $387.75 |
Attached CPU and networking sales appear within their respective business lines. They are not added again on top of a separate all-in deployment total. Instinct also retains an older-product revenue allowance alongside the newer-generation shipment schedule.
The 2026 starting point includes reported first-half revenue of $21.789 billion, the third-quarter guidance midpoint of $13 billion and our $15.5 billion fourth-quarter estimate. The full-year $50.29 billion figure is therefore ours, not company guidance.
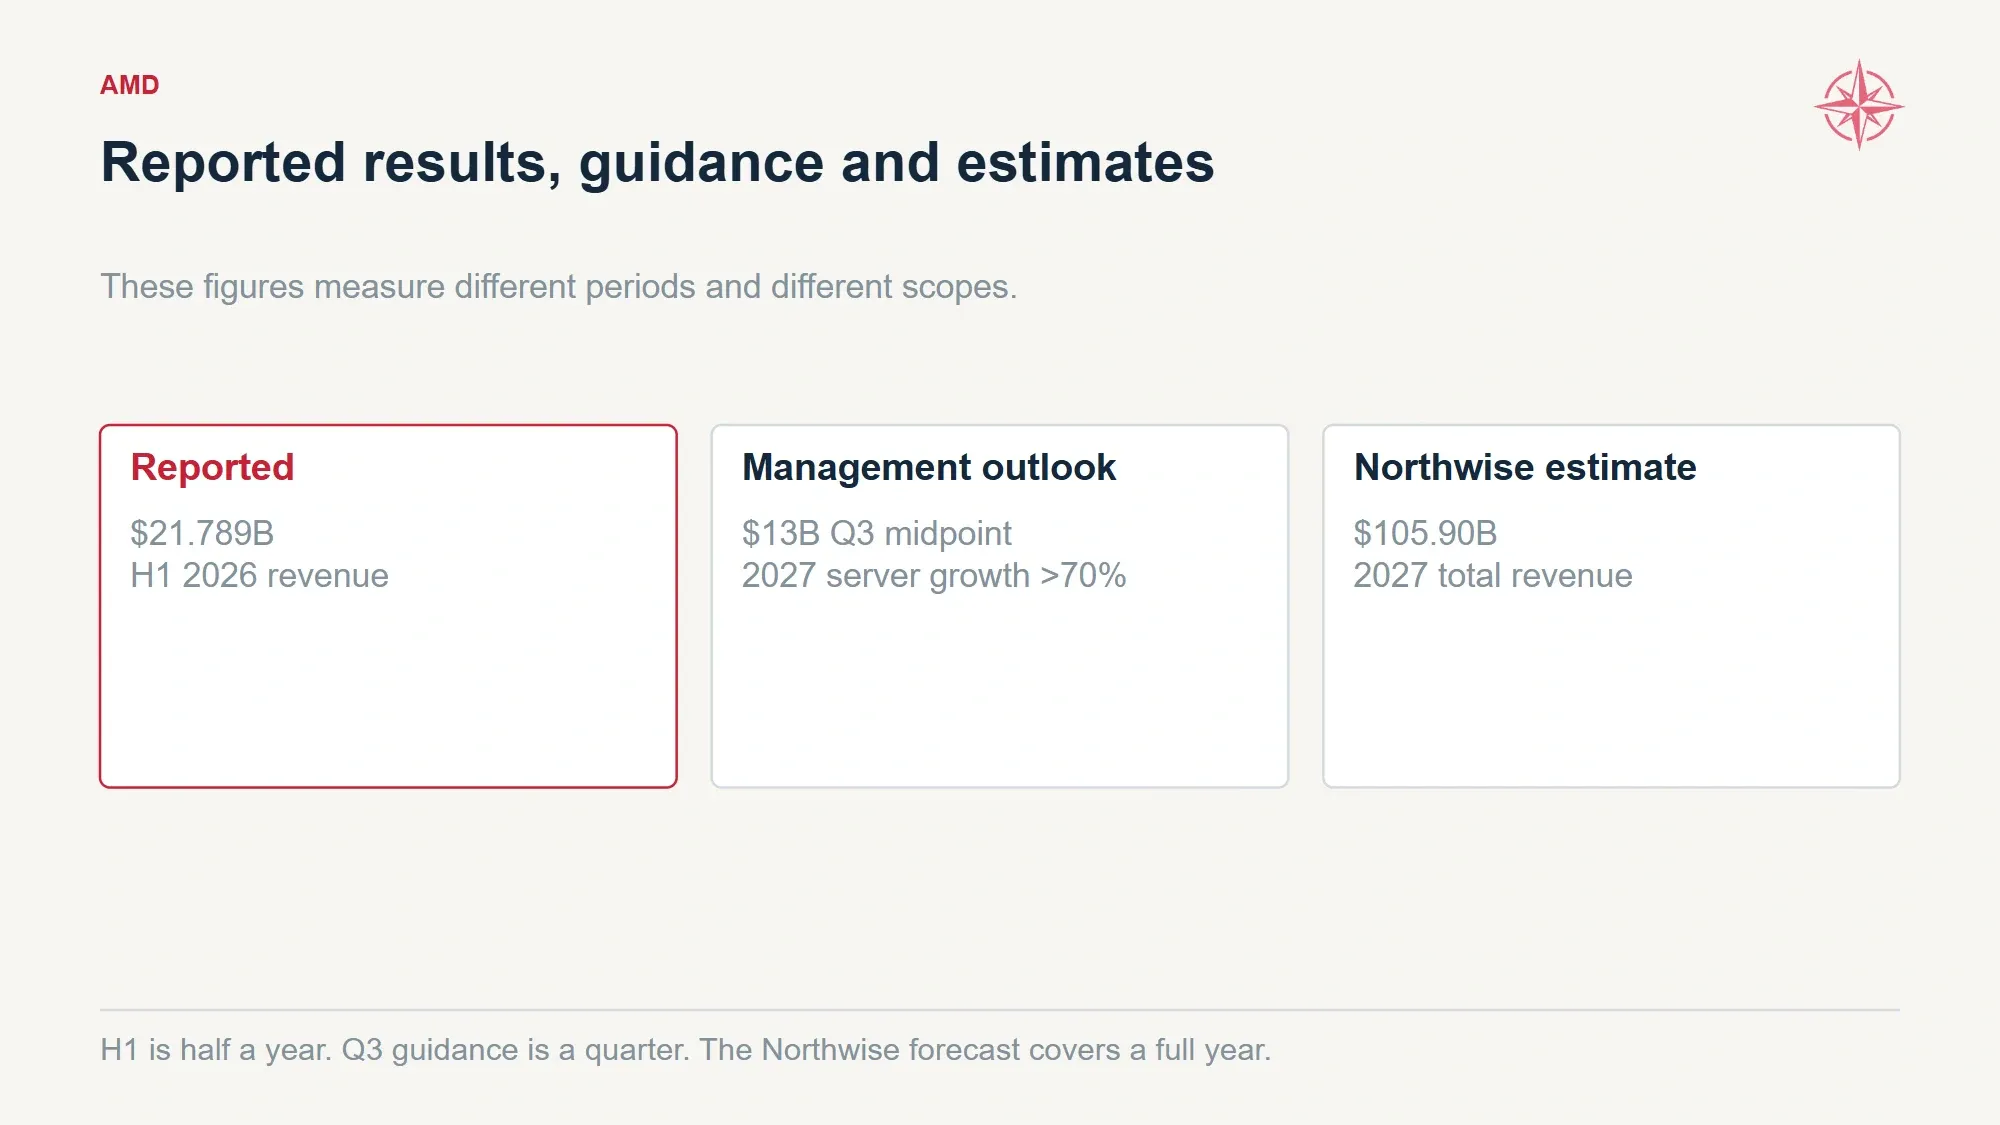
Reported results, management guidance and Northwise forecasts are different evidence classes and refer to different periods.
From that base, reaching $387.75 billion requires approximately 66.6% annualized growth through 2030. The word “Base” should not soften the reader’s impression of how much execution that requires.
The earnings opportunity comes from spreading a growing engineering and support organization across a much larger sales base. This is operating leverage: expenses keep rising, but more slowly than the revenue supporting them.
There is no flat-expense trick here. By 2030, research and development excluding separately presented stock compensation and depreciation reaches $48.54 billion. Selling and general expenses on the same basis reach $19.88 billion. We are budgeting more than $68 billion annually for those two categories alone.
The forecast also avoids borrowing NVIDIA’s gross margin simply because AMD is selling into some of the same customers. Base gross margin stays around 56%, while normalized operating margin grows from approximately 24% to 34%.
Base earnings forecast | 2026E | 2027E | 2028E | 2029E | 2030E |
|---|---|---|---|---|---|
Gross profit before separately presented charges | $28.29 | $59.02 | $107.23 | $158.33 | $218.55 |
R&D, excluding SBC and depreciation | 9.25 | 16.13 | 26.08 | 36.45 | 48.54 |
Selling/general expenses, same basis | 4.03 | 6.76 | 10.79 | 14.98 | 19.88 |
Owned-asset depreciation | 0.85 | 1.81 | 3.61 | 6.24 | 9.52 |
Employee stock compensation | 2.20 | 3.42 | 5.20 | 7.08 | 9.30 |
Normalized operating income | $11.95 | $30.90 | $61.55 | $93.58 | $131.33 |
Net interest income | 0.23 | 0.19 | 0.42 | 1.09 | 2.35 |
Normalized income-tax expense | 1.53 | 4.35 | 9.29 | 15.15 | 22.72 |
Normalized net income | $10.65 | $26.74 | $52.67 | $79.53 | $110.95 |
Normalized diluted EPS | $6.43 | $16.13 | $31.11 | $45.16 | $60.63 |
Adjusted diluted EPS | $7.58 | $17.90 | $33.72 | $48.54 | $64.85 |
All figures are Northwise estimates. The expense presentation separates employee stock compensation and owned-asset depreciation so their cost remains visible rather than buried across several lines.
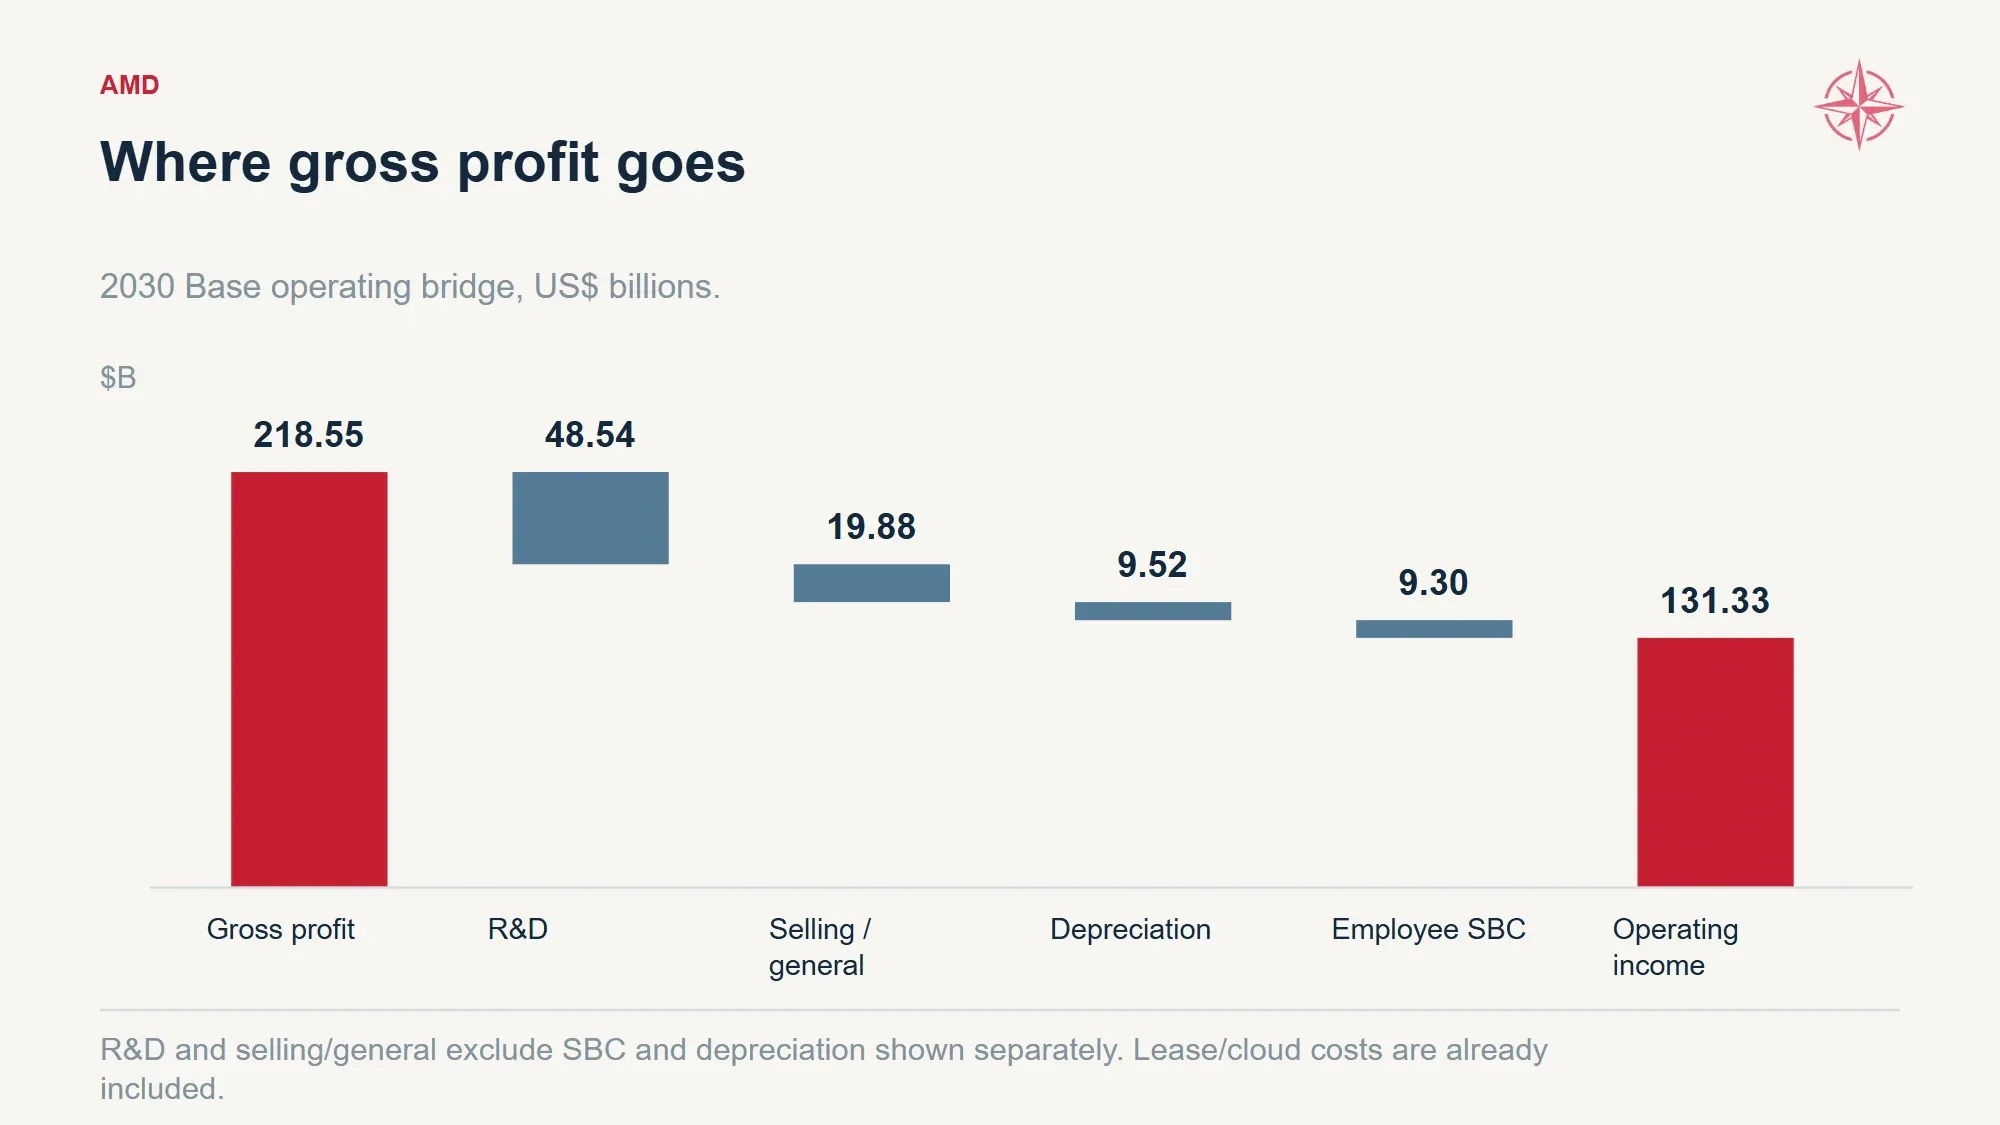
Base 2030 operating leverage still includes substantial engineering, operating and equity-compensation costs.
“Normalized” also deserves an explanation. We include employee stock compensation because employees are being paid with something shareholders own. We exclude acquired-intangible amortization, specified nonrecurring items and future customer-warrant accounting marks that cannot be reliably forecast from the disclosed terms. Adjusted EPS goes one step further and excludes employee stock compensation.
That produces $60.63 of normalized EPS and $64.85 of adjusted EPS in the 2030 Base. Neither is being passed off as a precise prediction of future reported GAAP earnings.
Customer warrants are still charged to the economic forecast through ownership dilution. The inability to forecast every future accounting mark does not make the customer’s shares free.
Our margin view is optimistic, but the mechanism is recognizable. AMD earns roughly the same gross-profit percentage on a much larger revenue base, invests heavily to support it, and retains a growing share after operating expenses. The question to monitor is whether engineering and customer-support requirements scale as efficiently as we assume.
A hardware platform that constantly needs bespoke fixes could sell well and still disappoint on that measure.
8. Growth Arrives Before the Cash Does
The first place we would look for a less attractive version of the AMD story is the gap between earnings and cash.
An order can require AMD to commit to manufacturing long before collection. Components become work in progress, then finished inventory. Delivery can create a receivable rather than immediate cash. Meanwhile, suppliers expect to be paid and the next product generation still needs funding.
This is why even a company that relies on outside manufacturers can consume considerable capital as it grows.
At June 27, AMD carried $7.281 billion of receivables, $8.468 billion of inventory and $2.662 billion of prepaid expenses and other current assets. The starting business already ties up meaningful cash between procurement and collection.
Our Base assumes receivable days improve from 65 to 60 through 2030 and inventory days decline from 150 to 115. Payable days remain at 85. Receivable days measure how much revenue is still awaiting payment; inventory and payable days use the relevant cost base. They are timing assumptions, not interchangeable percentages of sales.
Even with those improvements, the balances become very large:
Selected Base balance-sheet forecasts | 2026E | 2027E | 2028E | 2029E | 2030E |
|---|---|---|---|---|---|
Receivables | $8.96 | $18.86 | $33.56 | $47.74 | $63.74 |
Inventory | 9.04 | 18.62 | 31.13 | 42.03 | 53.31 |
Prepayments and modeled current operating assets | 3.02 | 6.88 | 12.44 | 16.86 | 21.33 |
Net property and equipment | 5.16 | 9.70 | 17.20 | 26.12 | 37.09 |
Accounts payable | 5.12 | 10.92 | 19.60 | 28.58 | 39.40 |
Operating accruals | 5.14 | 8.56 | 13.82 | 19.30 | 25.60 |
Cash and short-term investments | 16.29 | 18.49 | 30.36 | 61.38 | 110.60 |
The full balance-sheet forecast includes acquired assets, leases, financial investments, taxes and other obligations. It excludes future customer-warrant accounting entries that cannot yet be estimated reliably.
Supplier credit and operating accruals help finance the expansion. They do not finance it without limit. Customer obligations, marketing accruals and employee compensation balances have different drivers, so we do not assume all of them grow automatically with accelerator revenue.
Owned investment is another cash use. Our Base spends approximately $53.42 billion on capital expenditure during 2026–2030, reaching $19.58 billion annually in the final year. Equipment is depreciated over its estimated useful life, but the cash can leave much earlier.
The forecast’s five-year life for new owned equipment is an assumption about AMD’s assets. It is not a statement that every GPU sold to a customer becomes obsolete on its fifth birthday.
Base cash flow | 2026E | 2027E | 2028E | 2029E | 2030E |
|---|---|---|---|---|---|
Operating cash flow | $10.90 | $18.28 | $43.34 | $78.51 | $116.00 |
Cash capital expenditure | (3.20) | (5.88) | (10.32) | (14.44) | (19.58) |
Free cash flow | $7.70 | $12.40 | $33.02 | $64.06 | $96.42 |
The 2027 comparison is the one to keep in mind. Normalized net income reaches $26.74 billion, while free cash flow is only $12.40 billion. Much of the apparent earnings acceleration has to support the expansion before it can accumulate as cash.
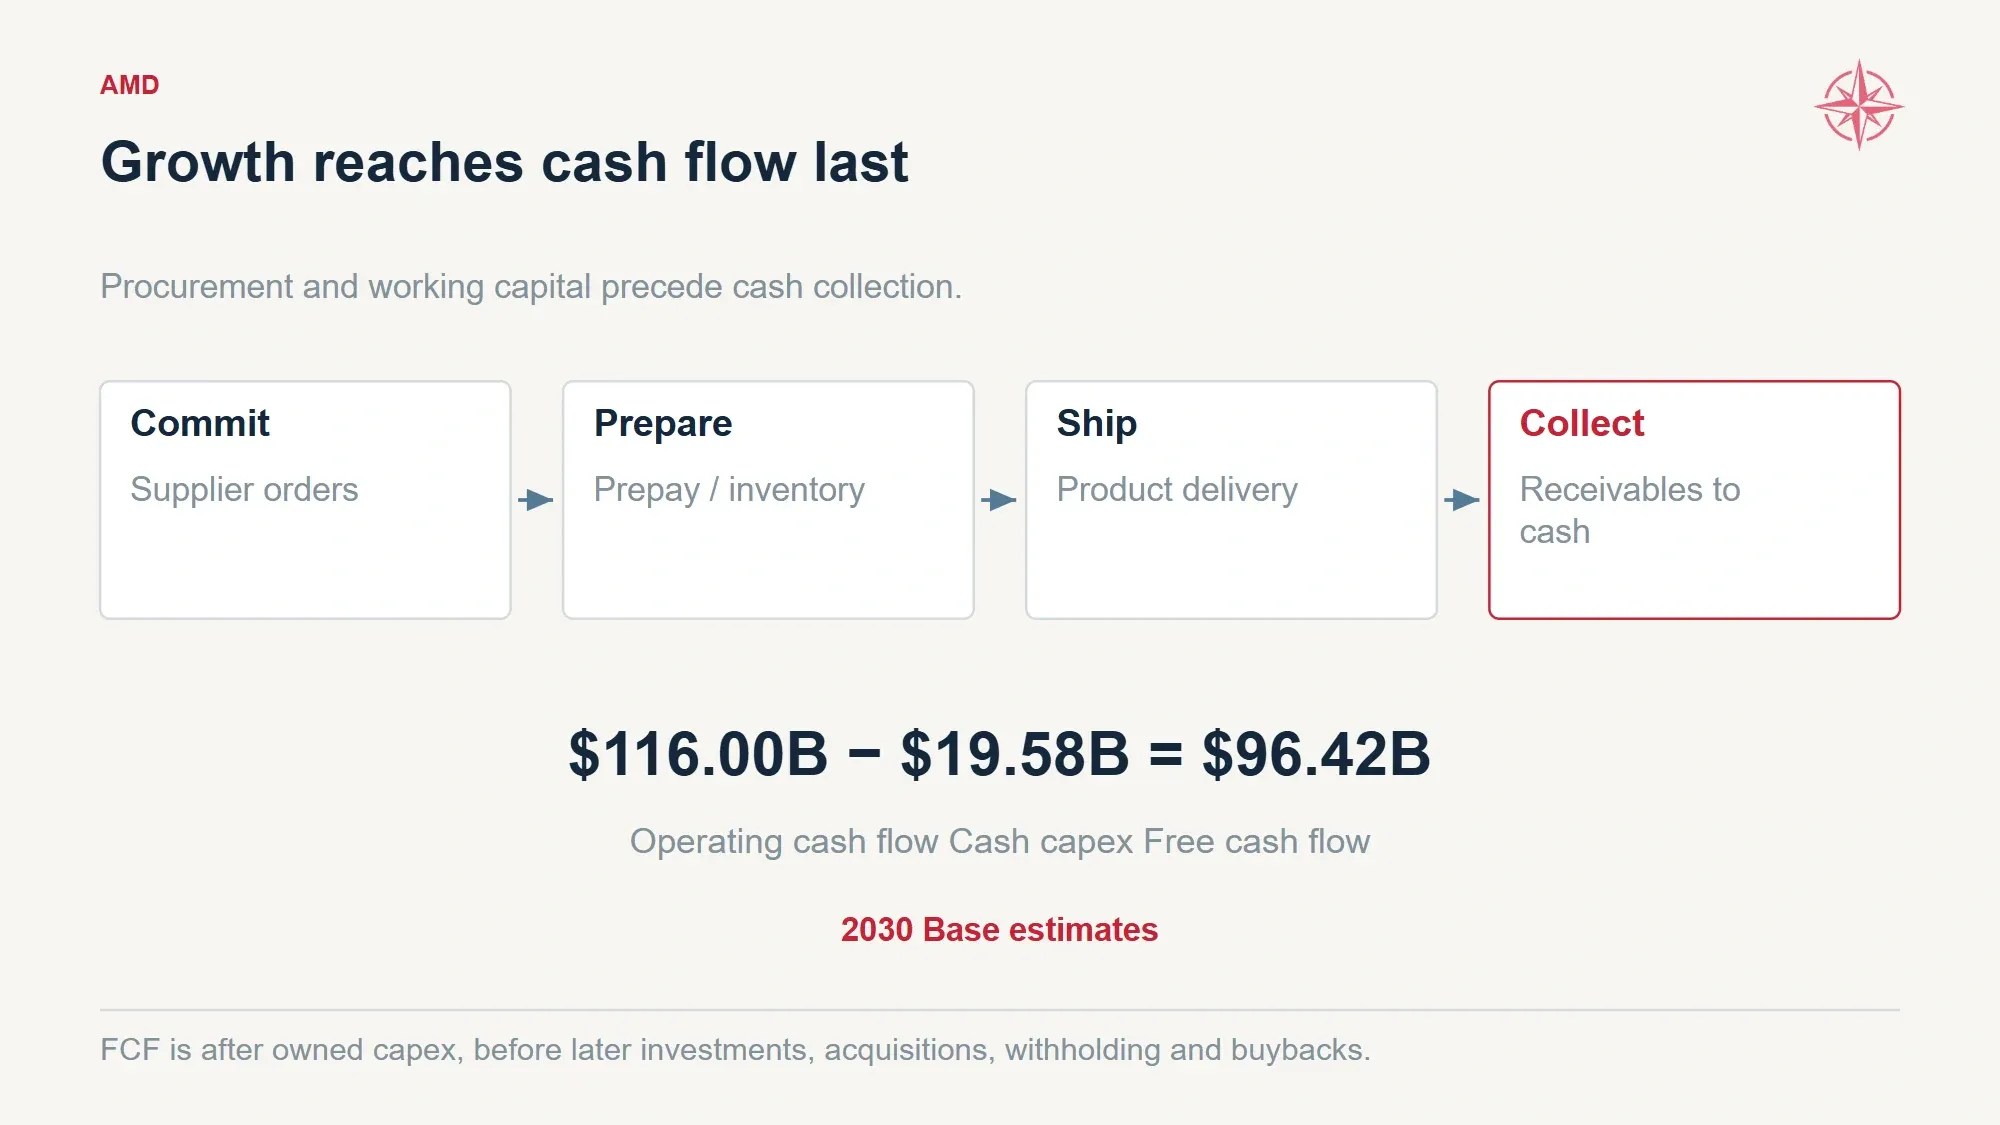
Operating working capital and capital expenditure absorb cash before acquisitions, financial investments and shareholder financing flows.
We would not regard that gap as a problem by itself. A company growing at this pace should need working capital and equipment. The warning would be a gap that persists because customers pay more slowly, inventory becomes harder to sell or spending delivers less growth than expected.
Across the five years, the Base generates approximately $213.60 billion of free cash flow. That figure is after owned capital expenditure but before acquisitions, financial investments and financing flows.
Below it sit approximately $11.84 billion of financial-investment funding, $6.13 billion of acquisitions, $17.17 billion of employee share-withholding payments and $81.50 billion of repurchases. Employee purchases and exercises bring approximately $2.55 billion back into the company. Ending cash reflects these uses as well as debt proceeds and repayments.
The $110.60 billion Base cash balance in 2030 is what remains after that capital plan. It is not five years of earnings added to today’s bank account.
9. The Balance Sheet Has Joined the Sales Effort
A chip supplier can have customers ready to buy and still find that the surrounding infrastructure cannot be financed or completed quickly enough.
AMD is increasingly helping solve that problem. Its commitments now extend into cloud capacity, data-center arrangements, customer investments and partner guarantees. That can accelerate hardware sales, but it also means shareholders have to examine more than the gross margin on a processor.
At June 27, AMD disclosed $30.276 billion of unconditional commitments, including purchases of wafers, substrates and components, cloud capacity, software and technology arrangements. Of that amount, $17.386 billion fell in the remainder of 2026. It also disclosed $4.5 billion of leases not yet commenced, followed by another $9.5 billion entered after quarter-end with expected starts in 2027 and 2028. (AMD Q2 filing)
Adding those figures together and calling the result debt would be misleading. Procurement commitments can become inventory and cost of sales. Lease payments are spread across years. Some cloud capacity supports AMD’s own operations or can be assigned to others.
Ignoring them would be just as misleading.
They commit future cash and reduce the freedom to redirect capital when conditions change. The model carries lease and cloud-compute spending inside the operating budget, which grows from $1.0 billion in 2026 to $3.7 billion in 2030. Rent is included once, rather than being added as another expense after the operating forecast has already paid for it.
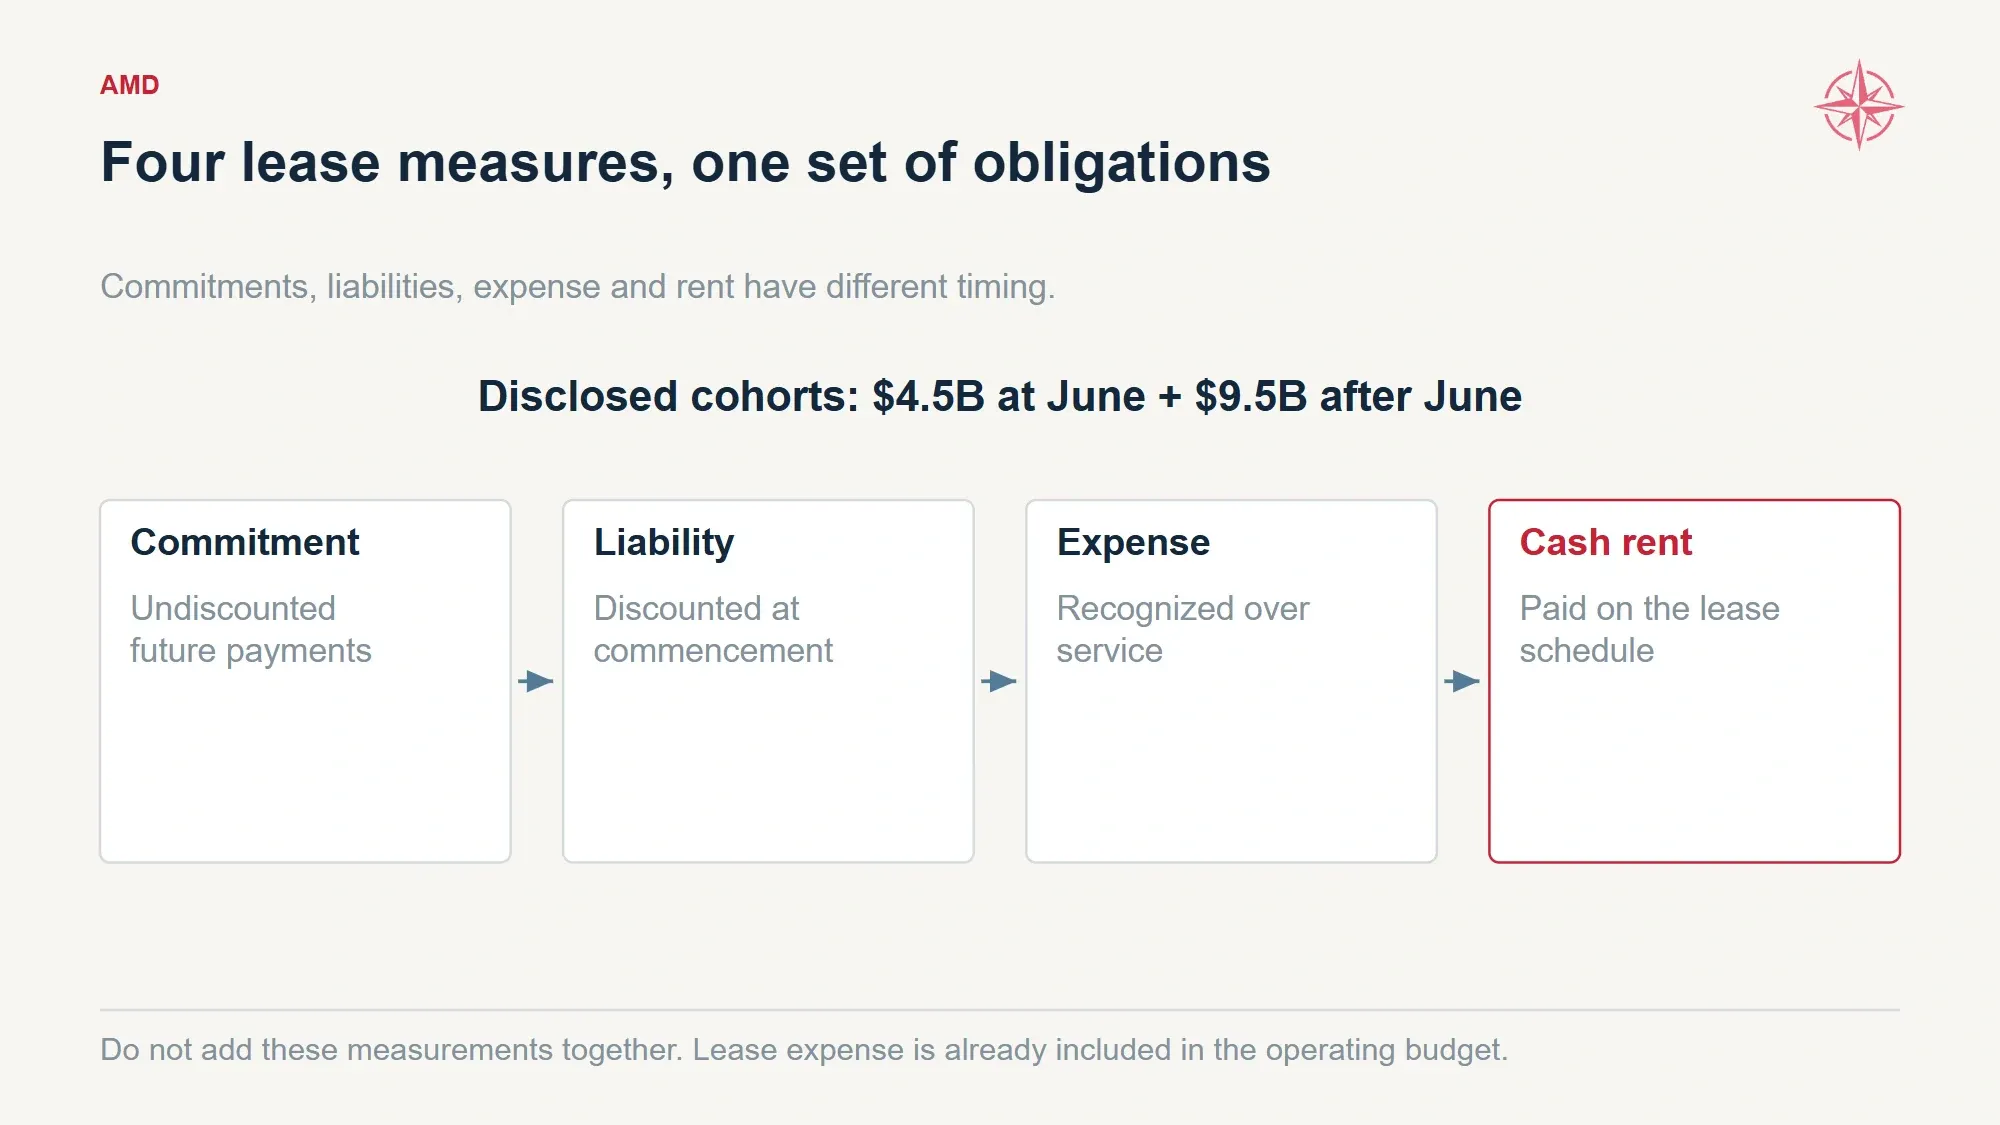
Lease commitments, balance-sheet liabilities, expense and cash rent are different measurements and timing views of related contracts.
Partner guarantees deserve particular attention. AMD reported up to $4.1 billion of gross exposure under guarantees associated with commercial partners’ data-center leases. The guarantees generally become payable after a partner default and decline as contractual lease payments are made.
That is not a $4.1 billion annual expense. It is a contingent claim that can become painful at exactly the time the associated commercial relationship is weakening.
The Anthropic agreement combines a hardware opportunity with an AMD equity investment of up to $5 billion. We include the investment as a cash use and financial asset. We do not count the same funding twice or treat the investment itself as revenue. (Advanced Micro Devices, Inc.)
Our view of this strategy is pragmatic. Helping a valuable customer expand can be an excellent use of capital. The test is whether the combination of hardware profit, investment value and strategic benefit adequately compensates AMD for the risk. A customer’s enthusiasm becomes less informative when part of the capital enabling its purchase comes from the supplier.
We do not assume that makes the transaction bad. We require the financing to remain visible.
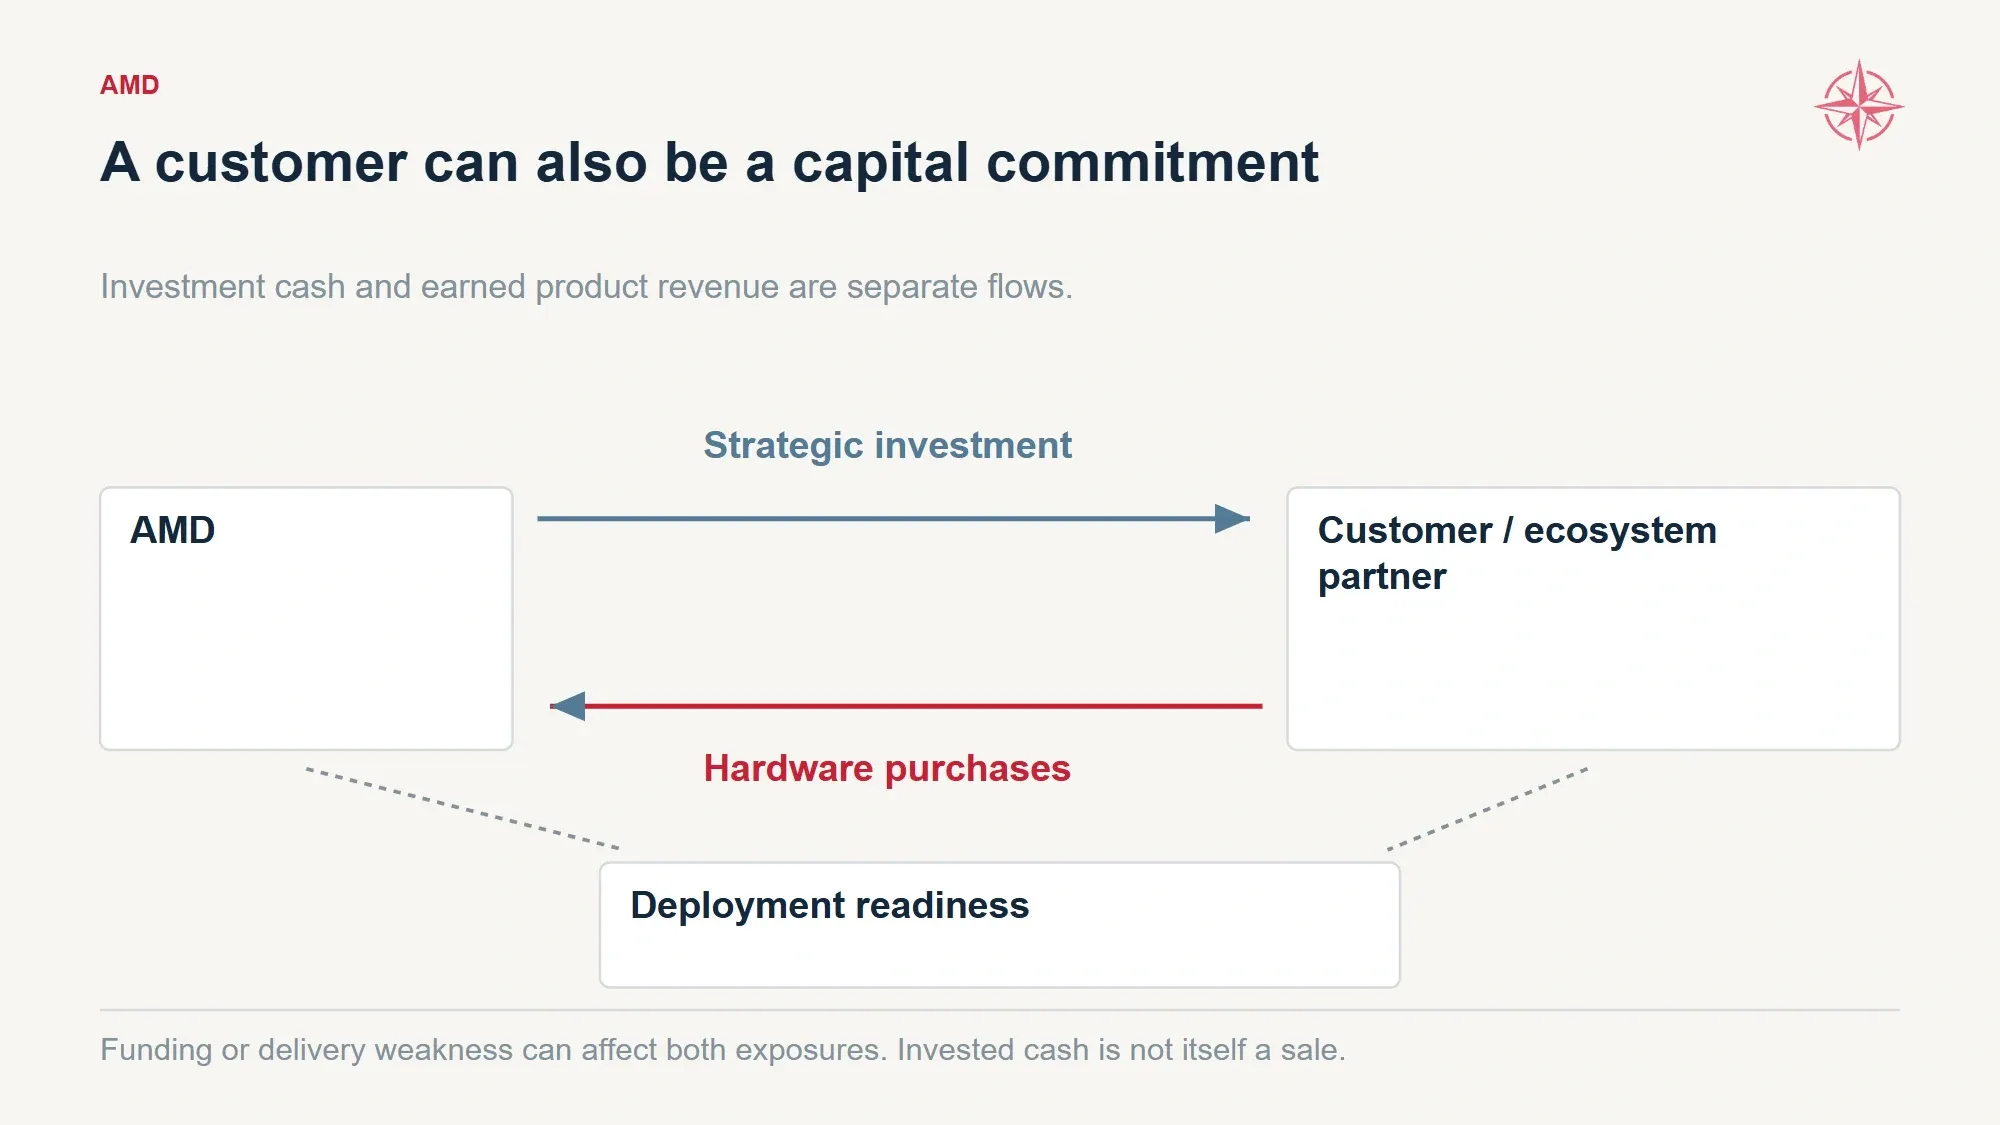
Strategic financing and product sales have different accounting and risk channels, even when they involve related ecosystem participants.
Acquisitions receive similar treatment. AMD’s Taalas announcement describes an agreement to acquire specialized inference technology, subject to closing conditions, without disclosing purchase consideration. Our forecast includes future acquisition budgets, but those budgets are not a purported valuation of Taalas or evidence that the transaction has already closed. (Advanced Micro Devices, Inc.)
Debt supplies part of the broader funding plan. AMD issued $4.75 billion of notes in August:
Principal | Coupon | Maturity |
|---|---|---|
$1.25B | 4.600% | 2029 |
$1.50B | 5.000% | 2031 |
$1.00B | 5.250% | 2033 |
$1.00B | 5.500% | 2036 |
The four tranches carry $240 million of annual coupons while all remain outstanding. The forecast includes the proceeds, interest and maturities. Borrowing provides liquidity; it does not create immediate shareholder value merely by increasing the cash balance. (Advanced Micro Devices, Inc.)
Our Base ends 2026 with $7.125 billion of principal debt and reaches $4.50 billion in 2030 after scheduled repayments. None of the baseline outcomes requires additional revolving-facility borrowing through 2030. In adverse tests, available borrowing is limited rather than assumed to appear whenever the cash schedule runs short.
That is how we would judge the strategy as shareholders: useful capital support, provided the company remains capable of saying no when the economics stop making sense.
10. What Existing Shareholders Actually Own
A customer can help AMD become more successful and receive a meaningful portion of that success.
The OpenAI and Meta warrants make the trade explicit. Each arrangement can provide the customer with up to 160 million AMD shares at an exercise price of one cent. A warrant is a right to purchase shares if its conditions are satisfied. At that exercise price, nearly all the value comes from the shares received, not from new capital paid into AMD.
The combined maximum is 320 million shares. That is substantial enough that any long-term EPS forecast which ignores it is answering the wrong ownership question.
The warrants are not unconditional, however. They depend on purchase milestones, stock-price requirements and additional technical and commercial terms. No shares had vested or become exercisable at June 27. OpenAI’s warrant expires on October 5, 2030, while Meta’s runs through February 23, 2031. (OpenAI agreement; Meta agreement; Q2 filing)
Those conditions create a link between operating success and dilution. More qualifying purchases can produce more revenue and more customer shares. Delayed purchases can postpone both.
Our forecast uses the same delivery schedule for revenue and customer ownership claims. It reaches approximately 80 million cumulative customer claims in 2028, 159 million in 2029 and 252 million at year-end 2030. Purchases within Meta’s remaining early-2031 window take total modeled claims to approximately 262 million. The associated sales already sit within the following year’s revenue forecast.
Some intermediate contractual mechanics are not public. We therefore estimate the economic claims from purchases and disclosed conditions, with the full 320 million retained as a separate stress. This is more informative than either assuming zero dilution or issuing every possible share on day one.
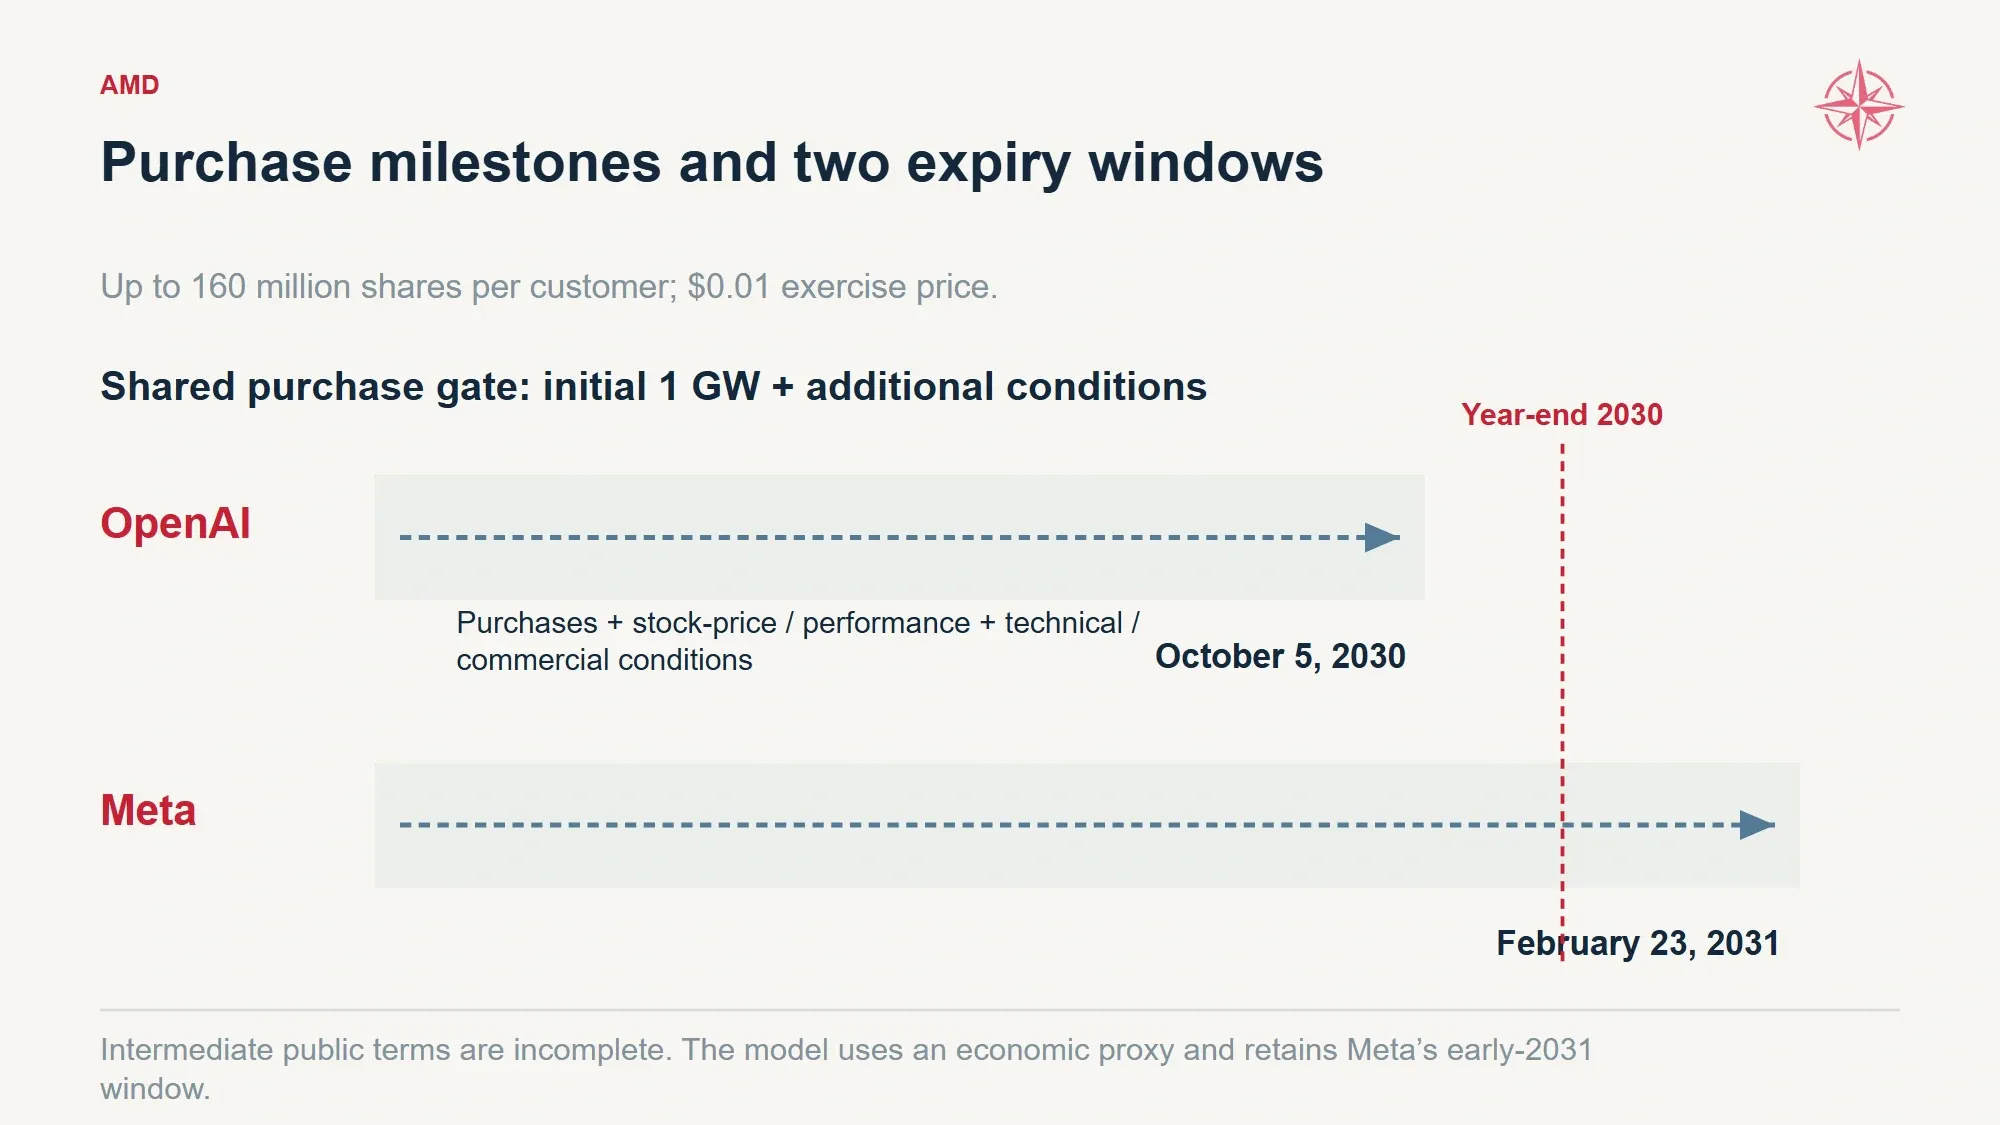
Customer dilution depends on purchases and additional conditions. The model reserves the remaining early-2031 Meta window rather than ignoring it.
Employee awards add another ownership cost. Our normalized earnings include the compensation expense, while the share schedule follows estimated grants, vesting and settlement. Those occur on different timelines, which is why a year’s stock-compensation expense cannot simply be divided by a year-end share price to reconstruct every share issued.
Cash withholding also needs to be understood. When awards settle, the company can withhold some shares and remit cash for employee taxes. That reduces the shares delivered but consumes company cash. A forecast that credits the lower share count while forgetting the cash payment overstates what shareholders retain.
Repurchases partly offset these effects:
Base ownership and repurchase schedule | 2026E | 2027E | 2028E | 2029E | 2030E |
|---|---|---|---|---|---|
Average economic diluted shares, billions | 1.657 | 1.658 | 1.693 | 1.761 | 1.831 |
Ending economic diluted shares, billions | 1.658 | 1.657 | 1.729 | 1.794 | 1.868 |
Cumulative customer claims, millions | 0 | 0 | 80 | 159 | 252 |
Annual repurchases, $B | $1.00 | $3.10 | $13.21 | $25.63 | $38.57 |
The Base assumes repurchases use 25% of free cash flow in 2027 and 40% thereafter, subject to liquidity. That requires future authorization beyond the $9.2 billion remaining at June 27. It is our capital-allocation assumption, not an already-announced five-year commitment. (AMD Q2 filing)
After approximately $81.50 billion of repurchases, diluted shares still increase over the forecast.
We think the business can create enough value to justify that ownership cost. But this is one of the clearest places where “AMD wins” and “existing shareholders receive all the winnings” become different statements.
Annual earnings use average diluted shares. Year-end ownership uses ending shares. Valuation also reserves customer claims expected after the particular year-end being valued. Keeping those measures separate prevents both understated dilution and counting the same customer shares twice.
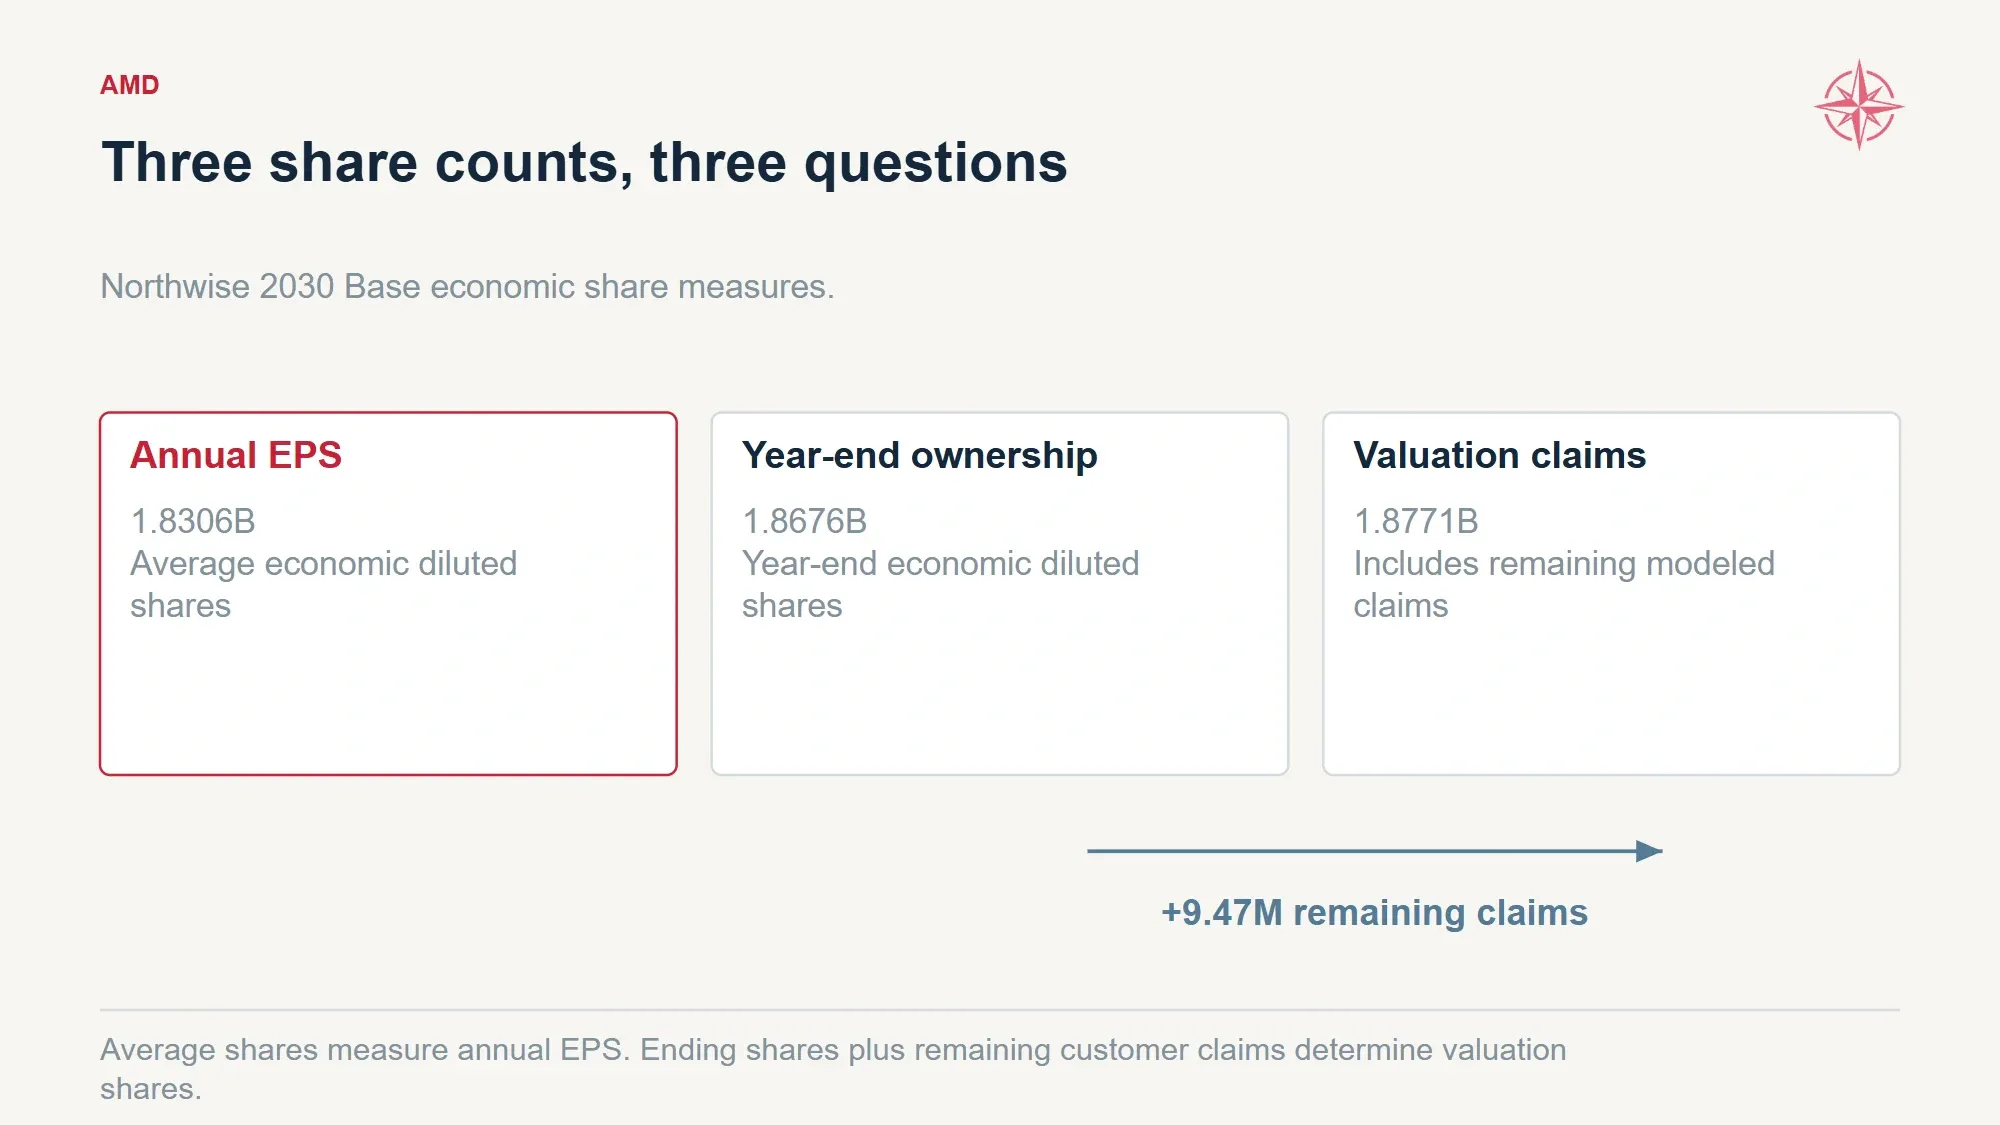
The Base case uses different share measures for annual earnings, year-end ownership and claims still reserved after 2030.
11. How We Arrive at Bear, Base and Bull
A single forecast invites readers to argue about the endpoint. We find it more useful to identify the conditions that produce it.
For AMD, the major questions are whether demand and customer funding remain strong, whether the company executes the required ramp, whether it realizes the stronger pricing path, and whether EPYC sustains the larger expansion.
Those four questions create sixteen combinations. We calculate a complete financial result for each before grouping them into Bear, Base and Bull.
Underwriting condition | Assigned probability |
|---|---|
Sustained demand and customer funding | 80% |
Successful execution when demand holds | 85% |
Successful execution under weaker demand | 70% |
Stronger pricing when execution succeeds | 60% |
Stronger pricing under constrained execution | 30% |
Stronger CPU expansion when demand holds | 70% |
Stronger CPU expansion under weaker demand | 40% |
These are our judgments informed by the evidence, not probabilities AMD publishes or frequencies observed across a large sample of comparable transformations. The purpose of writing them down is to make our conviction open to challenge. A formula can organize judgment; it cannot turn judgment into a disclosed fact.
The Bear includes outcomes where sustained demand or execution falls short. The Base includes successful demand and execution without both the strongest pricing and CPU outcomes. The Bull combines all four favorable conditions.
That produces weights of 32.00% Bear, 39.44% Base and 28.56% Bull.
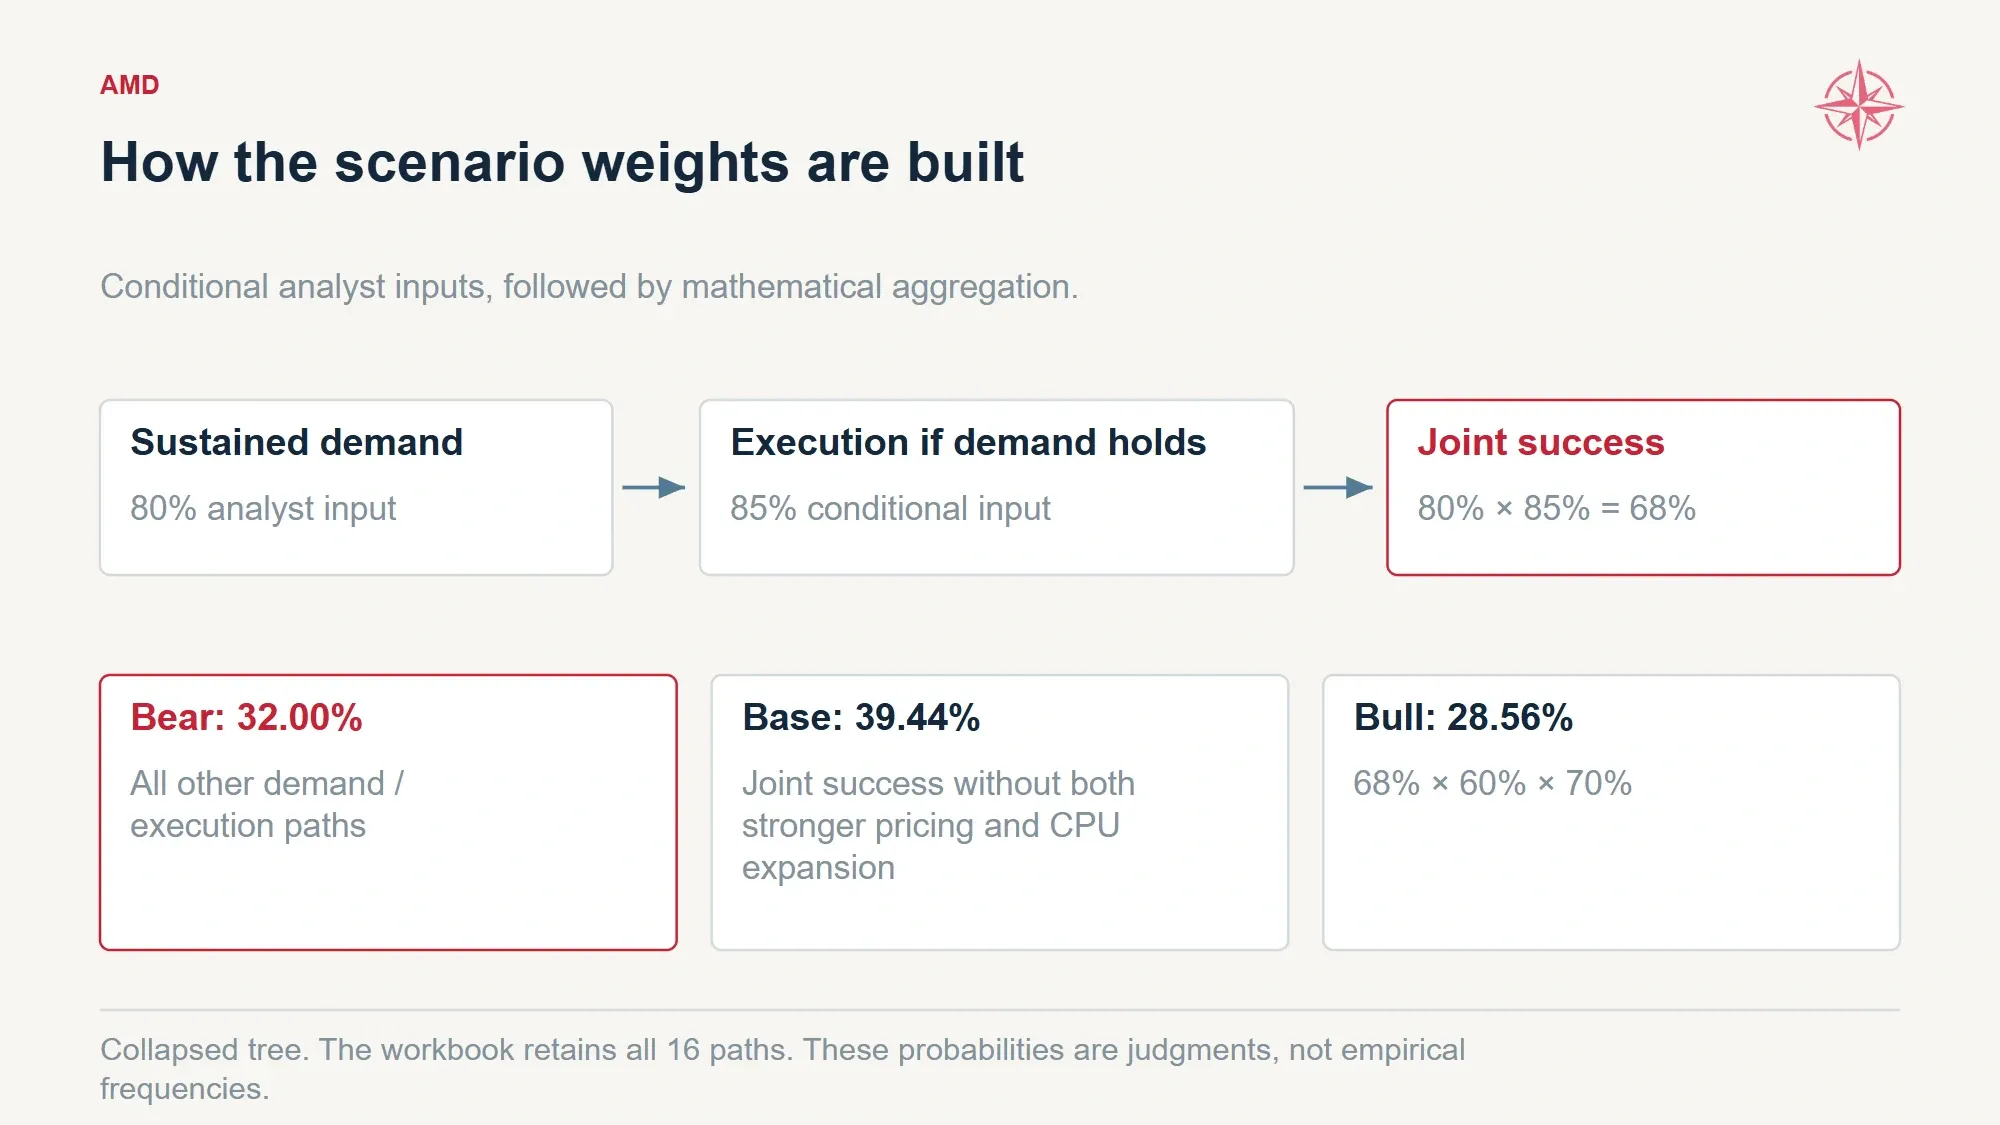
The scenario weights are calculated from conditional analyst judgments. The full sixteen-path ledger remains available for inspection.
The Base is therefore not simply the arithmetic midpoint of two dramatic alternatives. It already assumes strong demand and successful execution. The difference from the Bull comes largely from the economics AMD realizes and the strength of the CPU expansion.
Scenario and operating measure | 2026E | 2027E | 2028E | 2029E | 2030E |
|---|---|---|---|---|---|
Bear revenue, $B | $50.29 | $93.10 | $136.81 | $164.08 | $190.55 |
Bear normalized EPS | $6.43 | $12.64 | $19.28 | $22.31 | $24.99 |
Bear free cash flow, $B | $7.70 | $6.59 | $22.50 | $36.65 | $44.30 |
Base revenue, $B | $50.29 | $105.90 | $191.41 | $281.07 | $387.75 |
Base normalized EPS | $6.43 | $16.13 | $31.11 | $45.16 | $60.63 |
Base free cash flow, $B | $7.70 | $12.40 | $33.02 | $64.06 | $96.42 |
Bull revenue, $B | $50.29 | $112.77 | $215.32 | $329.65 | $468.97 |
Bull normalized EPS | $6.43 | $18.23 | $38.02 | $59.35 | $84.47 |
Bull free cash flow, $B | $7.70 | $14.07 | $40.27 | $83.31 | $132.81 |
Scenario figures are averages of their underlying outcomes. Consequently, average EPS can differ slightly from average income divided by average shares. Each complete outcome is calculated before aggregation.
The resulting 2030 financial positions are:
2030 operating outcome | Bear | Base | Bull |
|---|---|---|---|
Normalized operating income | $50.90B | $131.33B | $181.84B |
Normalized net income | $43.24B | $110.95B | $153.54B |
Operating cash flow | $53.41B | $116.00B | $156.70B |
Cash capital expenditure | $9.11B | $19.58B | $23.89B |
Ending cash and short-term investments | $57.50B | $110.60B | $148.14B |
Principal debt | $4.50B | $4.50B | $4.50B |
Ending economic diluted shares | 1.725B | 1.868B | 1.850B |
The Bull’s slightly lower ending share count than the Base reflects stronger cash generation and repurchases. It does not assume customer incentives disappear when the business performs well.
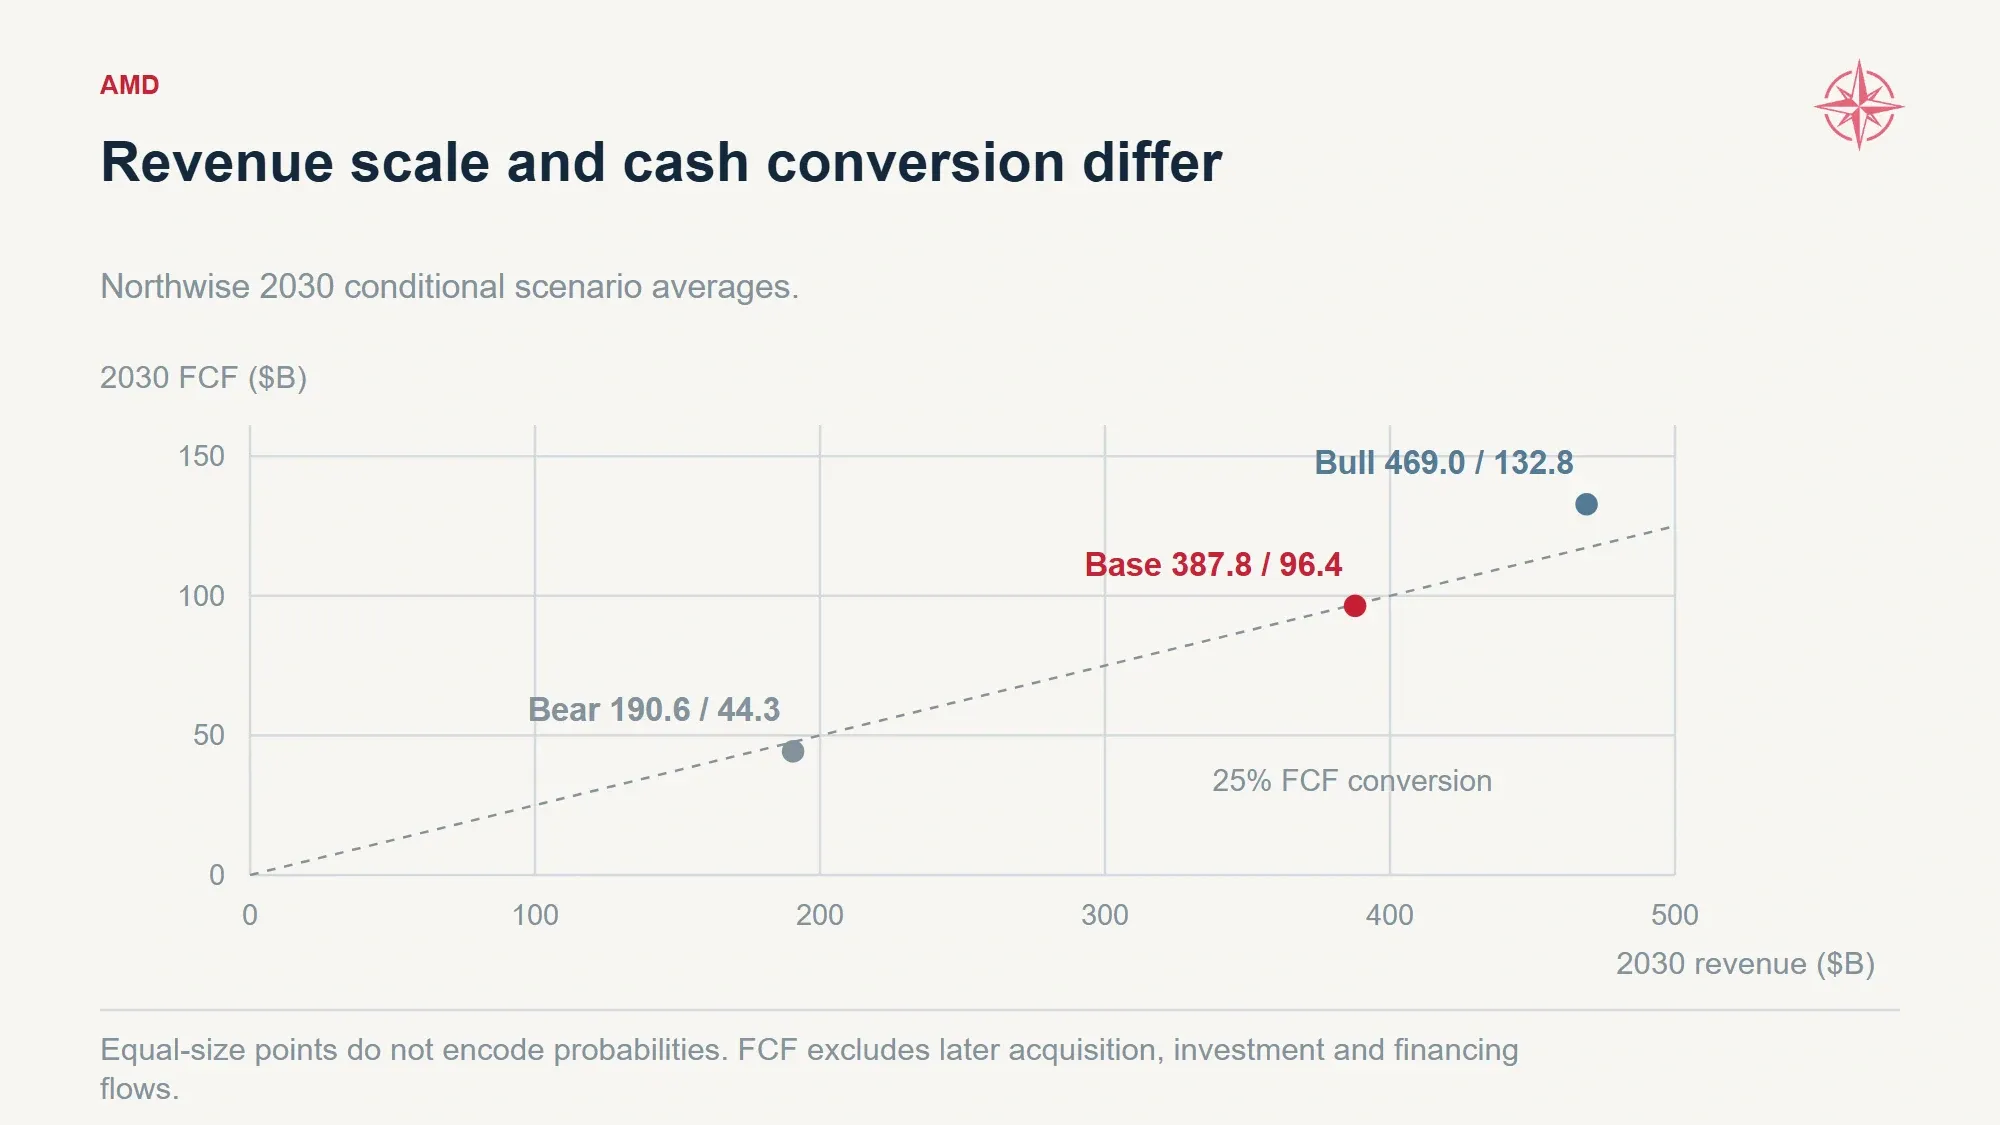
The operating scenarios differ in both revenue scale and the cash generated after owned capital expenditure.
Even the Bear average describes a company far larger than today’s. We would not ask a skeptical reader to accept that average as the worst conceivable outcome. It includes weaker individual paths, and the real world is not restricted to the sixteen combinations we have modeled.
The value of the exercise is identifying where the outcomes separate. In this forecast, the major drivers are sustained shipments, realized pricing, CPU growth and the costs of supporting them.
12. The Business Can Grow and Still Disappoint
The most credible challenge to our thesis is that AMD becomes a much larger supplier while customers and manufacturing partners capture more of the improvement than we expect.
Customers may buy the planned equipment but negotiate lower prices. Memory can become more expensive before AMD can pass the increase through. Deployment delays can push sales into a later period while inventory and operating expenses remain. Software support may require more engineers than the revenue forecast anticipates.
None of those outcomes requires the products to fail completely.
We test them through revenue, cash flow and funding rather than leaving them in a general risk paragraph.
The figures below are weighted across all sixteen outcomes. Their reference is therefore $347.84 billion of 2030 revenue and $90.13 billion of free cash flow, rather than the standalone Base figures.
Operating sensitivity | 2030 revenue | 2030 free cash flow |
|---|---|---|
Reference forecast | $347.84B | $90.13B |
GPU selling prices 15% lower, unchanged unit costs | $314.76B | $68.59B |
GPU selling prices 10% higher, unchanged unit costs | $369.90B | $104.49B |
HBM costs 25% higher | $347.84B | $82.70B |
New shipments 25% lower | $292.09B | $74.86B |
New shipments 25% higher | $403.60B | $105.40B |
Persistent one-year delivery delay | $289.26B | $72.09B |
Combined adverse assumptions | $264.37B | $50.57B |
The price-only tests keep manufacturing unit costs unchanged. Lower selling prices do not entitle AMD to an immediate discount from its suppliers. The HBM test assumes memory accounts for 35% of modeled GPU unit cost, which is an analytical assumption rather than AMD’s disclosed bill of materials.
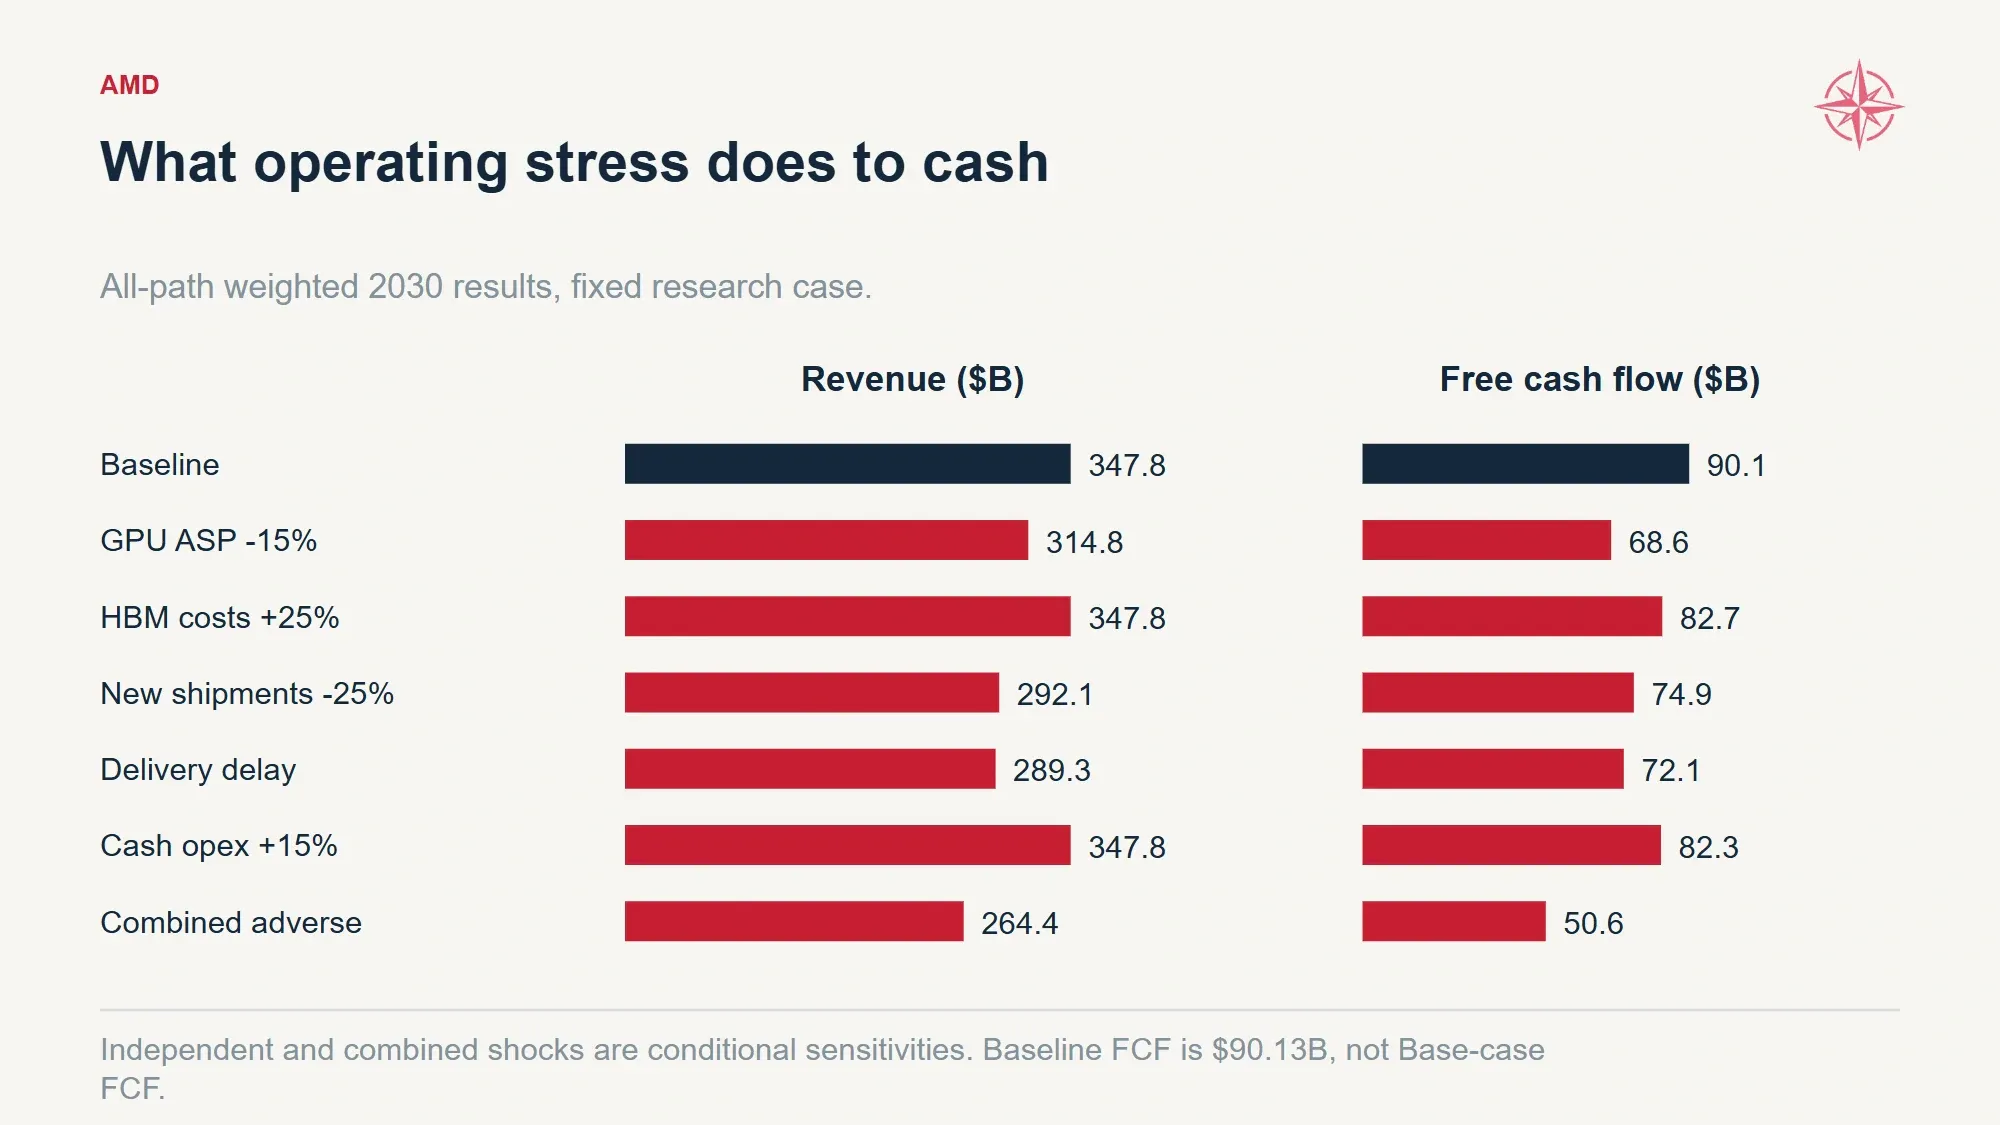
Operating sensitivities show changes in revenue and free cash flow before assigning stock values to those outcomes.
The combined adverse outcome is still an enormous company. Its cash generation is much less impressive relative to the original promise.
That is the risk we care about most. Shareholders can be directionally right about AI demand and still wrong about the economics their company earns from it.
Our more severe financing tests deliberately push weaker sales and pricing against heavy spending. When the specified cash requirements exceed available funding, the model identifies a payment gap. It does not insert unlimited new debt to make the statements look comfortable. Such an outcome would require management to reduce spending, change commercial terms, raise additional capital or restructure the plan.
We would expect management to respond before exhausting every option. We do not assign that response a cost of zero.
The upside tests are just as important. Faster deliveries, higher realized prices, lower memory costs or stronger CPU demand can improve the forecast. We are not using stress testing as a ritual that only moves numbers down.
The operating evidence that would change our view is specific. Repeat purchases after customers have used the hardware would strengthen the adoption case. Revenue and product mix consistent with the pricing curve would support the value assumptions. Collections keeping pace with receivables would strengthen confidence in cash conversion.
We would become more concerned if delivery slips persisted across generations, if rising prices failed to translate into stronger product profit, or if customers expanded AMD capacity only when the company supplied substantial financial support.
Export restrictions, manufacturing interruptions and product defects can also change the available opportunity abruptly. The prior-year MI308 export-control charges cited in AMD’s earnings materials are a reminder that product economics can be disrupted by policy as well as competition.
Our bullish view is conditional on continued evidence. A strong industry cannot indefinitely compensate for an individual supplier missing its delivery, cost or customer-return requirements.
13. The Forecast Beyond 2030
AMD does not become a mature company simply because the visible five-year table ends.
Our Base continues growing after 2030, with moderating business-level growth rates and substantial ongoing investment. Those later forecasts are less directly tied to named customer deliveries than the nearer shipment schedule, so they deserve correspondingly less certainty.
Base extended operating forecast | 2031E | 2035E | 2040E |
|---|---|---|---|
Revenue | $475.80B | $845.49B | $1,174.63B |
Normalized operating income | $162.31B | $291.16B | $397.87B |
Cash capital expenditure | $23.17B | $39.72B | $53.76B |
Employee stock compensation | $11.01B | $18.23B | $25.01B |
These are Northwise forecasts, not secured customer capacity.
A $1.175 trillion revenue estimate should make the reader pause. It assumes that useful computing becomes a much larger market and that AMD retains a meaningful position through many product generations. Extending the calendar does not reduce the burden of that assumption.
We retain the growth because we think the opportunity can continue well beyond the current deployment cycle. We also retain the costs: engineering, compensation, working capital and more than $50 billion of annual capital expenditure in the final explicit year.
The forecast gives readers the information needed to disagree with us. The operating materials contain the customer allocations, pricing, financial statements, ownership calculations, scenario assumptions and sensitivities. The published stress results remain fixed research-date comparisons rather than automatically updating after a reader changes an input.
The operating tables above are fixed snapshots of this research case. The complete editable workbook is available with the Premium analysis below.
Our operating conclusion is that AMD’s opportunity has become large enough to justify a much more ambitious forecast, and concrete enough to model beyond a generic claim that AI demand will grow.
The final step is deciding what that business is worth at a given purchase price.
Northwise Premium
Choose how to continue with Northwise
Join Northwise Premium
Unlock the rest of this report, its complete valuation, the downloadable model, portfolios, and action framework.
Join Northwise PremiumCreate a Free Account
Continue across Free Northwise research, follow companies, save reports, and receive updates.
Create a Free Account
AMD Stock Forecast 2030
This AMD Stock Forecast 2030 explores AMD's transition from a distant secondary supplier to an open compute superpower in Artificial Intelligence.
AMD Sovereign AI Infrastructure
AMD sovereign AI: live HUMAIN systems, future Saudi capacity, LUMI-AI procurement, Korea's partnership and the path from infrastructure plans to revenue.

AMD Total Addressable Market
AMD’s total addressable market is shaped by a $500B AI accelerator market and a $1.7T compute stack driven by scale, power, and supply.
Northwise Portfolios
See how the research becomes real decisions
Reader discussion
Discuss the research
Premium access is required to join this report's discussion.
Join Northwise Premium
No comments yet. Start a thoughtful discussion.