Nebius 2027 Revenue and Capex Forecast: The Megawatt Calendar

Our Nebius 2027 forecast follows each site from power to customer acceptance, then traces revenue, capex, customer advances and borrowing to per-share value.
In this article
Nebius plans to more than quadruple its accepted capacity in 2027, and a third of the year-end fleet arrives in the final quarter. We follow every site, contract and funding source to see what that timing does to revenue, earnings, cash and the balance sheet.
Growth the Market Sold Anyway
Nebius reported 571% revenue growth on November 12 and lost roughly a quarter of its market value over the next two sessions. By the end of the following week, the shares traded near $85, more than 70% below the $299.86 high set in June.
The quarter itself was strong. Revenue of $980.8M beat consensus by about 8%. Agreements signed during the quarter carried more than $25M of annual contract value per MW, and customer prepayments on those deals covered more than 100% of the associated capital spending, up from 50% to 60% in Q2, according to the Q3 shareholder letter.
Investors focused on a different set of numbers in the same release. The remaining Microsoft capacity at the New Jersey campus slipped to Q2 2027. The 2026 revenue outlook moved to the low end of its $3.0B to $3.4B range, 2026 capex rose to about $27B, and management previewed $40B to $45B of 2027 capex against $12B to $13B of revenue. The Street had expected about $28.8B of 2027 capex.
Three Waves of Selling
The decline arrived in three waves, and only one of them began with Nebius.
The first came in October. Nebius lost about a third of its value during the month without releasing any earnings or contract news, as concern about CoreWeave's borrowing spread across the neocloud group. At the end of June, Nebius carried about $504M of net borrowings excluding leases, against roughly $29.5B at CoreWeave.
The second came with the results. The stock fell nearly 17% on November 12 and almost 10% more the next session. The guidance revision landed the same week as the abrupt resignation of NVIDIA chief executive Jensen Huang and a wider loss at Nscale, a private competitor. Two of those three events said nothing about Nebius's contracts, sites or customers.
The third came from the sector. AI-linked shares retreated on November 20 after Anthropic's IPO priced above its marketed range, and Nebius fell alongside CoreWeave and IREN as the Nasdaq touched a seven-month low. One analyst withdrew a Buy rating the same week, citing debt, free cash flow strain and developments at NVIDIA.
At about $85, the equity is valued near $25B on roughly 293M common shares. The Microsoft agreement, worth up to $17.4B through 2031, and the dedicated Meta agreement, worth $12B over five years, together carry about $29B of contract value. The ClickHouse stake alone is worth about $11B at the latest private indication, before any of our adjustments.
Testing the Bear Case Against the Evidence
Each fear behind the selloff can be checked against something Nebius has disclosed or something the market can observe. Most of them fail that check.
The first fear is fading demand. Q3 revenue beat expectations, contract value per MW rose from above $20M to above $25M, and prices per GPU-hour rose more than 20% from Q2.
More than 90% of Q3 contract value carried a prepayment. Customers worried about the durability of their own AI demand do not prepay more than the cost of the equipment they are renting. Even Evercore's Amit Daryanani, discussing the group this week, placed the constraint on capacity and financing.
The second fear is that the guidance cut shows execution breaking down. The cut traces to a single third-party site, where the landlord retired temporary generation before permanent power was in place.
Microsoft's remaining tranches moved to Q2 2027, more than half the contracted capacity is still expected by year end, and the contract itself is unchanged. A landlord's power sequencing problem costs Nebius months of revenue. It does not cost the customer, the price or the contract.
The third fear is capex running ahead of revenue. Capital spending leads revenue by design in a build of this kind: 2027 spending buys a fleet whose December revenue annualizes to about $35B, more than twice the year's revenue. A $40B to $45B capex plan looks alarming against a $28.8B consensus figure, though the consensus figure described a smaller fleet. When customers prepay more than 100% of associated capex on new deals, a larger plan means a larger business funded in large part by those customers.
The fourth fear is that Nebius carries CoreWeave's balance sheet. The June figures above say otherwise, and Nebius raised $5.75B of debt during Q3, showing the market remains open to it. Even after a full 2027 build in our base case, year-end nonconvertible debt of $31.50B sits below 2 times annualized Q4 EBITDA, and annualized cash interest is covered almost 6 times.
The fifth fear is that the AI trade itself has turned. Leadership change at NVIDIA and a rotation around a large IPO move sentiment. Neither changes a signed Nebius contract. NVIDIA reported data center revenue up 110% to $107.6B in the same week the neocloud group sold off.
What survives the check is narrower and more concrete. Nebius has to close financing facilities that do not exist yet, and a large share of 2027 capacity arrives in the final quarter. Both risks are real, dated and observable. Neither reflects weaker demand, worse pricing or a broken contract, and the price the market now pays treats them as near-certain failures.
Our base case puts Nebius at $16.39B of 2027 revenue on $52.58B of cash capital spending, with accepted IT capacity rising from 377 MW to 1,594 MW. The rest of this forecast follows each megawatt from power connection to paid invoice, then to the cash and debt that fund it.
What Nebius Sells
Nebius rents computing power for artificial intelligence. It secures electricity and buildings, either owned or leased from hosts, installs NVIDIA systems, and sells access to that equipment through its own cloud software. Customers range from Microsoft and Meta, which reserve dedicated capacity for years, to AI developers who book clusters for months or pay by the hour.
Three smaller revenue streams sit beside the core cloud. Infrastructure partnerships let a partner own the hardware while Nebius earns fees for enabling and later operating it. Token Factory sells model access and production inference endpoints. Stakes in ClickHouse, Avride, Toloka and TripleTen carry value outside the cloud business entirely.
The unit that ties everything together is the accepted IT megawatt. Power arrives at a site, equipment is installed, the cluster is tested, and the customer accepts it. Billing starts there. Our October 2027 forecast walked through each stage of that chain in detail.
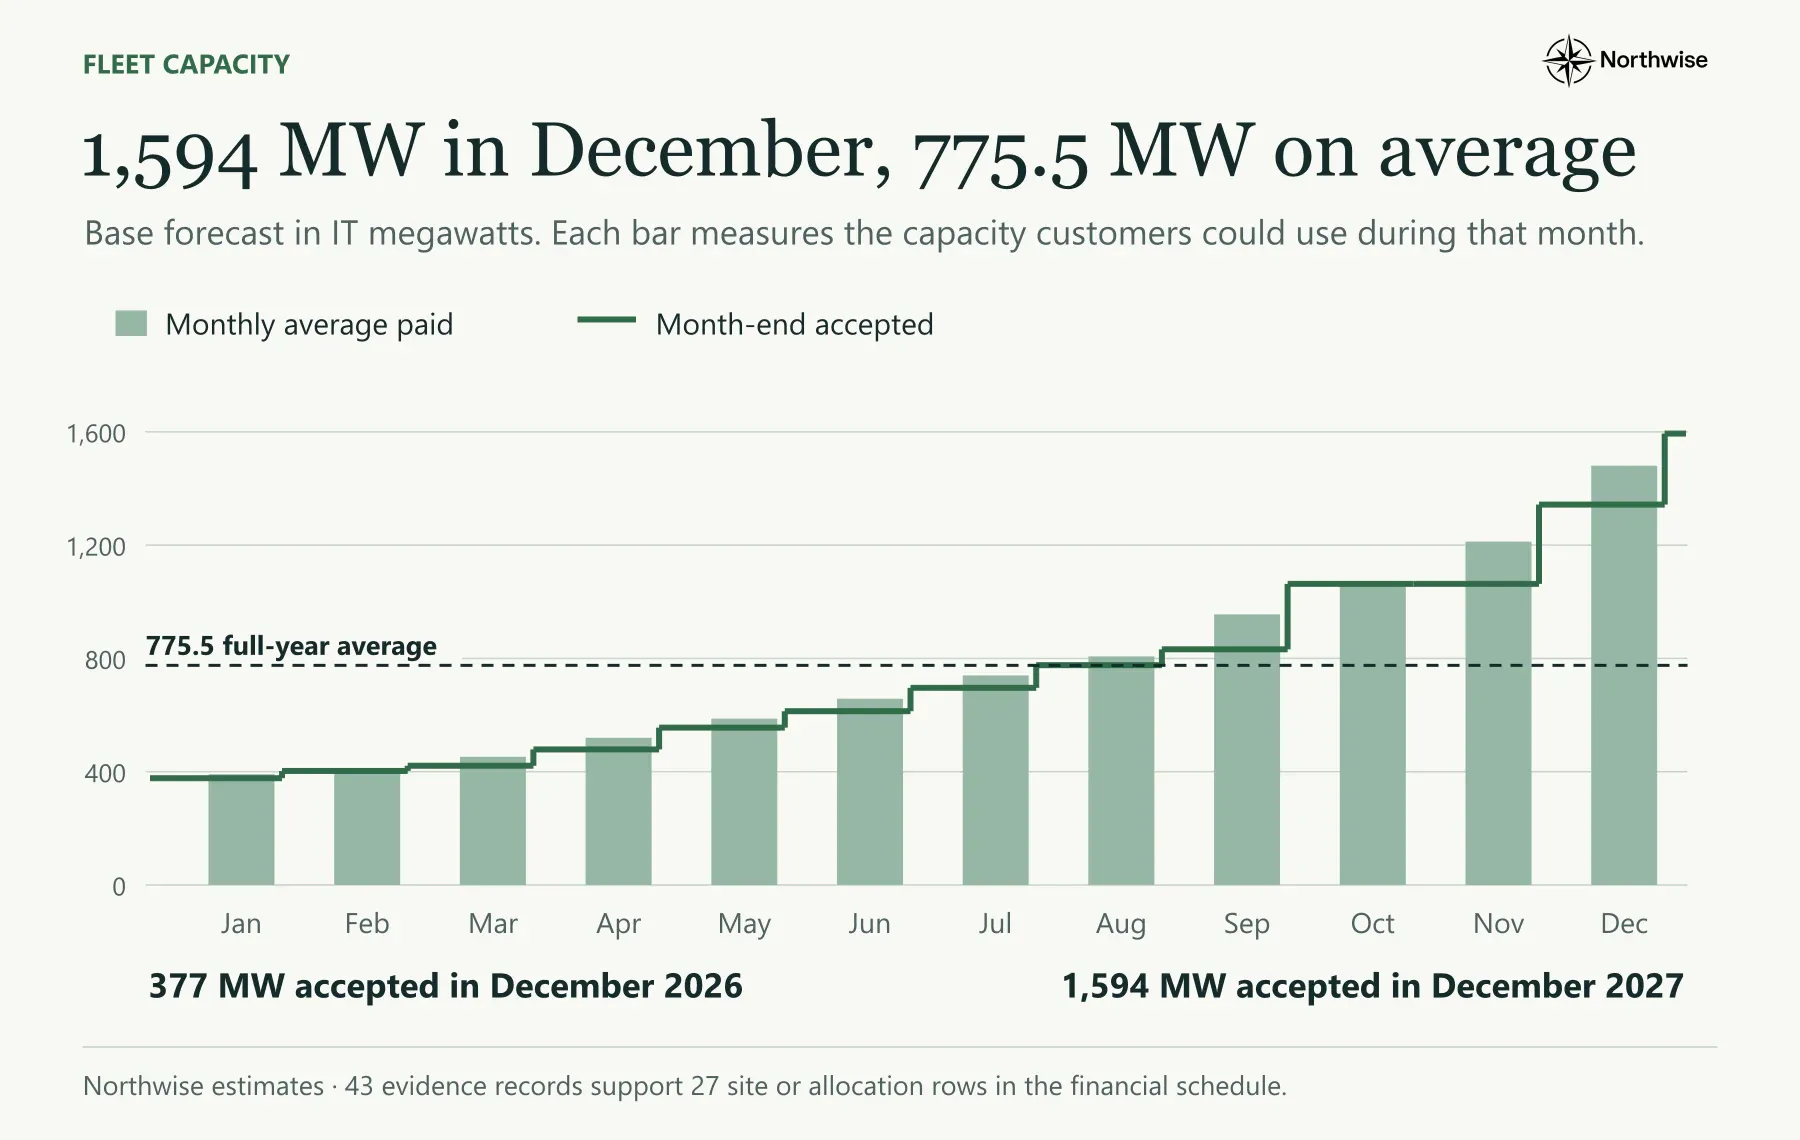
At the end of 2027, our base case has 1,634.7 MW equipped, 1,611.4 MW ready and 1,593.8 MW accepted. The small gaps between those numbers hide a much larger one. Across the full year, Nebius earns on only 775.5 MW on average, less than half the December fleet.
Where We Part Ways With Management
Our forecast lands above management's preliminary 2027 view on revenue and on spending. The comparison needs care, as the company's measures and ours are built on different denominators.
2027 | Management preliminary view | Northwise base |
|---|---|---|
Revenue | $12B to $13B | $16.39B group; $15.14B operated cloud |
Capital spending | $40B to $45B | $52.58B cash capex |
Customer prepayments | $17B to $20B | $23.12B fresh advances |
Fourth-quarter pretax result | Breakeven | $1.11B accounting pretax |
Management's revenue view excludes potential partnership contributions. The fair comparison is our operated cloud revenue of $15.14B, which sits $2.14B above the top of the range.
Most of that gap is a timing judgment. Our base earns about $19.5M per average paid MW across the operated fleet. At that yield, $13B of revenue requires roughly 666 average MW, about 14% less capacity-time than we model. Our slower delivery case produces $12.85B of operated revenue, almost exactly inside management's range.
Read that way, the company's outlook resembles our slower calendar. We keep our base calendar, given the dated power and handover evidence site by site, though the difference between the two comes down to a handful of months at a handful of campuses.
Our capex figure includes $2.83B paid during 2027 for capacity delivered in 2028, along with facility checks that fall ahead of power dates. Management's spending range and ours count different things, and we would not read the gap as a disagreement about cost per megawatt.
The Calendar From 377 to 1,594 MW
The base path reaches 479 accepted MW in March, 696 in June, 1,063 in September and 1,594 in December. Five campuses do most of the work.
Explore the full Nebius site inventory in our network guide or open the Nebius Data Center Tracker to follow individual locations.
Site | Accepted IT MW, Dec 2026 | Base, Dec 2027 | Base handover months | Slower, Dec 2027 |
|---|---|---|---|---|
135.0 | 240.0 | Apr, May, Jun | 240.0 | |
0.0 | 220.0 | Nov, Dec | 165.0 | |
0.0 | 205.0 | Jul, Sep, Dec | 180.0 | |
0.0 | 172.0 | Sep, Nov | 172.0 | |
22.5 | 144.0 | Jan through Nov | 144.0 | |
Unlocated allowance | 20.0 | 99.6 | Mar, Jun, Sep, Dec | 99.6 |
0.0 | 58.0 | Nov, Dec | 45.0 | |
0.0 | 58.0 | Mar, May | 58.0 | |
0.0 | 56.0 | Aug | 56.0 | |
India colocations (2) | 0.0 | 40.0 | Sep, Nov | 40.0 |
0.0 | 25.0 | Dec | 0.0 | |
0.0 | 20.0 | Nov, Dec | 0.0 | |
14 operating and smaller lines | 199.6 | 256.2 | Various | 256.2 |
Total | 377.1 | 1,593.8 | 1,455.8 |
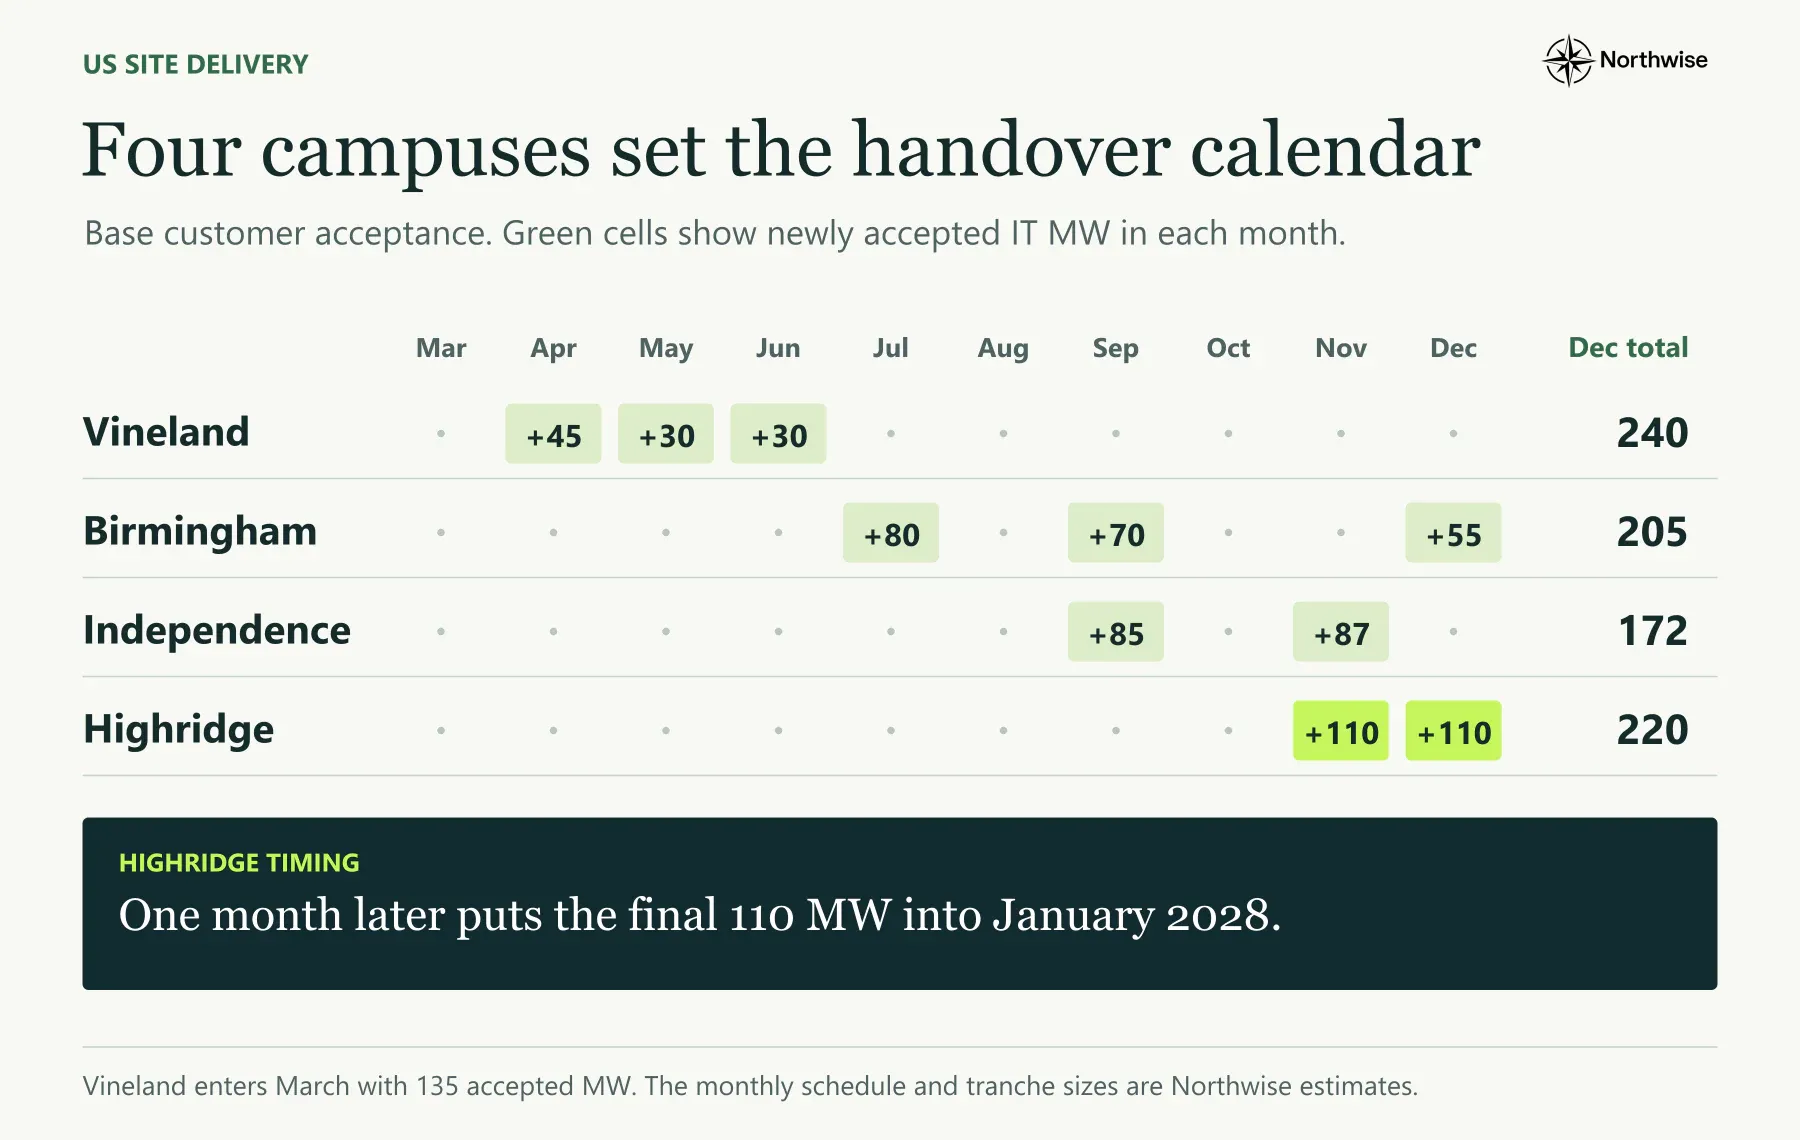
Vineland is the near-term test. Microsoft deliveries continued into November, Bloom fuel cells now supply the site's power, and management expects the remaining tranches in Q2. We carry 135 MW through March, then 180 MW in April, 210 in May and 240 in June. The slower case finishes in August.
Highridge carries the most weight late in the year. Its first 260 MW phase, backed by PPL, targets October 2027 power. We assume two 110 MW customer handovers in November and December, which leaves very little room for a late energization or an extended round of tenant testing.
Independence and Birmingham fill the third quarter and add more in the fourth. Independence draws on 200 MW of first-phase local supply and reaches 172 MW by November. Birmingham's two Oxmoor buildings and substation support handovers in July, September and December.
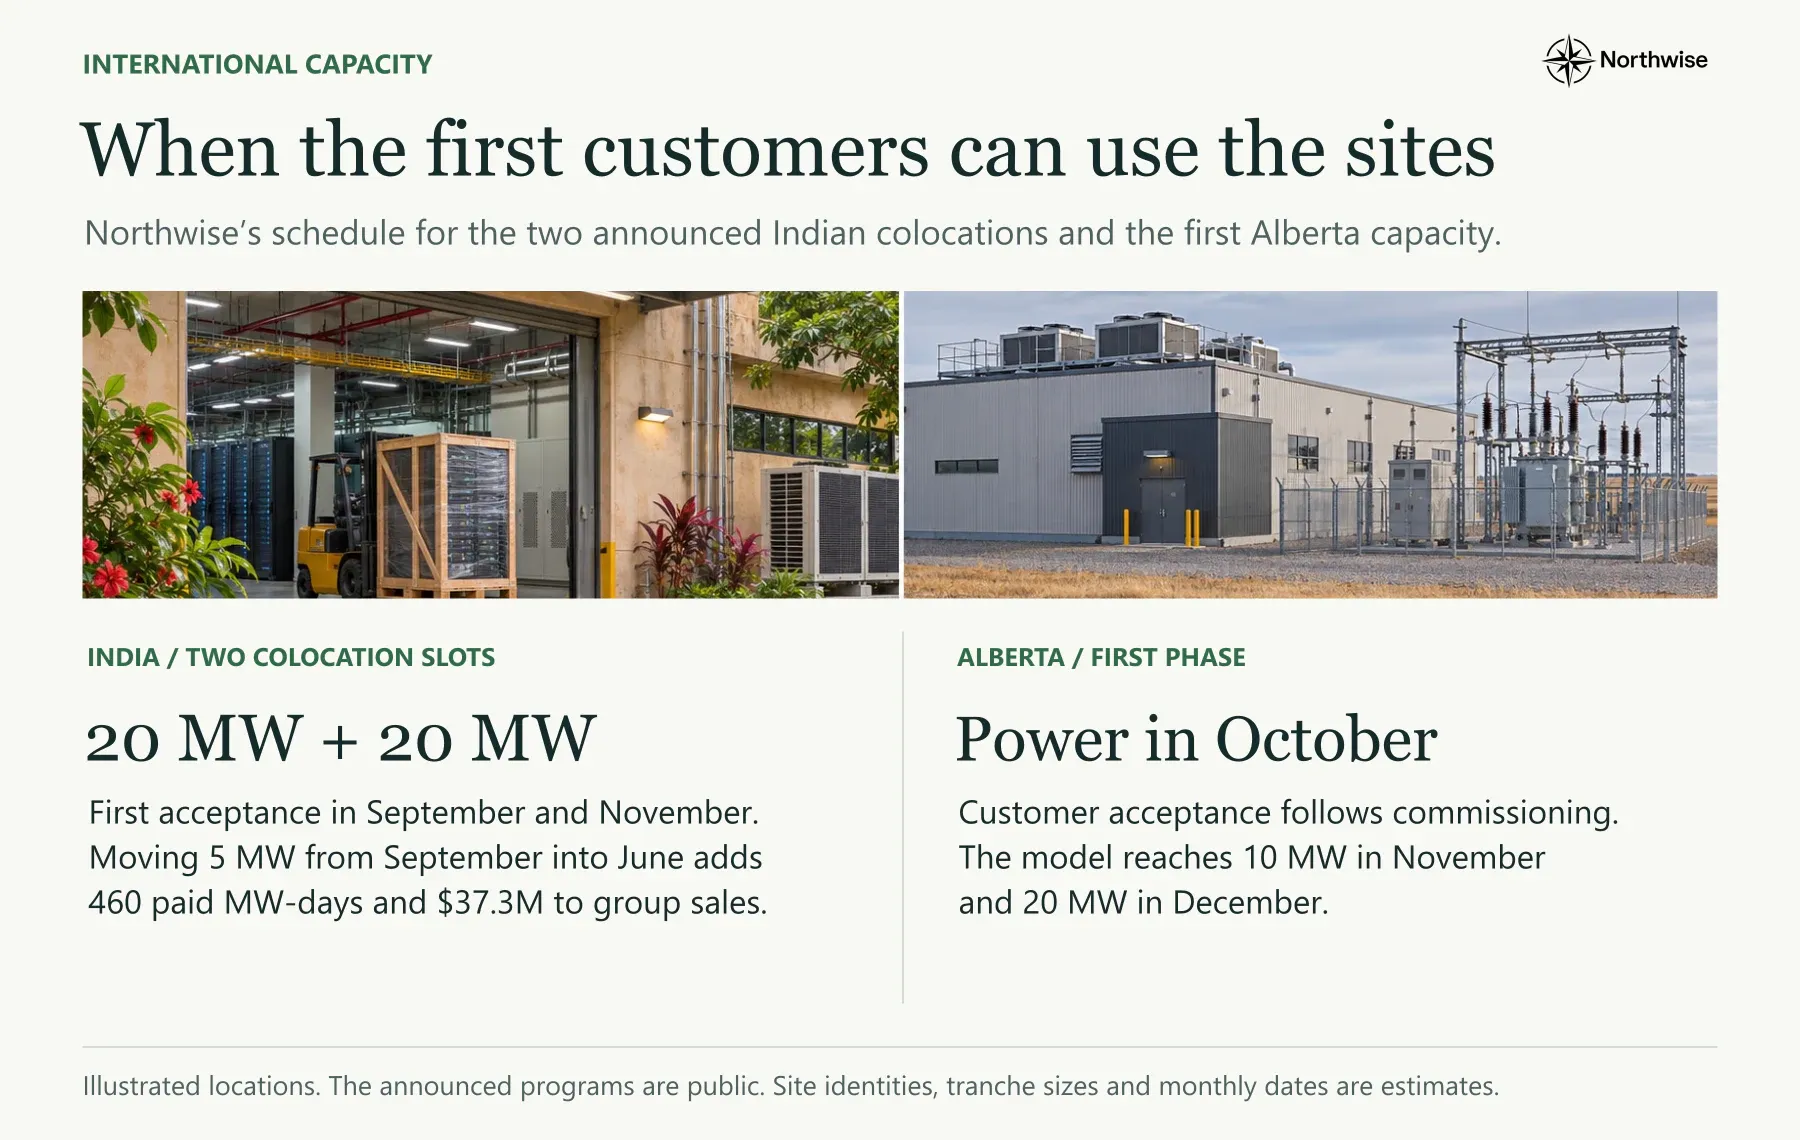
The smaller additions carry assumptions we want to flag openly. Nebius has announced two Indian colocations for 2027 without naming cities, so we assign 20 MW to each in September and November. In Alberta, where Nebius holds exclusive rights for a planned 100 MW multi-campus project, we assume October power, 10 MW billing in November and another 10 MW in December.
Our evidence register holds 43 records, mapped to 27 financial lines. Leads such as Oklahoma City, a second Paris region, a Rotterdam letter of intent and unconfirmed operating sites in Indiana and Malaysia carry zero megawatts until capacity can be attributed to Nebius. The unlocated allowance starts at 20 MW and releases another 79.65 MW across 2027, and each confirmed site replaces part of it one for one.
Why the Fourth Quarter Carries the Year
Between September and December, accepted capacity rises by 530.7 MW. One third of the year-end fleet arrives in the final quarter, and Highridge alone accounts for 220 MW of it.
Revenue follows the same shape. Group sales run $1.93B, $2.97B, $4.20B and $7.29B by quarter, so the fourth quarter produces 44% of the year. December group sales of $2.94B annualize to about $35.3B, more than twice what Nebius earns across 2027.
A one-month slip at Highridge shows how the calendar transmits through the business. November's handover moves to December, December's moves to January 2028, and capital spending stays exactly where it was. Revenue falls about $434M, only 2.6% of the year.
The cash effect is larger. Customer advances fall $1.45B as part of the December cohort crosses into the following year, and growth borrowing rises by $1.46B to cover the difference. The effect on value per share is larger again, and we quantify it in the premium section.
Unlocated capacity behaves differently. Removing every unidentified 2027 release costs $442M of revenue and saves $2.40B of capex. Capacity bought at full cost during the year earns for only part of 2027, so most of its value shows up in 2028.
What a Megawatt Earns
Our $15.14B of operated cloud revenue starts with contracts already in place. Microsoft, the original Meta and landmark agreements, older merchant contracts and an unclassified opening balance together produce $7.56B, half the year's operated total, at rates set before the current pricing cycle.
Contract category | Unit rate, $M per MW-year | Base 2027 sales |
|---|---|---|
Microsoft | 14.49 | $2.94B |
Original Meta | 15.00 | $0.51B |
Original landmark | 22.50 | $1.27B |
Original merchant | 13.84 | $2.05B |
Opening unclassified | 16.24 | $0.79B |
New Meta | 16.00 | $0.95B |
New landmark | 22.50 | $0.19B |
New reservations | 23.44 | $3.44B |
New shorter bookings | Priced by GPU generation | $3.00B |
Operated cloud | $15.14B |
New reservations earn $23.44M per accepted MW-year, a little below the more than $25M of annual contract value Nebius reported for Q3 signings. The company's figure blends one-year and five-year deals and does not specify its megawatt basis, so we read it as support for the level and the direction of pricing.
Shorter bookings need more work. We price 65% of each megawatt at a negotiated cluster rate, 25% at posted on-demand prices and 10% at interruptible spot prices, then apply 92% paid coverage, 98% service realization and 97.5% commercial realization.
B300 illustrates the method. On November 20, the seven-day B300 spot average we observed on the Nebius spot board was $6.58 per GPU-hour. At 500 GPUs per IT MW, continuous sale at that price equals $28.82M per MW-year, and the $9.50 on-demand rate equals $41.61M. Blending the three lanes and allowing for coverage and realization yields $37.96M per realized MW-year.
Hardware | Short cluster, $M per MW-year | On-demand, $ per GPU-hour | 7-day spot, $ per GPU-hour | Realized, $M per MW-year |
|---|---|---|---|---|
Rubin | 52.00 | Not quoted | Not quoted | 45.71 |
B300 | 46.00 | 9.50 | 6.58 | 37.96 |
GB300 | 46.00 | Not quoted | Not quoted | 40.44 |
B200 | 38.00 | 8.50 | 3.48 | 31.62 |
RTX | 15.00 | 1.80 | 1.43 | 12.68 |
Rubin has no public price yet, so its rate rests entirely on cluster underwriting. The Rubin share of new equipment at unassigned sites rises from 45% in Q1 to 90% in Q4. Of the roughly 1,190 MW of new equipment installed during 2027, about 860 MW is Rubin.
The generation shift lifts the whole fleet. Realized yield across operated capacity rises from $16.10M per MW-year in Q1 to $21.70M in Q4, and short-contract yield rises from $38.05M to $43.25M. Newer, denser hardware gradually outweighs the opening book.
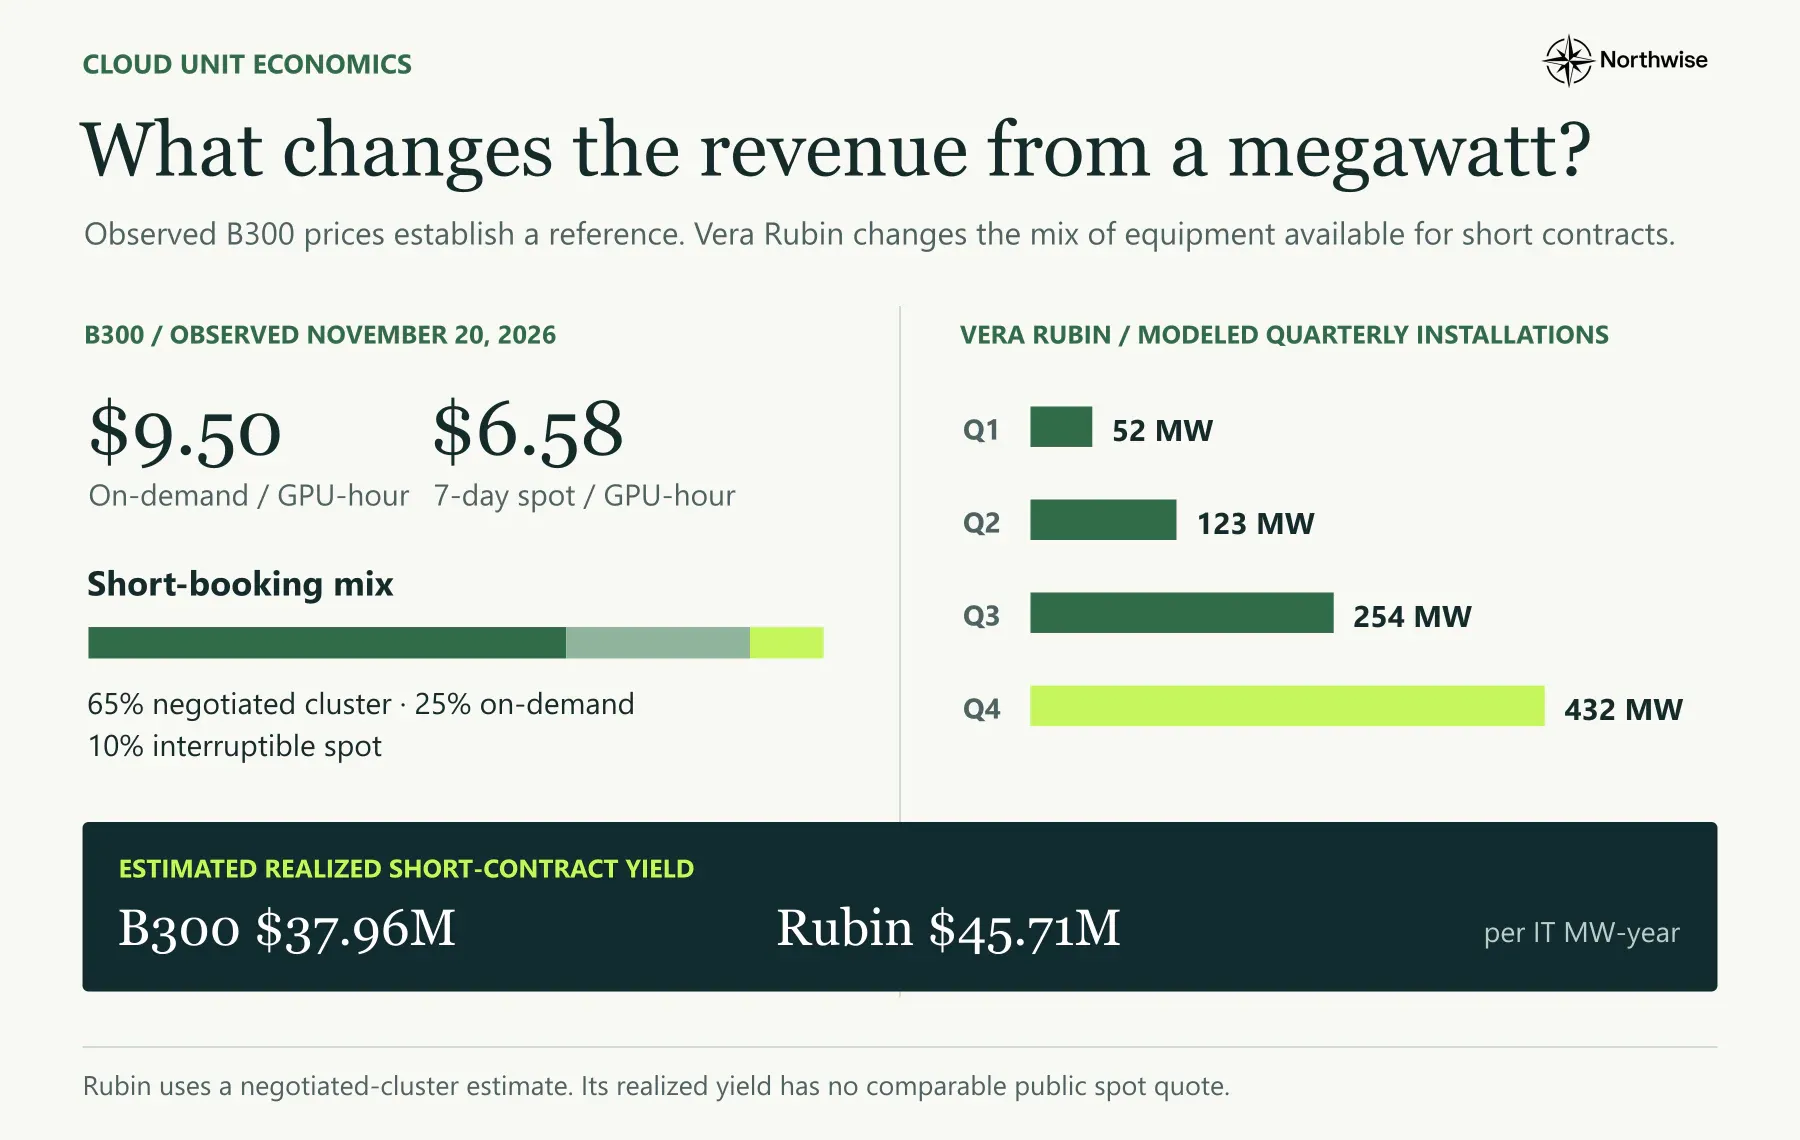
The sensitivities sort the pricing inputs by importance. Halving every observed spot price reduces 2027 revenue by about $21M. Lowering the Rubin short-cluster assumption by $5M per MW-year removes $193M. A week of marketplace prices makes a good headline, though the negotiated Rubin cluster rate carries far more of the forecast.
The Partner Business Can Move a Quarter
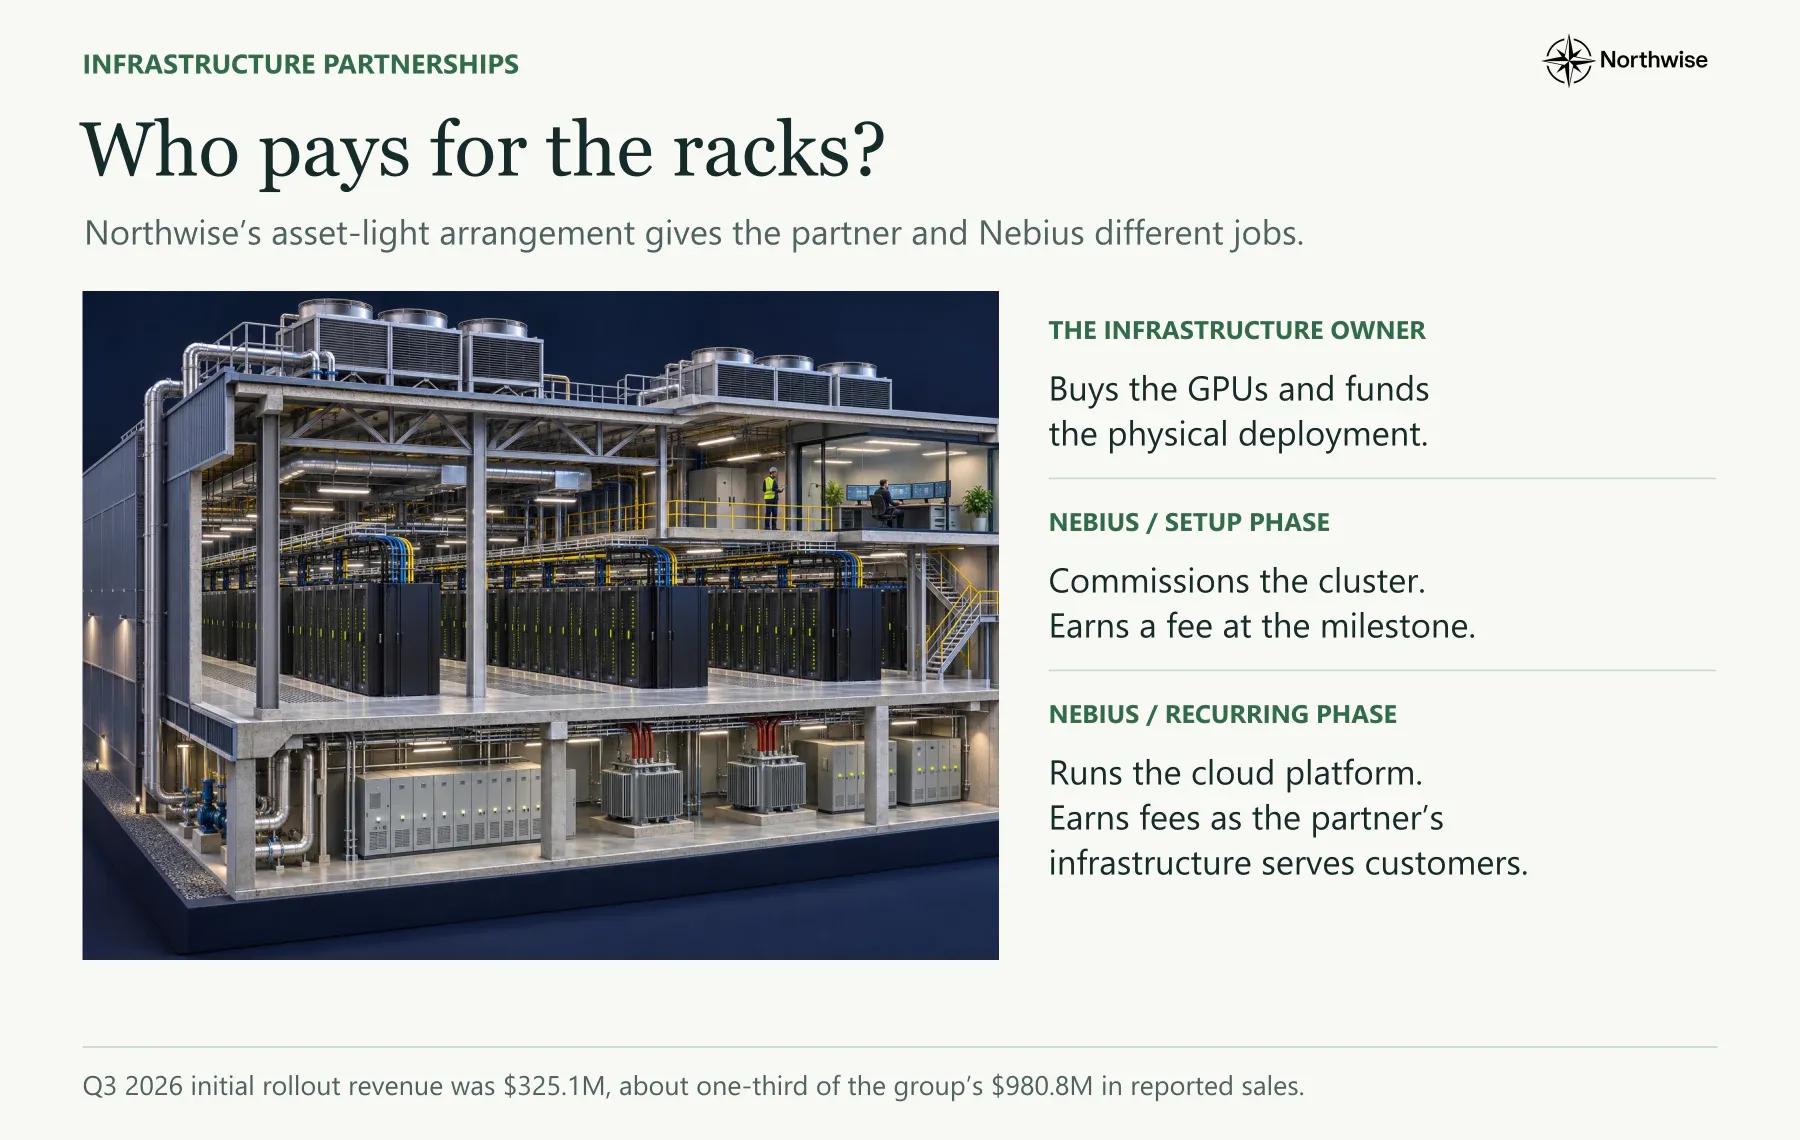
Nebius recognized about $325M of nonrecurring revenue from infrastructure partnerships in Q3, roughly 33% of $980.8M in group sales. Nine-month partnership revenue was $409.1M, which leaves $84.0M in the first half.
The structure earns twice. A partner pays Nebius when its architecture and platform are enabled on the partner's capacity, and Nebius later retains fees once that capacity serves customers. The first phase can be large and land in a single quarter, and the second builds slowly over years.
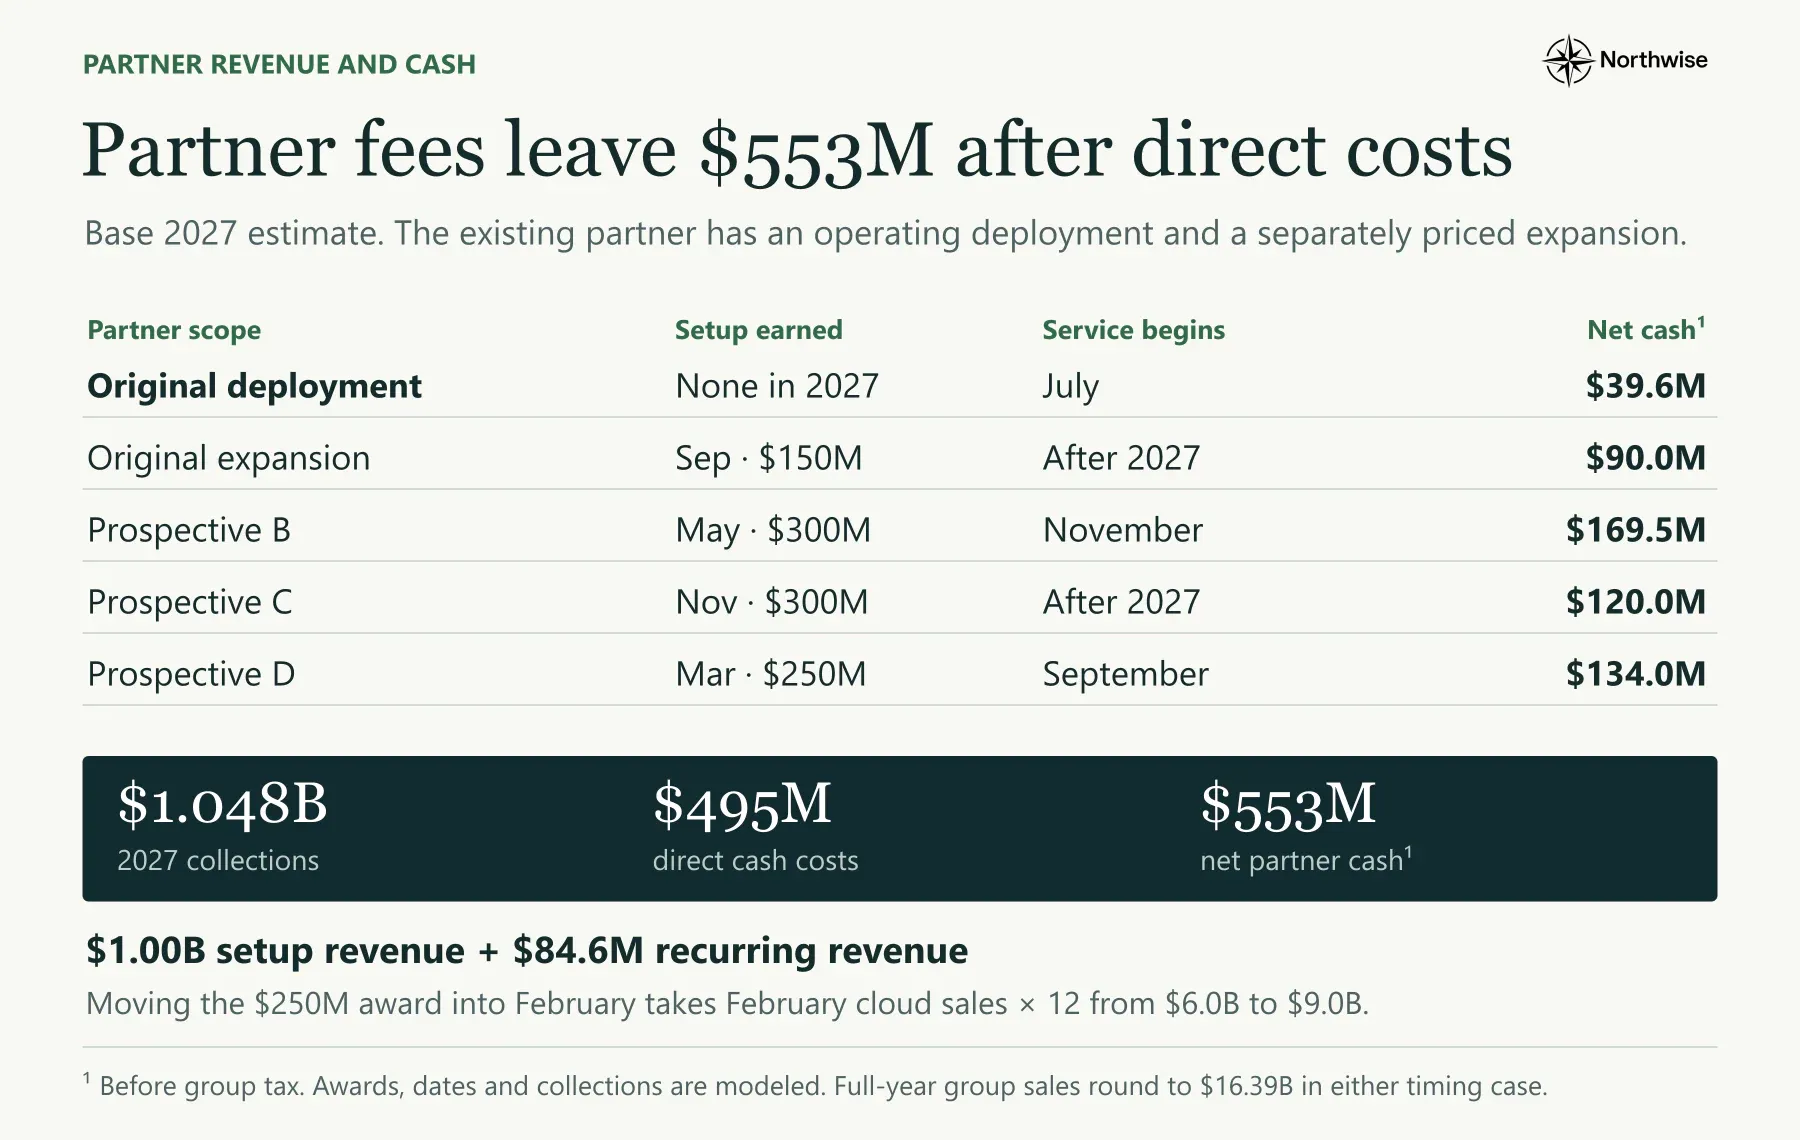
Our base includes $1.085B of partner revenue. Setup entitlements total $1.00B: $150M of expansion for the original partner in September, $300M from a second partner in May, $300M from a third in November, and a conditional $250M award in March. Ongoing service fees add $84.6M, reaching 80 live partner-funded MW and a $288M annual fee rate by December.
These awards are underwriting assumptions. Nebius has described a pipeline and one completed transaction, and no counterparty, award date or conversion probability has been disclosed. Dropping the conditional March award and its service phase returns partner revenue to $820M and group revenue to $16.12B.
The cash economics are attractive. Partner collections of $1.048B, less $495M of direct cash costs, leave $553M before tax, and the partner buys the hardware. For anyone tracking cloud growth quarter by quarter, the partner line needs to be separated out first: base partner revenue lands in March, May, September and November, and each milestone can swing a quarter by $250M to $300M.
The February Test
Nebius now expects ARR above $7B for February, about two months later than its earlier $7B to $9B target for December 2026. The figure arrives early in the year and offers the first hard check on the calendar.
Our February operated cloud revenue is $499.57M, which annualizes to about $6.0B. Closing the gap to $7B requires $83.76M of additional revenue in the month, or $82.47M after including modeled financing revenue.
A partner milestone could close that gap on its own. Moving our $250M award from March to February lifts February's annualized pace to about $9.0B with virtually unchanged annual economics, and moving the $150M original-partner expansion instead lifts it to about $7.8B. Ongoing service fees alone would require roughly 281 to 337 average partner MW in February, far beyond anything live today.
We keep the award in March, as the company has not identified a February entitlement. When the number arrives, its composition will say more than the headline. Operated cloud running near $6B annualized fits our calendar. A figure well above $7B most likely includes a partner milestone, depending on how the company treats that revenue in the month.
Token Factory Without Counting It Twice
Token Factory gives Nebius a second way to sell the same cluster. Enterprises pay for model access, dedicated endpoints and production service. A customer that builds an endpoint into its product has reasons to renew that go beyond the hourly price of a GPU.
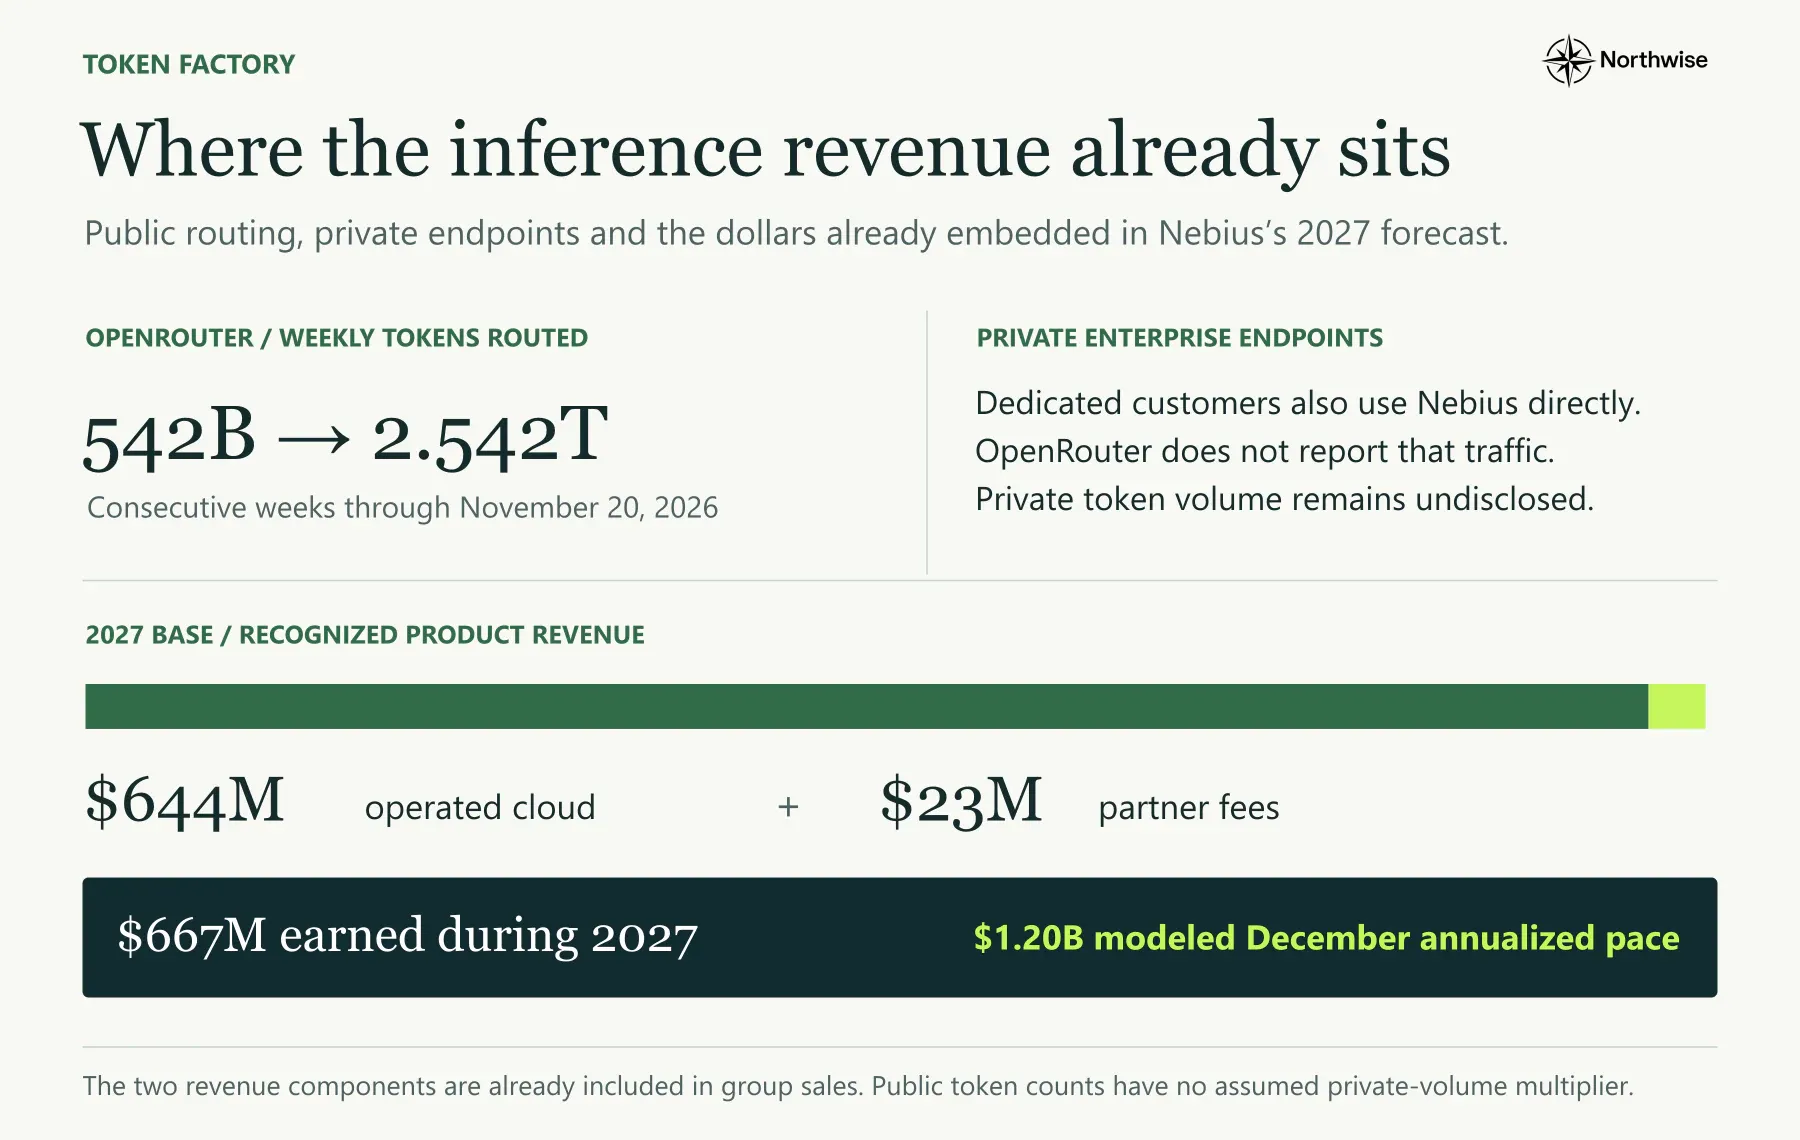
Public evidence is partial. Nebius serves 21 models through OpenRouter, and a third-party aggregation measured 2.542T routed tokens in the week through November 20, up from 542B the week before. Its estimate of $704,404 in weekly marketplace billings annualizes to about $37M at that week's mix.
Management described Token Factory as approaching a multi-hundred-million-dollar run rate, with contract value up 17 times quarter over quarter in Q3. The two observations measure different populations. Private enterprise endpoints do not route through OpenRouter, and signed contract value still has to convert into consumption.
We start the base at a $280M annualized pace and reach $1.20B by December 2027, which produces $667M of product revenue during the year. All of it already sits inside our forecast: $644M within operated cloud revenue and $23M within partner fees. Adding a separate inference line on top would count the same dollars twice.
The product grows about 4 times over the year in our base. Eligible merchant cloud revenue around it grows about 6 times, so Token Factory's share of that revenue falls from 11.1% in Q1 to 5.1% in Q4. Our forecast does not depend on inference becoming a larger slice of the business, and any shift in that direction would add to it.
From Revenue to Earnings
Margins expand through the year as accepted capacity outgrows a largely fixed cost base. Group adjusted EBITDA reaches $8.39B, a 51.2% margin, rising from 32.5% in Q1 to 59.3% in Q4.
Base 2027 | Q1 | Q2 | Q3 | Q4 | Full year |
|---|---|---|---|---|---|
Group revenue | $1.93B | $2.97B | $4.20B | $7.29B | $16.39B |
Group adjusted EBITDA | $0.63B | $1.29B | $2.15B | $4.32B | $8.39B |
EBITDA margin | 32.5% | 43.6% | 51.2% | 59.3% | 51.2% |
Depreciation | $0.77B | $1.00B | $1.46B | $2.18B | $5.42B |
Normalized pretax | -$0.39B | $0.09B | $0.27B | $1.57B | $1.54B |
Accounting pretax | -$0.68B | -$0.29B | -$0.22B | $1.11B | -$0.08B |
Site costs are built from the ground up. Direct power cost per accepted MW equals site power usage effectiveness times 80% utilization times 8,760 hours times the local power price, and rent and service costs follow by facility type. Merchant capacity carries a $5M per MW-year provision for selling and serving individual workloads, against $1.5M for dedicated contracts. Installed equipment awaiting acceptance costs $0.75M per MW-year to hold, and fixed operating costs add $1.15B for the year.
Depreciation uses five-year hardware lives and $800M of annual facility depreciation, and stock compensation runs $350M. Cash interest is $1.40B. After those charges, normalized pretax earnings reach $1.54B for the year and $1.57B in the fourth quarter alone.
Accounting earnings land lower. Large customer prepayments contain a financing component under revenue accounting, which adds $123M of noncash revenue and $1.32B of noncash interest, and the convertible notes add another $423M of accounting cost. The full year closes with a small $79M accounting pretax loss.
The fourth quarter turns clearly positive. Management has guided to pretax breakeven by Q4 2027 after financing costs and five-year depreciation, and our base produces $1.11B of accounting pretax earnings in that quarter. The difference traces back to the calendar. Q4 earns on about 1,250 average paid MW against 775.5 for the full year, and our base carries a larger fleet into that quarter than management's revenue outlook implies.
Who Pays for a $52.6B Build
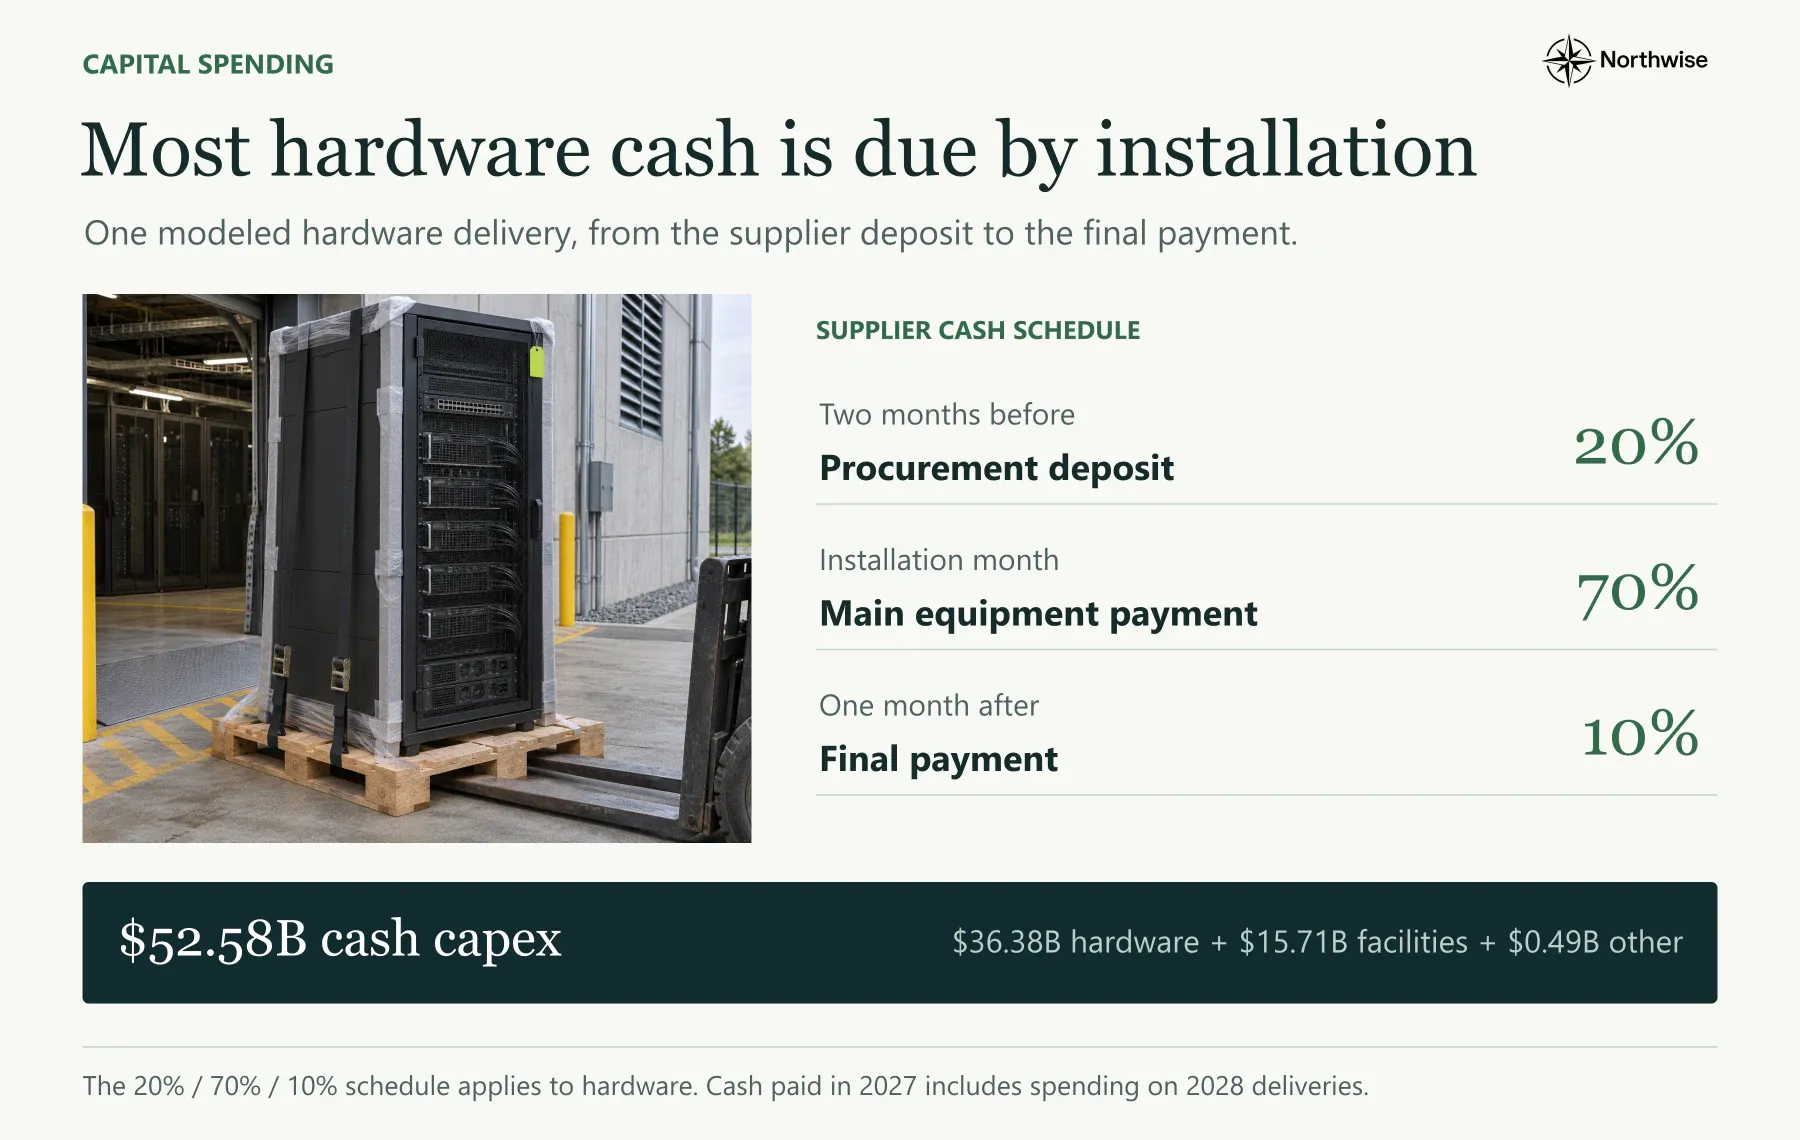
Hardware takes $36.38B of base cash capex, facilities $15.71B and other items $0.49B, including $249M of capitalized interest. Spending runs $7.98B, $12.54B, $15.55B and $16.52B by quarter, with suppliers paid 20% two months ahead of installation, 70% on installation and 10% the following month.
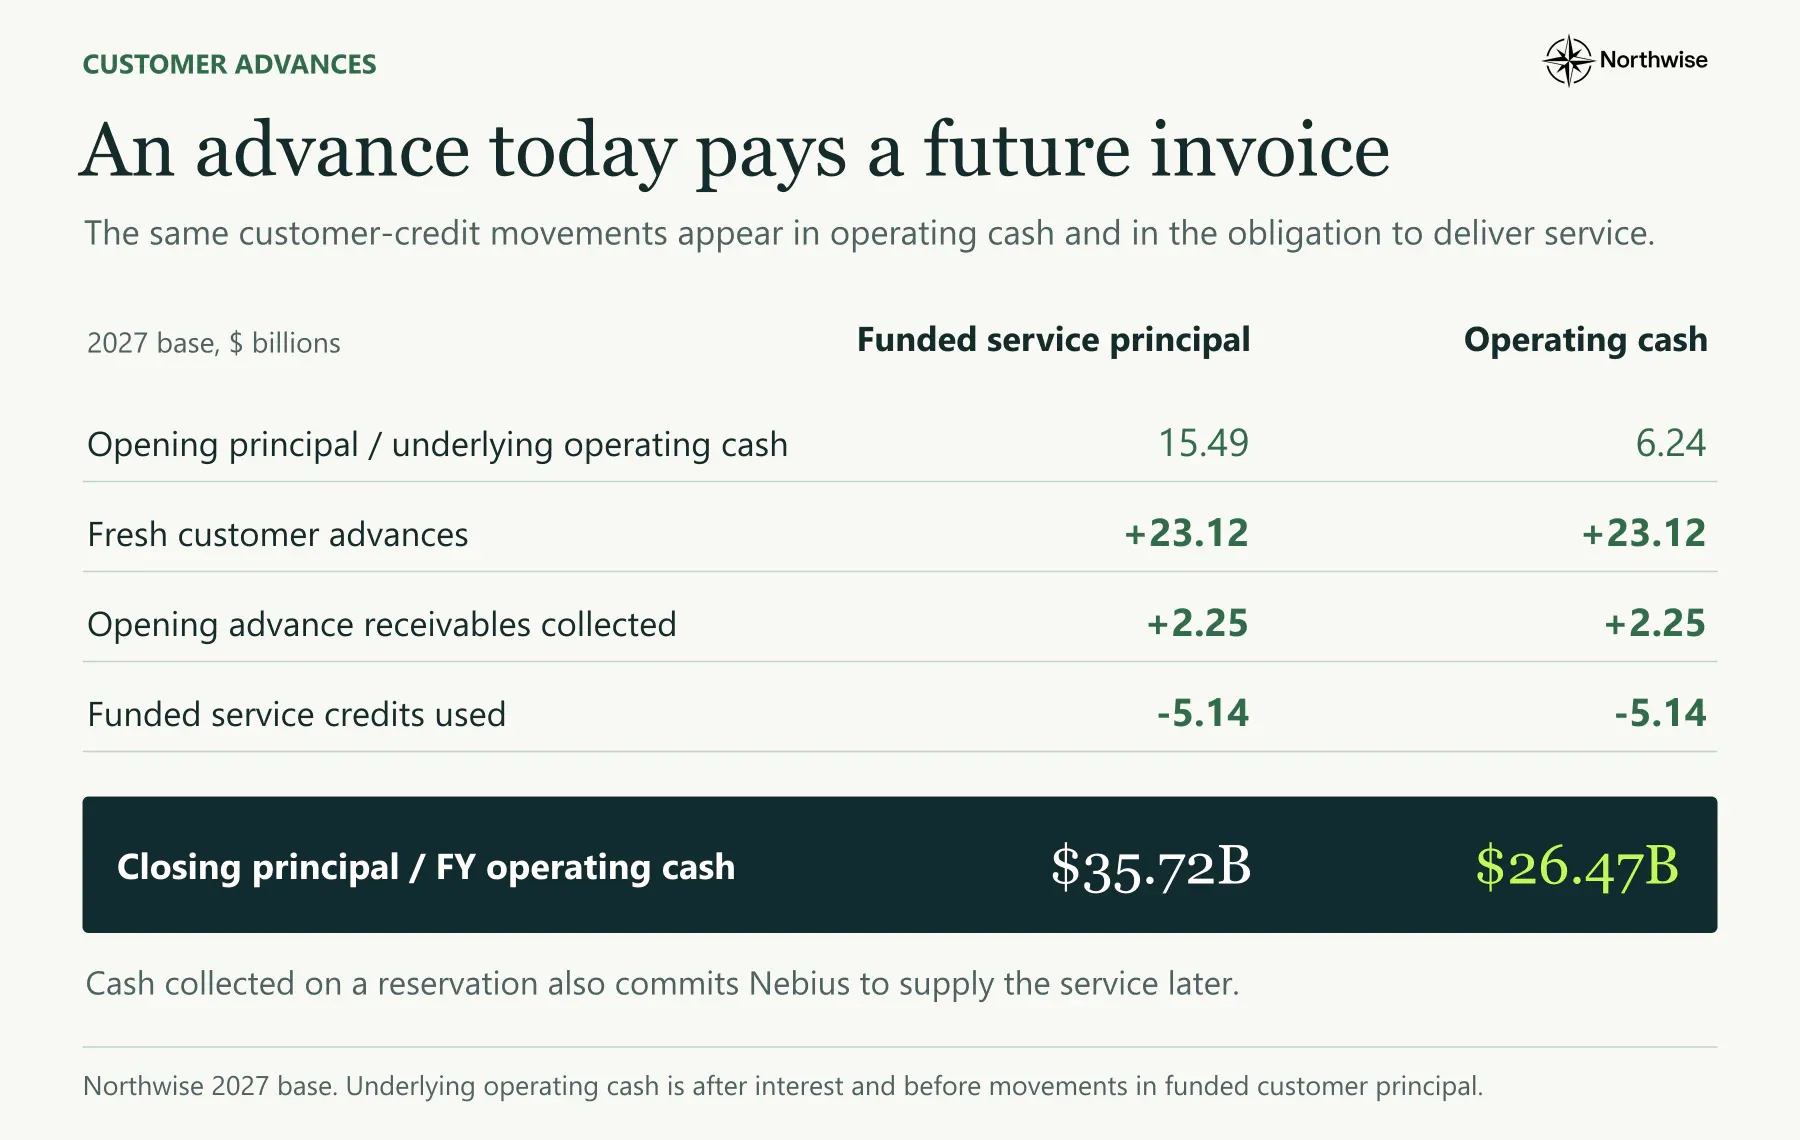
Cash from operations covers half the bill. Underlying operating cash after interest is $6.24B. Fresh customer advances add $23.12B, collections on opening advance receivables add $2.25B, and service delivered against earlier advances subtracts $5.14B. The result is $26.47B of operating cash flow, leaving $26.11B of capex uncovered.
Fresh advance source | Base 2027 |
|---|---|
New reservations starting in 2027 | $14.58B |
Shorter bookings, initial terms | $3.59B |
Reservations starting in 2028 | $3.09B |
New Meta | $1.07B |
Shorter booking renewals | $0.50B |
New landmark | $0.23B |
Shorter bookings starting in 2028 | $0.05B |
Total | $23.12B |
The terms behind those advances are ours. We assume 87% of new reservations participate. Within that group, 75% prepay 110% of eligible capex and the rest prepay 55%, and a six-month short booking advances 62.5% of its service value. Q3 disclosures support the structure, with more than 90% of contract value carrying a prepayment and coverage above 100% of associated capex, though the cohort mix is our estimate.
Customer cash comes with an obligation. Funded customer principal rises from $15.49B to $35.72B by year end, representing service Nebius has been paid for and still owes. None of it is unrestricted cash, and a delayed handover defers revenue and new advances in the same month, which is why the Highridge slip moves cash so much more than sales.
The Debt That Has to Close
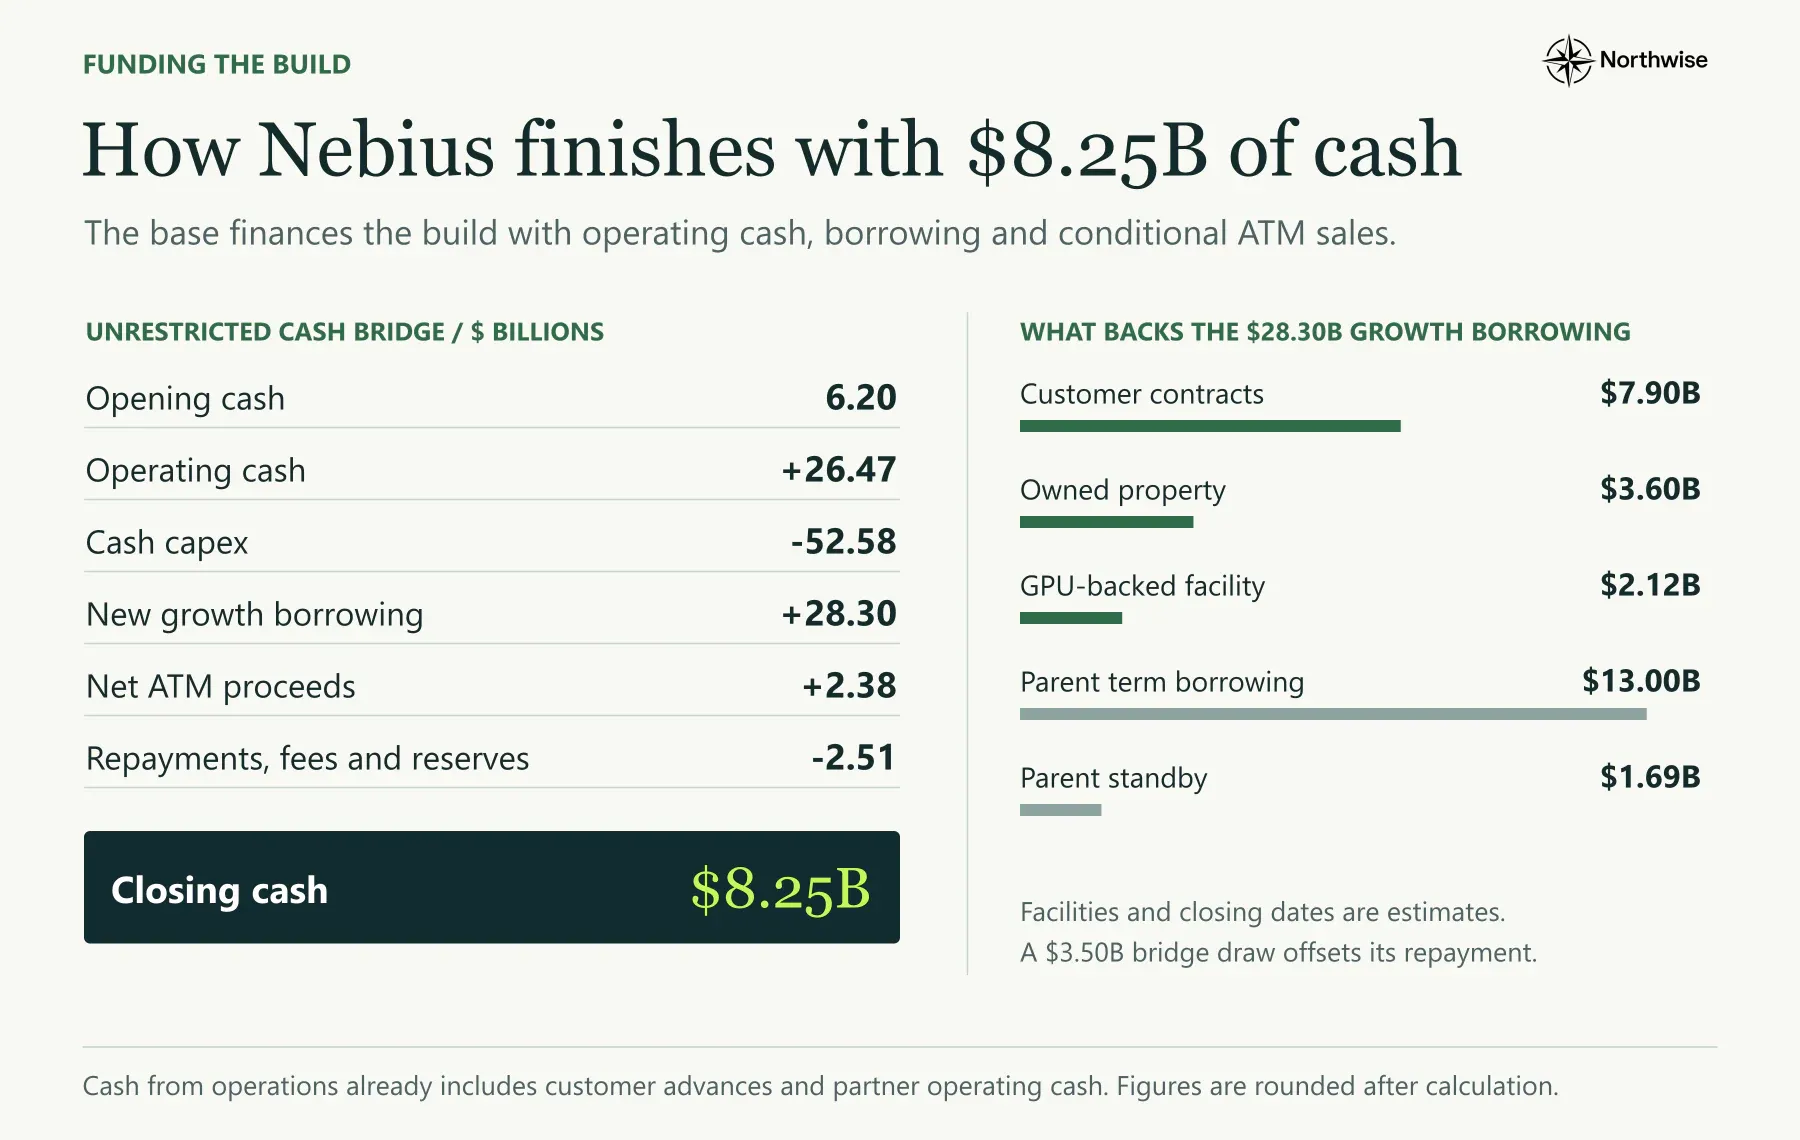
After customer cash, Nebius still needs $28.30B of new growth borrowing in our base, plus a rollover of the existing $3.50B bridge in October.
Gross new debt, base 2027 | $B |
|---|---|
Parent term facility | 13.00 |
Reservation-backed facilities | 4.56 |
Owned infrastructure facility | 3.60 |
Meta contract facility | 2.17 |
Short-GPU warehouse | 2.12 |
Parent standby facility | 1.69 |
Microsoft contract facility | 1.17 |
Growth borrowing | 28.30 |
Bridge rollover | 3.50 |
The project facilities come first. Contract financing tests 72% eligibility for new reservations, 70% hardware loan-to-cost, 1.20 times debt-service coverage and a 7.25% coupon, with the first closes in March for Microsoft and in May for Meta and new reservations. Property borrowing at 7.5% begins in April, and a short-GPU warehouse at 10% begins in May.
Parent borrowing fills the rest. We assume a $13B term facility at 9% and $6B of standby capacity at 10.5%, of which the base draws $1.69B. None of these facilities exists today. Each is a forecast of terms a lender would plausibly offer against the collateral and contracts we model.
Base 2027 | Q1 | Q2 | Q3 | Q4 |
|---|---|---|---|---|
Accepted IT MW, quarter end | 478.6 | 696.1 | 1,063.1 | 1,593.8 |
Cash capex | $7.98B | $12.54B | $15.55B | $16.52B |
Fresh customer advances | $2.63B | $12.59B | $3.93B | $3.98B |
Cash from operations | $5.05B | $12.87B | $4.11B | $4.43B |
Growth borrowing | $3.36B | $5.18B | $5.52B | $14.24B |
Net ATM proceeds | $0.00B | $0.00B | $1.51B | $0.87B |
Ending unrestricted cash | $6.48B | $11.53B | $6.50B | $8.25B |
The funding calendar is as lumpy as the delivery calendar. Advances concentrate in Q2 as new reservations sign and prepay, and half the year's growth borrowing lands in Q4, the same quarter that carries the most delivery risk. The October bridge rollover sits on top of that.
Year-end nonconvertible debt reaches $31.50B, and face debt including the convertibles reaches $44.93B. Cash interest is $1.40B for the year and $2.91B on an annualized basis by December. Our opening cash of $6.197B is an estimate, and $2B more from Q4 2026 payment timing would lower 2027 growth borrowing to $26.07B.
The Share Sales Assume a Recovery
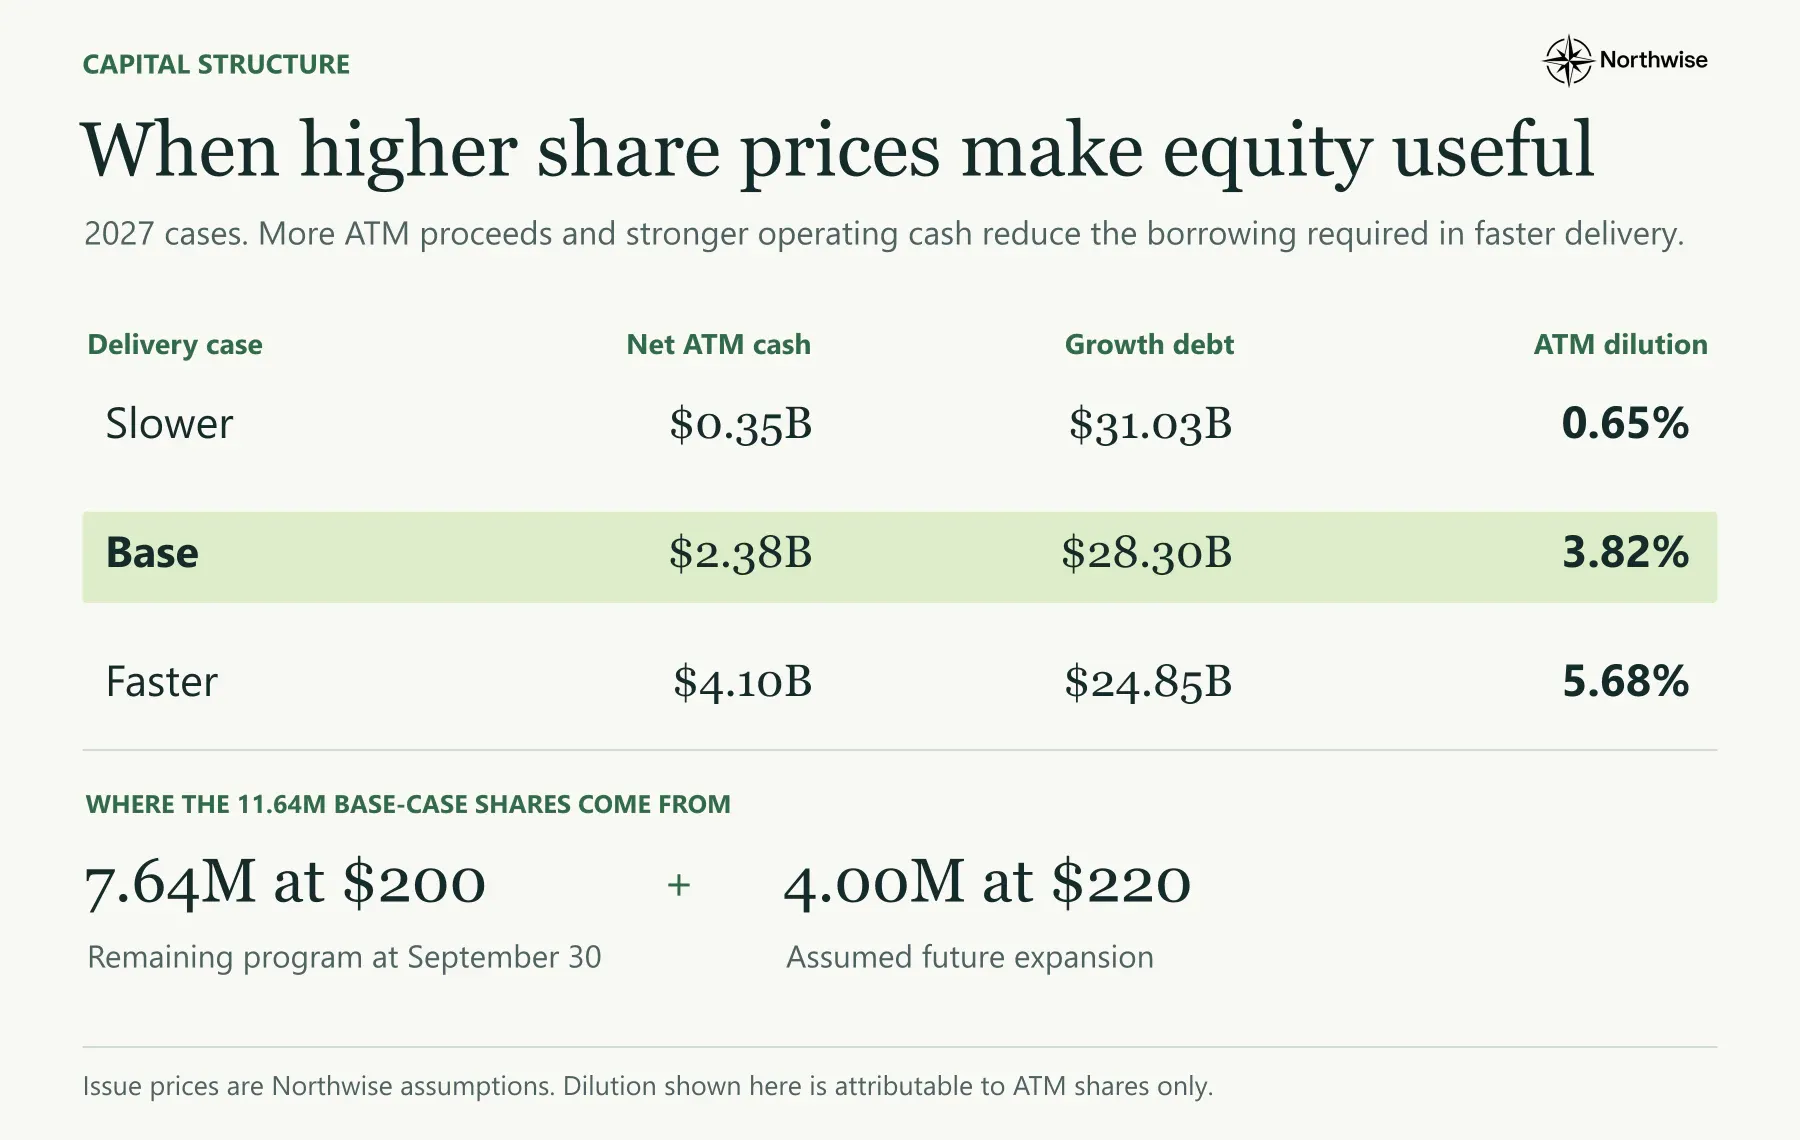
The existing ATM program had 7,636,707 shares remaining at the September filing, after average sale prices of $223.60 in Q2 and $229.14 in Q3. Our base finishes it at about $200 a share between July and September, then sells another 4M shares at $220 under a hypothetical expansion. Net proceeds are $2.38B, and existing holders are diluted 3.82%.
With the stock near $85, those prices assume more than a doubling by mid-2027. Raising the same $2.41B in gross proceeds at $85 would take about 28M shares, roughly 8.8% dilution. The slower case already reflects a weaker price, selling only 1.9M shares at $185 and leaning on the standby facility for $5.62B.
The standby line is the release valve. If the share price stays low, the base plan has more than $4B of undrawn standby capacity, at a cost of 10.5% and 2% fees. Weak equity markets therefore raise interest expense before they force heavy dilution.
What November Changed
Our October forecast expected $21.86B of 2027 revenue on $58.77B of capex, with 1,613 MW accepted at year end. The new base is $16.39B of revenue on $52.58B, with 1,594 MW accepted.
The year-end fleet barely moved, though the path to it shifted by months. October's forecast averaged about 938 billable MW across the year, and the November calendar averages 775.5 paid MW. The two definitions differ slightly, though the direction is clear: the same fleet arrives later and earns for fewer days.
Pricing changed method as well. October applied one ladder to a mixed fleet, and the new base prices each GPU generation through its cluster, on-demand and spot lanes. Hardware purchases now follow delivery dates, the unlocated opening allowance is smaller, and the partner business has a schedule of its own.
The funding stack changed most. October required $12.46B of new equity in 2027. With Q3 prepayment terms now covering more than the associated capex, our base raises $23.12B of fresh customer advances and only $2.38B of net equity through the ATM. Lower revenue and far less dilution now pull the per-share outcome in opposite directions.
Value Outside the Cloud
Nebius owns minority stakes that sit outside the operating forecast. We appraise them separately and count them once.
Holding | Base value |
|---|---|
ClickHouse | $7.11B |
Avride | $1.70B |
Toloka | $0.52B |
TripleTen | $0.10B |
Other | $0.02B |
Future support deduction | -$0.39B |
Net holdings | $9.05B |
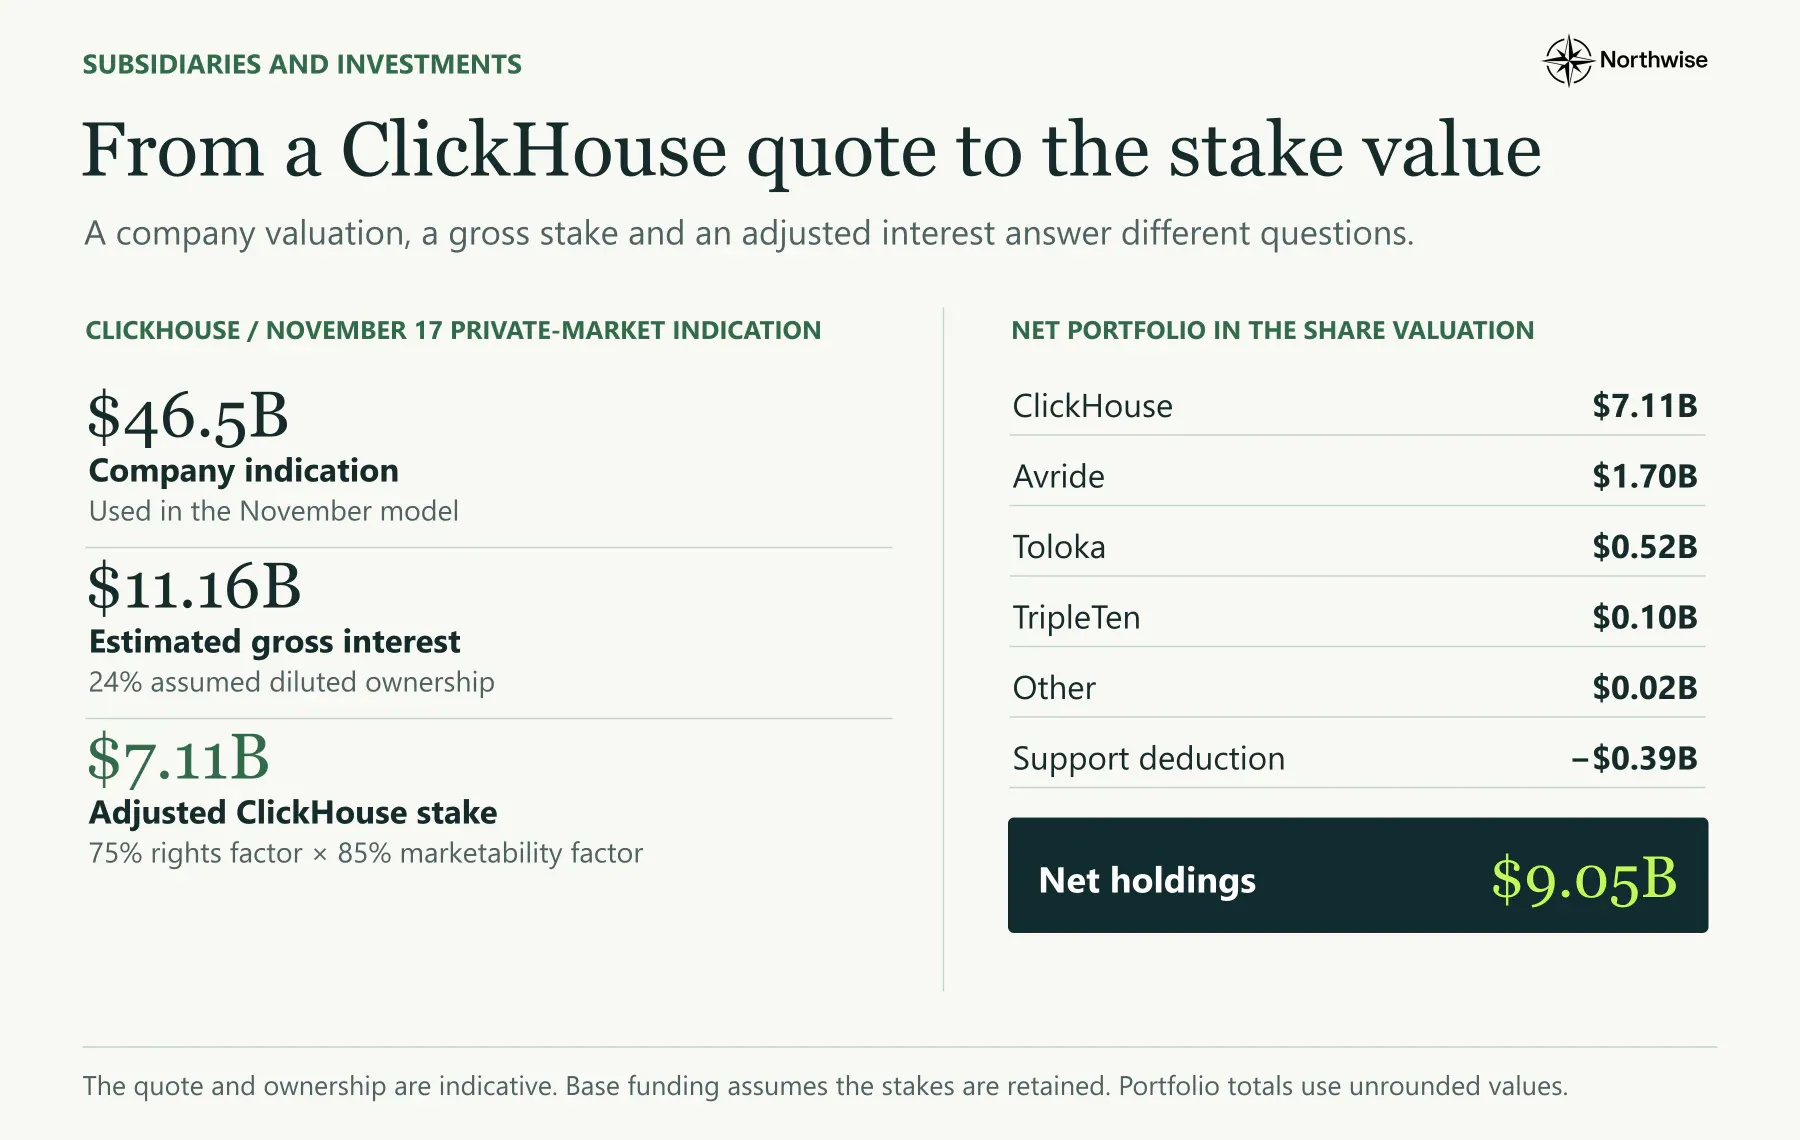
ClickHouse dominates the list. A November 17 private-market indication valued the company at $46.5B, and a November 21 composite stood at $44.9B. Our estimated 24% diluted interest implies $11.16B gross at the higher mark, which we reduce by 25% for security rights and 15% for marketability to reach $7.11B.
The inputs carry real uncertainty. Ownership after later funding rounds is undisclosed, and the executable size of a private quote is unknown. The other holdings carry their October appraisals, and the base assumes no sale or pledge of any stake to fund the build.
Three Cases
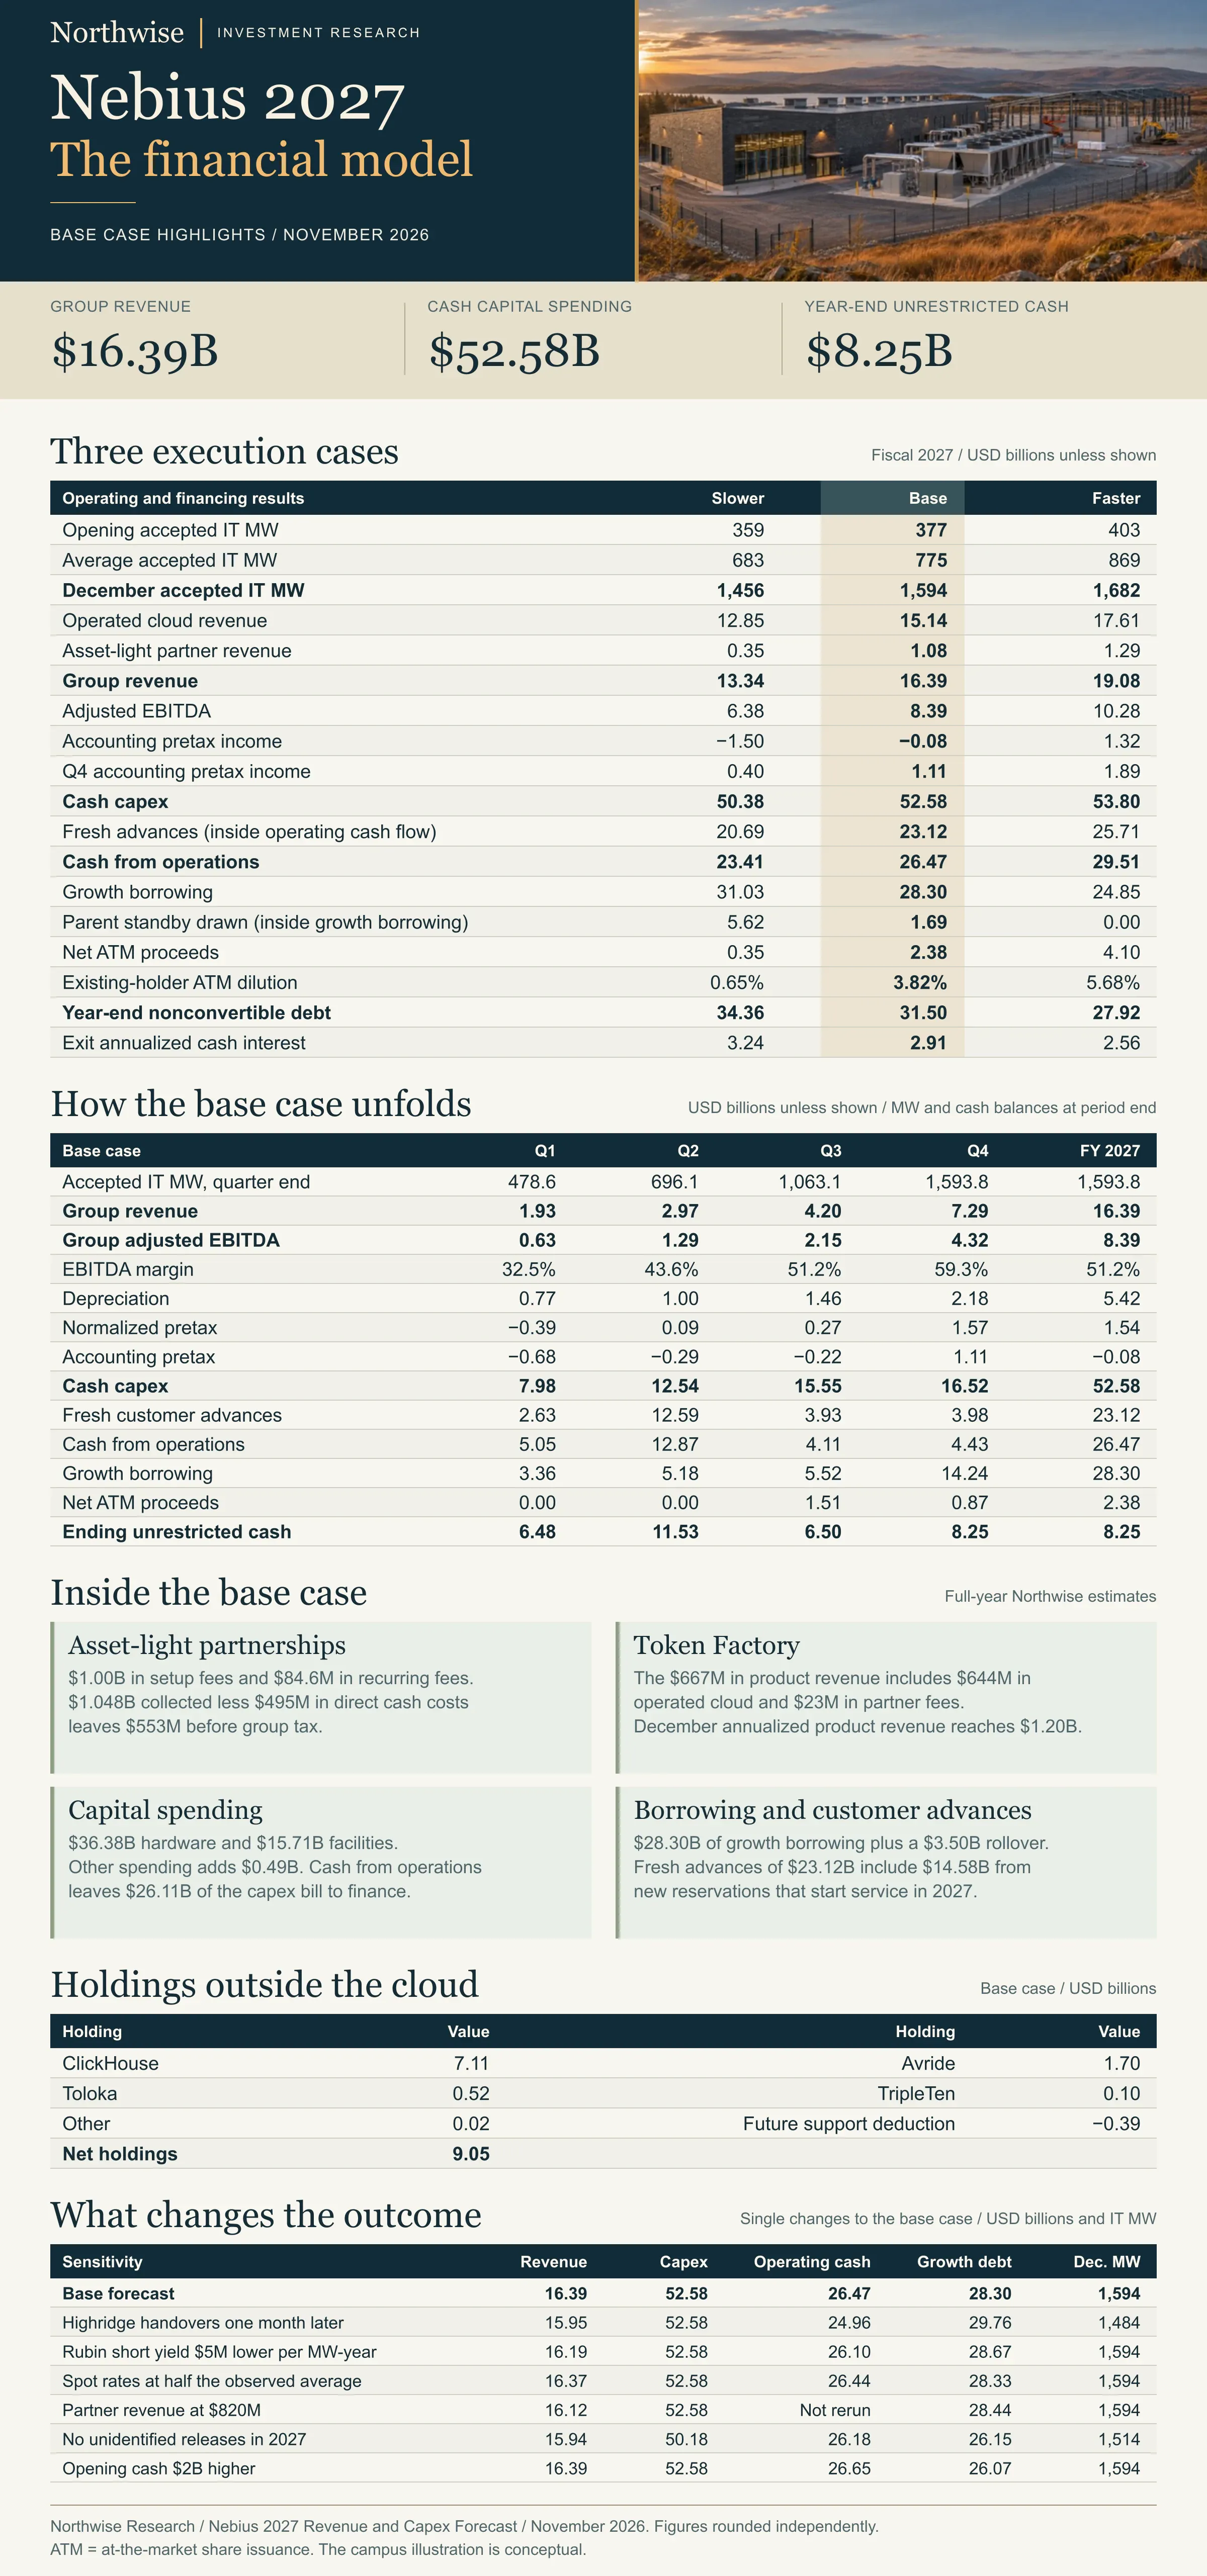
The slower and faster cases are complete schedules, each with its own site calendar, contract mix, advances, borrowing and share sales.
2027 | Slower | Base | Faster |
|---|---|---|---|
Opening accepted IT MW | 359 | 377 | 403 |
Average accepted IT MW | 683 | 775 | 869 |
December accepted IT MW | 1,456 | 1,594 | 1,682 |
Operated cloud revenue | $12.85B | $15.14B | $17.61B |
Partner revenue | $0.35B | $1.08B | $1.29B |
Group revenue | $13.34B | $16.39B | $19.08B |
Adjusted EBITDA | $6.38B | $8.39B | $10.28B |
Accounting pretax | -$1.50B | -$0.08B | $1.32B |
Q4 accounting pretax | $0.40B | $1.11B | $1.89B |
Cash capex | $50.38B | $52.58B | $53.80B |
Fresh customer advances | $20.69B | $23.12B | $25.71B |
Cash from operations | $23.41B | $26.47B | $29.51B |
Growth borrowing | $31.03B | $28.30B | $24.85B |
Parent standby drawn | $5.62B | $1.69B | $0.00B |
Net ATM proceeds | $0.35B | $2.38B | $4.10B |
Existing-holder ATM dilution | 0.65% | 3.82% | 5.68% |
Year-end nonconvertible debt | $34.36B | $31.50B | $27.92B |
Exit annualized cash interest | $3.24B | $2.91B | $2.56B |
The slower case still roughly quadruples the fleet. Its cost sits in the timing: average paid capacity falls 12% below base, Q4 pretax earnings fall to $0.40B, and the standby facility carries $5.62B of the funding at 10.5%.
The faster case shows the opposite effect. Capex rises only $1.22B above base, operating cash rises $3.04B, borrowing falls $3.45B and Q4 pretax earnings reach $1.89B. Earlier delivery pays for much of itself.
Stress Tests
Each test below changes a single input and reruns the full monthly schedule.
Change to base | Group revenue | Cash capex | Cash from operations | Growth borrowing | Dec accepted MW |
|---|---|---|---|---|---|
Base | $16.39B | $52.58B | $26.47B | $28.30B | 1,594 |
Highridge acceptance one month later | $15.95B | $52.58B | $24.96B | $29.76B | 1,484 |
Rubin short yield $5M lower per MW-year | $16.19B | $52.58B | $26.10B | $28.67B | 1,594 |
Spot prices at half the observed average | $16.37B | $52.58B | $26.44B | $28.33B | 1,594 |
Partner revenue at $820M fallback | $16.12B | $52.58B | Not rerun | $28.44B | 1,594 |
No unidentified releases in 2027 | $15.94B | $50.18B | $26.18B | $26.15B | 1,514 |
Opening cash $2B higher | $16.39B | $52.58B | $26.65B | $26.07B | 1,594 |
Timing moves cash more than pricing does. The Highridge slip costs $1.50B of operating cash and adds $1.46B of borrowing with no change in spending. A lower Rubin price costs $193M of revenue and $0.37B of operating cash, as prepayments on the affected contracts shrink in proportion.
Removing unlocated capacity improves the funding position, saving $2.40B of capex for $442M of lost revenue. Capacity bought at full cost during 2027 earns for only part of the year, so 2027 cash flow carries its full price and 2028 collects most of its revenue.
What We Are Watching
Four observations will tell us more about December 2027 than any new contracted-power headline. February's reported revenue and its composition come first, followed by Microsoft accepting the rest of Vineland on the Q2 schedule.
By autumn, Highridge energization and tenant testing become the dominant variables, alongside Independence and Birmingham handovers. On pricing, the first disclosed Rubin cluster terms and the cash received on new reservations will test our two most important commercial assumptions.
The funding calendar runs in parallel. The first contract facilities close in our base in March, April and May, and the parent term facility carries the largest single share of borrowing. Any of those arriving late, smaller or more expensive would move the year more than a quarter's worth of pricing.
Smaller signposts can still move our numbers. Naming the Indian hosts, metering power in Alberta and confirming any unlocated capacity would each replace an assumption with evidence.
Where We Stand
The selloff priced Nebius as a company with a demand problem and a balance sheet problem. The November evidence shows neither. Prices per megawatt rose, customers began paying more than the cost of the equipment before delivery, and the company entered the build with a fraction of its closest peer's borrowing.
The same evidence moved the fleet later. Revenue for 2027 falls from our October estimate, earnings arrive almost entirely in the fourth quarter, and half of the year's borrowing lands in that same quarter.
Customer prepayments have changed the shape of the funding problem. They replace most of the equity we expected Nebius to sell in October, and they leave the outcome dependent on lenders closing facilities that do not yet exist. Our view is that the operating evidence supports the build, and that sentiment has turned a timing and financing question into a solvency story the facts do not support.
The conditions are specific and observable. Vineland needs to finish in Q2, the first contract facilities need to close in the spring, and Highridge needs power in October. If those three hold, 2027 should look very different from the year the market is currently pricing.
From Forecast to Price
Everything above is the forecast: where the megawatts come from, what each one earns, what the fleet costs and who pays for it. A forecast still leaves the question every shareholder ends up asking, which is what that December 2027 business is worth today, at a share price near $85.
Turning the model into a price requires choices the operating schedule cannot make on its own: which period of earnings to capitalize, what multiple a capital-intensive cloud can support, how eight convertible issues settle and how much weight each case carries. Those choices are where published targets on Nebius diverge most, and they are where our own numbers moved most since October.
The premium section sets out our December 2027 value for each case under both valuation lenses, the probability weights behind our target, the expected return from today's price, entry zones under the Northwise rating framework, a required-return ladder, a multiple grid and the per-share effect of every stress above. Members also receive the full workbook behind these tables.
Membership funds the site-by-site register and monthly model built for this forecast. Nebius remains the company we follow most closely, and the premium section is where that work reaches a price.
Northwise Premium
Choose how to continue with Northwise
Join Northwise Premium
Unlock the rest of this report, its complete valuation, the downloadable model, portfolios, and action framework.
Join Northwise PremiumCreate a Free Account
Continue across Free Northwise research, follow companies, save reports, and receive updates.
Create a Free Account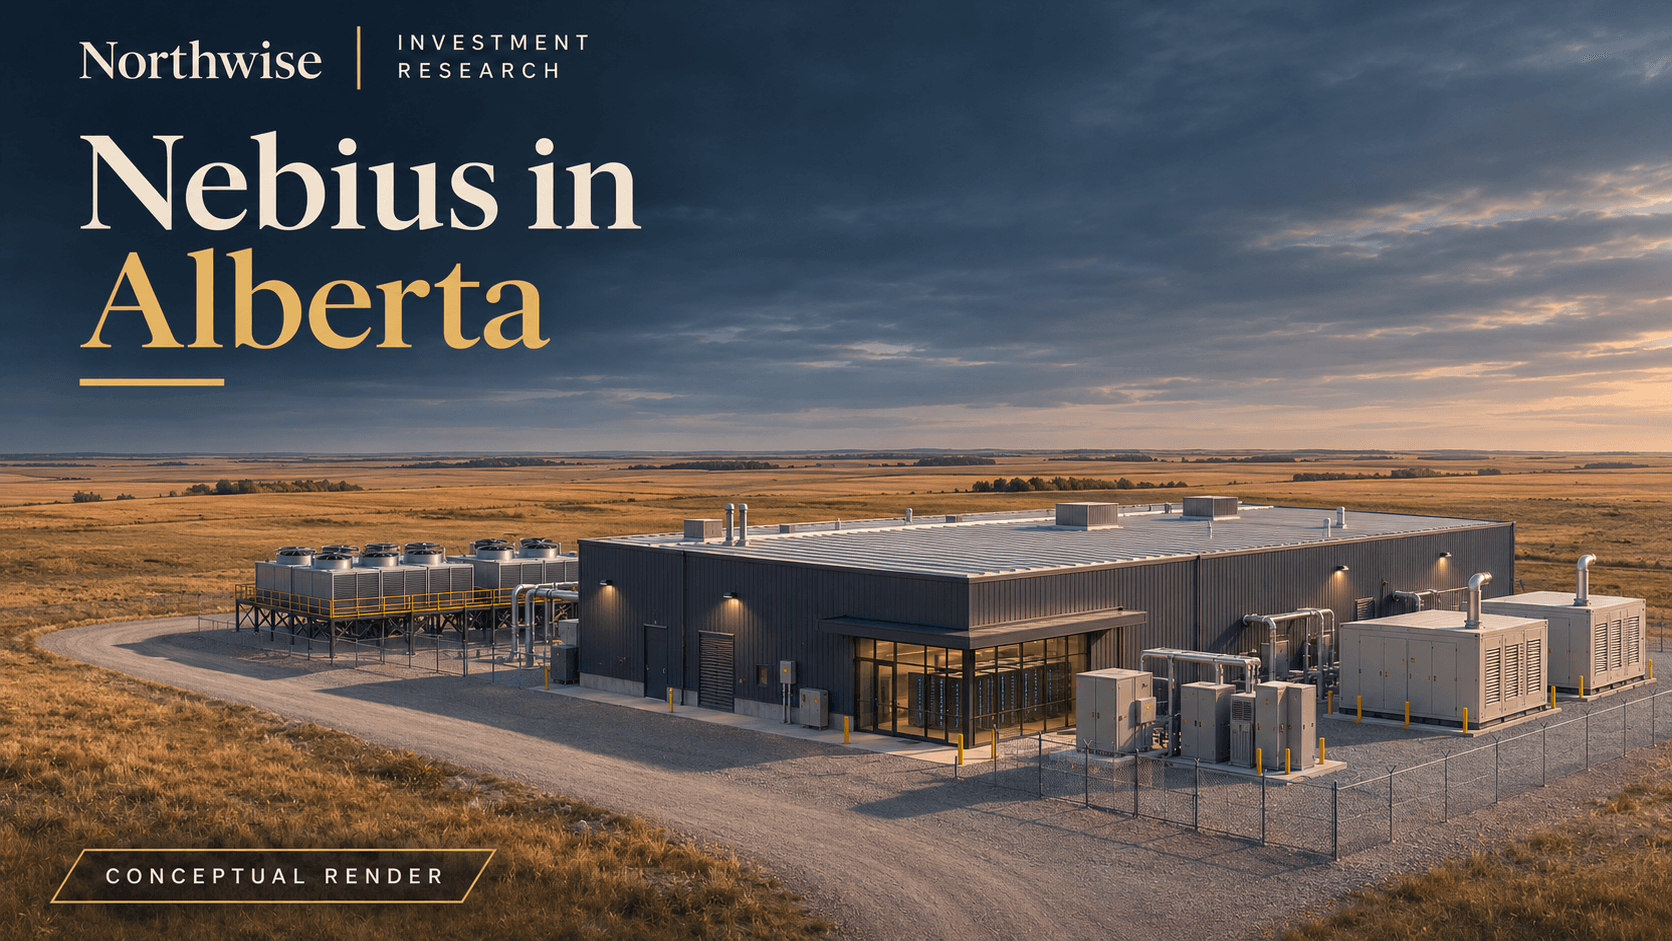
Nebius Alberta Data Center
Nebius plans 100 MW across Alberta campuses. Follow the path to first delivery in 2027 through Alberta power, permits, and the Brooks-area filings.

Beyond Neocloud: A New Map of AI Infrastructure
Northwise proposes nine AI infrastructure categories, comparing Nebius, CoreWeave, IREN, GPU renters and hosts by software, financing and commoditization risk.

NBIS CLT1 South Carolina Data Center
Inside Nebius CLT1 in Moore, South Carolina: site history, 50 MW IT contract, power, proposed layout, moratorium risks, funding and delivery schedule.
Northwise Portfolios
See how the research becomes real decisions
Reader discussion
Discuss the research
Premium access is required to join this report's discussion.
Join Northwise Premium
No comments yet. Start a thoughtful discussion.