
NBIS Stock Forecast 2027: The Price of Scarce Compute

NBIS stock forecast 2027: examine Nebius capacity, Rubin pricing, cash flow and financing, with Premium valuation scenarios and an editable model.
In this article
Nebius enters 2027 with more demand than it can serve. We follow every megawatt from the power connection to the paid invoice, then ask how much of that growth survives the financing bill.
The 100 Megawatt Decision
Consider a simple, hypothetical choice. Nebius has another 100 MW of capacity ready to sell. One customer wants it for five years and will help pay for the equipment before service begins. Another wants it for six months and will pay far more for access today.
The second offer produces more revenue. The first helps make the entire expansion possible. Almost every number in our 2027 forecast traces back to how Nebius answers that question across roughly 1 GW of new hardware.
Our NBIS 2030 forecast laid out the long arc of the AI factory thesis. Here we narrow the lens to a single year, the year the largest hardware generation Nebius has ever deployed arrives, and follow it quarter by quarter through sites, power, equipment, contracts, cash and shares.
The result is a forecast that sits far above published expectations. Our Base case produces $21.86B of 2027 revenue and $12.49B of EBITDA, a 57% margin. Nebius exits the year with 1,613 MW of accepted IT capacity and a platform run rate of $44.2B.
Building that fleet costs $58.8B in cash capex. Operating cash flow covers $21.6B of it, and that figure already includes $11.4B of net customer prepayments. The remaining $37.2B has to come from lenders and shareholders: $32.6B of new secured debt and $12.5B of new equity in the Base case, after refinancing and fees.
Three quantities run through everything that follows, and they are easy to blur together. Revenue earned during 2027 is one. December revenue multiplied by 12 is another. The cash required to build the next cohort of capacity is the third, and it arrives before the other two.
The Debate Around the Stock
Nebius reached late October roughly 50% below its all-time high as the stock corrected and investors debated how neocloud providers would finance their expansion. At the October 23 regular-session close of $158.74, NBIS stood 47.1% below its June 22 intraday high of $299.86. The scale of that correction is central to the setup: the market has already repriced the shares sharply, while the operating buildout and financing bill still lie ahead. The tension around the name is easy to describe and hard to resolve.
One camp sees a company that cannot build fast enough. Customers are lining up, auction prices per megawatt are rising, a dedicated Meta contract anchors the Rubin ramp, and NVIDIA is both a supplier and a shareholder. In that view, every accepted megawatt is already spoken for and the only question is how quickly it arrives.
The other camp sees a balance sheet being asked to carry a buildout several times larger than the company's current revenue. Capacity announcements are not revenue. Debt markets can close. Equity raised at the wrong price transfers the upside from today's shareholders to tomorrow's.
We think both camps are describing the same business accurately. The bull camp is right about demand and pricing, and the bear camp is right that the funding bill is enormous. Our work suggests the market is underestimating how much capacity Nebius can turn on in 2027, and that the equity outcome depends less on demand than on commissioning dates and the cost of capital.
Sources: NBIS historical high and daily prices; October 23 regular-session close.
Where We Part Ways With the Street
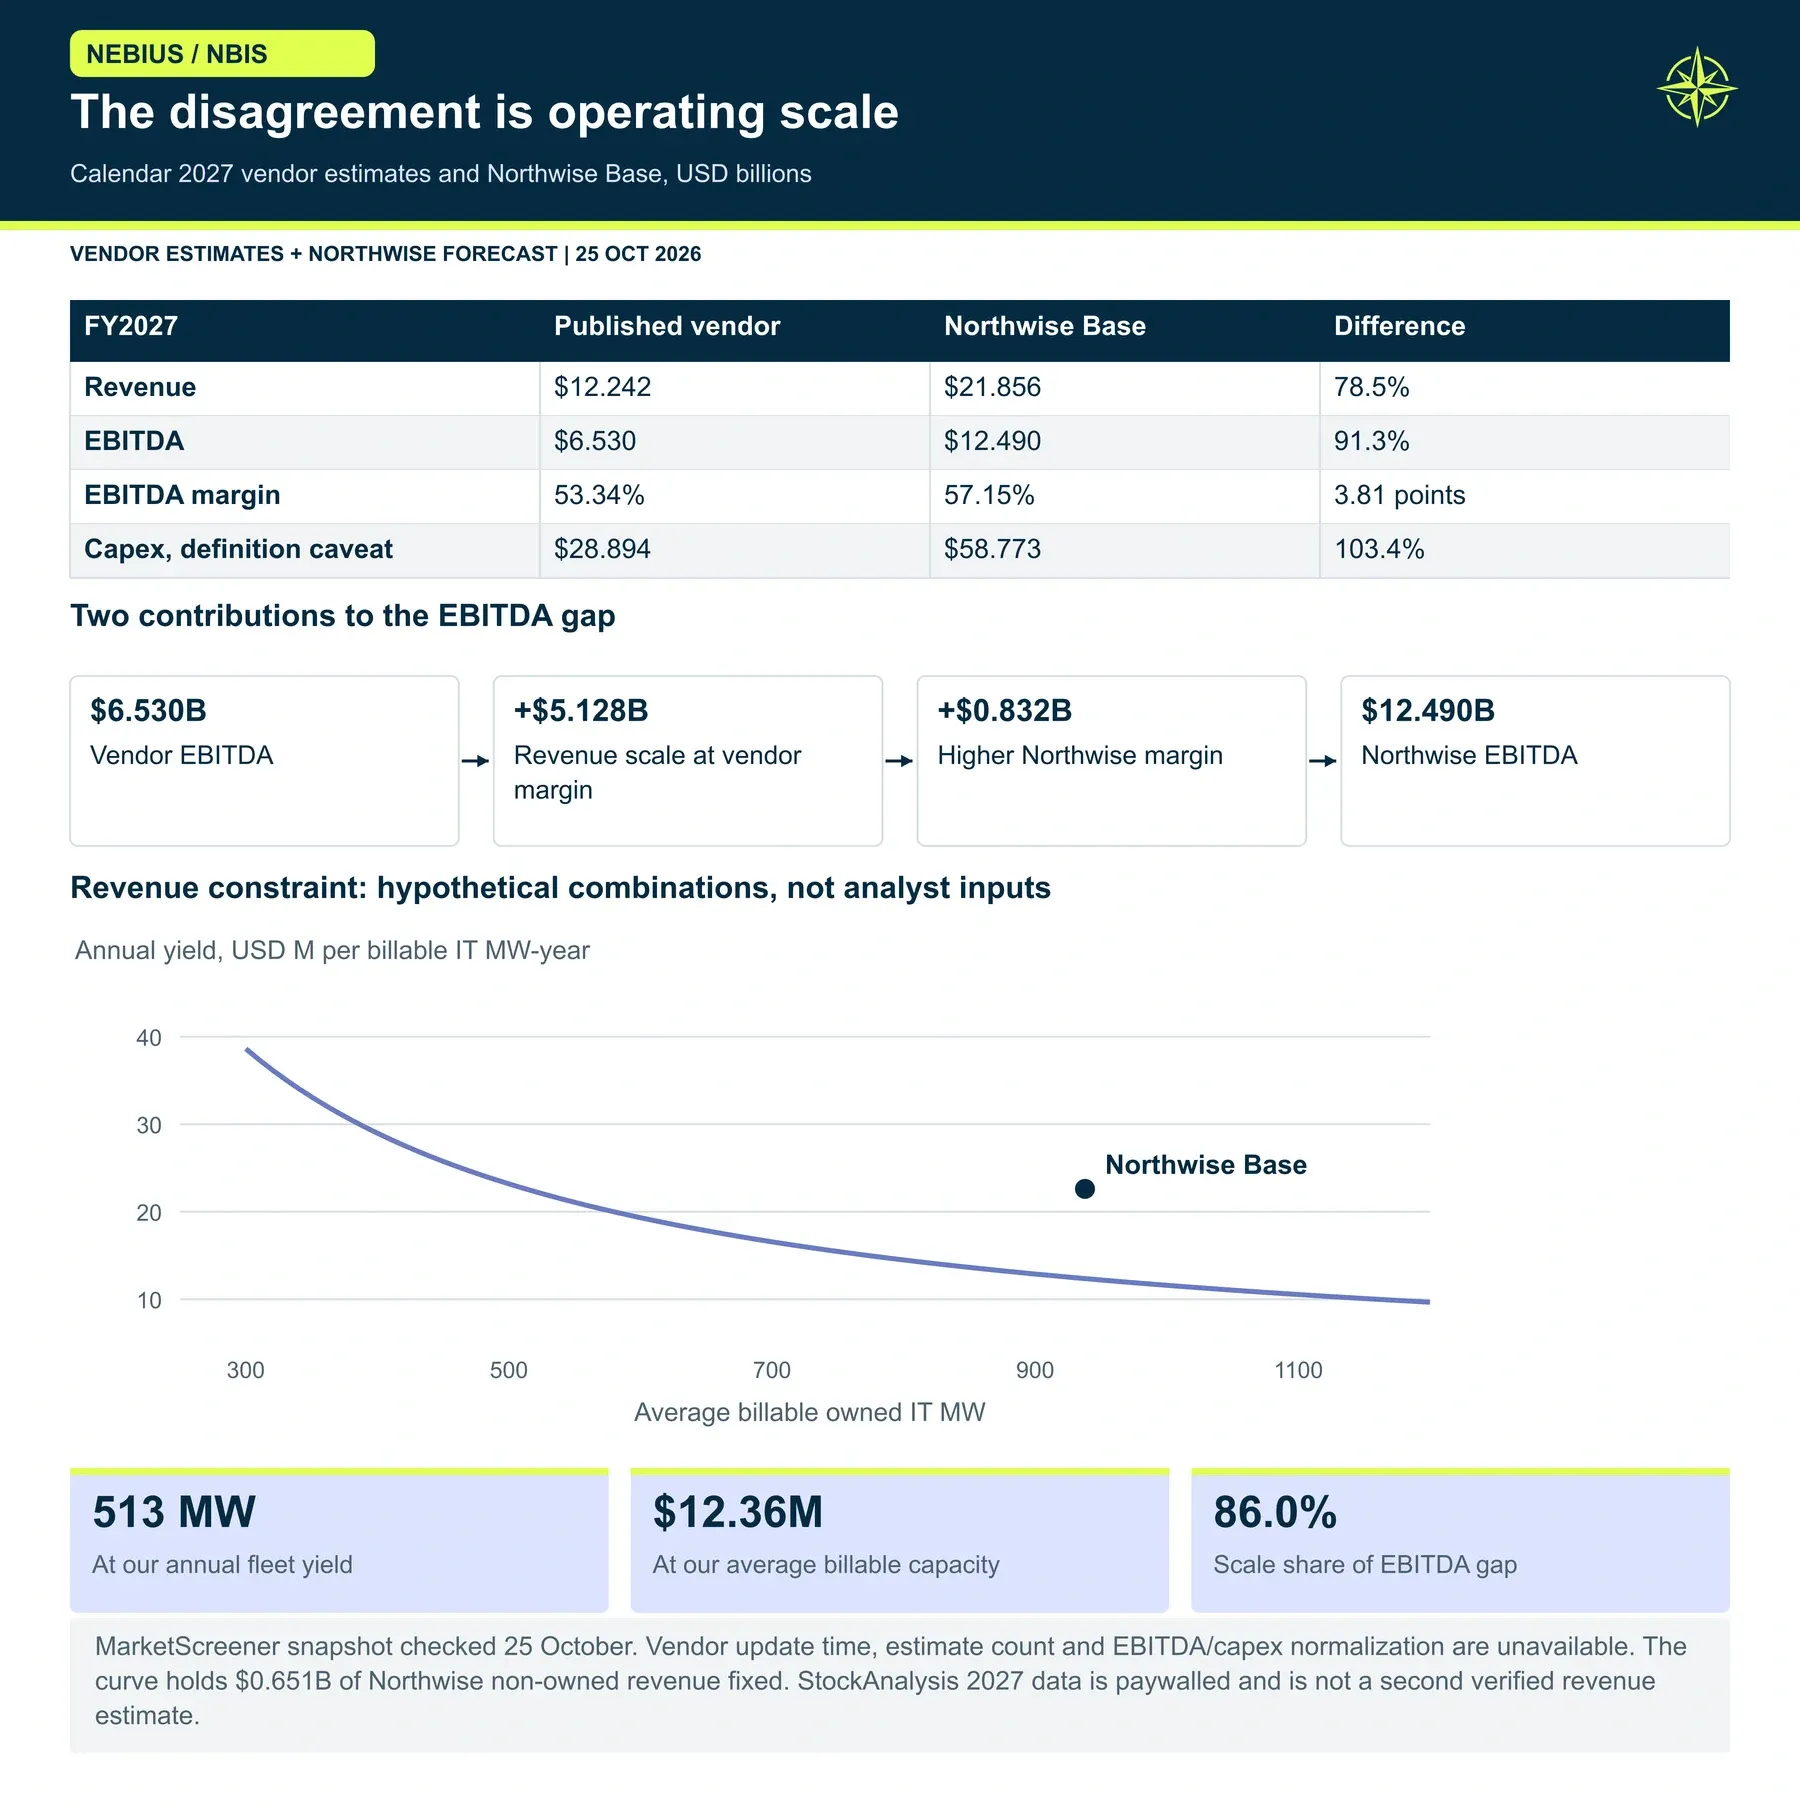
Published estimates are useful only when the periods and definitions line up. The table below compares our Base case with calendar 2027 estimates displayed by MarketScreener and checked on October 25. Its precise estimate update time and contributing analyst count were not available in the retrieved snapshot. StockAnalysis verifies our reference closing price, but its 2027 estimate is behind a Pro subscription and does not provide a second publicly verified comparison here.
2027 metric | Street | Northwise Base | Difference |
|---|---|---|---|
Revenue | $12.24B | $21.86B | +78.5% |
EBITDA | $6.53B | $12.49B | +91.3% |
EBITDA margin | 53.3% | 57.1% | +3.8 pts |
Capital expenditure | $28.89B | $58.77B | +103.4% |
Two caveats apply. EBITDA adjustment sets are not fully specified in public aggregations, and the Street capex figure may be measured on an additions basis where ours is cash paid. Neither caveat closes a gap of this size.
The margin difference is smaller than it first appears. Applying the Street's own 53.3% margin to our revenue explains $5.13B of the $5.96B EBITDA gap. Our higher margin accounts for only $0.83B. The disagreement is about scale.
A simple constraint test makes the point concrete. To land on $12.24B of revenue, Nebius would need about 513 average billable MW at our blended fleet yield of $22.6M per MW. Alternatively, it would need to earn only $12.4M per MW across the 938 average billable MW we model, which is below every contract category in our ledger, including the five-year Microsoft deal.
The Street's capex figure tells a consistent story. At our system cost of roughly $32M per IT MW, 1 GW of Rubin implies about $32B of equipment on its own, before Blackwell additions, construction or deposits. A $29B capex year is internally coherent with a smaller 2027 fleet. We are forecasting a larger one.
We do not compare our December run rate with full-year Street revenue, and we did not locate a reliable aggregated 2027 exit run-rate estimate to compare against. The comparison that matters is full-year revenue to full-year revenue, and on that basis the gap comes from how many megawatts are earning money during the year.
Sources: MarketScreener financial estimates; StockAnalysis price reference.
What a Megawatt Actually Measures
A megawatt is the unit everyone uses for AI infrastructure, and it measures at least six different things. Confusing them is the fastest way to overstate revenue.
Facility power is what the utility delivers to a site, including cooling and other overhead. Critical IT power is what remains for the computing equipment, after dividing by the facility-to-IT ratio, usually somewhere between 1.15 and 1.30 in our register.
Installed capacity is the equipment physically in place. Accepted capacity has passed service readiness or customer acceptance. Allocated capacity has been assigned to a customer or commercial category. Billable capacity is what is actually generating paid service after coverage adjustments.
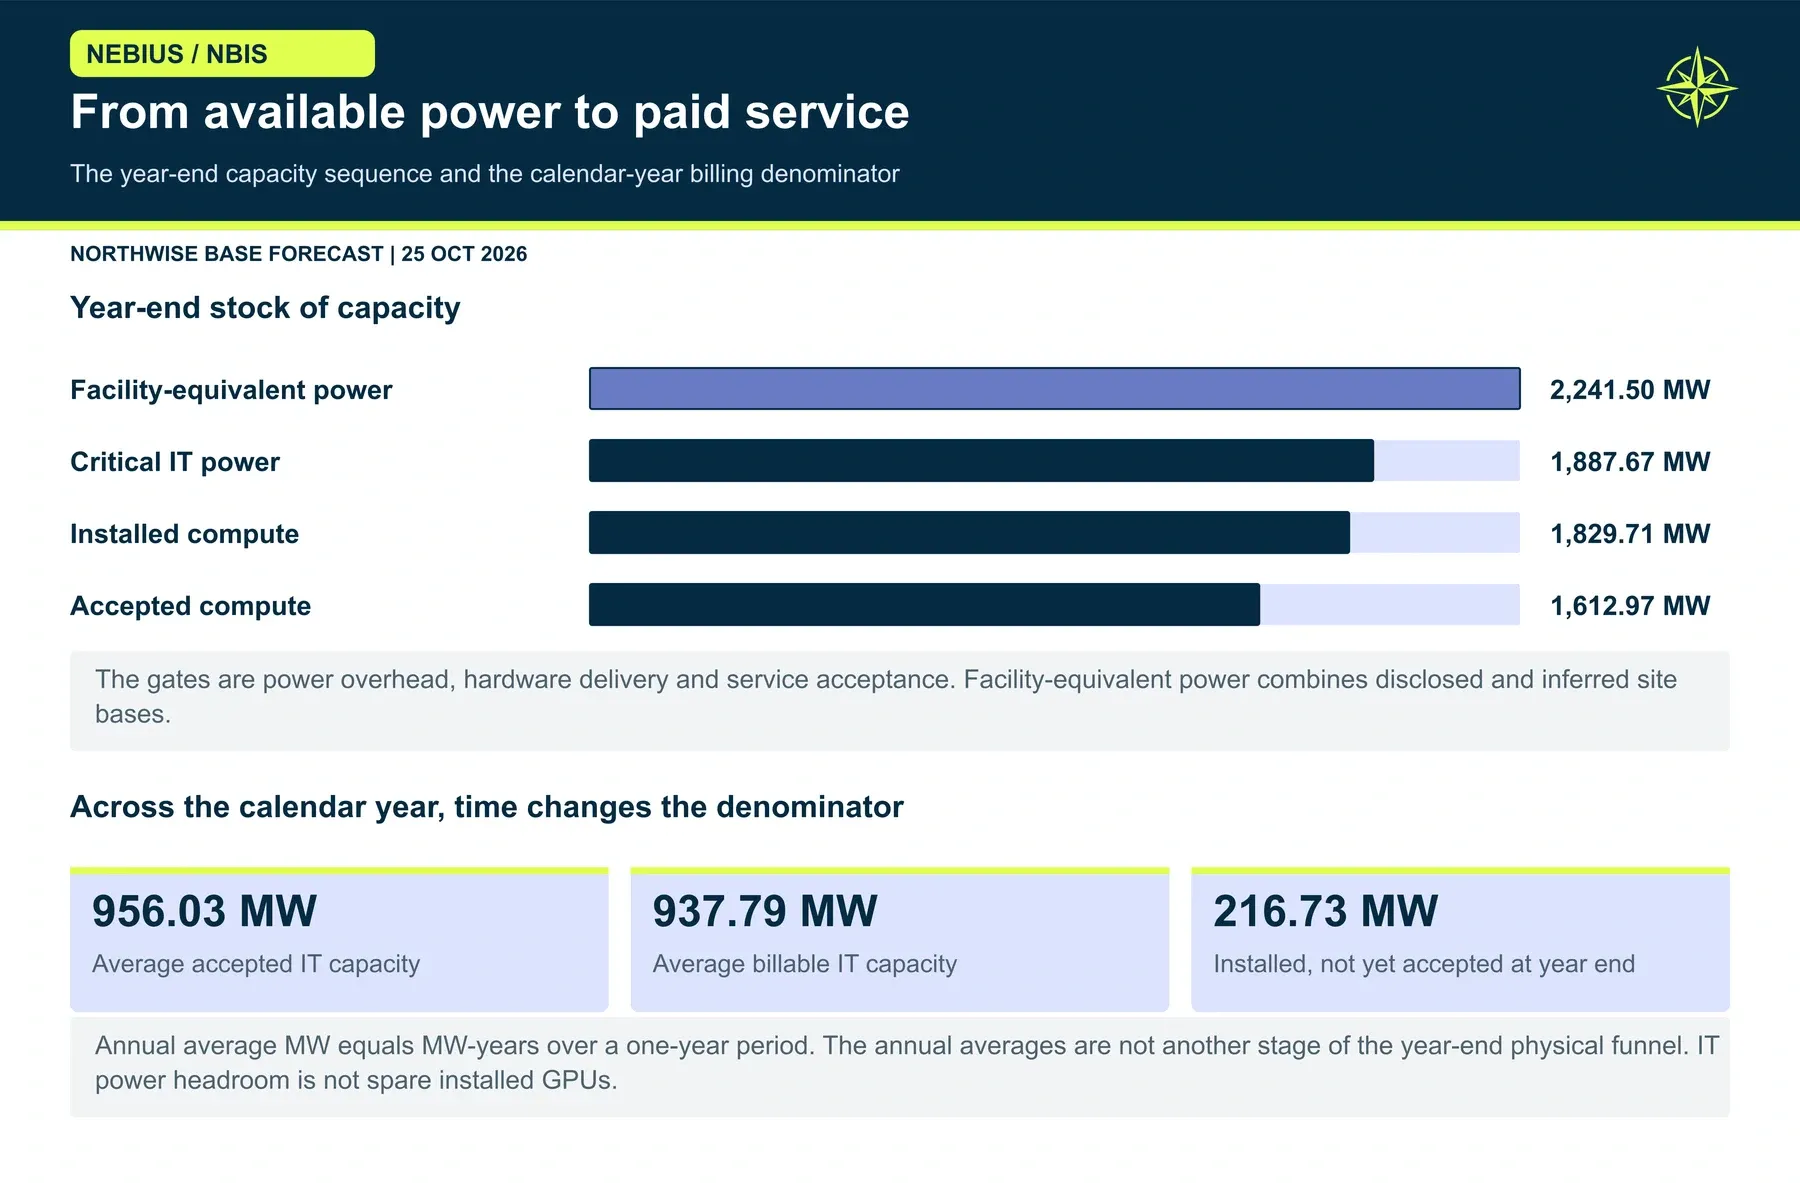
Following the Base case through each stage at year end shows how much shrinkage happens along the way. The site register reaches 2,241.5 facility-equivalent MW, which converts to 1,887.7 MW of critical IT power. Installed equipment totals 1,829.7 MW, of which 1,613.0 MW is accepted. Across the full year, average billable capacity is only 937.8 MW.
Andrey Korolenko of Nebius put the constraint directly in AIB Data Centers' announcement of their southeastern US lease: "Time-to-power is the binding constraint on AI infrastructure today." Our schedule takes that seriously. Power arrives first, equipment second, acceptance third, and revenue only once all three line up.
A megawatt also measures power, not energy. One MW available for a full year is one MW-year; 100 MW available for six months is 50 MW-years. Revenue in our model is built from MW-years, which is why timing carries so much weight.
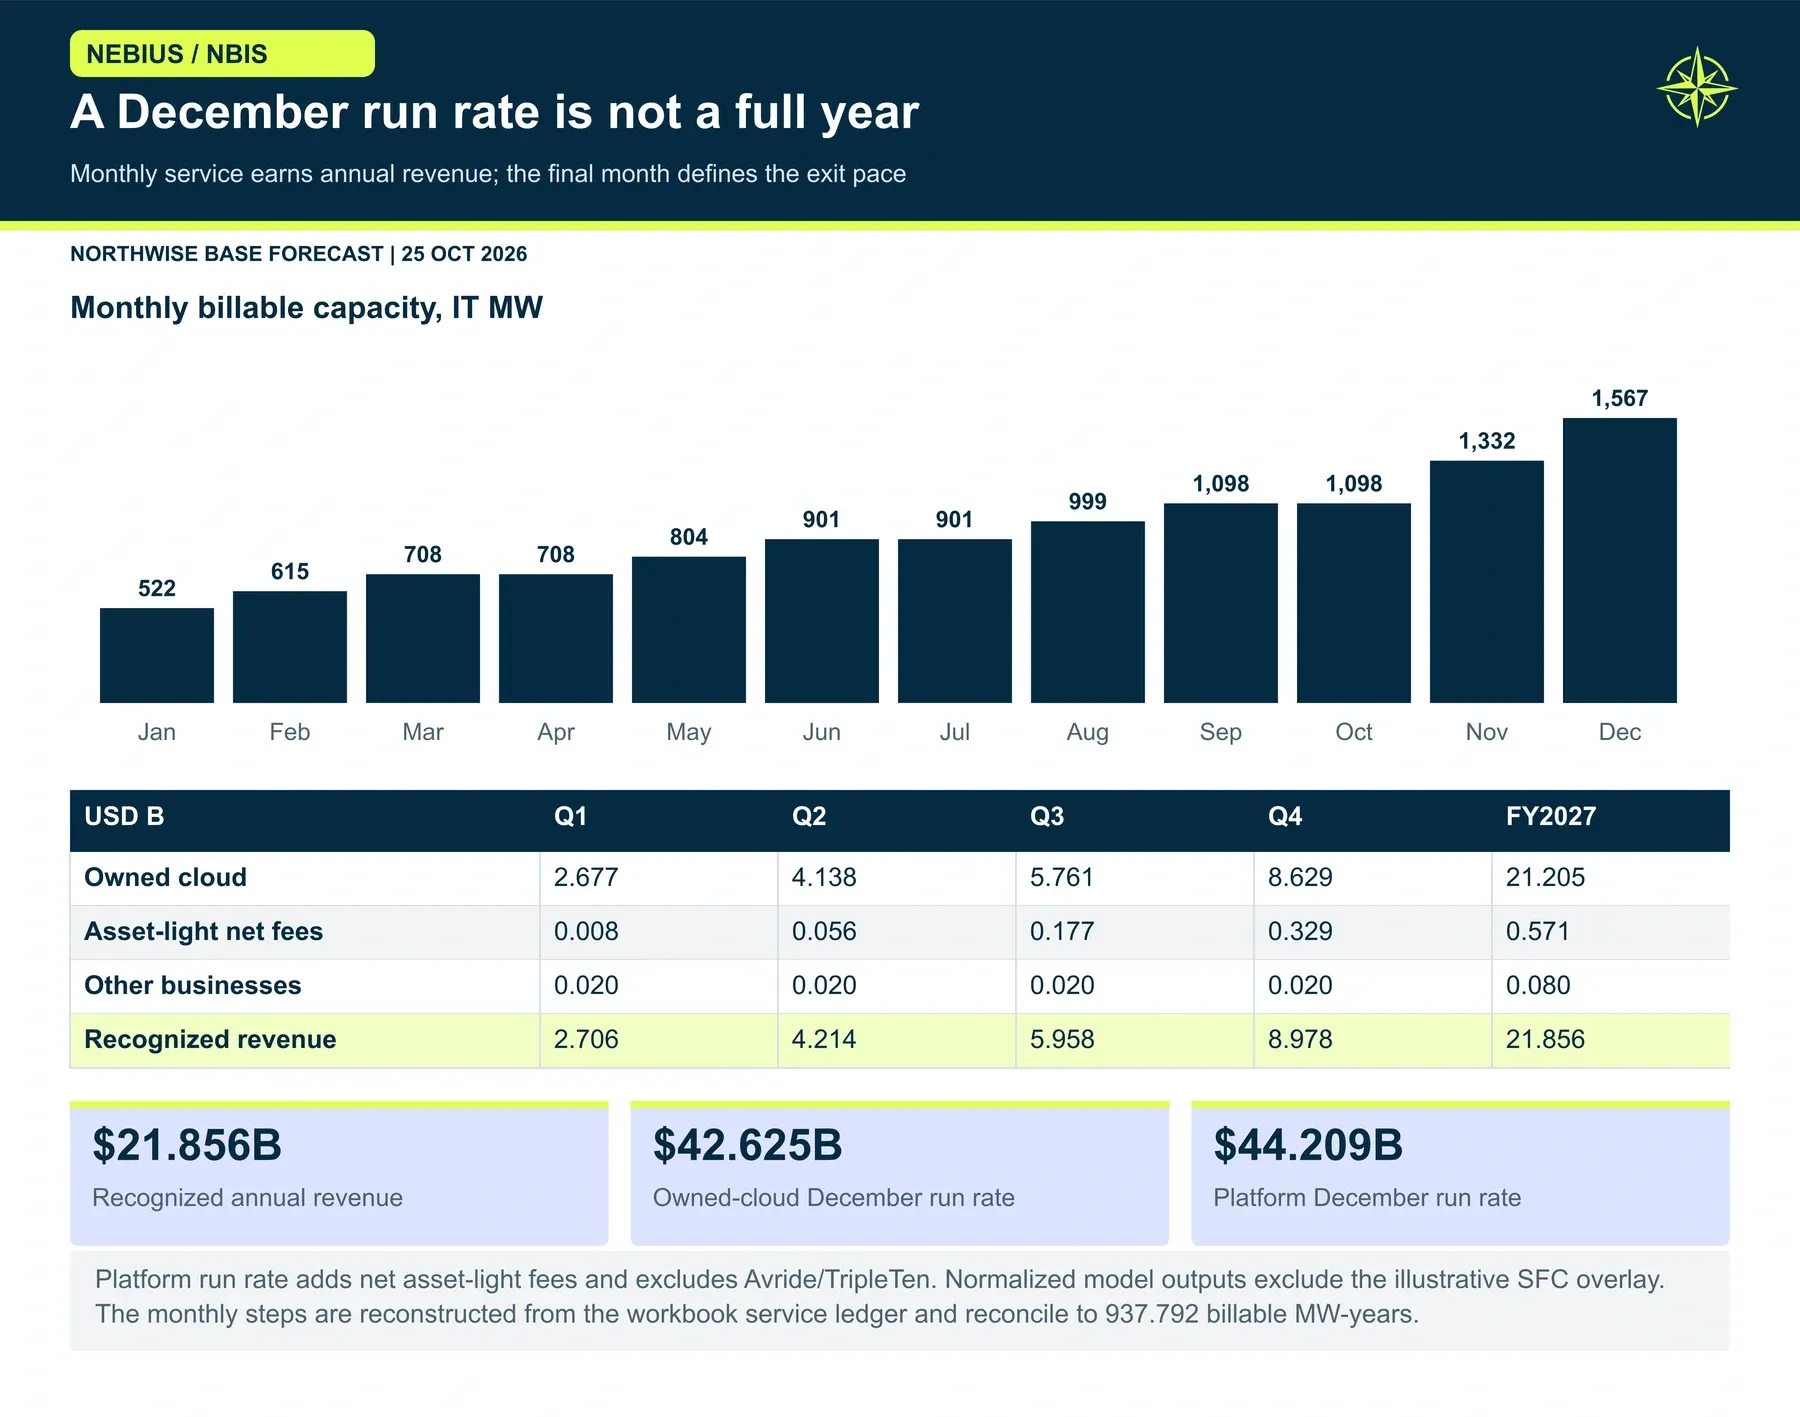
Nebius defines ARR as final-month revenue multiplied by 12. Our owned-cloud December ARR is $42.6B in the Base case. The broader platform run rate of $44.2B adds the net revenue Nebius earns on partner-owned infrastructure. Neither is 2027 revenue.
Sources: AIB lease announcement.
Demand Is Not the Constraint
Picture a company launching an AI product next quarter. Its engineers need several thousand GPUs now, not after a two-year procurement cycle. For that customer, the lowest nominal price per GPU-hour matters less than the date the cluster goes live.
Nebius leadership spent much of NVIDIA GTC Berlin on October 22 describing customers in exactly that position. "Customers, meaning demand, is definitely not the constraint," CEO Arkady Volozh said during the company's live session. The same day, Jensen Huang told CNBC that "the demand for the neo clouds is off the charts."
Chief revenue officer Marc Boroditsky had gone further the day before, telling CNBC that demand could exhaust Nebius's 2027 capacity and possibly extend into 2028. The company's Q2 shareholder letter supplies the numbers behind the tone: landmark deals priced at $20M to $25M of annual revenue per MW, selected short-duration opportunities at $40M to $50M, and prepayments covering 50% to 60% of associated capex on 70% of deals.
The sources of that demand are broad. Frontier model training, inference, coding assistants, enterprise deployments, sovereign AI through the Palantir partnership announced in September, agents and physical AI all appear in the company's recent customer and product announcements. We use those examples to understand the mechanisms. None of them adds an unannounced contract value to our forecast.
During the Berlin session, the host cited the chief revenue officer's statement about 1 GW of Rubin capacity, and Volozh described a 2027 ramp weighted toward the third and fourth quarters. He also described the current commercial mix as roughly half long-term and half short-duration. Our 45%, 52.5% and 60% short-duration allocations across the three cases translate that remark into a defined model input; they reflect our judgment and carry no company endorsement.
Volozh also named the two things that could slow the ramp: chip availability and financing channels that had temporarily narrowed. Demand evidence raises our confidence in pricing and allocation. It does not deliver hardware, energize a site or close a loan.
Sources: GTC Berlin interview transcript; Nebius Q2 shareholder letter.
The Site Ledger and the Unknown Bucket
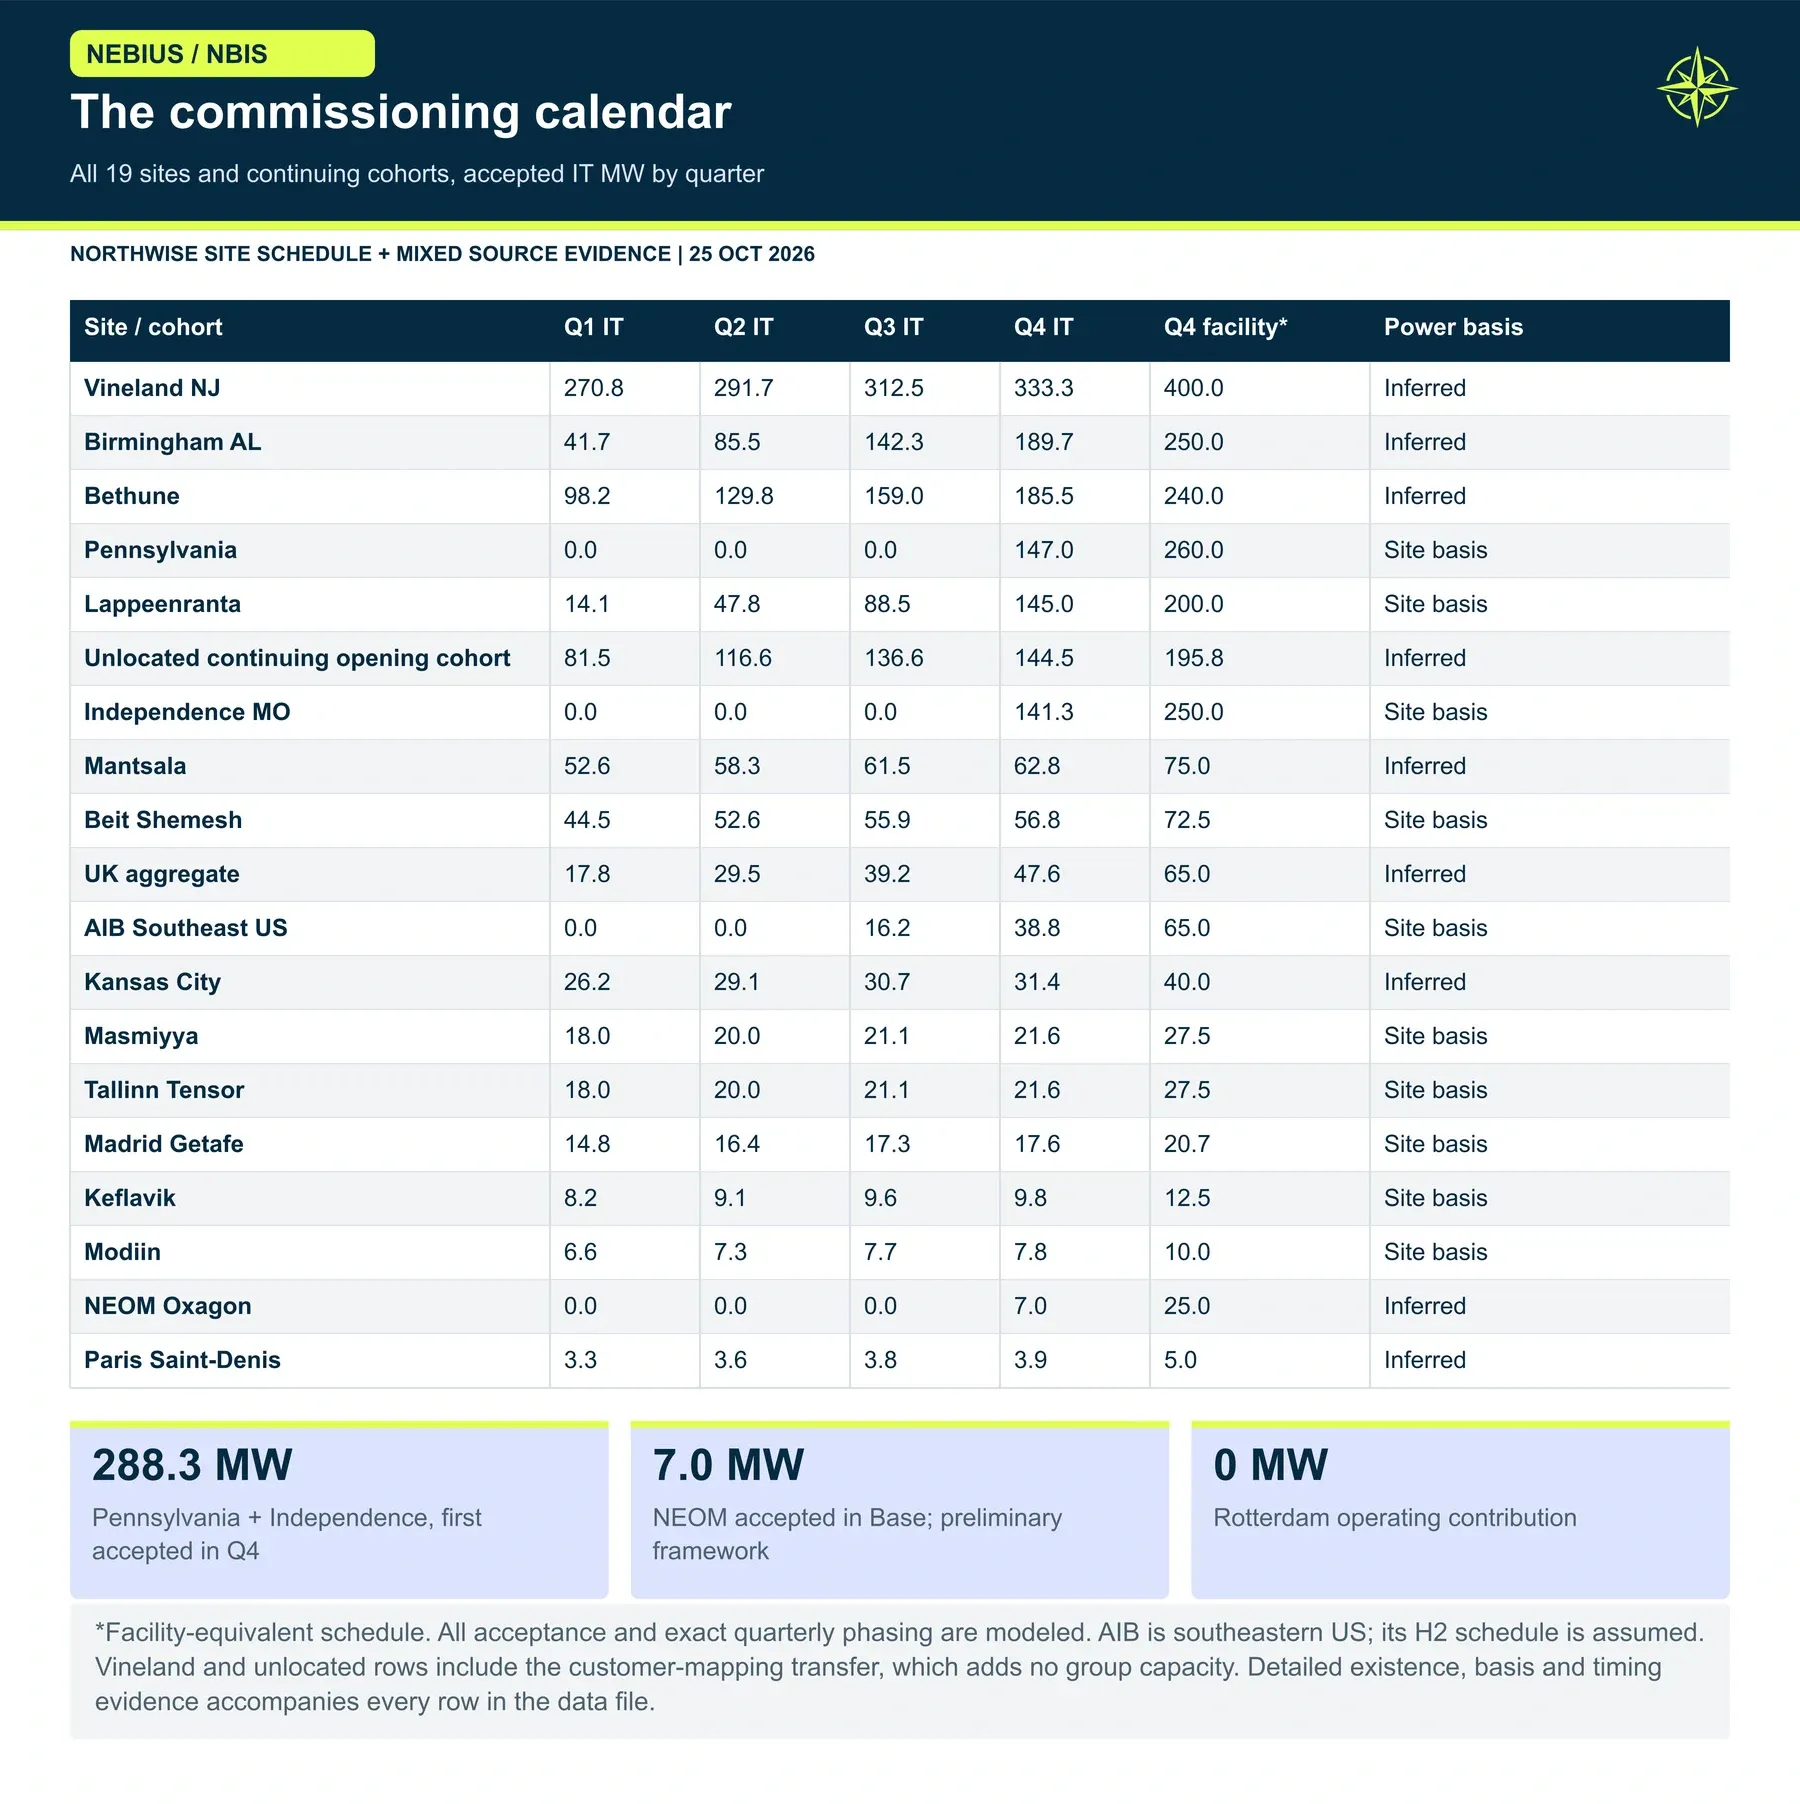
Physical capacity is the first test of any forecast built on strong demand. Our register tracks 19 rows of named sites and continuing cohorts, each with its own power basis, conversion ratio, quarterly schedule and evidence note.
The schedule is common across all three cases. What varies by case is acceptance: how quickly installed equipment becomes ready for paid service.
Site | Facility MW, YE 2026 | Facility MW, Q4 2027 | Base accepted IT MW, YE 2027 | Evidence |
|---|---|---|---|---|
Vineland, NJ | 300 | 400 | 333 | Historic disclosure of up to 300 MW; 400 MW timing is ours |
Pennsylvania | 0 | 260 | 147 | Company target of 260 MW in October 2027 |
Independence, MO | 0 | 250 | 141 | Company page gives 1.2 GW total; Q4 tranche is our forecast |
Birmingham, AL | 0 | 250 | 190 | Initial commissioning disclosed; MW phasing is ours |
Bethune | 120 | 240 | 186 | 240 MW headline confirmed; phasing is ours |
Lappeenranta | 0 | 200 | 145 | 310 MW campus disclosed; 200 MW by year end is ours |
AIB, southeastern US | 0 | 65 | 39 | 50 MW critical IT, 65 MW utility, 12-year term; H2 phasing is ours |
NEOM Oxagon | 0 | 25 | 7 | Preliminary framework of up to 50 MW; Q4 start assumed |
Other named sites | 284 | 356 | 281 | Israel, Finland, UK, Iceland, Estonia, Spain, France, Kansas City |
Unlocated opening cohort | 196 | 196 | 144 | Reconciles opening capacity to named sites |
Five sites carry the schedule. Pennsylvania has the clearest public target: an initial 260 MW phase in October 2027 on a campus planned for 1.2 GW. Independence, Vineland, Birmingham and Lappeenranta all have public anchors, though the 2027 phase sizes and quarterly timing in our model are our own estimates.
Pennsylvania and Independence deliver nothing until the fourth quarter and then contribute 288 accepted MW at year end. That single fact explains much of why 2027 revenue is so heavily weighted to December, and why a one-quarter slip at either site would cost real money.
The unlocated cohort requires a word of explanation. It holds 195.8 facility-equivalent MW of opening capacity that cannot be pinned to a named site with confidence, roughly 144 MW of accepted capacity at year end, or 9% of the total. It keeps existing capacity from disappearing in the reconciliation; it does not represent a newly discovered site.
Two pipeline items receive cautious treatment. The NEOM framework contemplates up to 50 MW for Nebius with phased operations from the fourth quarter of 2027, so we credit 25 MW of facility power with 35% initial acceptance. The Rotterdam letter of intent with Volt is nonbinding and receives no operating credit in 2027.
Site timing is the least replaceable assumption in the model. A later power date can lower 2027 revenue materially even if every campus eventually reaches its full planned size.
Sources: Pennsylvania project milestones; NEOM preliminary framework.
Rubin Arrives on Top of the Existing Fleet
Power creates room for equipment. It says nothing about which generation fills that room.
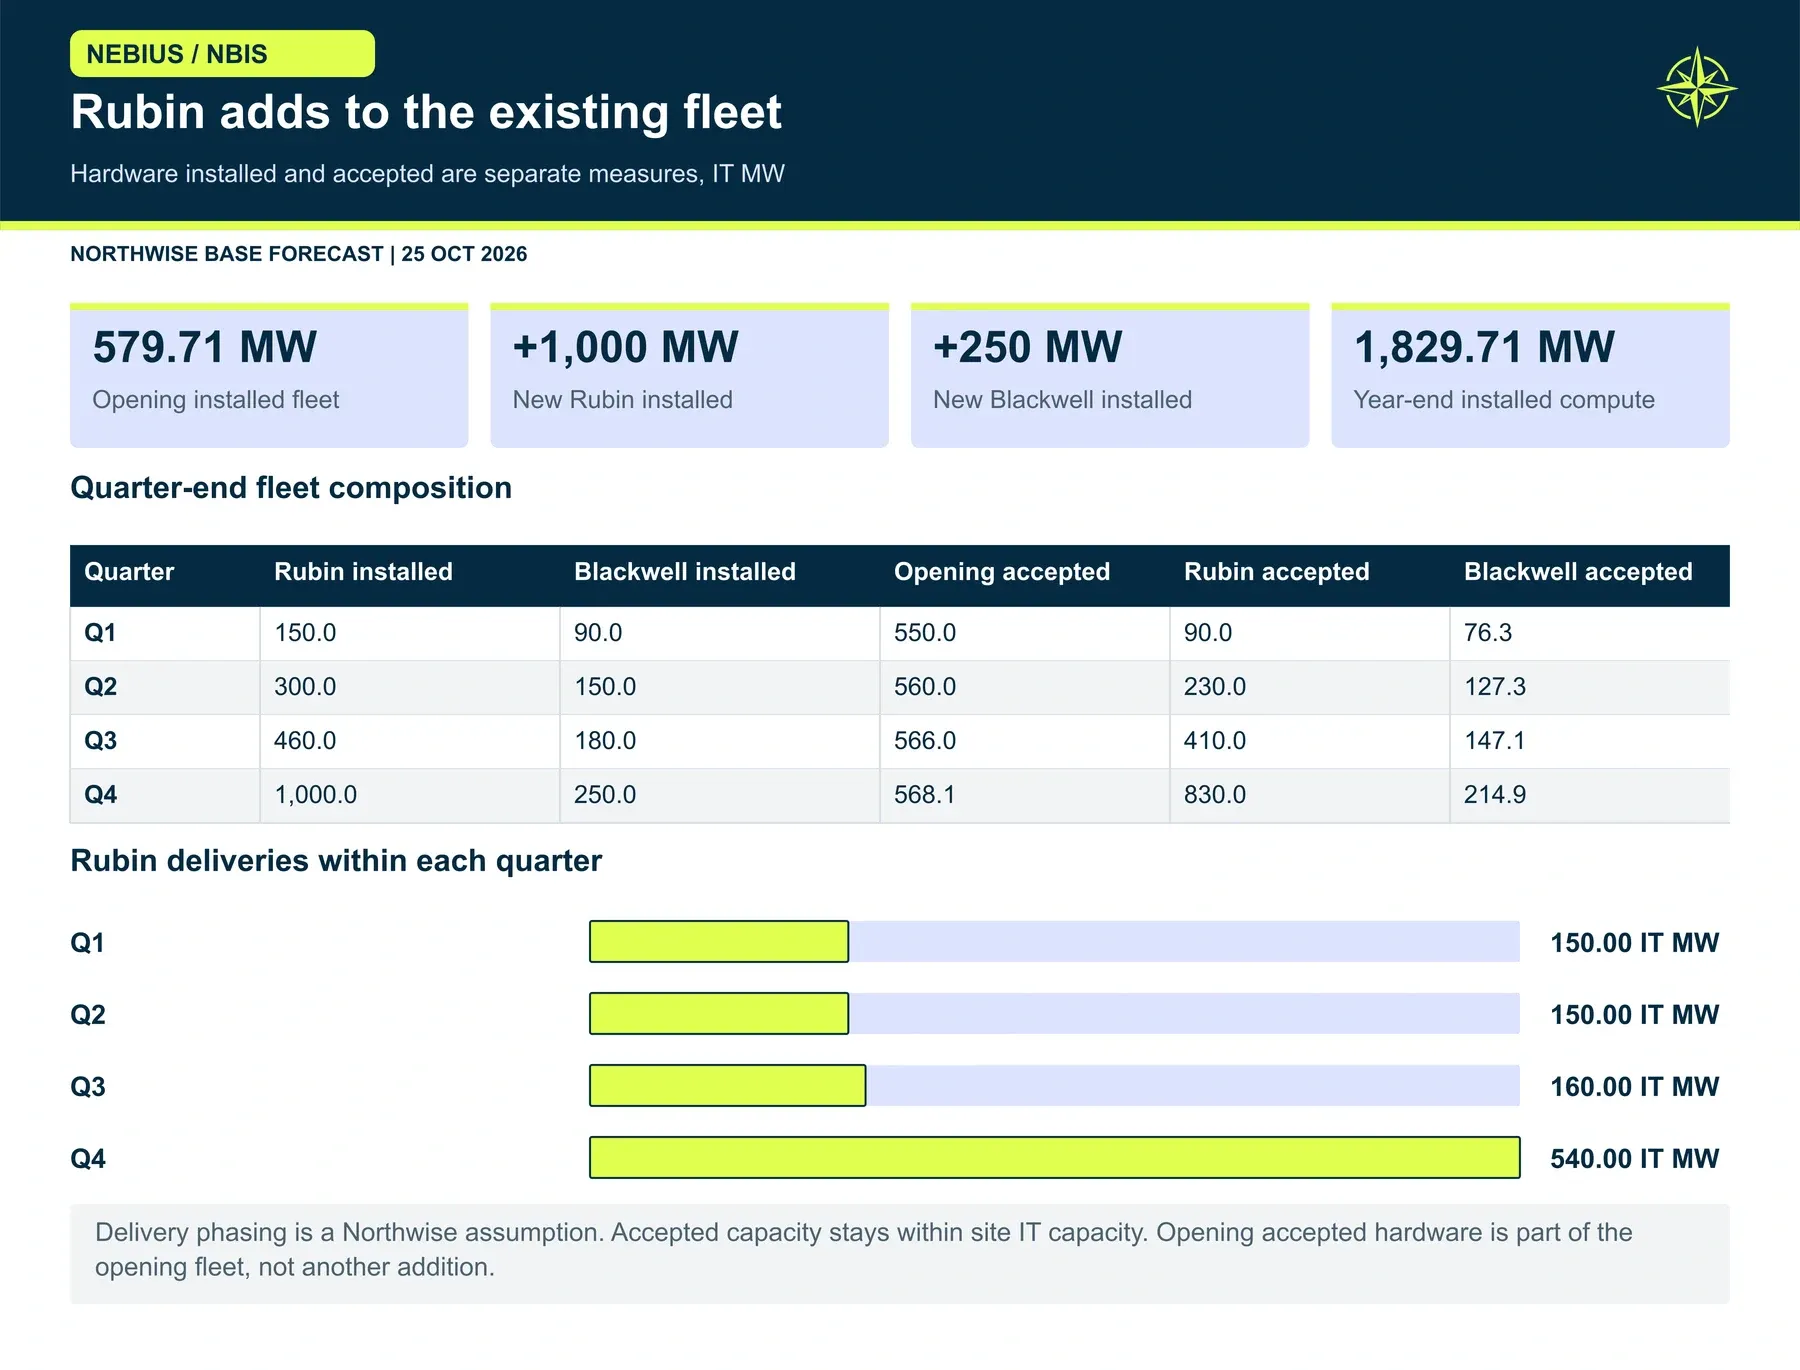
The Base case starts the year with 579.7 MW of installed IT capacity, adds 1,000 MW of Rubin and another 250 MW of Blackwell, and ends at 1,829.7 MW. Rubin installations build cumulatively to 150, 300, 460 and 1,000 MW by quarter. More than half of the year's Rubin arrives in the fourth quarter.
Acceptance lags installation. Rubin reaches 830 accepted MW by year end, and the incremental Blackwell fleet reaches 215 MW. The gap between installed and accepted capacity is the cost of commissioning, testing and customer handover.
An airline adding new aircraft keeps flying the older ones, and the same logic applies here. New Blackwell capacity splits 16% B200, 56% B300 and 28% GB300 in our model. Older opening capacity released for sale during the year is split 30% H100 and 70% H200. Each generation carries its own price, its own cost and its own renewal risk.
Peer evidence supports the longevity of older hardware without settling its future price. CoreWeave management described an A100 contract running through 2029 and strong demand for older generations on its August call. We use it only as a cross-check on coverage and repricing assumptions; Nebius's own fleet economics remain undisclosed.
The supply chain sits behind every one of these numbers. Memory availability, chip allocation and foundry capacity can all delay deliveries, and a strong order book does not guarantee an allocation.
Why December Is Not the Year
Two 100 MW clusters illustrate the most important timing effect in the model. One is already available on January 1 and can earn 12 months of revenue. The other joins the fourth-quarter acceptance cohort and contributes 1.5 equivalent months under our 0%, 50%, 100% monthly ramp. Both can look the same in a year-end capacity chart.
Our model recognizes revenue by service month. Within each quarter, new accepted capacity steps in at 0%, 50% and 100% across the three months, and signed contract ramps follow the same convention.
The result is a steep quarterly curve. Base revenue runs $2.71B, $4.21B, $5.96B and $8.98B across the four quarters. The fourth quarter alone produces 41% of the year's revenue, and December revenue annualizes to $42.6B of owned-cloud ARR against $21.2B of owned-cloud revenue for the year.
Jensen Huang made the same point in NVIDIA's DSX announcement: "An AI factory creates value when it starts producing tokens." The interval between delivery and acceptance ties up cash and can incur holding costs and supplier payments before revenue. Depreciation follows the modeled in-service policy. The run rate measures how fast the business is moving in December; it does not prove that the year's capital spending has been earned back.
Sources: NVIDIA DSX POD announcement.
Who Owns Each Megawatt
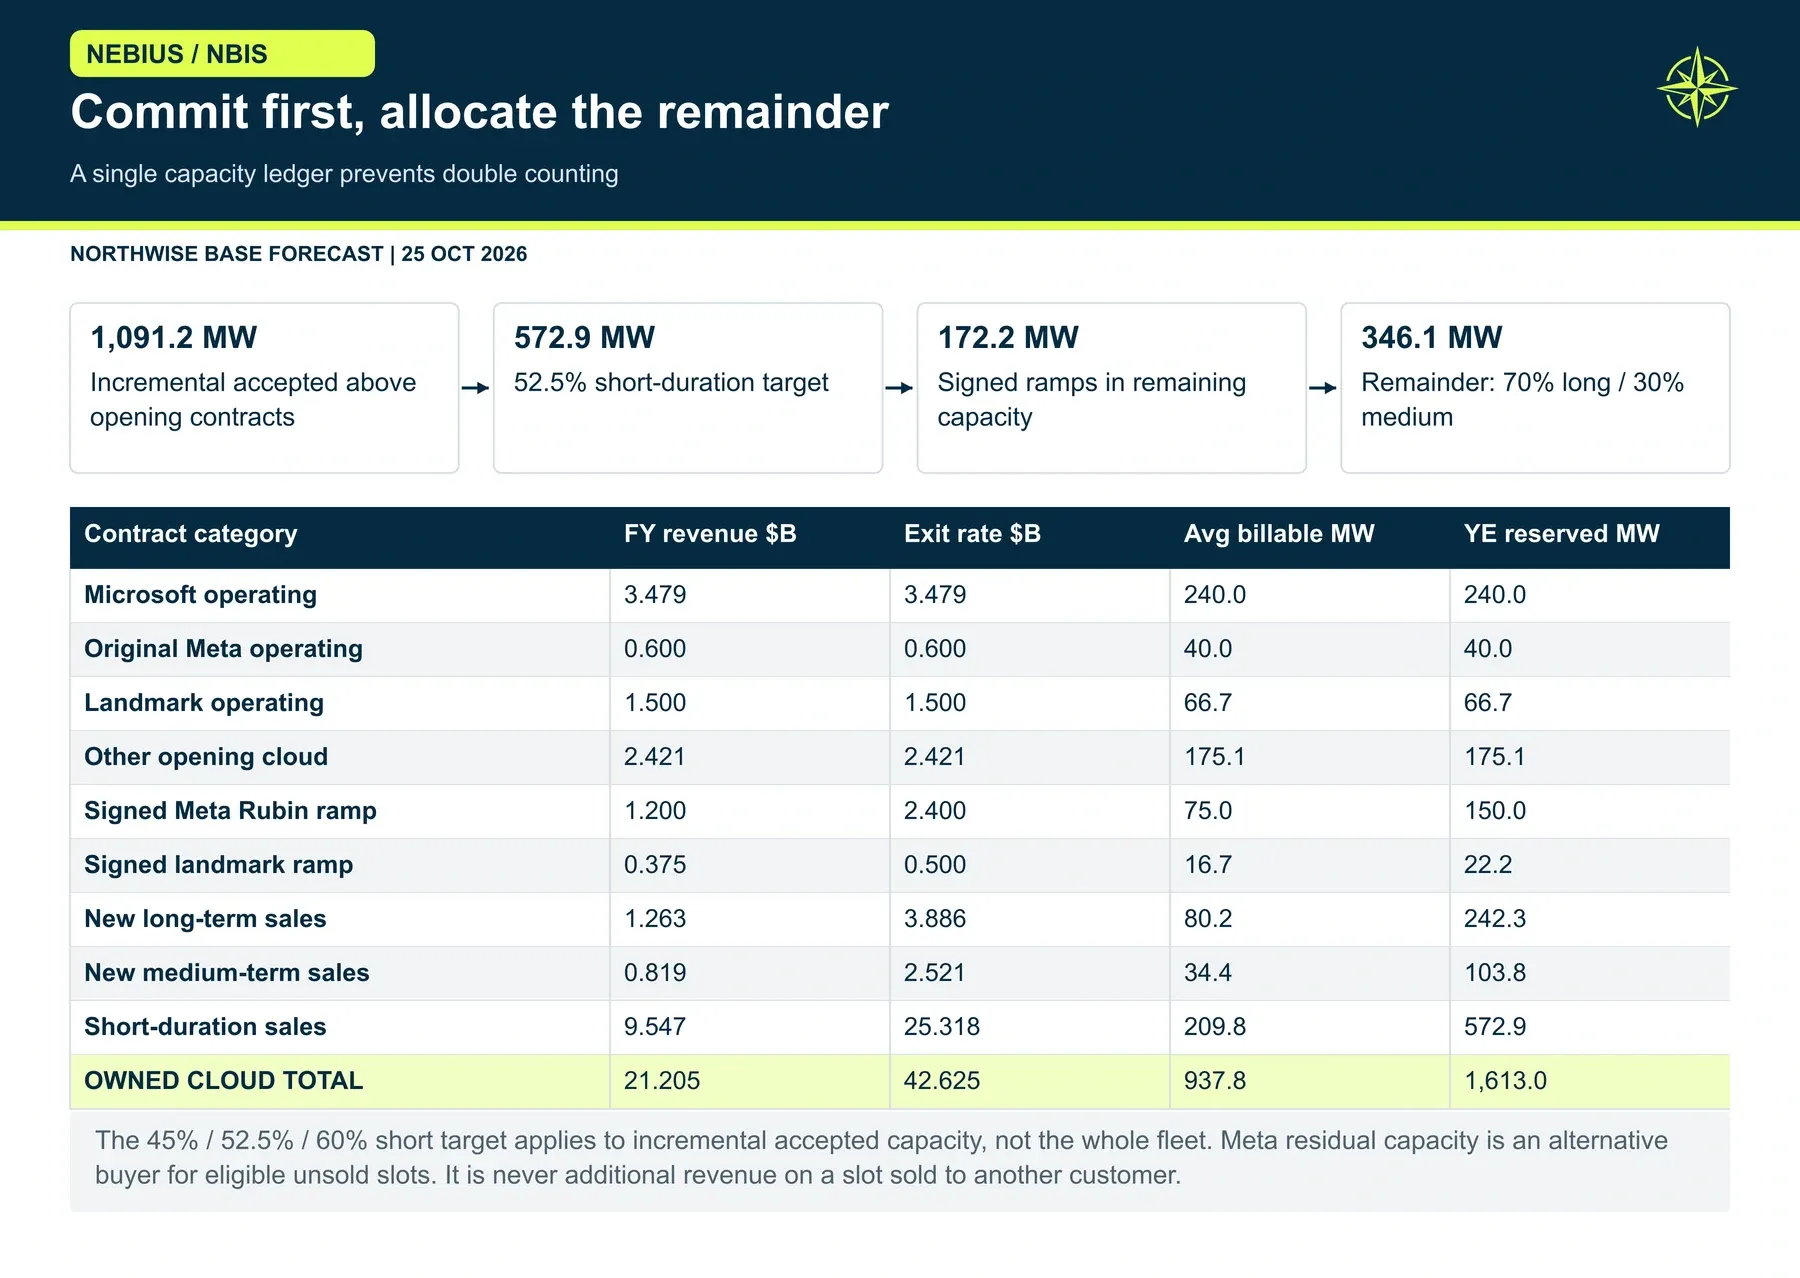
Before any new capacity is sold, the existing contracts claim their share. Starting with that ledger prevents the most common error in neocloud forecasts: spreading today's auction prices across capacity already committed at older, lower rates.
The opening book generates $8.0B of annual revenue across four categories. Microsoft contributes $3.48B on 240 MW. The original Meta contract adds $0.60B on 40 MW. Landmark deals already operating contribute $1.50B on 67 MW, and other opening cloud customers $2.42B on 175 MW.
Some of those figures are disclosed and some are our simplifications. Nebius's annual report discloses up to $17.39B of total Microsoft consideration across nine five-year GPU service tranches, including $6.96B of upfront payments. Dividing the total by five gives our $3.48B annual figure. The 240 MW attribution, the remaining service life and the cost allocation are our estimates, since tranche-level economics are not disclosed.
The opening yields tell their own story: about $14.5M per billable MW for Microsoft, $15.0M for Meta, $22.5M for landmark deals and $13.8M for other opening cloud. A fleet-wide assumption of $40M or $50M per MW would misprice more than half the opening book. Today's high auction price does not rewrite last year's five-year deal.
New capacity that is already promised comes next. The Meta agreement signed in March covers $12B of dedicated Rubin capacity over five years, with deliveries starting in early 2027. A separate arrangement allows Meta to buy up to $15B of residual capacity in specified clusters after third-party sales. The two are not additive: the same service slot cannot earn both third-party revenue and a Meta backstop payment.
We model the dedicated Meta capacity at $16M of annual revenue per IT MW, reaching 150 MW by year end. That produces $1.20B of 2027 revenue and $2.40B of exit ARR in the Base case. The signed landmark remainder adds $0.38B of revenue and $0.50B of exit ARR.
A hotel cannot sell the same room twice for the same night. Signed reservations are deducted from accepted capacity before any discretionary sale, which limits how much Rubin is actually free for merchant pricing. These lower-yield commitments also come with advances and contractual cash support, and that funding value shows up later in the cash flow statement.
Sources: Dedicated Meta agreement and residual capacity option.
Duration Against Price
Only after reservations are honored does the model decide how much new capacity to keep flexible. The short-duration allocation is 45%, 52.5% or 60% of total incremental accepted capacity, depending on the case.
In the Base case, 1,091 MW of incremental accepted capacity produces a short-duration allocation of 573 MW at year end. Signed Meta and landmark capacity takes 172 MW. The remaining 346 MW is split 70% to new five-year contracts and 30% to new two-year contracts. Short-duration contracts run on six-month terms.
Base 2027 category | Revenue | Exit ARR | Avg billable MW | Revenue per billable MW | Direct margin |
|---|---|---|---|---|---|
Microsoft | $3.48B | $3.48B | 240 | $14.5M | 75.9% |
Original Meta | $0.60B | $0.60B | 40 | $15.0M | 76.7% |
Landmark operating | $1.50B | $1.50B | 67 | $22.5M | 80.0% |
Other opening cloud | $2.42B | $2.42B | 175 | $13.8M | 67.5% |
Signed Meta Rubin | $1.20B | $2.40B | 75 | $16.0M | 78.1% |
Signed landmark ramp | $0.38B | $0.50B | 17 | $22.5M | 80.0% |
New long-term | $1.26B | $3.89B | 80 | $15.7M | 77.8% |
New medium-term | $0.82B | $2.52B | 34 | $23.8M | 81.1% |
Short-duration | $9.55B | $25.32B | 210 | $45.5M | 90.1% |
Owned cloud | $21.21B | $42.63B | 938 | $22.6M | 82.2% |
The shape of the table is the shape of the thesis. Short-duration capacity earns 45% of owned-cloud revenue on 22% of average billable capacity. Five-year contracts earn roughly a third as much per megawatt and bring advances, lender support and certainty in exchange.
A rising merchant share therefore cuts both ways. It lifts revenue per MW and raises exposure to renewal prices every six months. The Bull case runs at 60% short-duration and earns more; it also carries the most pricing risk into 2028.
Back to the 100 MW decision. Nebius does not have to choose one customer. The model gives roughly half of new capacity to each kind, which is close to the mix management describes and, in our view, the right way to run a business that needs both cash and pricing power.
Sources: Nebius Q2 contract and prepayment observations.
Building the Merchant Yield
A car rental company cannot use the daily rate of its newest premium vehicle as the average price for its entire fleet. Merchant pricing at Nebius needs the same treatment.
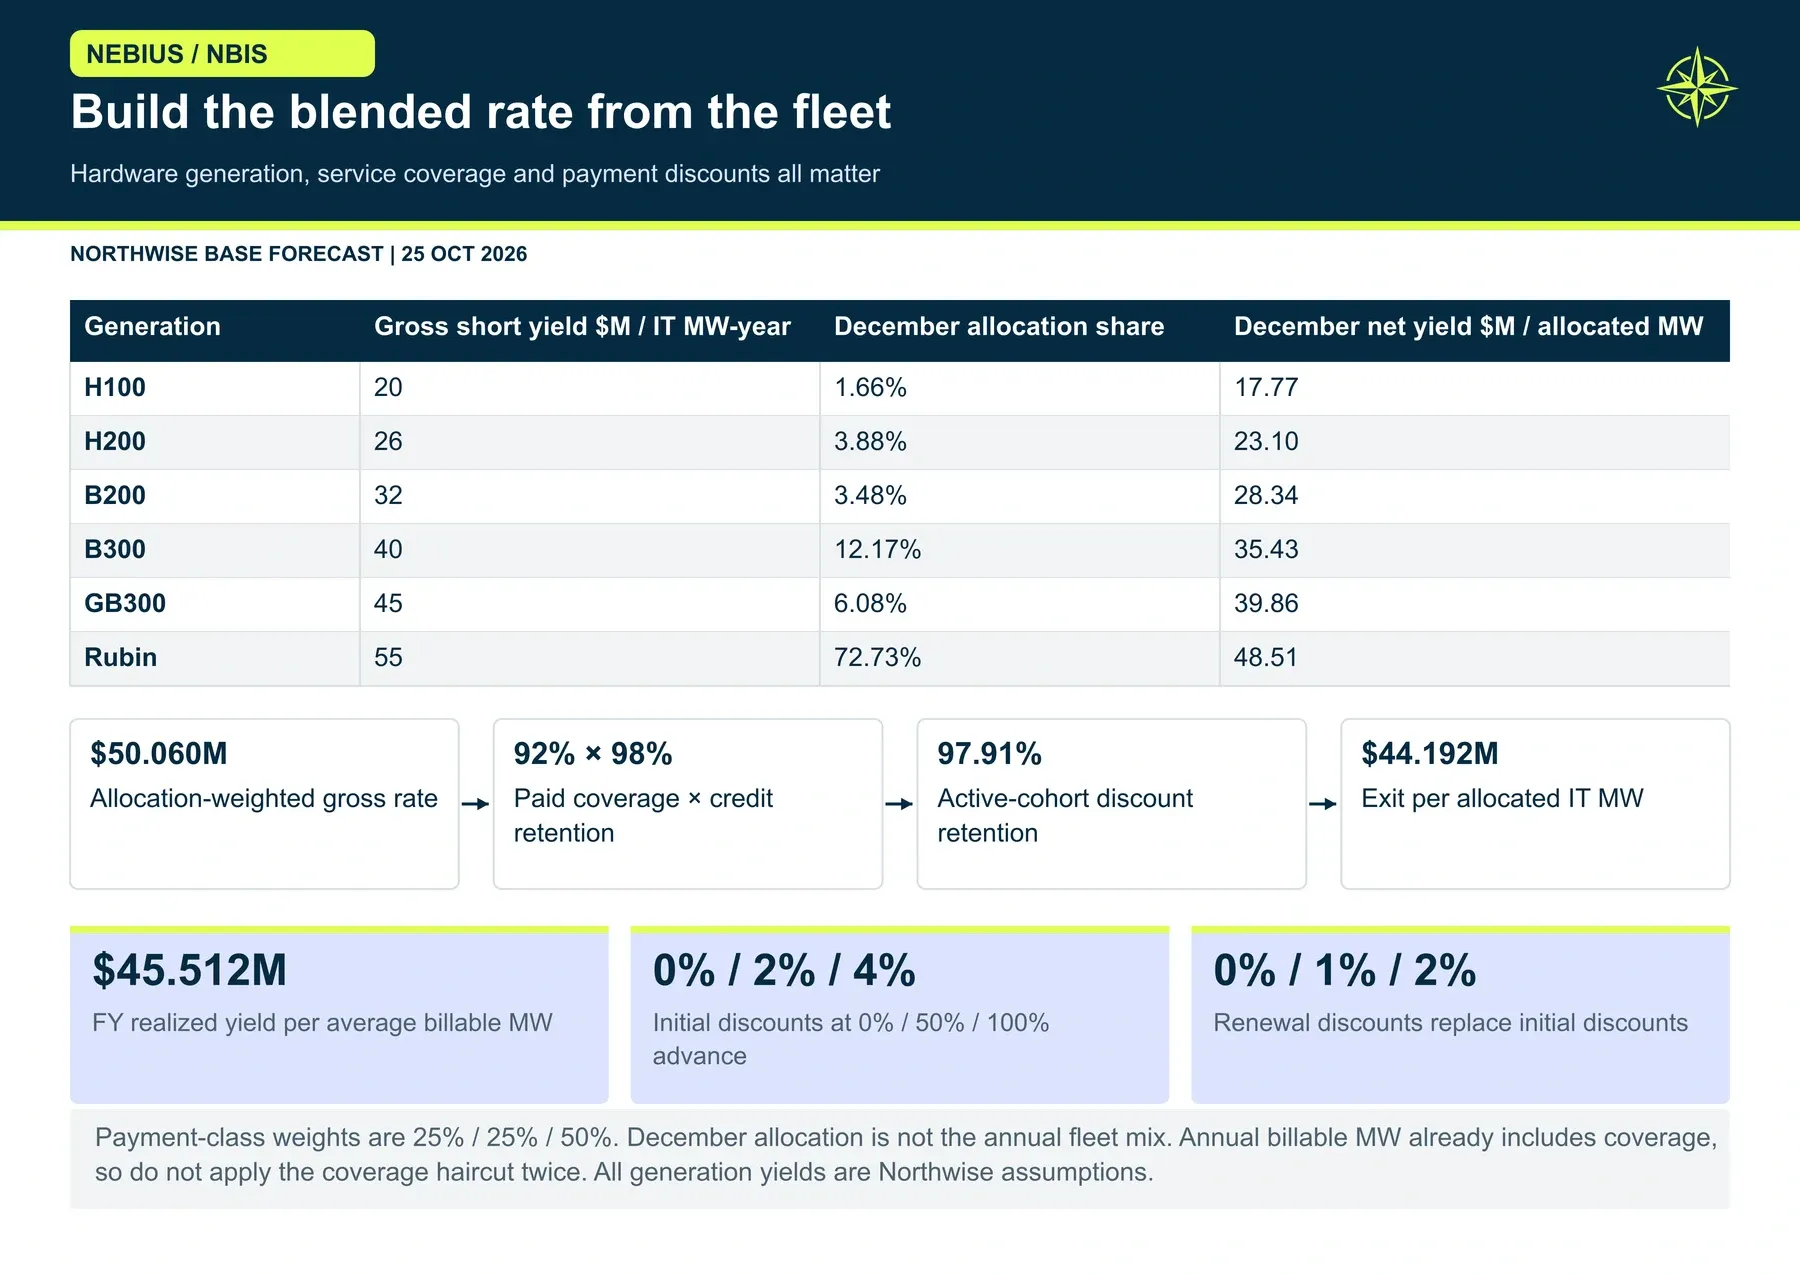
Our gross short-duration price ladder runs $20M per IT MW-year for H100, $26M for H200, $32M for B200, $40M for B300, $45M for GB300 and $55M for Rubin. Long-term and medium-term ladders sit well below: $12M to $16.5M and $18M to $25M respectively. These are our underwriting inputs, informed by the Q2 letter's $40M to $50M short-duration range and the landmark deal range, rather than six observed price series.
Several adjustments separate the gross ladder from revenue. A case price factor of 0.95, 1.00 or 1.05 applies across all generations. Paid coverage of 90%, 92% or 94% reflects capacity that is allocated but not billing. A 98% service-credit factor and payment-class discounts follow.
The Base outcome is $9.55B of short-duration revenue. It also produces three different averages that are easy to confuse: $45.5M per average billable MW, $41.9M per average allocated MW, and $44.2M of exit ARR per year-end allocated MW. Rubin makes up 73% of year-end short-duration capacity and nets about $48.5M per allocated MW against its $55M gross input.
"We're seeing continued upward mobility in terms of the kind of price per megawatt," Boroditsky told CNBC. That describes the direction of marginal auctions. Our yield describes the average across a mixed fleet, over a full year, after discounts.
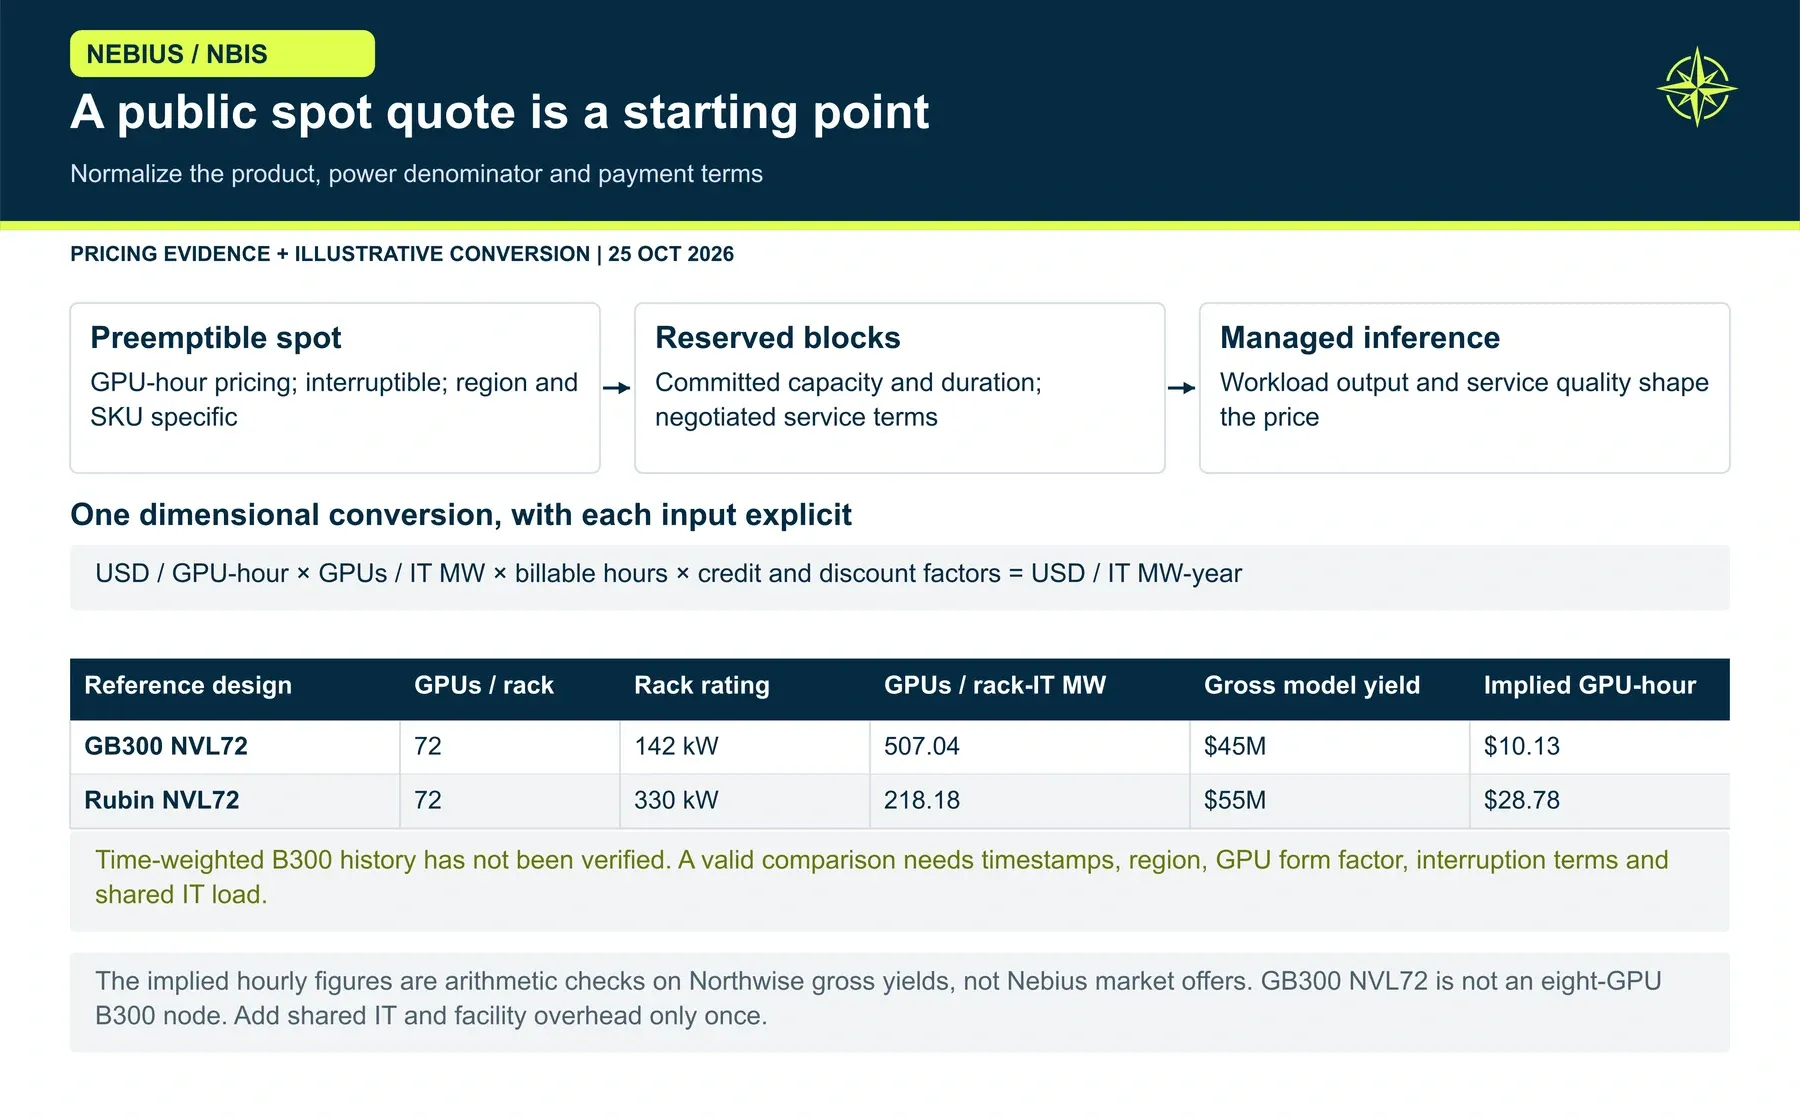
Nebius opened public spot pricing in October, which adds a new source of evidence and a new source of confusion. Spot prices are preemptible, quoted per GPU-hour, specific to region and SKU, and can update every 15 minutes. The workbook records an October 24 B300 spot snapshot of $5.59 to $5.80 per GPU-hour across three regions. This historical observation has not been independently reconstructed from a complete time-stamped export. Those prints describe interruptible capacity, a different product from a reserved six-month block.
One data gap remains open. We have not verified a time-weighted 30-day average for any GPU type, and the public interface displays the lowest regional price. Until a dated export with timestamps, regions and volumes exists, spot data serves as a directional check on our ladder and not as a fleet yield.
Sources: Public spot pricing; GB300 rack reference; Rubin rack reference.
Rubin Economics and the Software Layer
Rubin's higher price needs its own argument. The question is how customers can pay less per unit of useful work while Nebius earns more per megawatt.
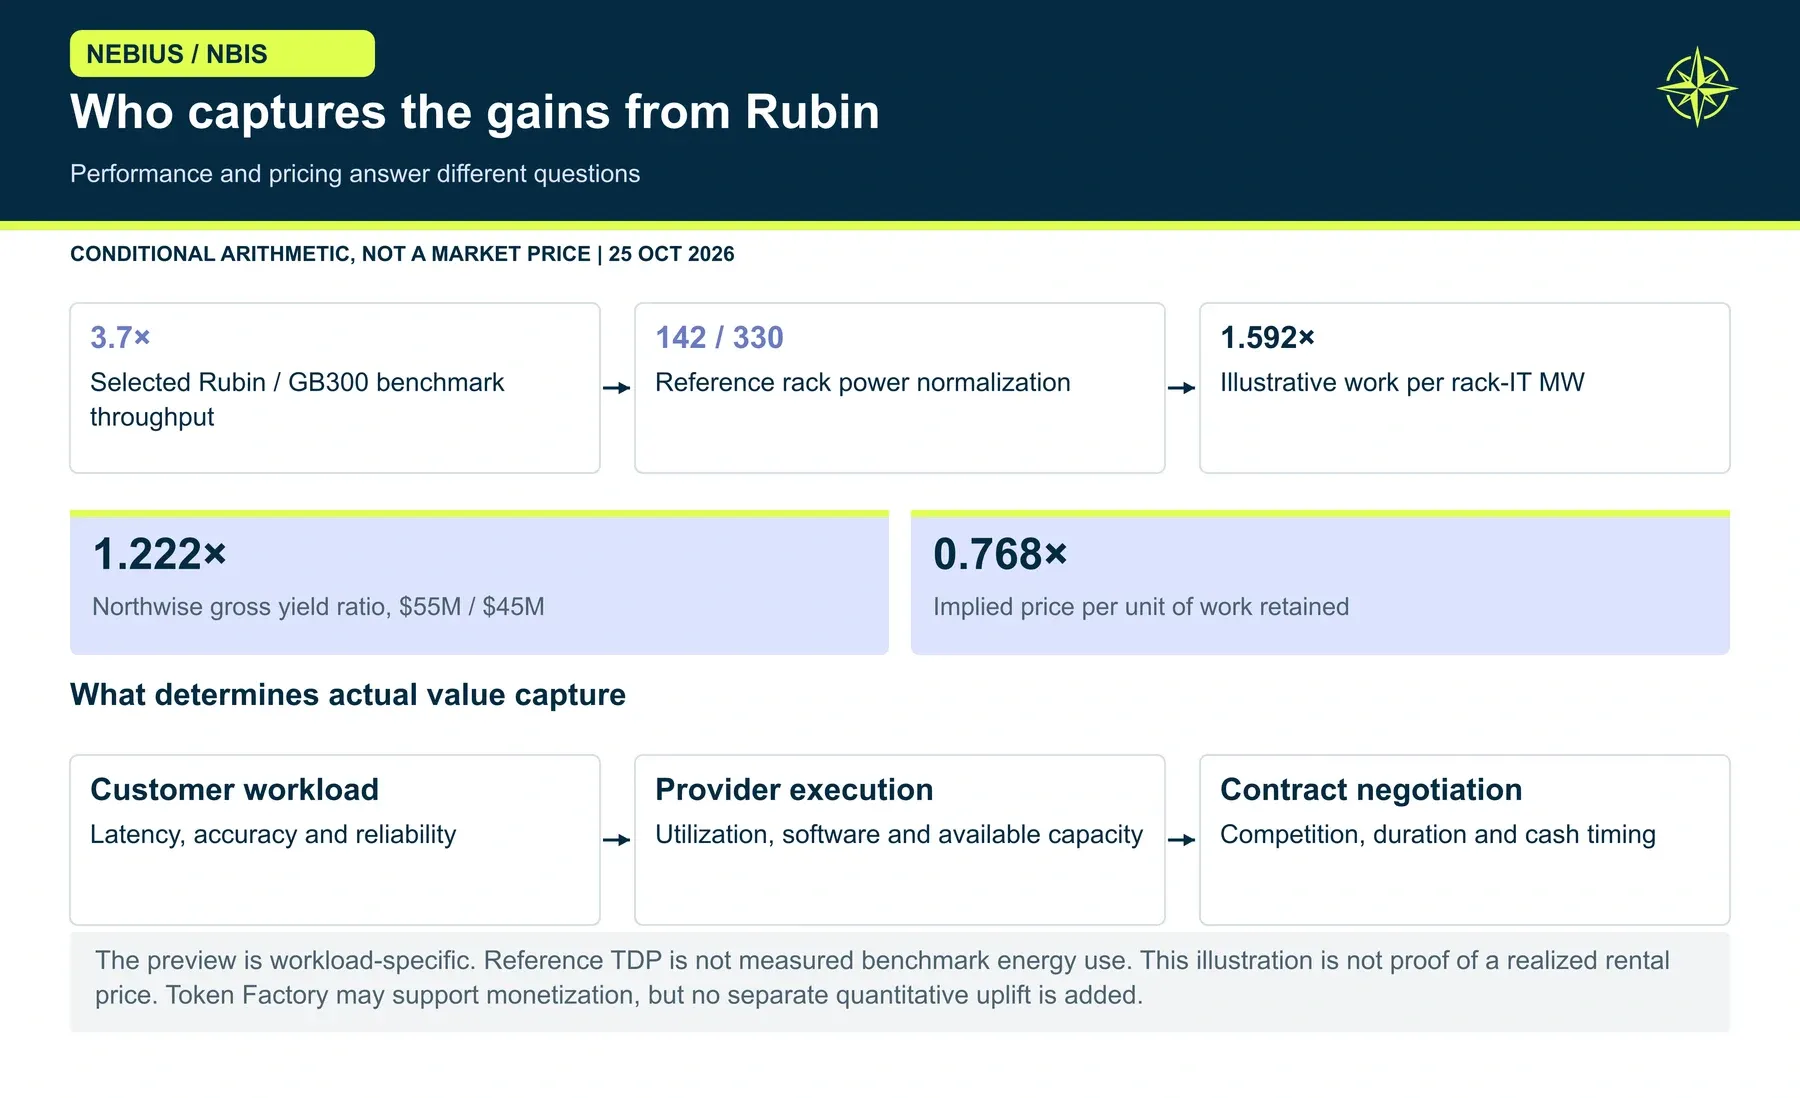
A GB300 NVL72 reference rack holds 72 GPUs at up to 142 kW. A Rubin NVL72 reference cabinet also holds 72 GPUs, at 330 kW of nameplate power. At our gross yields of $45M and $55M per rack-IT MW, those densities imply roughly $10.13 and $28.78 per GPU-hour. We treat those figures as consistency checks on our inputs; Nebius does not quote them.
NVIDIA's MLPerf preview showed Rubin delivering up to 3.7 times the throughput of GB300 NVL72 on specific workloads. Adjusting for the higher rack power, that upper-bound preview implies about 1.59 times the useful work per rack-IT MW. Our Rubin revenue per MW is 1.22 times GB300's. Under that illustration, Nebius captures about 77% of the per-unit-work price and customers keep the rest as savings.
The illustration is conditional. A vendor benchmark is not a market-clearing price, and workload compatibility, utilization and customer bargaining power can all absorb the gain. NVIDIA's widely cited figure of roughly $60M per MW for an AI factory refers to capital cost, not rental revenue.
Software sits on top of the hardware economics. Nebius acquired Inferize in October to cut cold-start times and reduce idle capacity inside Token Factory, its production inference platform, and in August announced work with NVIDIA's Groq 3 LPX inference hardware for specialized workloads. Those tools can lift utilization and the value customers get per GPU-hour.
We do not add a separate revenue line for them. Their effect is already embedded in coverage and yield expectations, and no company-wide revenue or margin increment has been disclosed. Treating the software layer as a second uplift would count the same improvement twice.
Sources: NVIDIA workload-specific benchmark preview; Inferize acquisition; Token Factory and Groq 3 LPX.
Customer Cash Before Service
Two customers buy the same six-month service. One pays monthly as it goes. The other pays everything upfront in exchange for a lower price. Nebius gets cash today from the second customer and still owes the full six months of service.
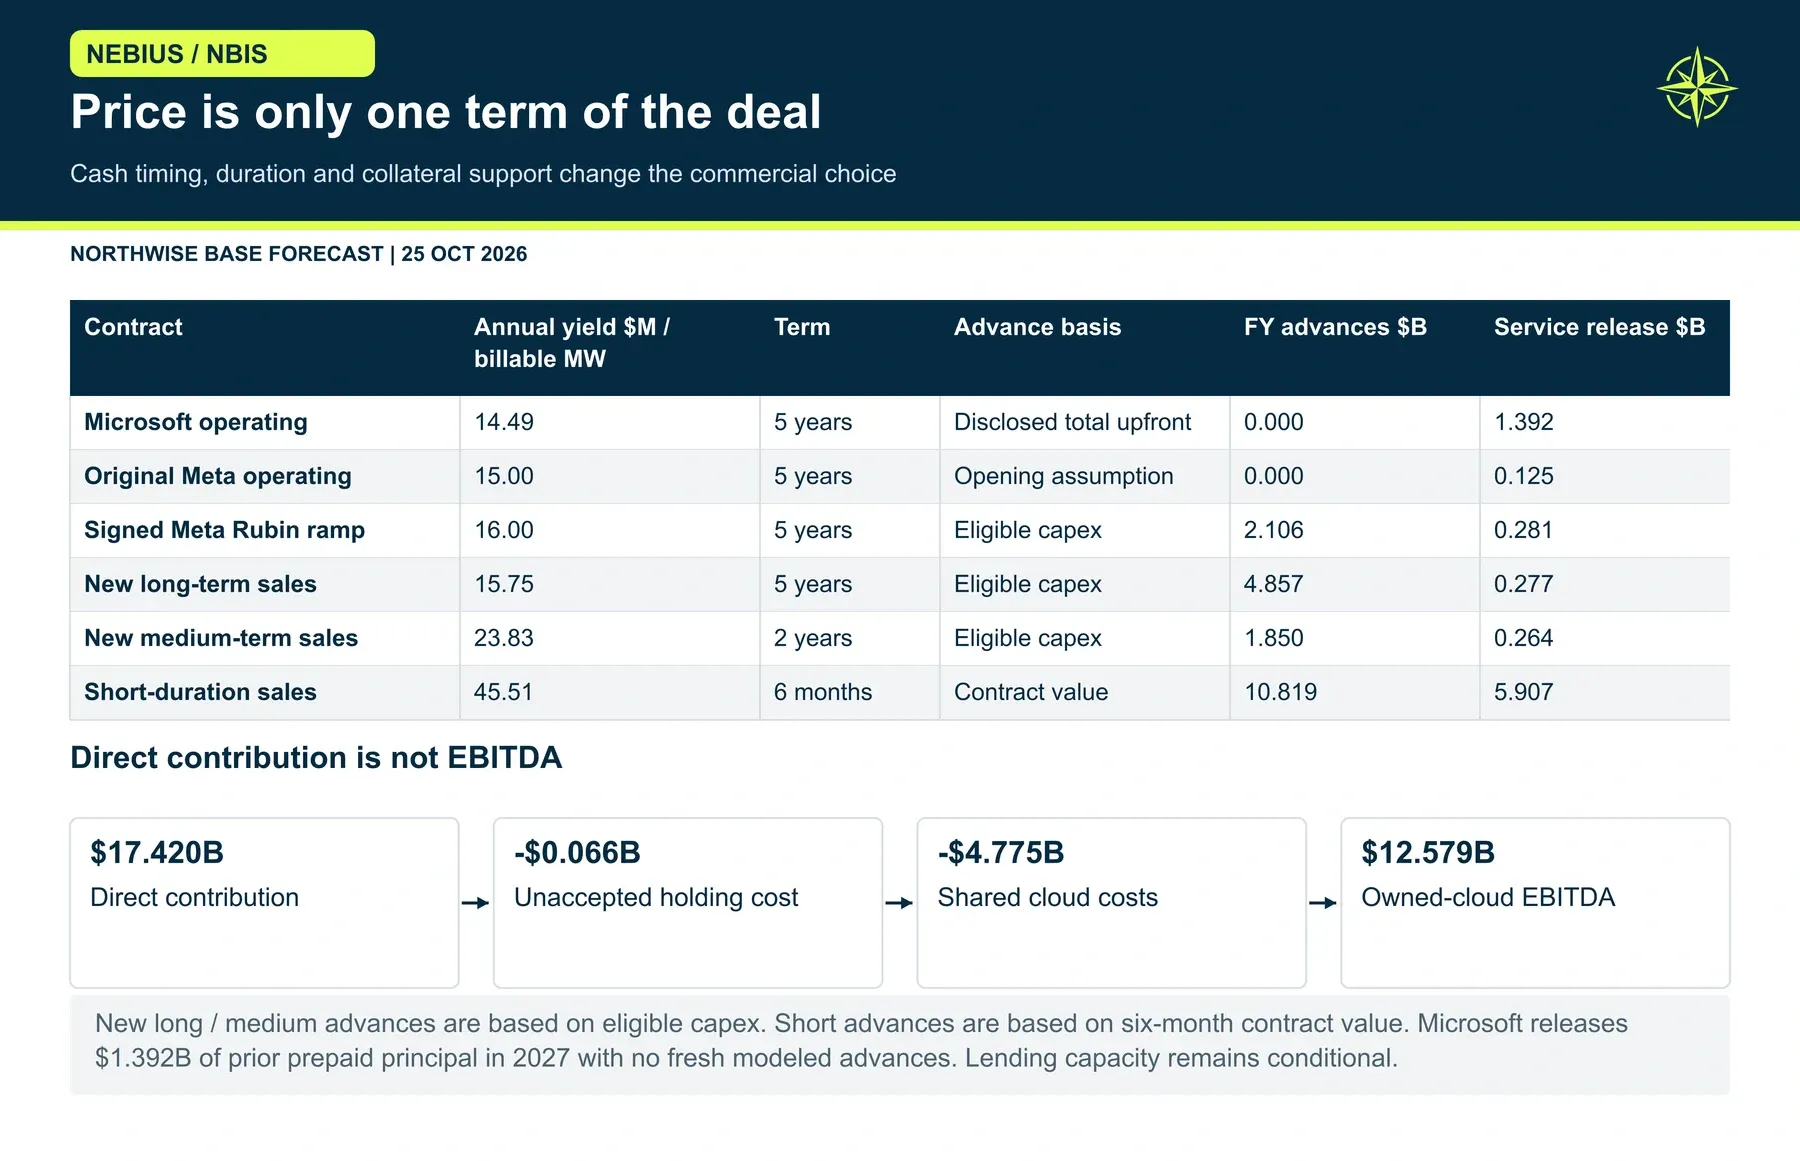
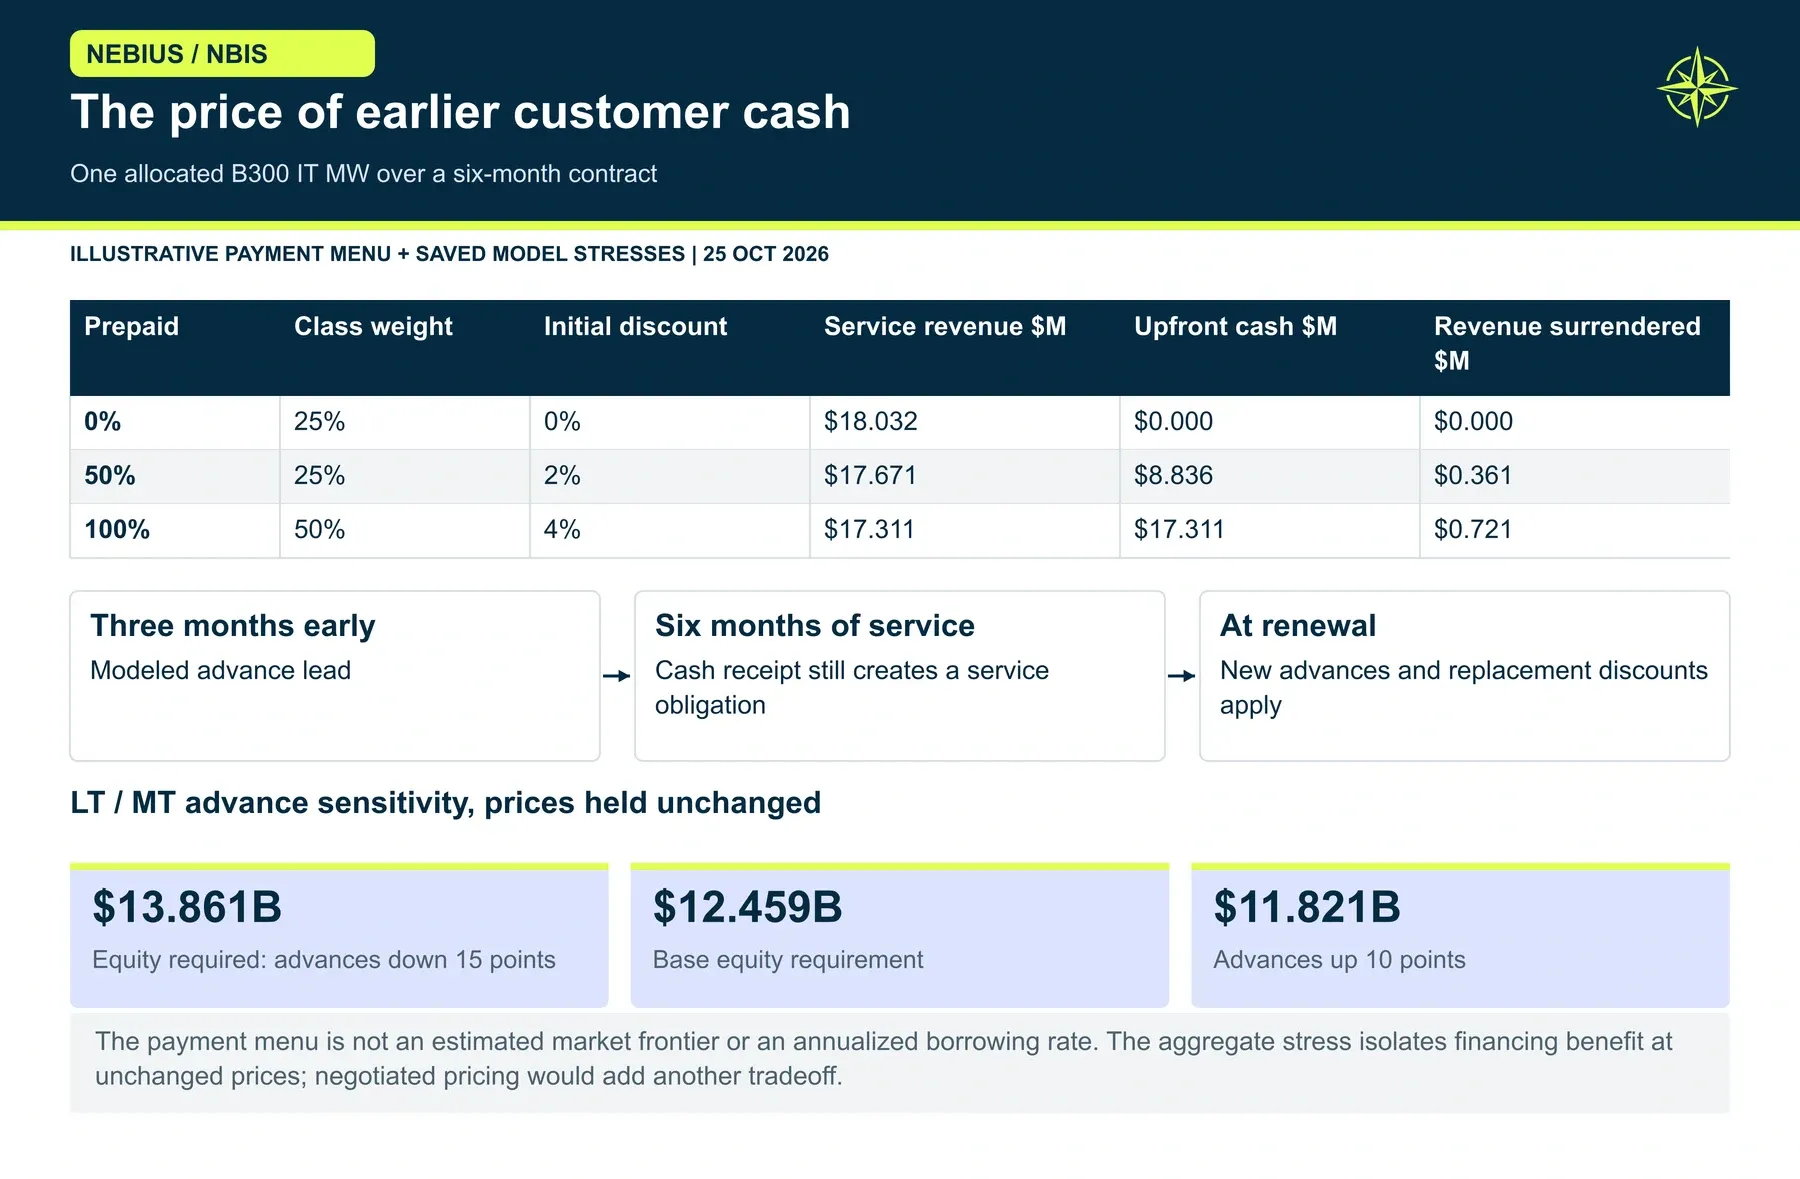
The model uses three short-duration payment classes: a quarter of capacity pays as it goes with no discount, another quarter prepays 50% for a 2% initial discount, and half prepays in full for a 4% initial discount. The weighted result is 62.5% of short-duration value prepaid at a 2.5% average initial discount, with renewal discounts of 0%, 1% and 2% replacing the initial discounts at each six-month roll.
New long-term and medium-term contracts work differently. Advances equal 55% of eligible compute and infrastructure capex, with 90% of long-term and 80% of medium-term contracts participating. That 55% applies to eligible capex on participating deals only, so it should never be read as a share of revenue or of total group spending.
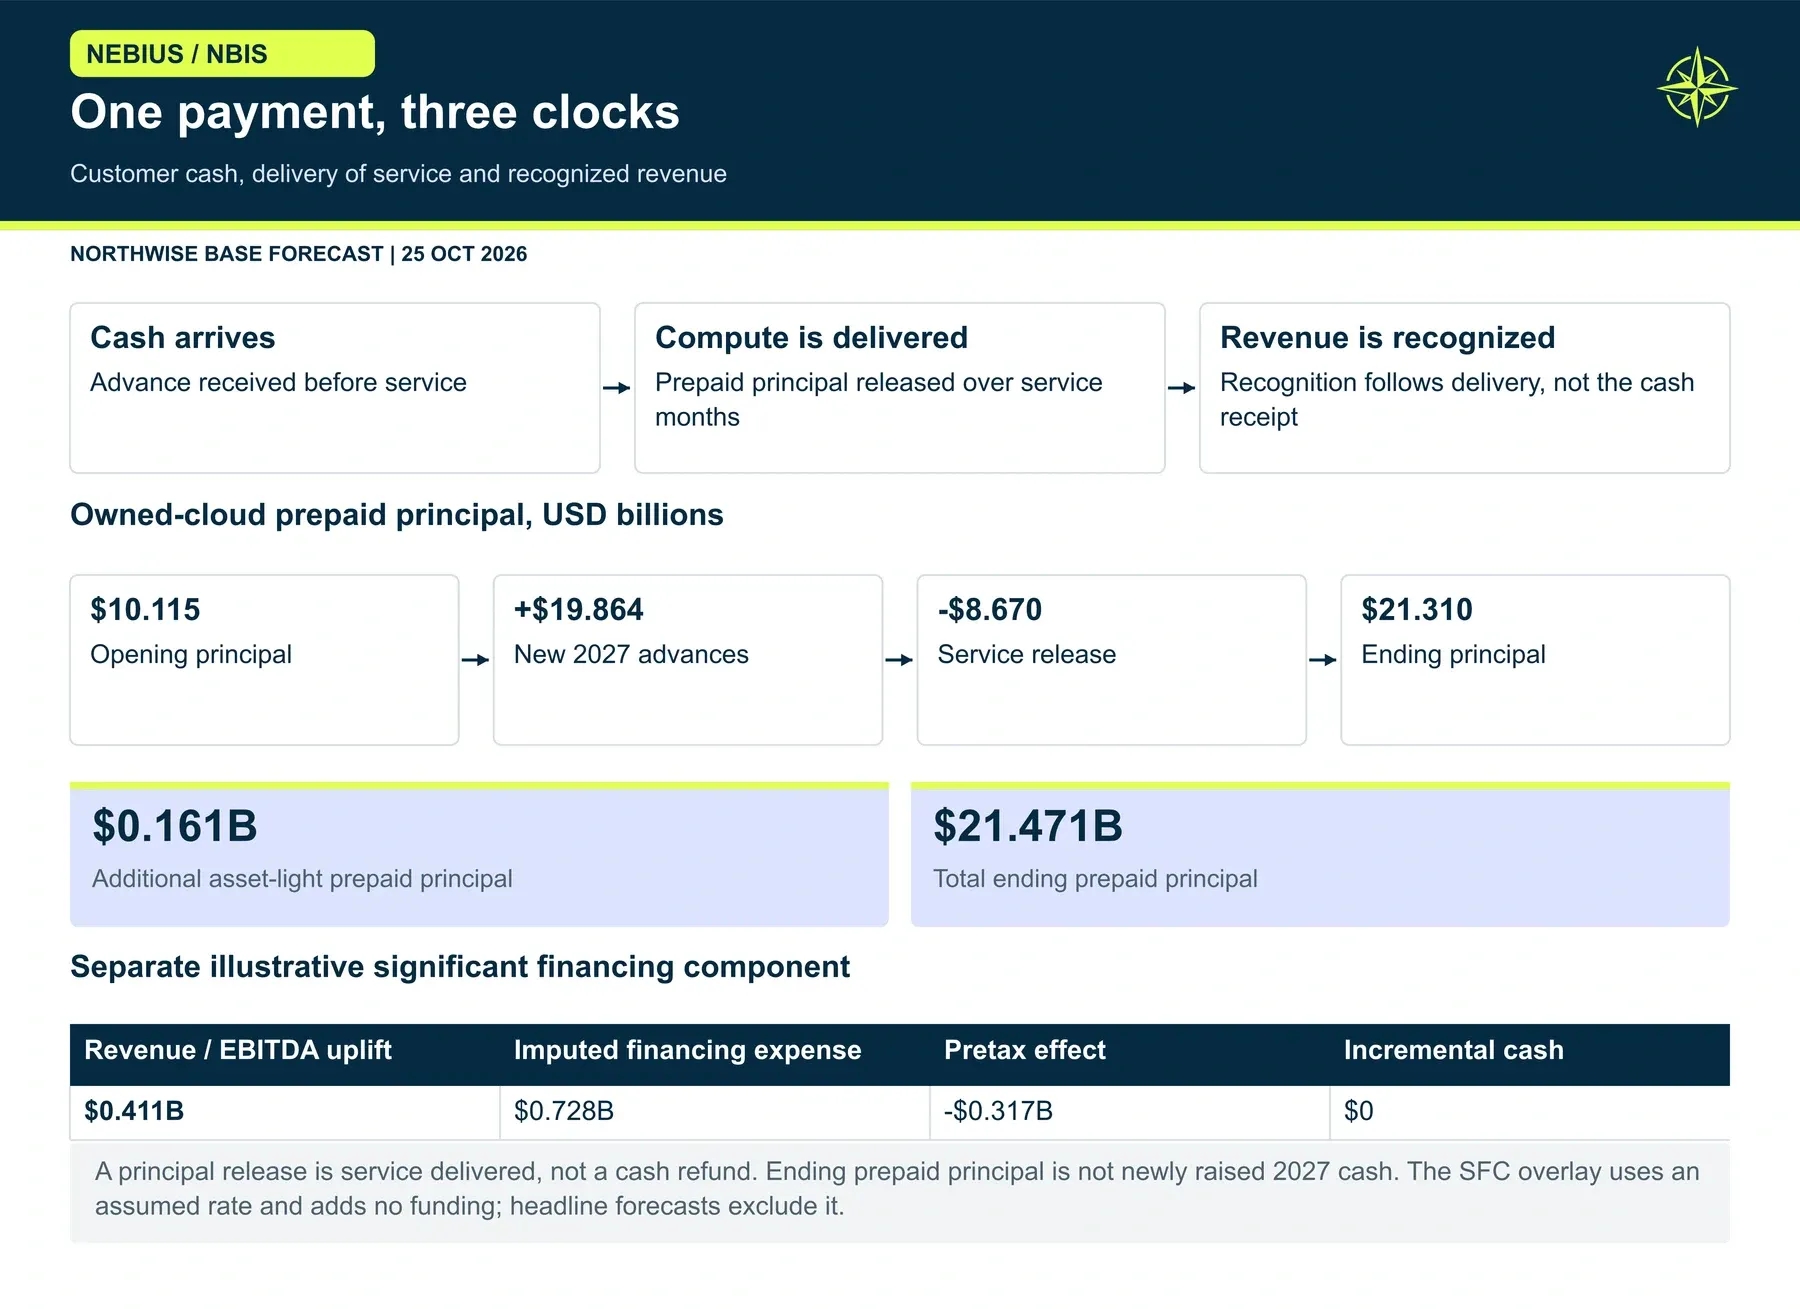
In the Base case, customers advance $19.86B in 2027. Service performed releases $8.67B of earlier advances into revenue. Net owned-cloud customer funding is $11.19B, and adding the asset-light principal change brings the total in operating cash flow to $11.36B. Gross advances equal 34% of total cash capex.
Operating cash flow before the prepaid change is $10.24B. The headline $21.60B includes customer funding that will be repaid in service over the following months and years. Strong operating cash flow during an expansion does not mean every dollar is recurring profit.
Prepayments also create a pricing frontier. More cash today can justify a lower service price if the financing value exceeds the revenue given up. Our sensitivity that raises long-term and medium-term advances by 10 points holds prices fixed, so it measures funding benefit without the full negotiated tradeoff.
Under ASC 606, a payment made well ahead of service can contain a significant financing component that splits into service revenue and interest. Applying an illustrative 6% rate adds $0.41B of revenue and EBITDA and $0.73B of noncash interest, reducing pretax income by $0.32B. None of it changes cash. Our revenue and EBITDA figures are normalized and exclude this overlay; on an illustrative accounting basis they would be about $22.27B and $12.90B.
Sources: Nebius annual-report customer-contract note; Original ASC 606 ASU reference.
The Capex Bill and Its Four Dates
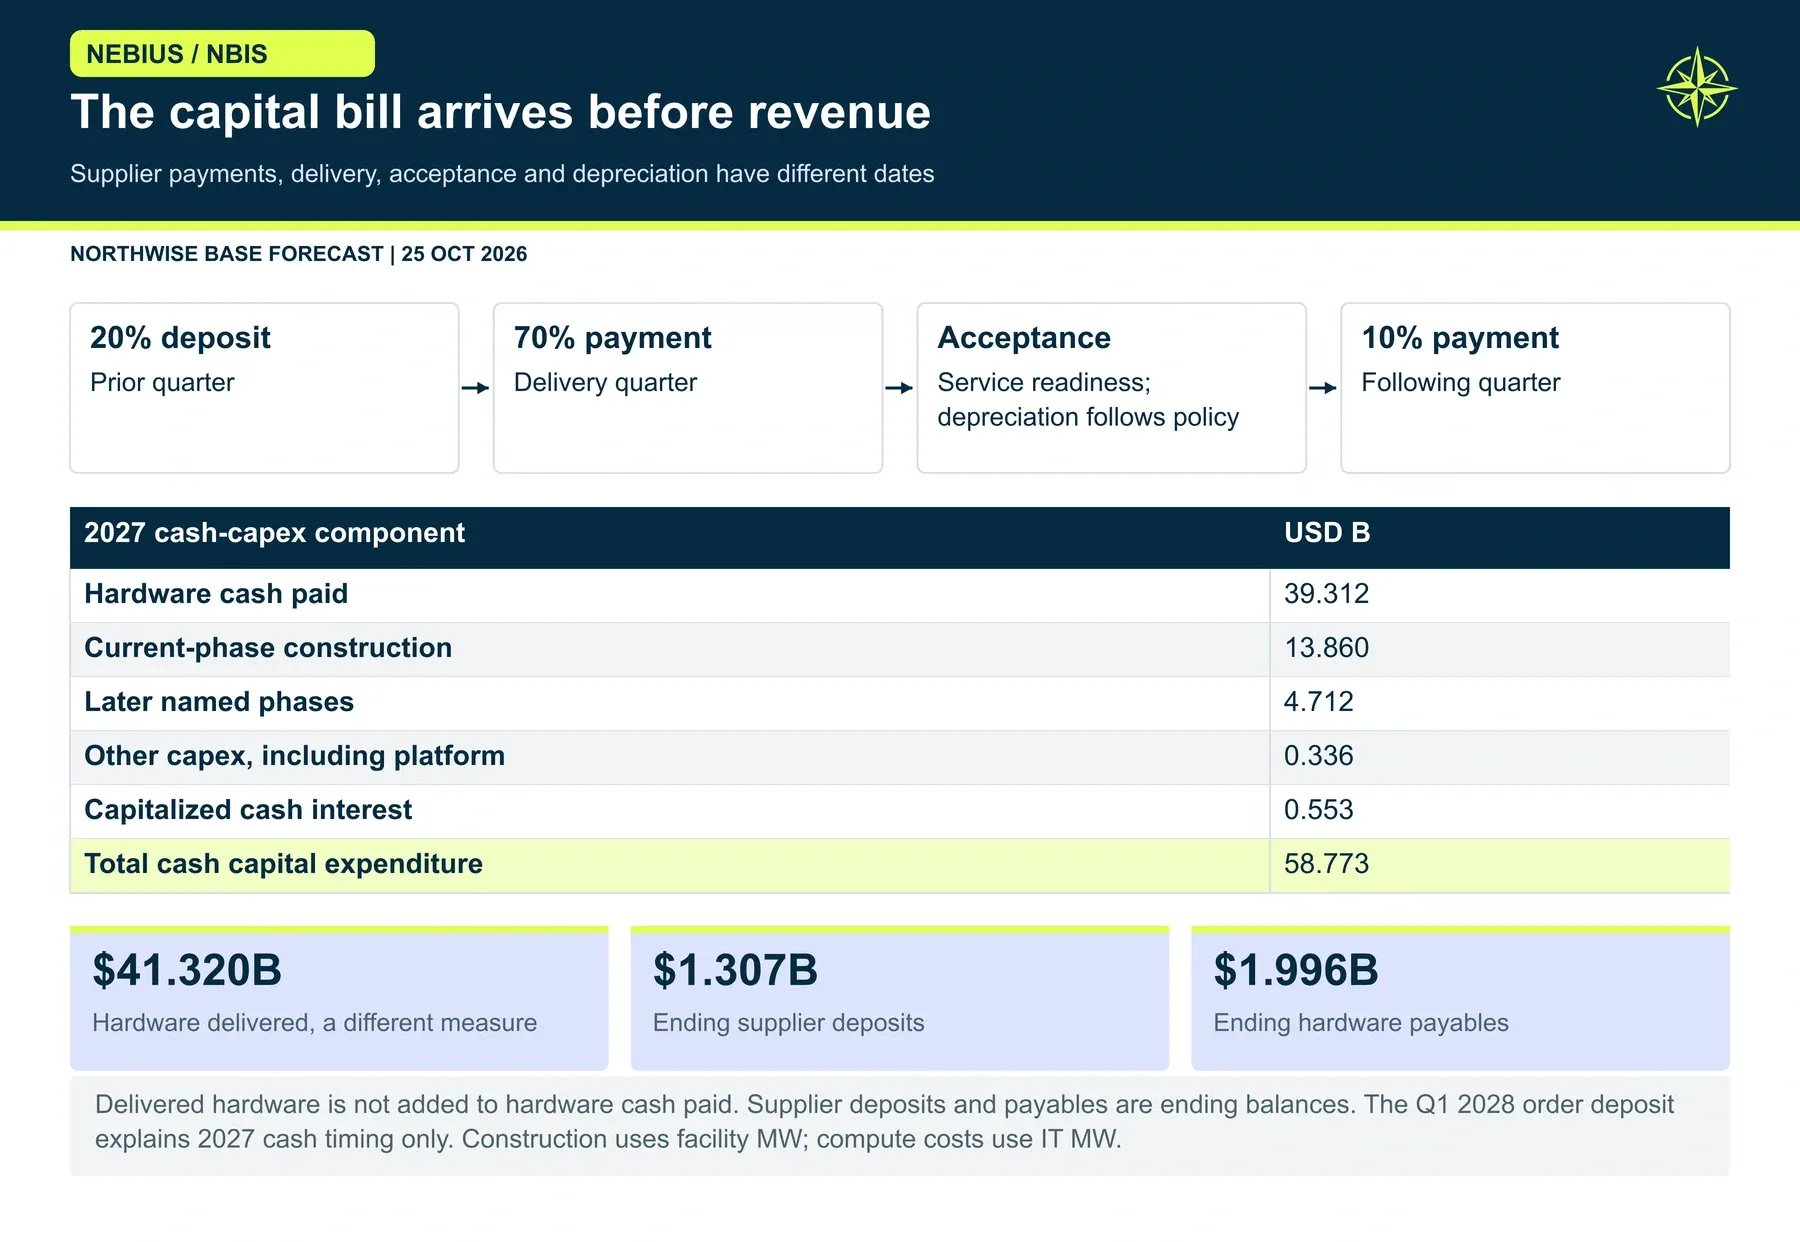
A purchase order, a delivery, a customer acceptance and a depreciation charge happen on four different dates. Capex does not move in step with revenue for that reason, and the gap is widest in a year like 2027.
Hardware dominates the bill. Our system acquisition costs, including networking and installation, run about $32.3M per IT MW for Rubin, $40.0M for B300, $35.6M for B200 and $28.7M for GB300. Suppliers receive 20% before delivery, 70% on delivery and 10% afterward. Base hardware delivered during the year totals $41.32B, while hardware cash paid is $39.31B, as deposits and payables cross the year boundary.
Construction follows four archetypes. Greenfield sites cost about $15.5M per facility MW before land, brownfield $11.0M, build-to-suit $3.0M and colocation $2.0M, all subject to a 1.18 escalation and project allowance. Cash paid for 2027 phases totals $13.86B. Another $4.71B goes to construction for later named phases, which is 2027 cash spending on capacity that does not operate in 2027.
The pieces add up to $58.22B before capitalized interest, plus $0.55B of qualifying interest, for $58.77B of cash capex. The quarterly path runs $11.2B, $12.2B, $14.9B and $20.4B, tracking the Rubin deliveries.
Compute depreciates over five years and infrastructure over 20; land does not depreciate. The $0.2B maintenance budget covers routine replacement. It is not the eventual bill for refreshing the fleet, which falls outside a 2027 forecast. Cost overruns or earlier supplier cash calls would raise the funding need before any revenue shortfall appears.
Margins Rise, and the Costs Below EBITDA Remain
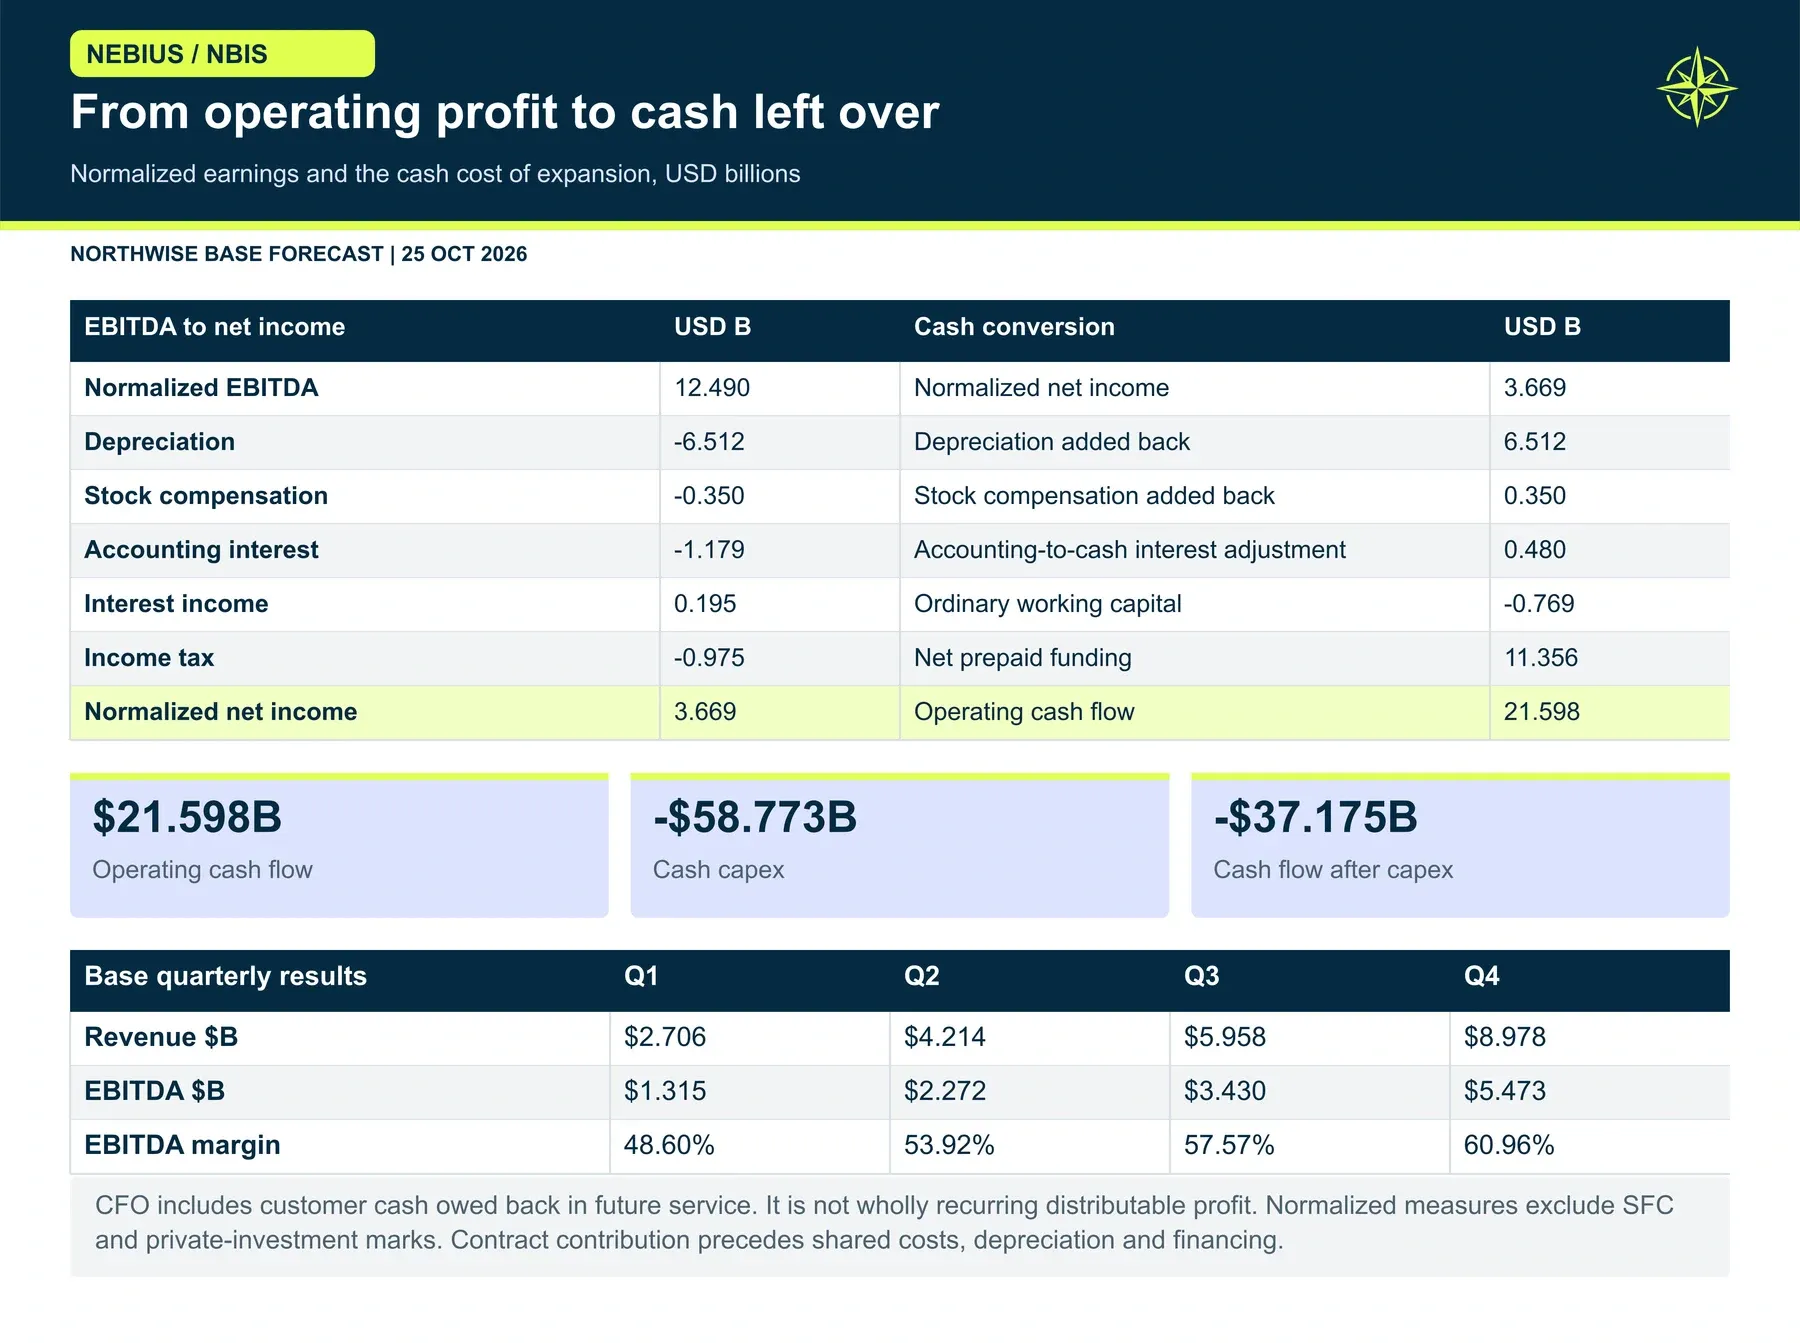
The same revenue dollar looks very different at three levels of the income statement. Following it down shows why an 82% contract margin and a 17% net margin can describe the same business.
Owned-cloud direct contribution is $17.42B on $21.21B of revenue, an 82% margin. Holding costs for installed equipment not yet accepted take $0.07B, and shared and other cloud costs take $4.78B, leaving owned-cloud EBITDA of $12.58B. Adding $0.11B from asset-light operations and subtracting $0.20B of Avride and TripleTen operating losses gives group EBITDA of $12.49B, a 57.1% margin.
The cost structure explains why margins rise through the year. The model carries $4.0B of legacy cash costs, $10.5M per incremental accepted MW-year and $0.75M per unaccepted MW-year of holding cost. As accepted capacity grows faster than the fixed base, group margin climbs from 48.6% in the first quarter to 61.0% in the fourth.
Below EBITDA, the bill is substantial. Depreciation and amortization total $6.51B, stock compensation $0.35B, and net interest $0.98B. After a 21% normalized tax rate, net income is $3.67B, or $8.35 per average diluted share. Quarterly net income runs $0.06B, $0.49B, $1.08B and $2.04B, and that steep ramp becomes important when we turn to valuation.
Our 3.8-point margin advantage over the Street comes from commercial mix and operating scale, and it is the smaller part of our disagreement. CoreWeave reported new-deal contribution margins 5 to 10 points above prior deals in August, which supports the direction. It does not establish Nebius's consolidated margin, and a five-year depreciation life is an accounting choice, not proof that every GPU holds its price for five years.
The Financing Plan Has a Price
Jensen Huang's CNBC interview during GTC covered capital as well as demand. After describing neocloud working capital as short of what the buildout requires, he added: "That's going to get solved." Volozh described capital in similar terms: "it's not a problem, it's a task." The task is large, and every dollar of it carries a cost and a date.
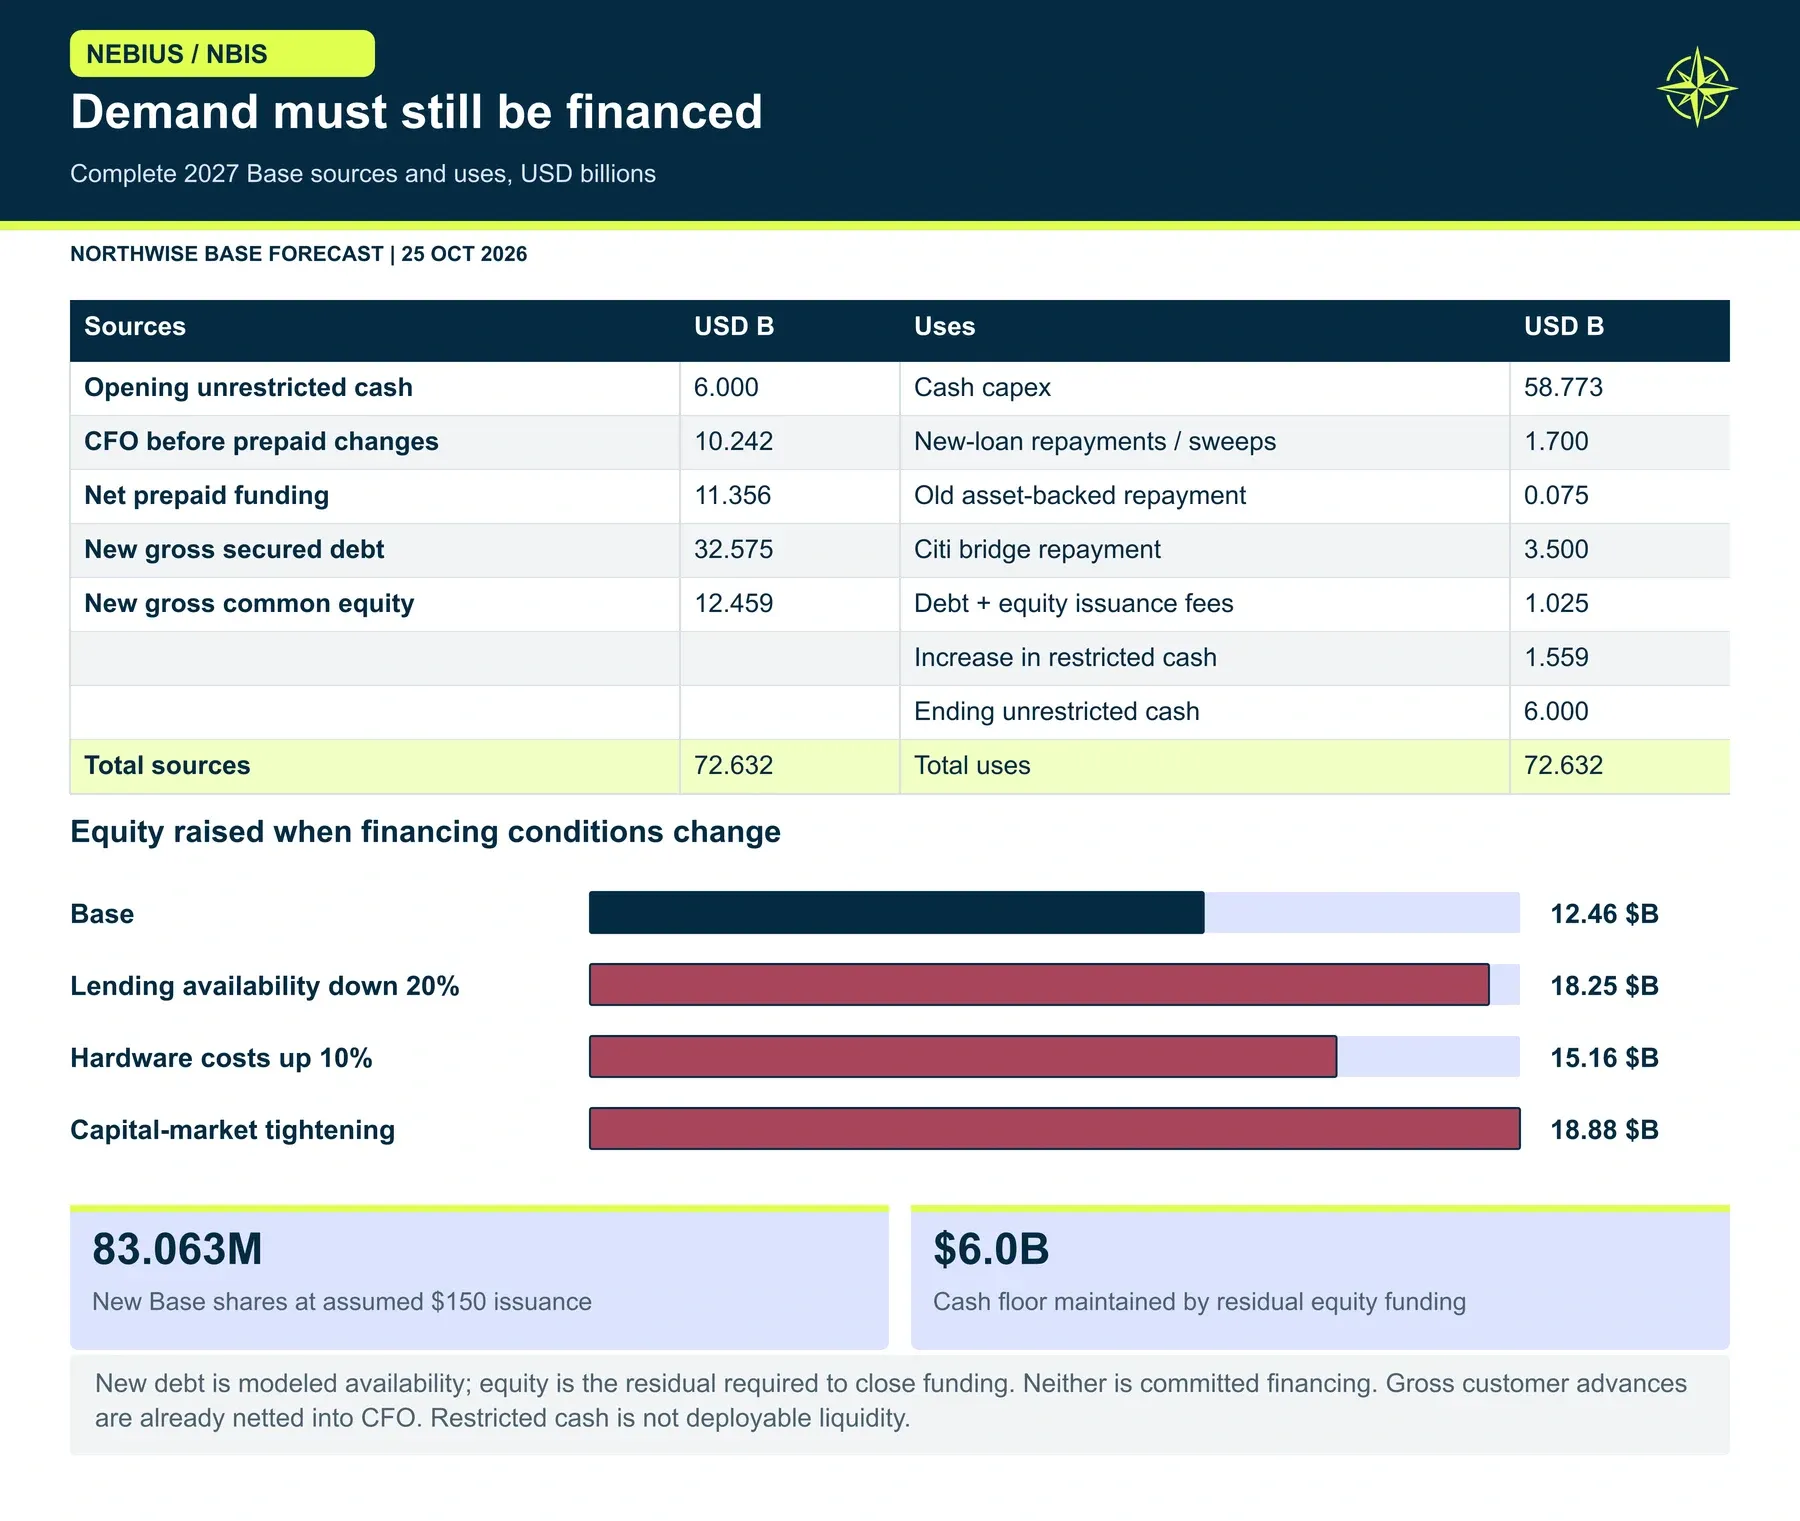
Base 2027 cash sources and uses | $B |
|---|---|
Opening unrestricted cash | 6.00 |
Operating cash flow, including net customer advances | 21.60 |
New secured debt issued | 32.57 |
New common equity issued | 12.46 |
Cash capex | (58.77) |
Repayment of Citi bridge | (3.50) |
New debt principal and collateral sweeps | (1.70) |
Opening asset-backed debt amortization | (0.08) |
Debt and equity issuance fees | (1.03) |
Increase in restricted cash reserves | (1.56) |
Ending unrestricted cash | 6.00 |
Two existing facilities show how Nebius has financed so far. In July it raised $775M of secured debt backed by deployed GPUs and contracted customer cash flows, at SOFR plus 2.50% and maturing in October 2030. In October it signed a $3.5B secured bridge with Citi maturing October 16, 2027, at SOFR plus 2.75% initially, stepping toward 3.50%, with a minimum liquidity covenant. "Sequencing our financing is how we optimize our long-term cost of capital," Nebius's Ophir Nave said in the announcement.
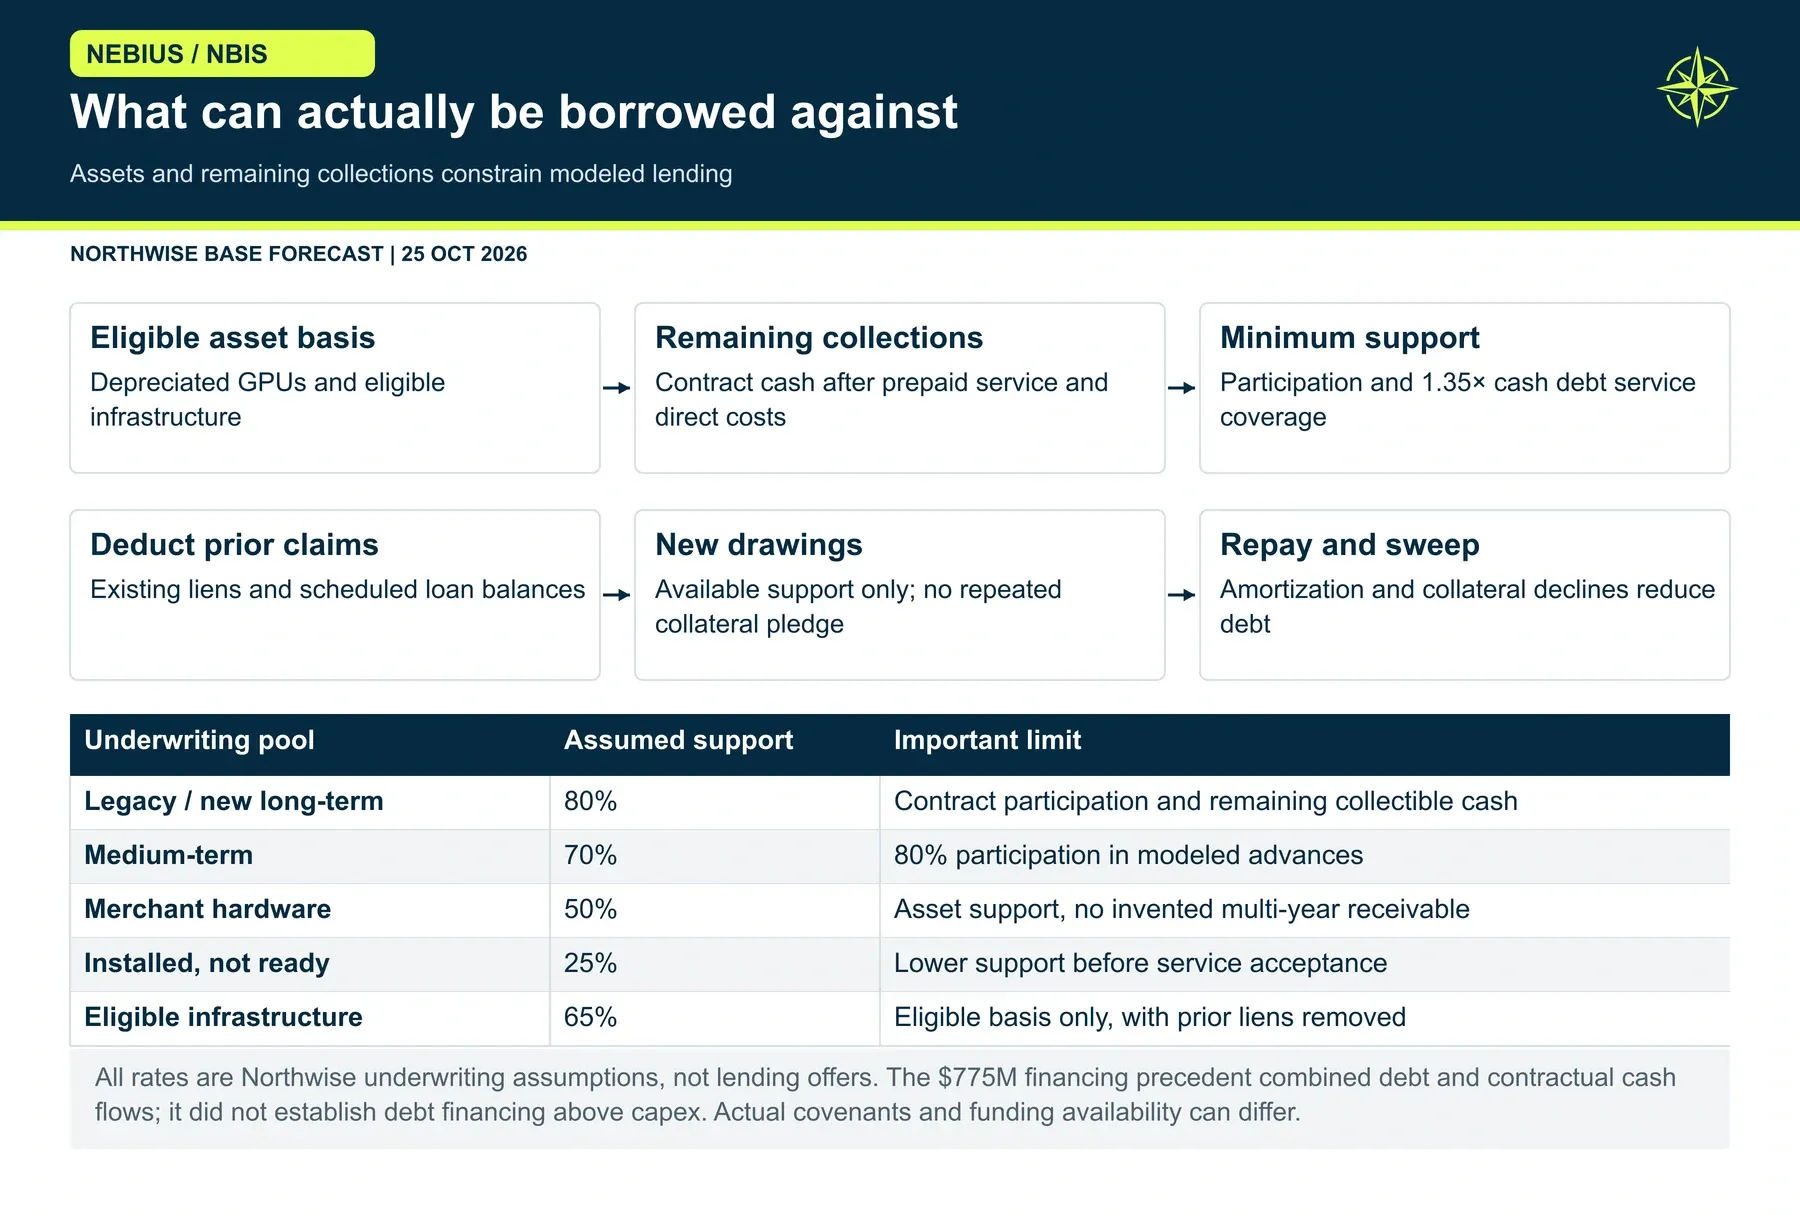
The model refinances the Citi bridge in the third quarter of 2027 and funds the rest of the build through new contract-supported asset financing. New borrowing costs 7.25%, carries 2% issuance fees and a 5% restricted cash reserve, and must meet a 1.35 times debt-service coverage requirement. Borrowing capacity depends on eligible depreciated assets and on remaining contract cash after prepaid releases and direct service costs. An asset appraisal alone does not support a loan in our model.
No lender has committed to these terms; they are our underwriting assumptions. Gross issuance of $32.57B leaves $31.58B of nonconvertible debt at year end, alongside $13.45B of convertible principal. Equity fills whatever debt and customer cash cannot.
If lending availability falls 20%, 2027 equity issuance rises from $12.46B to $18.25B. A combined capital-market tightening, with a 200-basis-point higher borrowing rate, 20% less lending availability and a 20% lower issue price, pushes it to $18.88B. A funding model that fills its gap with equity establishes the arithmetic need. It does not prove the market will supply that equity on those terms.
Lenders and shareholders should both watch one structural assumption. Our asset collateral calculation does not deduct customer advances from equipment value, although contract debt-service cash does net out prepaid releases. A stricter lender could treat prepaid assets less generously, and that would push more of the funding toward equity.
Sources: Citi secured facility; First secured debt facility.
Dilution and the Share Count
A larger business can still mean a smaller slice for each existing share. The question is how many slices the expansion requires.
The share bridge starts with 287.7M common shares, adds 21.1M NVIDIA warrant shares, a 20M reserve for existing equity awards and 68.6M shares from the eight convertible tranches, and includes 3.6M shares from $0.53B of equity modeled in late 2026. That gives 400.9M fully diluted shares entering 2027.
New 2027 issuance of $12.46B at $150 per share adds 83.1M shares, for 483.9M at year end. The diluted share count rises 21% in a single year.
The $150 issue price is an independent financing assumption, deliberately set apart from any valuation output. Raising the same $12.46B at $120 per share would require 103.8M new shares instead of 83.1M. The business can succeed while each original share captures a smaller fraction of that success.
The convertibles total $13.45B of principal across eight tranches, with conversion prices from $51.45 to $324.65. Conversion removes the debt and adds the shares, and both sides must move together. Our share count treats all tranches as converted; for the highest strikes, that classification depends on where the stock trades at the end of 2027.
Two limits apply to the cap table. The 20M award reserve is a convention for existing awards, and $0.35B of stock compensation stays in net income as an expense. We do not model a grant-by-grant vesting schedule for new 2027 awards.
Value Outside the Owned Fleet
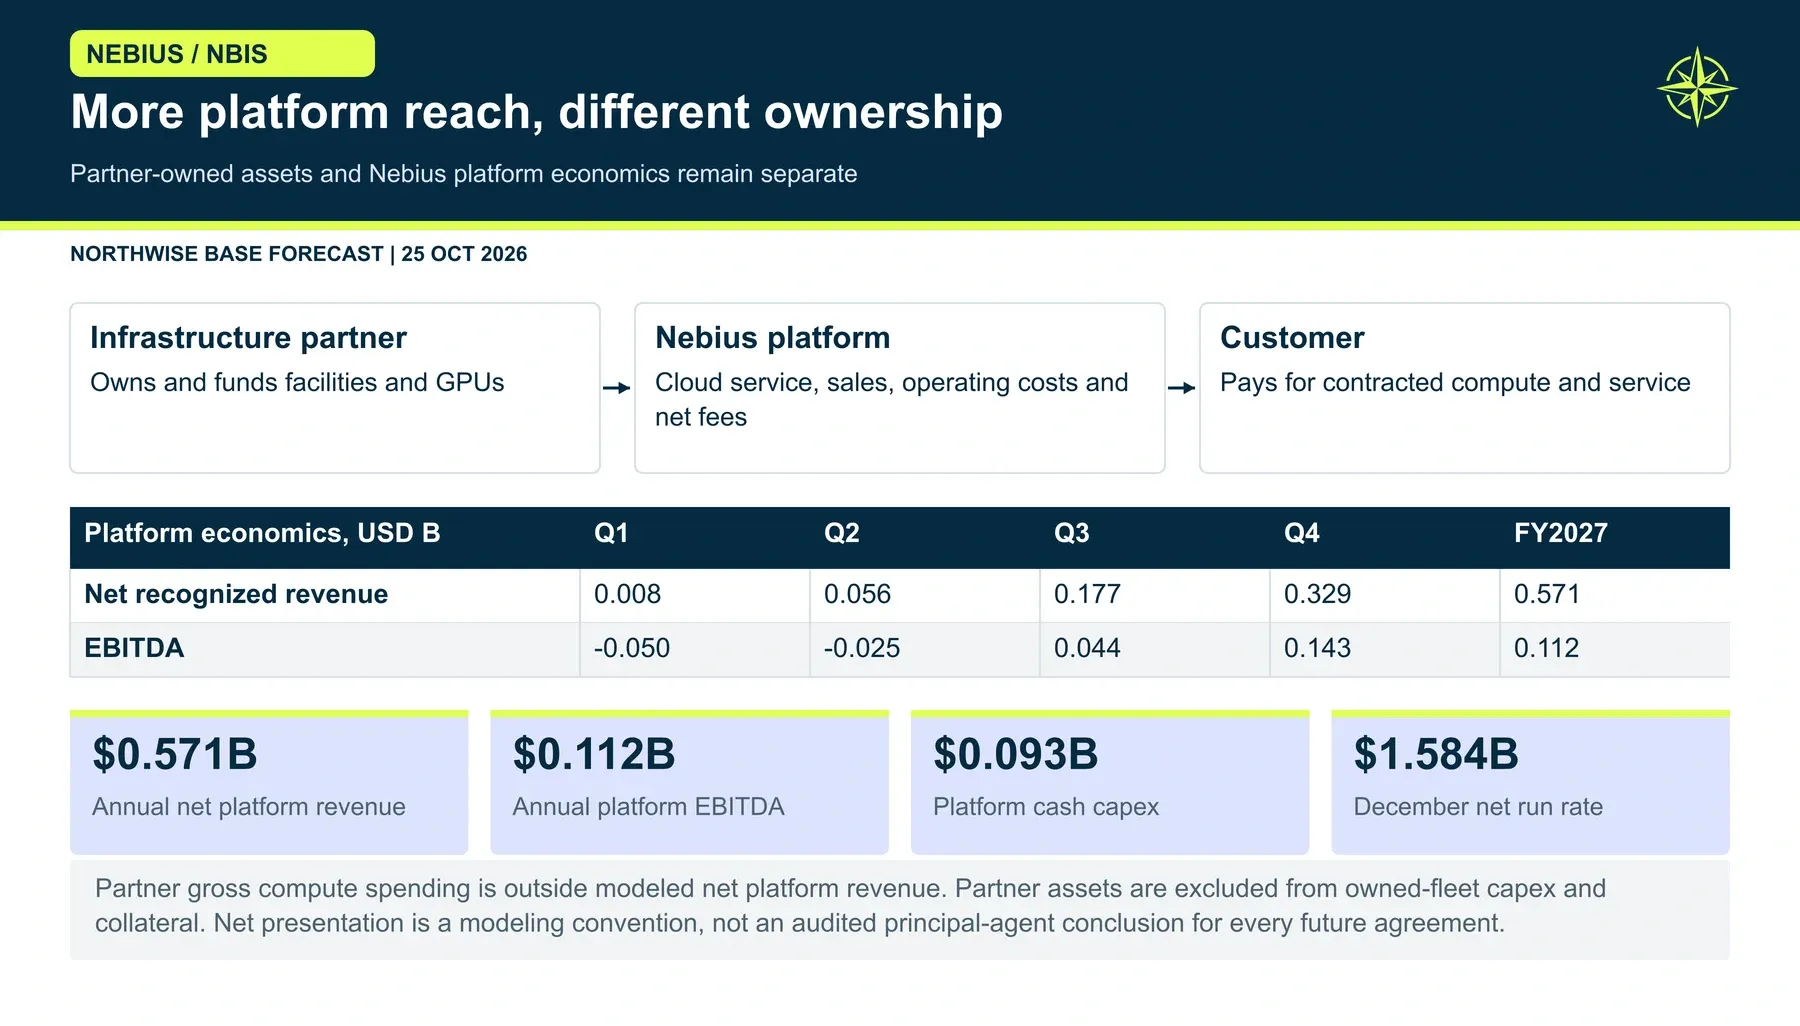
Some of Nebius's growth does not require owning the physical asset. In July the company introduced a partner infrastructure model in which partners own and finance hardware and facilities while Nebius provides architecture, software, support and distribution.
We model that business as a separate bridge and recognize only the net revenue Nebius earns, never the partner's gross compute sales. In the Base case it contributes $0.57B of 2027 revenue, $0.11B of EBITDA and a $1.58B year-end net run rate. It starts the year at a loss, with quarterly EBITDA of negative $0.05B, negative $0.03B, positive $0.04B and positive $0.14B. Bear and Bull scale adoption to 90% and 110% of the Base path.
Asset-light growth is real and modest at this stage. Contract structures vary, and some agreements can shift capital or performance obligations back to Nebius. We do not let it solve the owned-cloud funding gap by assertion.
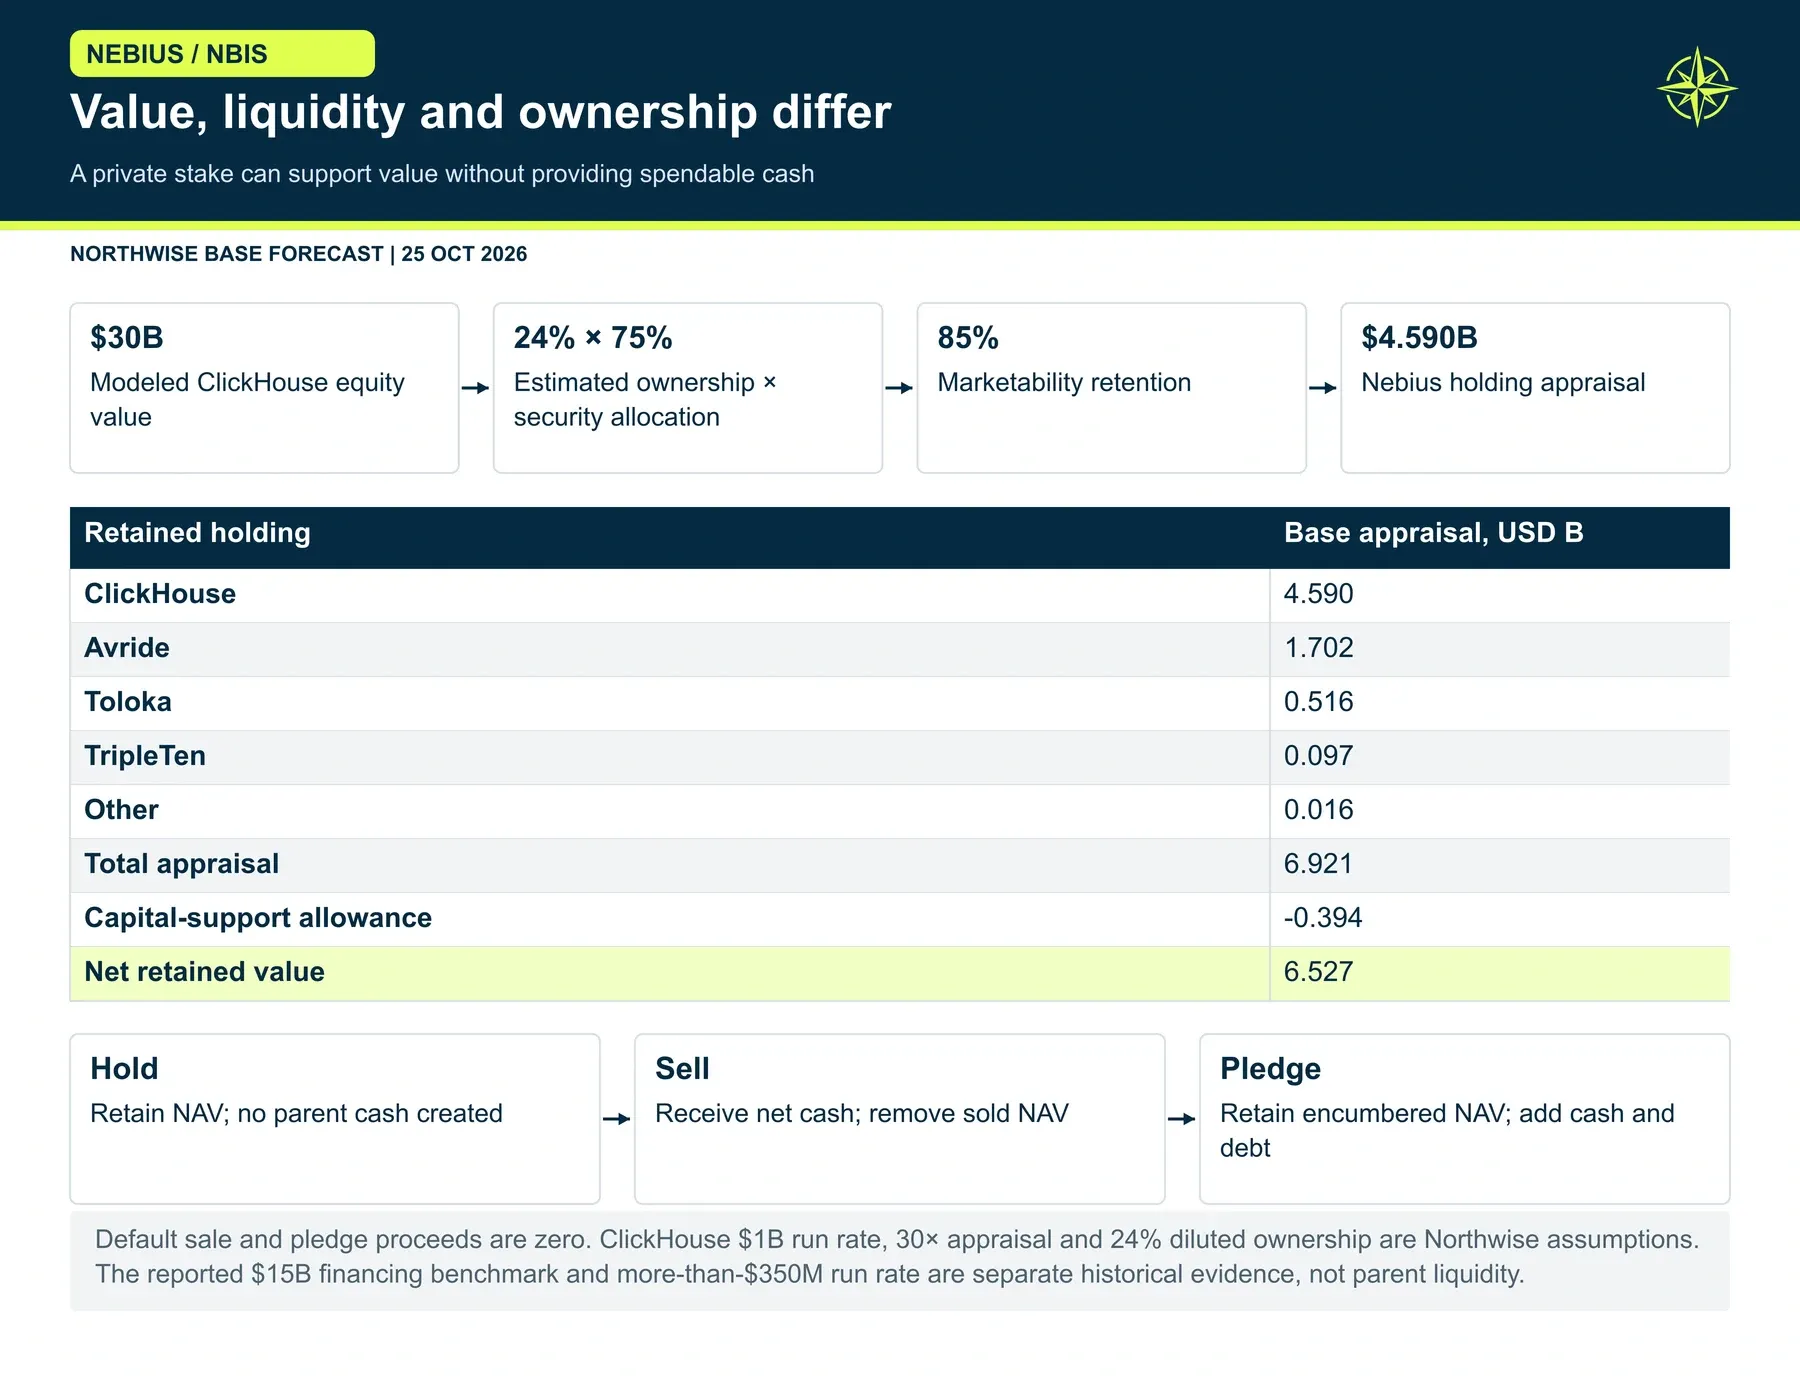
The subsidiary holdings are a different kind of value. ClickHouse raised its Series D at a $15B company valuation in January 2026, reconfirmed in September, and reported a revenue run rate above $350M in September. Our year-end 2027 appraisal assumes a $1B run rate at 30 times, or a $30B company value. Applying an estimated 24% diluted economic ownership, a 75% security allocation factor and a 15% marketability discount gives a Nebius holding value of $4.59B in the Base case.
Avride adds $1.70B, Toloka $0.52B, TripleTen $0.10B and other identified investments $0.02B, for $6.92B in total. We subtract a single $0.39B allowance for future capital support, leaving $6.53B of net retained value in the Base case, $3.77B in Bear and $10.12B in Bull.
Owning part of a valuable private company makes Nebius more valuable, though Nebius cannot spend that company's cash or report its profits as cloud revenue. ClickHouse remeasurement gains stay out of our earnings, and the historical 28% stake and $1.52B carrying value describe different things from our forward appraisal.
Nebius has identified noncore asset monetization as a potential funding source in the past. A sale would convert part of a holding into cash and remove that value; a pledge would keep the holding and add debt. All three cases assume neither, so the holdings support value without quietly funding the build.
Sources: ClickHouse September update; Northwise partner-network research.
Three Cases and the Stress Tests
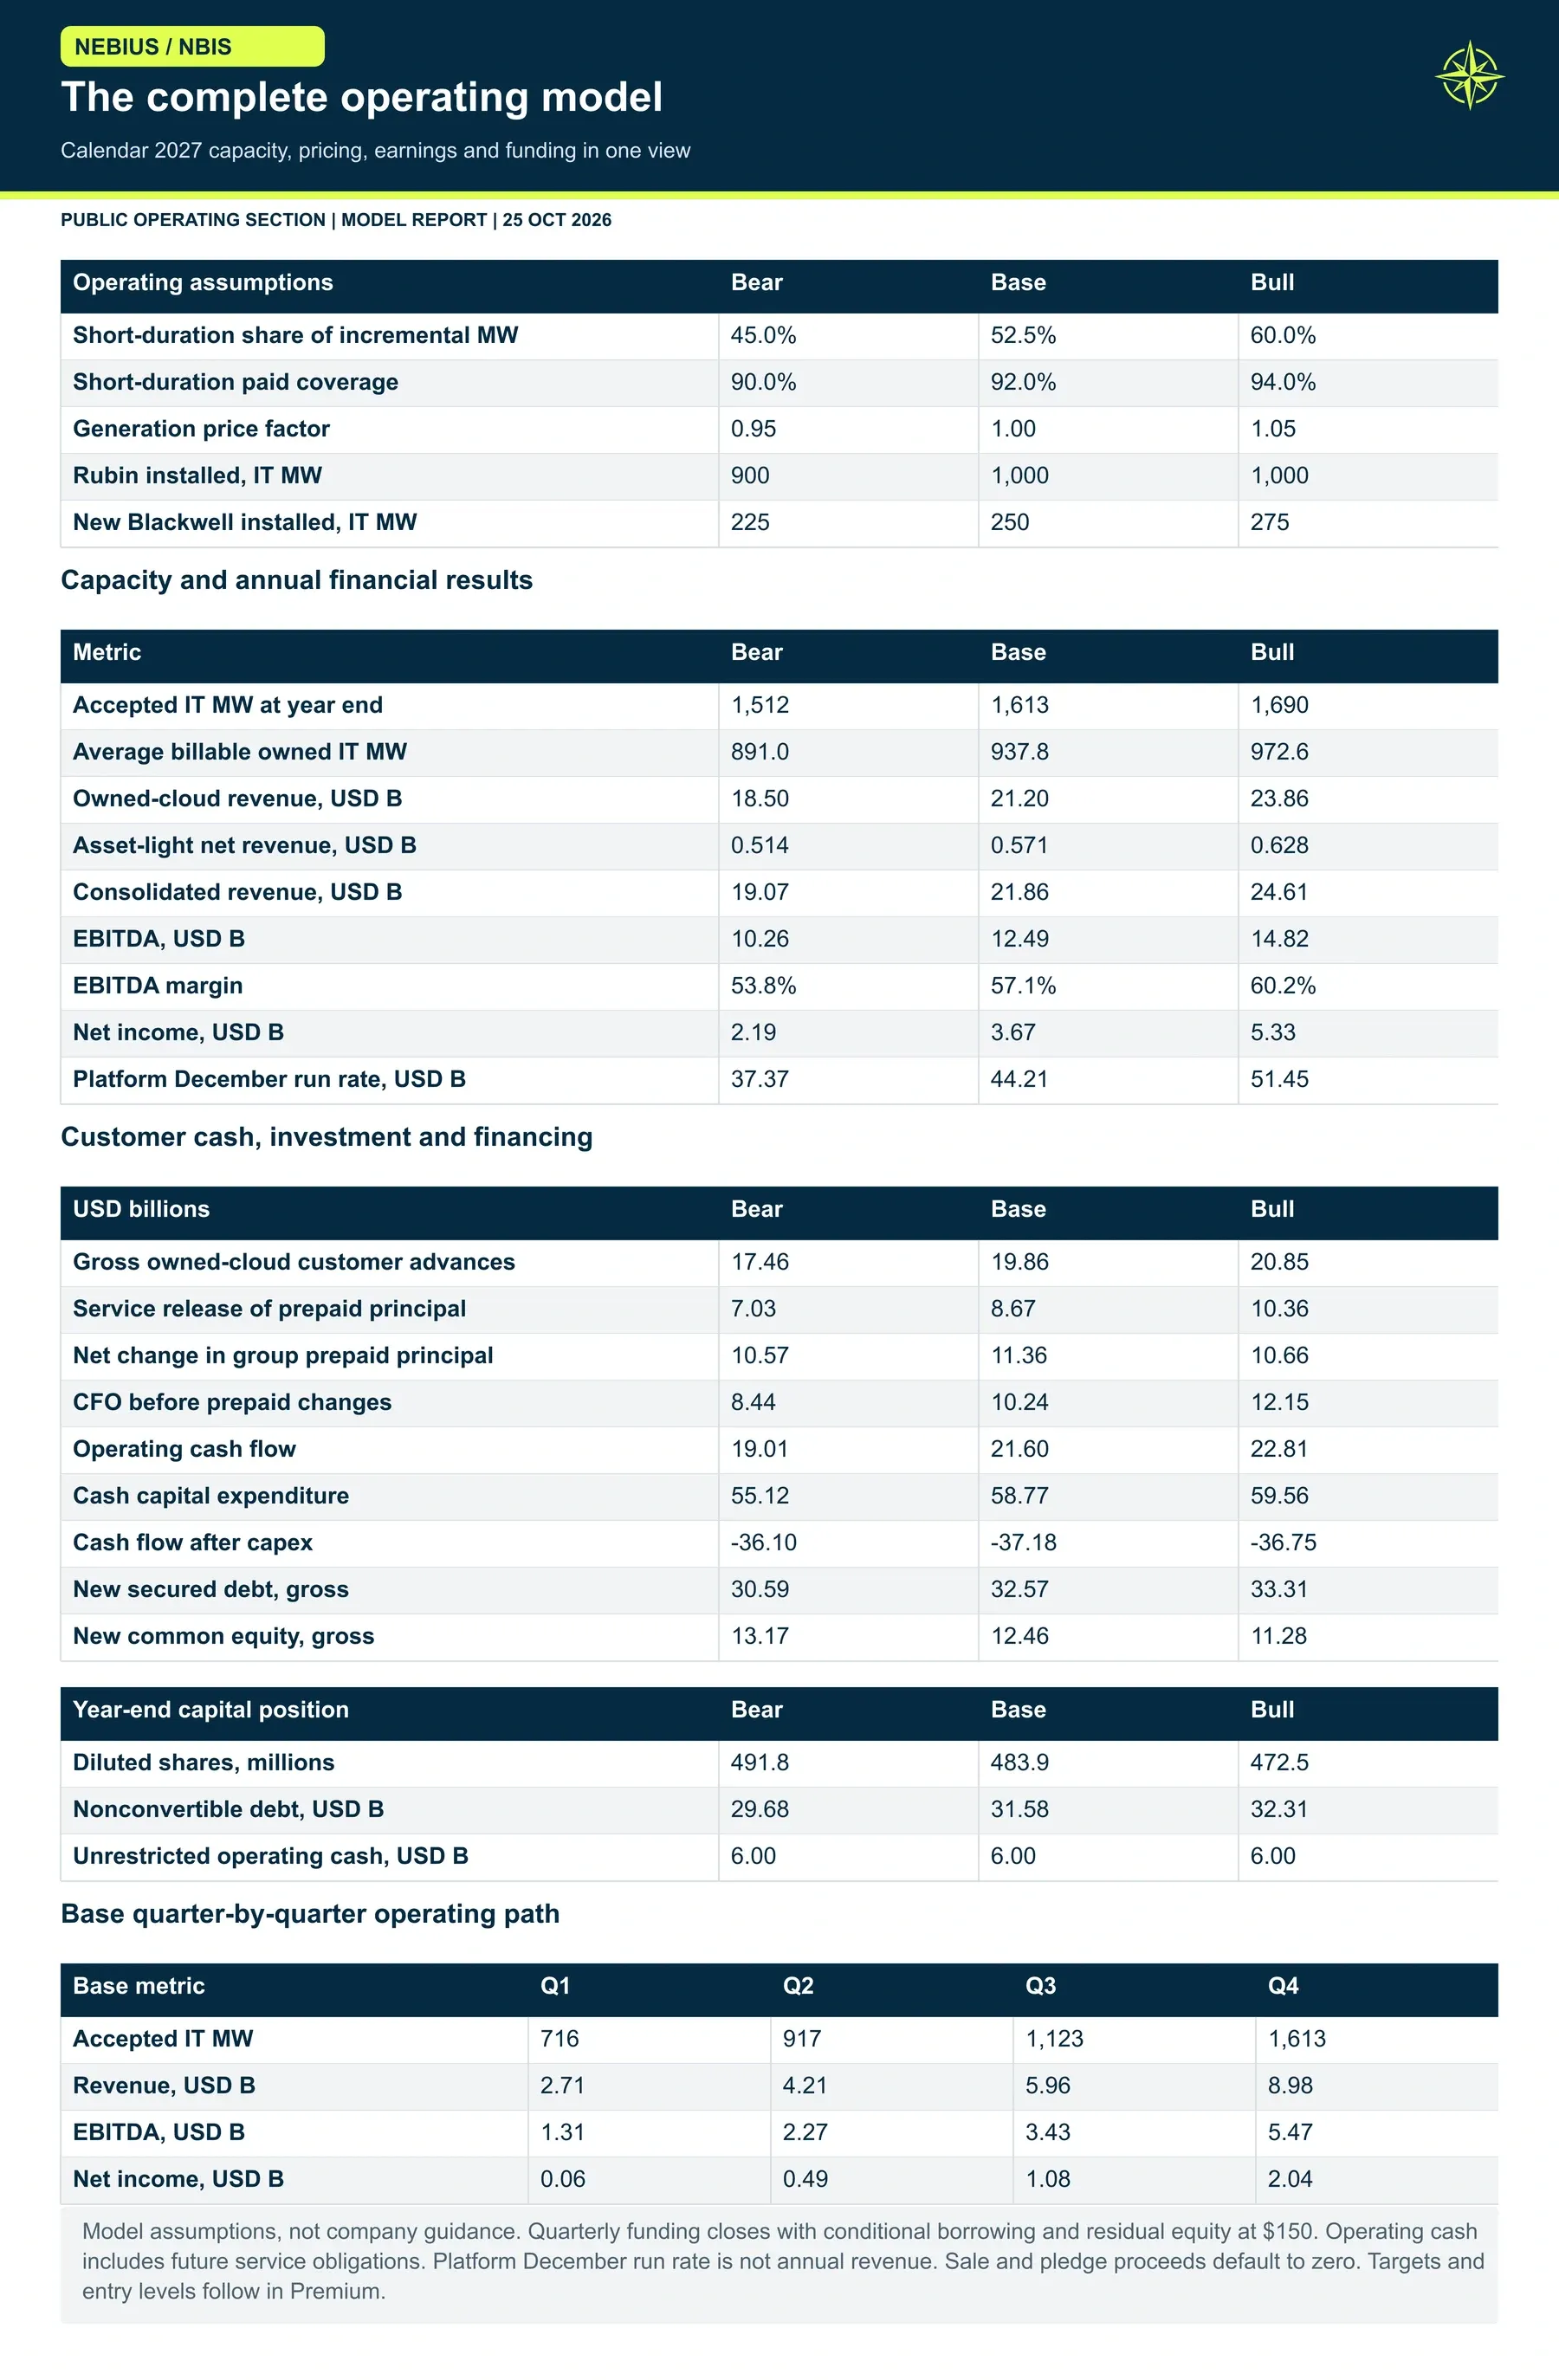
The three operating cases describe a realistic range of execution. They are deliberately narrower than a catastrophe-to-moonshot distribution. They share the site schedule, cost structure and financing terms, and vary the inputs most likely to move during 2027.
Case input | Bear | Base | Bull |
|---|---|---|---|
Short-duration share of incremental accepted MW | 45% | 52.5% | 60% |
Short-duration paid coverage | 90% | 92% | 94% |
Short-duration price factor | 0.95 | 1.00 | 1.05 |
Rubin installed by year end | 900 MW | 1,000 MW | 1,000 MW |
Rubin accepted by year end | 740 MW | 830 MW | 900 MW |
New Blackwell installed by year end | 225 MW | 250 MW | 275 MW |
Asset-light adoption factor | 0.90 | 1.00 | 1.10 |
Acceptance speed and the Meta and landmark ramps also vary by case.
2027 output | Bear | Base | Bull |
|---|---|---|---|
Revenue | $19.07B | $21.86B | $24.61B |
EBITDA | $10.26B | $12.49B | $14.82B |
EBITDA margin | 53.8% | 57.1% | 60.2% |
Net income | $2.19B | $3.67B | $5.33B |
Year-end platform run rate | $37.37B | $44.21B | $51.45B |
Year-end accepted IT MW | 1,512 | 1,613 | 1,690 |
Cash capex | $55.12B | $58.77B | $59.56B |
Operating cash flow | $19.01B | $21.60B | $22.81B |
New secured debt issued | $30.59B | $32.57B | $33.31B |
New equity issued | $13.17B | $12.46B | $11.28B |
Year-end diluted shares | 491.8M | 483.9M | 472.5M |
The Bear case is still a business growing revenue many times over in a single year. Its revenue sits more than 50% above the Street, which tells you how much of the disagreement comes from capacity alone. The Bear case also raises the most equity, as lower operating cash and similar capex leave more to fund.
We weight the cases 30%, 40% and 30%. Those weights are editorial judgment about a balanced range, not statistically fitted frequencies, and they do not capture every severe outcome.
Single-factor stresses isolate risks that the cases share. Measured by the equity Nebius would need to raise in 2027, against $12.46B in the Base case:
Stress, Base case | 2027 equity issued |
|---|---|
Merchant pricing down 10% | $13.74B |
Merchant pricing down 20% | $15.03B |
Hardware costs up 10% | $15.16B |
New debt rate up 200 basis points | $13.24B |
Lending availability down 20% | $18.25B |
Merchant paid coverage down 5 points | $13.34B |
Long and medium-term advances down 15 points | $13.86B |
Merchant pricing down 10% and hardware up 10% | $16.44B |
Capital-market tightening | $18.88B |
Merchant pricing up 10% | $11.18B |
Lenders matter more than prices for the share count. A 20% drop in lending availability adds more equity need than a 20% drop in merchant pricing.
Some risks are correlated in ways separate stresses cannot show. A commissioning delay with fixed capex, lower prices with expensive hardware, tighter lending with a lower issue price, a large customer renegotiating, or stricter collateral treatment could arrive together. We treat those combinations as monitoring priorities and do not claim to have priced them.
The Evidence That Would Change Our Mind
A forecast earns credibility by stating what would force a revision. The checklist below follows the order of the model, starting with Nebius's third-quarter results in November.
On capacity, the key disclosures are connected power versus critical IT power, installed versus accepted systems, site-level commissioning dates, the split between Rubin and Blackwell, and any progress on the unlocated cohort. Pennsylvania's October 2027 phase and the Independence tranche are the two dates we would watch most closely.
On commercial economics, we want signed dedicated MW, the actual duration mix, revenue per MW by cohort, advance participation, six-month prepaid pricing and renewal discounts. Booked commitments carry far more weight than auction opportunities.
On financial execution, the comparison points are cash capex, supplier deposits, construction in progress, customer advance receipts and releases, restricted cash, debt fees, covenants, borrowing costs and equity issue prices. The Citi refinancing in 2027 is the first hard test of the funding sequence.
On margins and accounting, we want direct contribution separated from adjusted EBITDA, useful-life policies, service credits, maintenance needs and stock compensation grants. On the holdings, updated ClickHouse ownership, security rights and any monetization permissions would sharpen the appraisal.
Quotes from leadership carry less weight than evidence that hardware was accepted, customers paid the modeled price and cash arrived on schedule. A delay in acceptance or a worse funding deal would move our numbers even if management continued to describe demand as unconstrained.
Where This Leaves Us
Power and equipment become accepted capacity. Contracts determine the price and the timing of cash. Customer advances and lenders fund the next phase. Share issuance determines how much of the result belongs to today's shareholders.
Three judgments carry the most weight: how quickly capacity is commissioned and accepted, what short-duration capacity actually earns over a full year, and what capital costs when Nebius needs it. Each has evidence behind it, and each remains open.
The lower-priced dedicated contracts are part of the strategy. They fund the expansion, anchor the lenders and leave room for higher-priced short-duration capacity on top. Older and newer GPU generations coexist in the same fleet without every generation earning the Rubin price.
Our view is that the Street is underwriting a smaller 2027 than Nebius is building. If commissioning holds and the funding market stays open, 2027 revenue lands far above published estimates, and the per-share question becomes one of price paid and capital cost. Nebius can grow much faster than consensus and still require careful valuation, and the stock's price has to account for the capital that growth consumes.
The 100 MW decision has no single correct answer. Nebius is making both choices at once, at a scale and speed few companies have attempted.
Readers who want our price targets, the valuation bridges behind them and the entry prices they imply will find them in the premium section that follows. It carries the same evidence standards into the question every shareholder ultimately has to answer: what is this 2027 worth today.
Northwise Premium
Choose how to continue with Northwise
Join Northwise Premium
Unlock the rest of this report, its complete valuation, the downloadable model, portfolios, and action framework.
Join Northwise PremiumCreate a Free Account
Continue across Free Northwise research, follow companies, save reports, and receive updates.
Create a Free Account
Nebius Asset-Light Business Model: The Cloud Someone Else Pays to Build
How Nebius can earn cloud fees on partner-owned GPUs. Explore owner economics, Palantir, cash flow and our 2030 asset-light scenarios in this free report.
Understanding Nebius: A Complete Guide to the Company
Understand Nebius from the ground up: its AI cloud, competitors, subsidiaries, funding, and growth opportunities. A complete NBIS guide with 14 illustrations.
Nebius in Europe: Sovereign AI, UK Expansion and Harlow
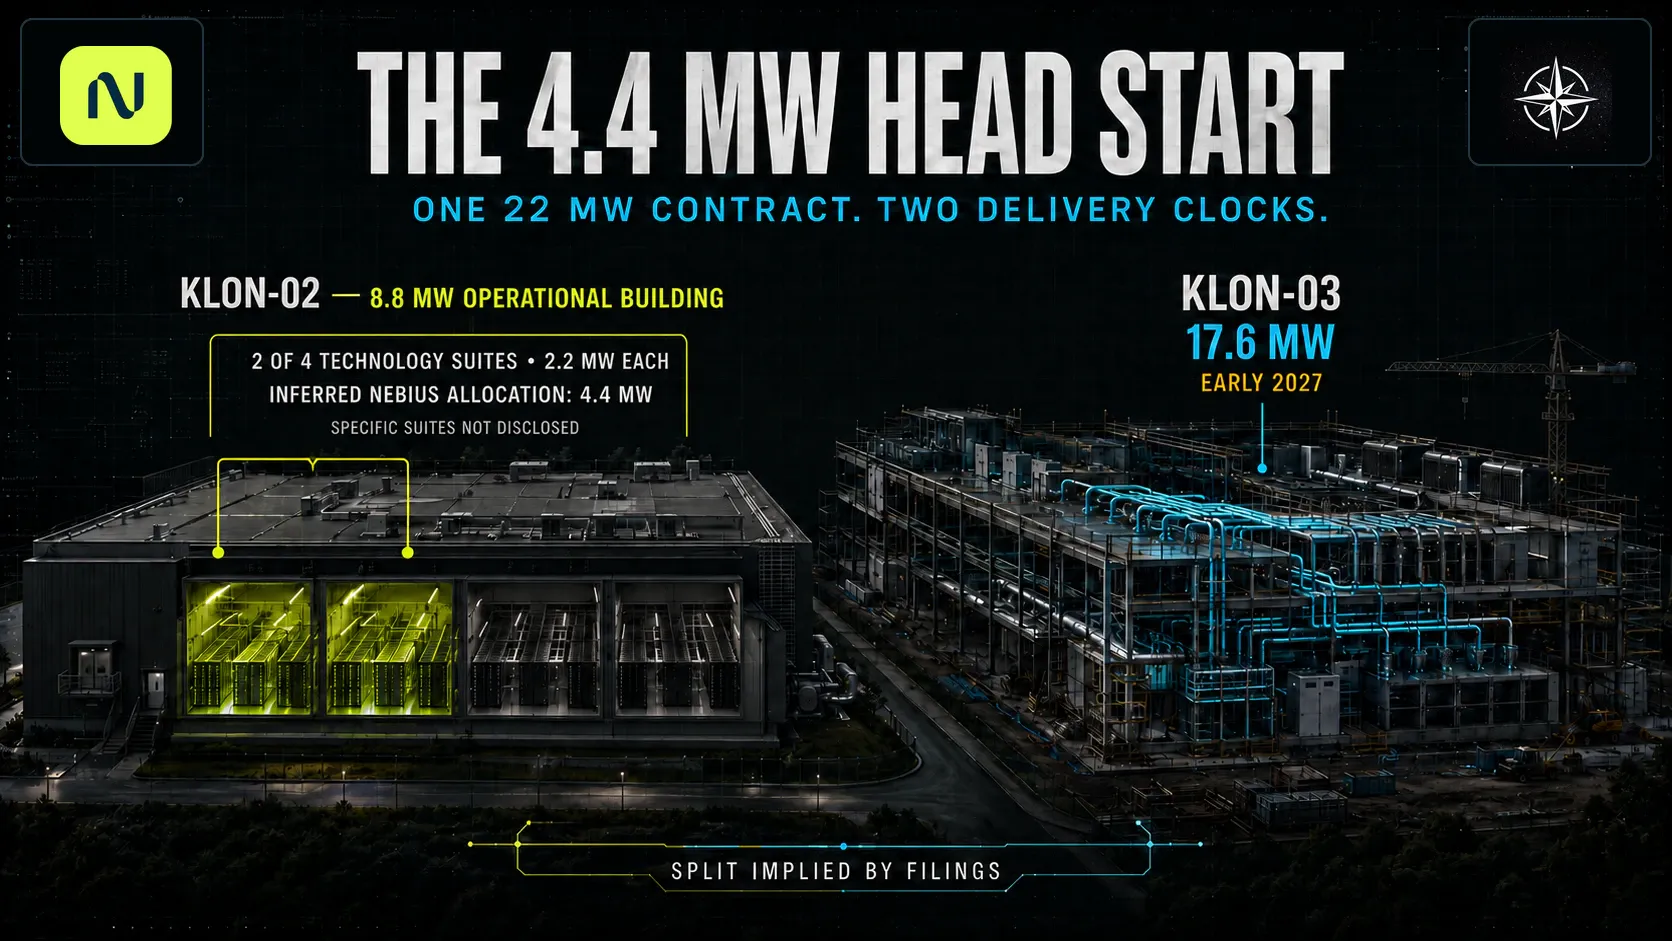
How European AI sovereignty supports Nebius’s UK expansion, where Harlow fits, and what its potential 4.4 MW deployment could add to Q3 revenue and 2026 ARR.
Northwise Portfolios
See how the research becomes real decisions
Reader discussion
Discuss the research
Premium access is required to join this report's discussion.
Join Northwise Premium
No comments yet. Start a thoughtful discussion.