Nebius Asset-Light Business Model: The Cloud Someone Else Pays to Build
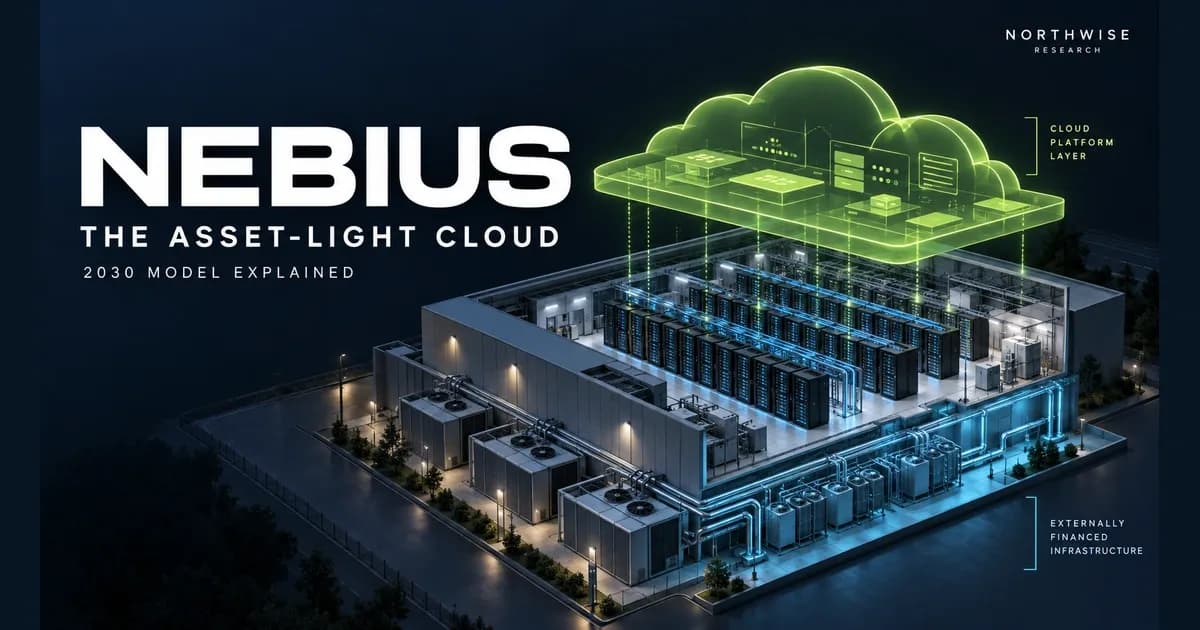
How Nebius can earn cloud fees on partner-owned GPUs. Explore owner economics, Palantir, cash flow and our 2030 asset-light scenarios in this free report.
In this article
Nebius wants partners to finance the data centers and GPUs while it runs the cloud on top and collects the fees. We studied the stack, the market lanes and the partnerships, then modeled the business deal by deal. The opportunity could be unusually profitable, though it may arrive slower, and at a thinner fee, than its strongest supporters expect.
Northwise Research | October 2026 | Full report free; companion Excel workbook Premium.
October 17, 2026
A note from the founder
As I wrote in my pinned post this week, Nebius remains my highest-conviction investment and is once again the largest holding in our portfolios. I have been putting cash to work in our flagship and Active Growth portfolios during this correction, and my conviction in the long-term opportunity has strengthened.
I see a company with exceptional demand, improving revenue potential per megawatt and more ways to bring capacity online sooner. New hardware, including Vera Rubin, could raise the earning power of future deployments. Brownfield acquisitions and colocation could bring revenue forward, while Token Factory and the wider software stack give customers more reasons to choose Nebius.
The capital bill will be substantial. My confidence also rests on management's ability to fund that growth through a mix of cash, debt, convertibles and other financing options. I am watching the next results closely for what management says about 2027 revenue capacity and the investment needed to deliver it.
The asset-light business adds another reason to study the software platform carefully. Partners can fund the physical infrastructure while Nebius earns from operating the cloud and serving customers. How much of that value reaches shareholders depends on the fees owners can afford and the service Nebius can keep delivering. This report works through those economics in detail. They are an important part of why I believe the market continues to underestimate what Nebius is building.
Management has provided limited concrete detail on the asset-light program so far. Much of the model therefore rests on our assumptions about contract terms, fees, partner returns and delivery. I expect us to develop and revise it repeatedly over the next several quarters as Nebius provides more detail and actual projects take shape. Treat the results as a framework for understanding what the business could become, with conclusions that will evolve alongside the evidence.
Tyler
Founder, Northwise
The most important sentence in Nebius's expansion plan says nothing about gigawatts. It says something about who signs the purchase order for the hardware.
For most of the past 2 years, the AI cloud trade has been a bet on who can buy GPUs fastest. The next question is who can finance the hardware, replace it when it ages and still earn an acceptable return. Moving that bill to an outside owner does not make it disappear. It changes whose economics must work.
Nebius has built demand through multibillion-dollar contracts with Microsoft and Meta, a $2 billion investment from NVIDIA and rapid revenue growth. The capital question is harder, and in July 2026 the company offered a new answer: let someone else own the hardware.
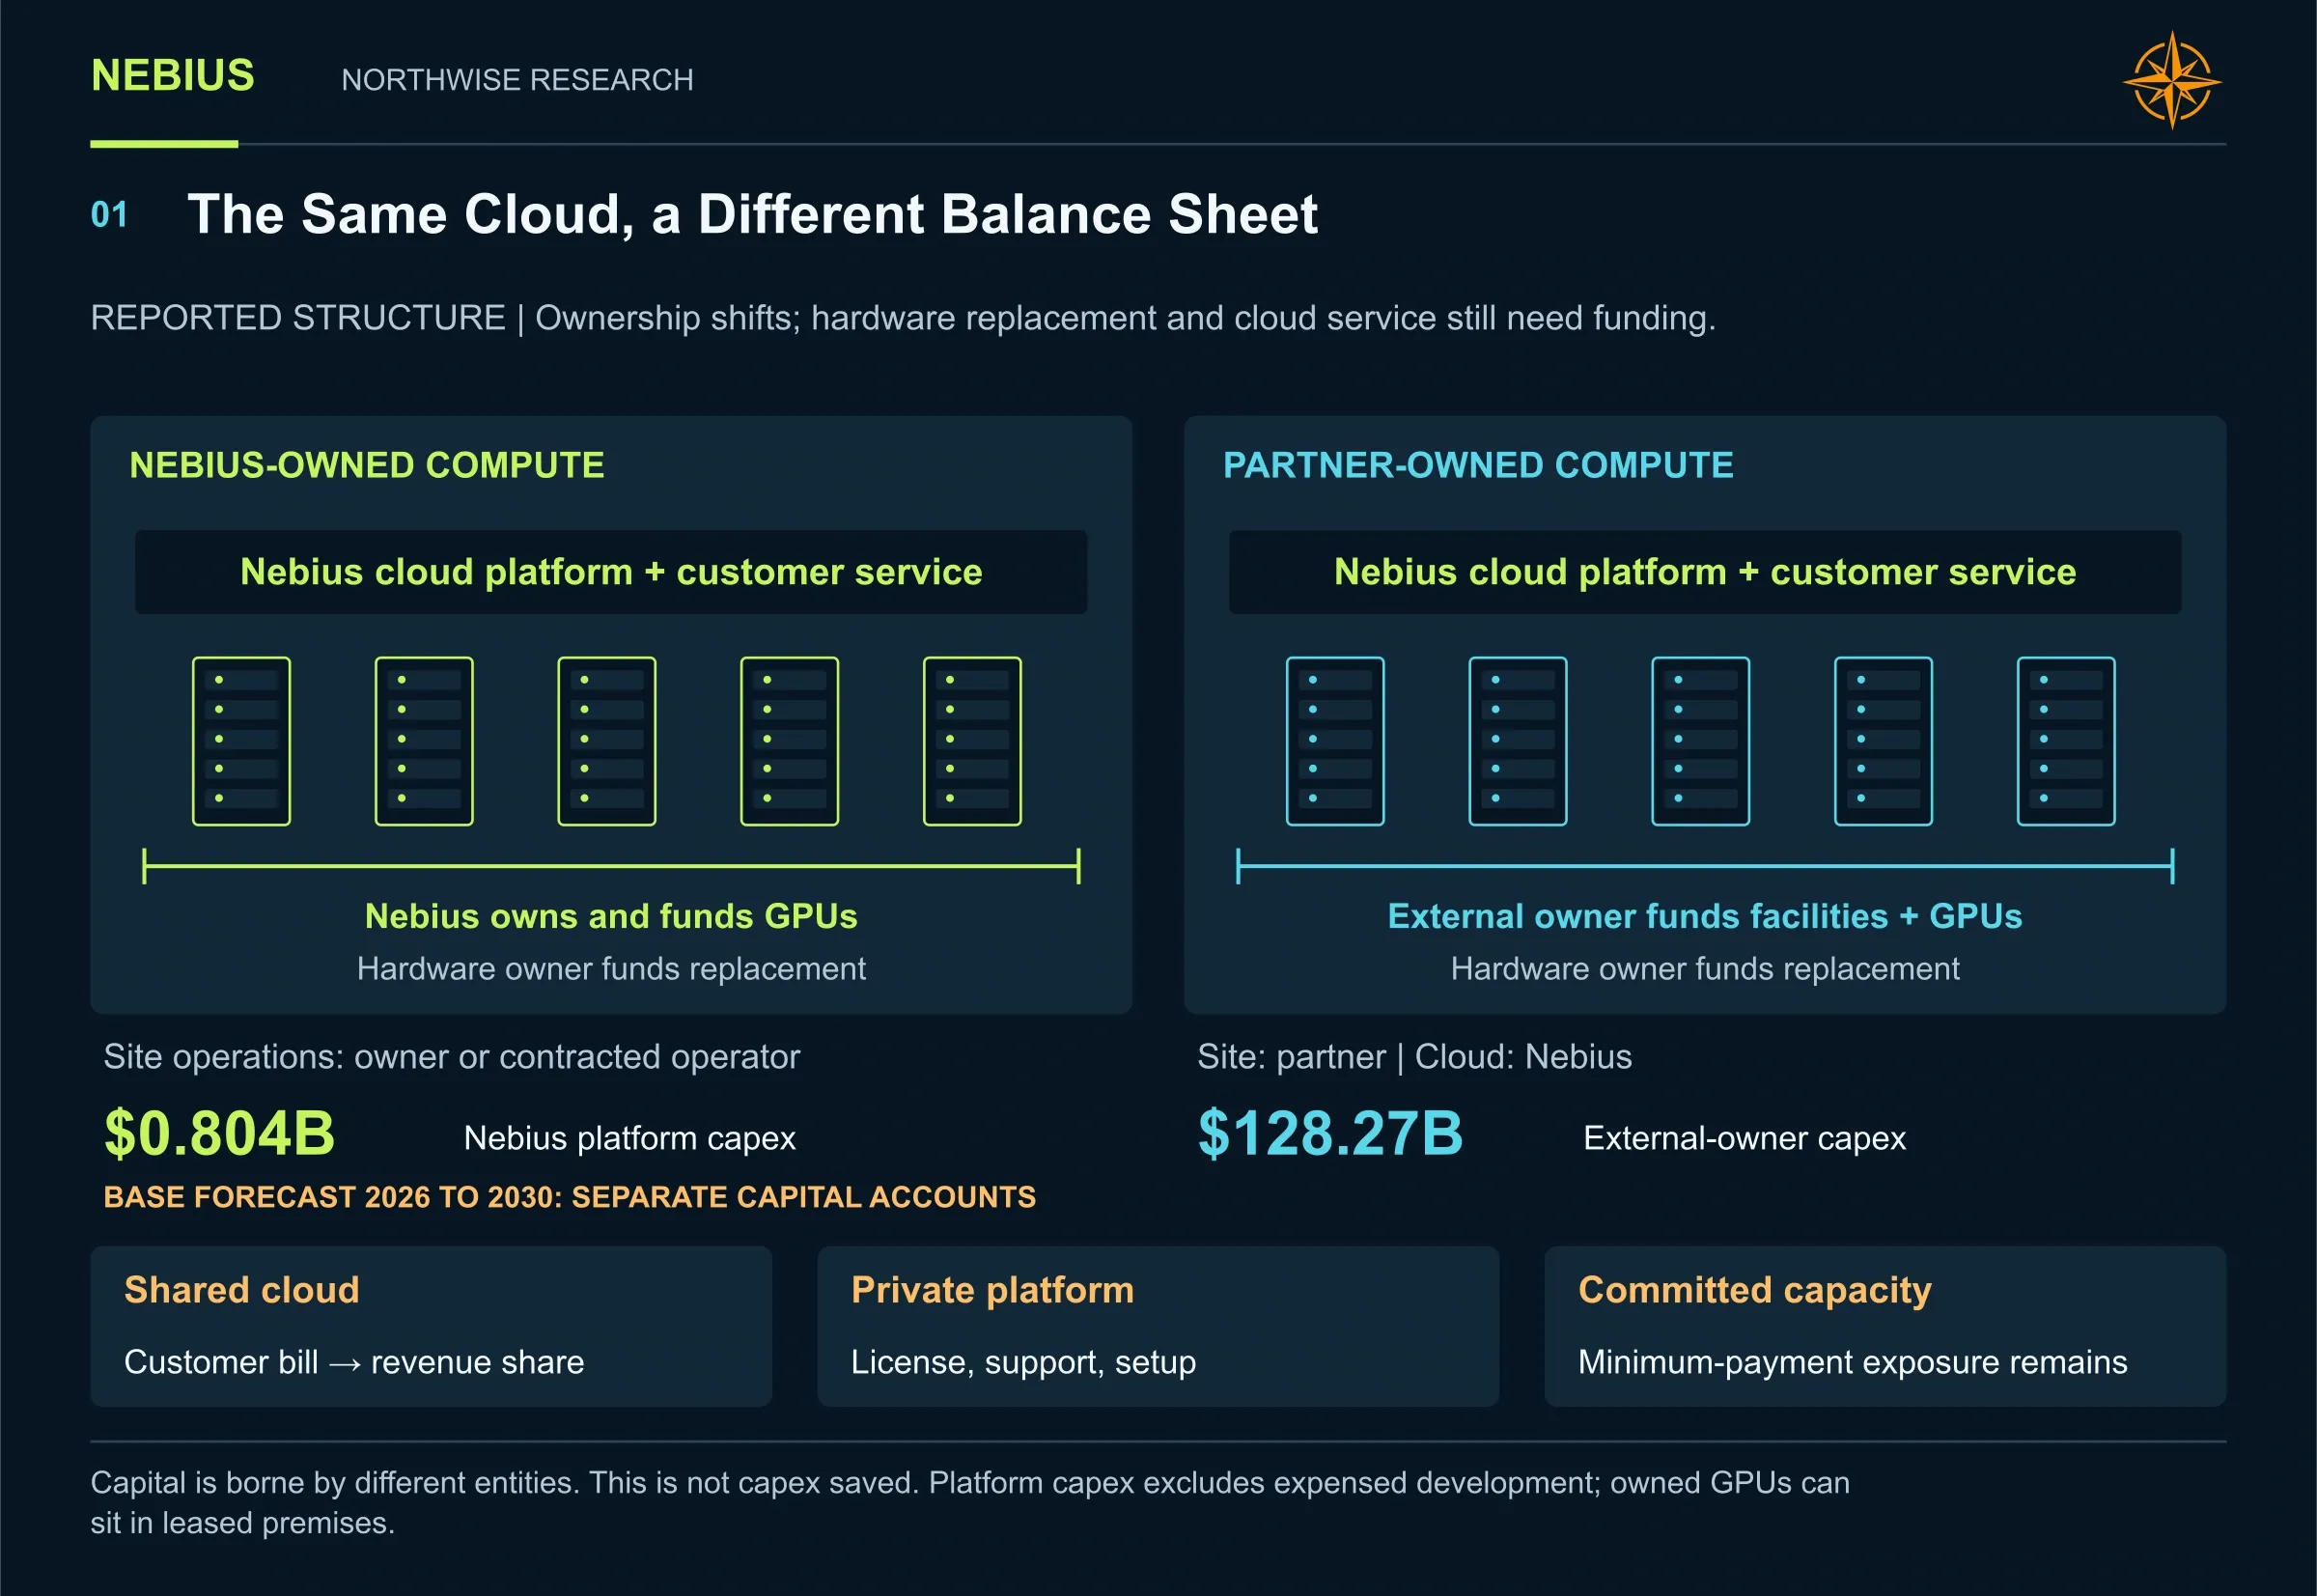
Under the partnership model Nebius introduced in July, an outside partner finances and owns the facility and the GPUs. Nebius designs the site, supplies the platform, runs the cloud standard and brings the customers, then keeps a share of what those customers pay.
Bulls see a software-like fee stream attached to the scarcest asset in technology. Bears see a middleman whose cut shrinks as soon as partners learn to run clouds themselves. We think both camps hold part of the truth, and the rest of this piece is our attempt to work out how large each part is.
Nebius in 2026: the company behind the model
Nebius is the international business that remained after Yandex sold its Russian operations in 2024. It kept much of the engineering talent behind Yandex's cloud and search infrastructure, relisted on Nasdaq, moved its headquarters to Amsterdam and pointed the whole company at a single market: computing infrastructure for artificial intelligence.
The core business rents large clusters of NVIDIA GPUs to AI labs and technology companies, along with the software and services that make those clusters useful. Its Q2 shareholder letter describes the large Microsoft and Meta commitments, NVIDIA support and the scale of the planned buildout. For a broader introduction to the company, see our complete Nebius guide.
Q2 2026 revenue reached $582 million, up 454% year over year, with $236 million of adjusted EBITDA. Large customer commitments create demand visibility, but they do not remove customer concentration or the need to finance delivery.
The cost of that growth is visible in the Q2 shareholder letter. Nebius spent about $5.7 billion on capex in the quarter. Customer prepayments, equipment financing and corporate funding help pay for that expansion, but they also create obligations that must be met as capacity comes online.
Every owned megawatt has to be paid for before it earns a dollar. The capital bill explains why the stock trades on financing headlines almost as much as on demand, and why a model that moves the hardware bill onto someone else's balance sheet could change how the whole company is valued.
What Nebius actually sells, layer by layer
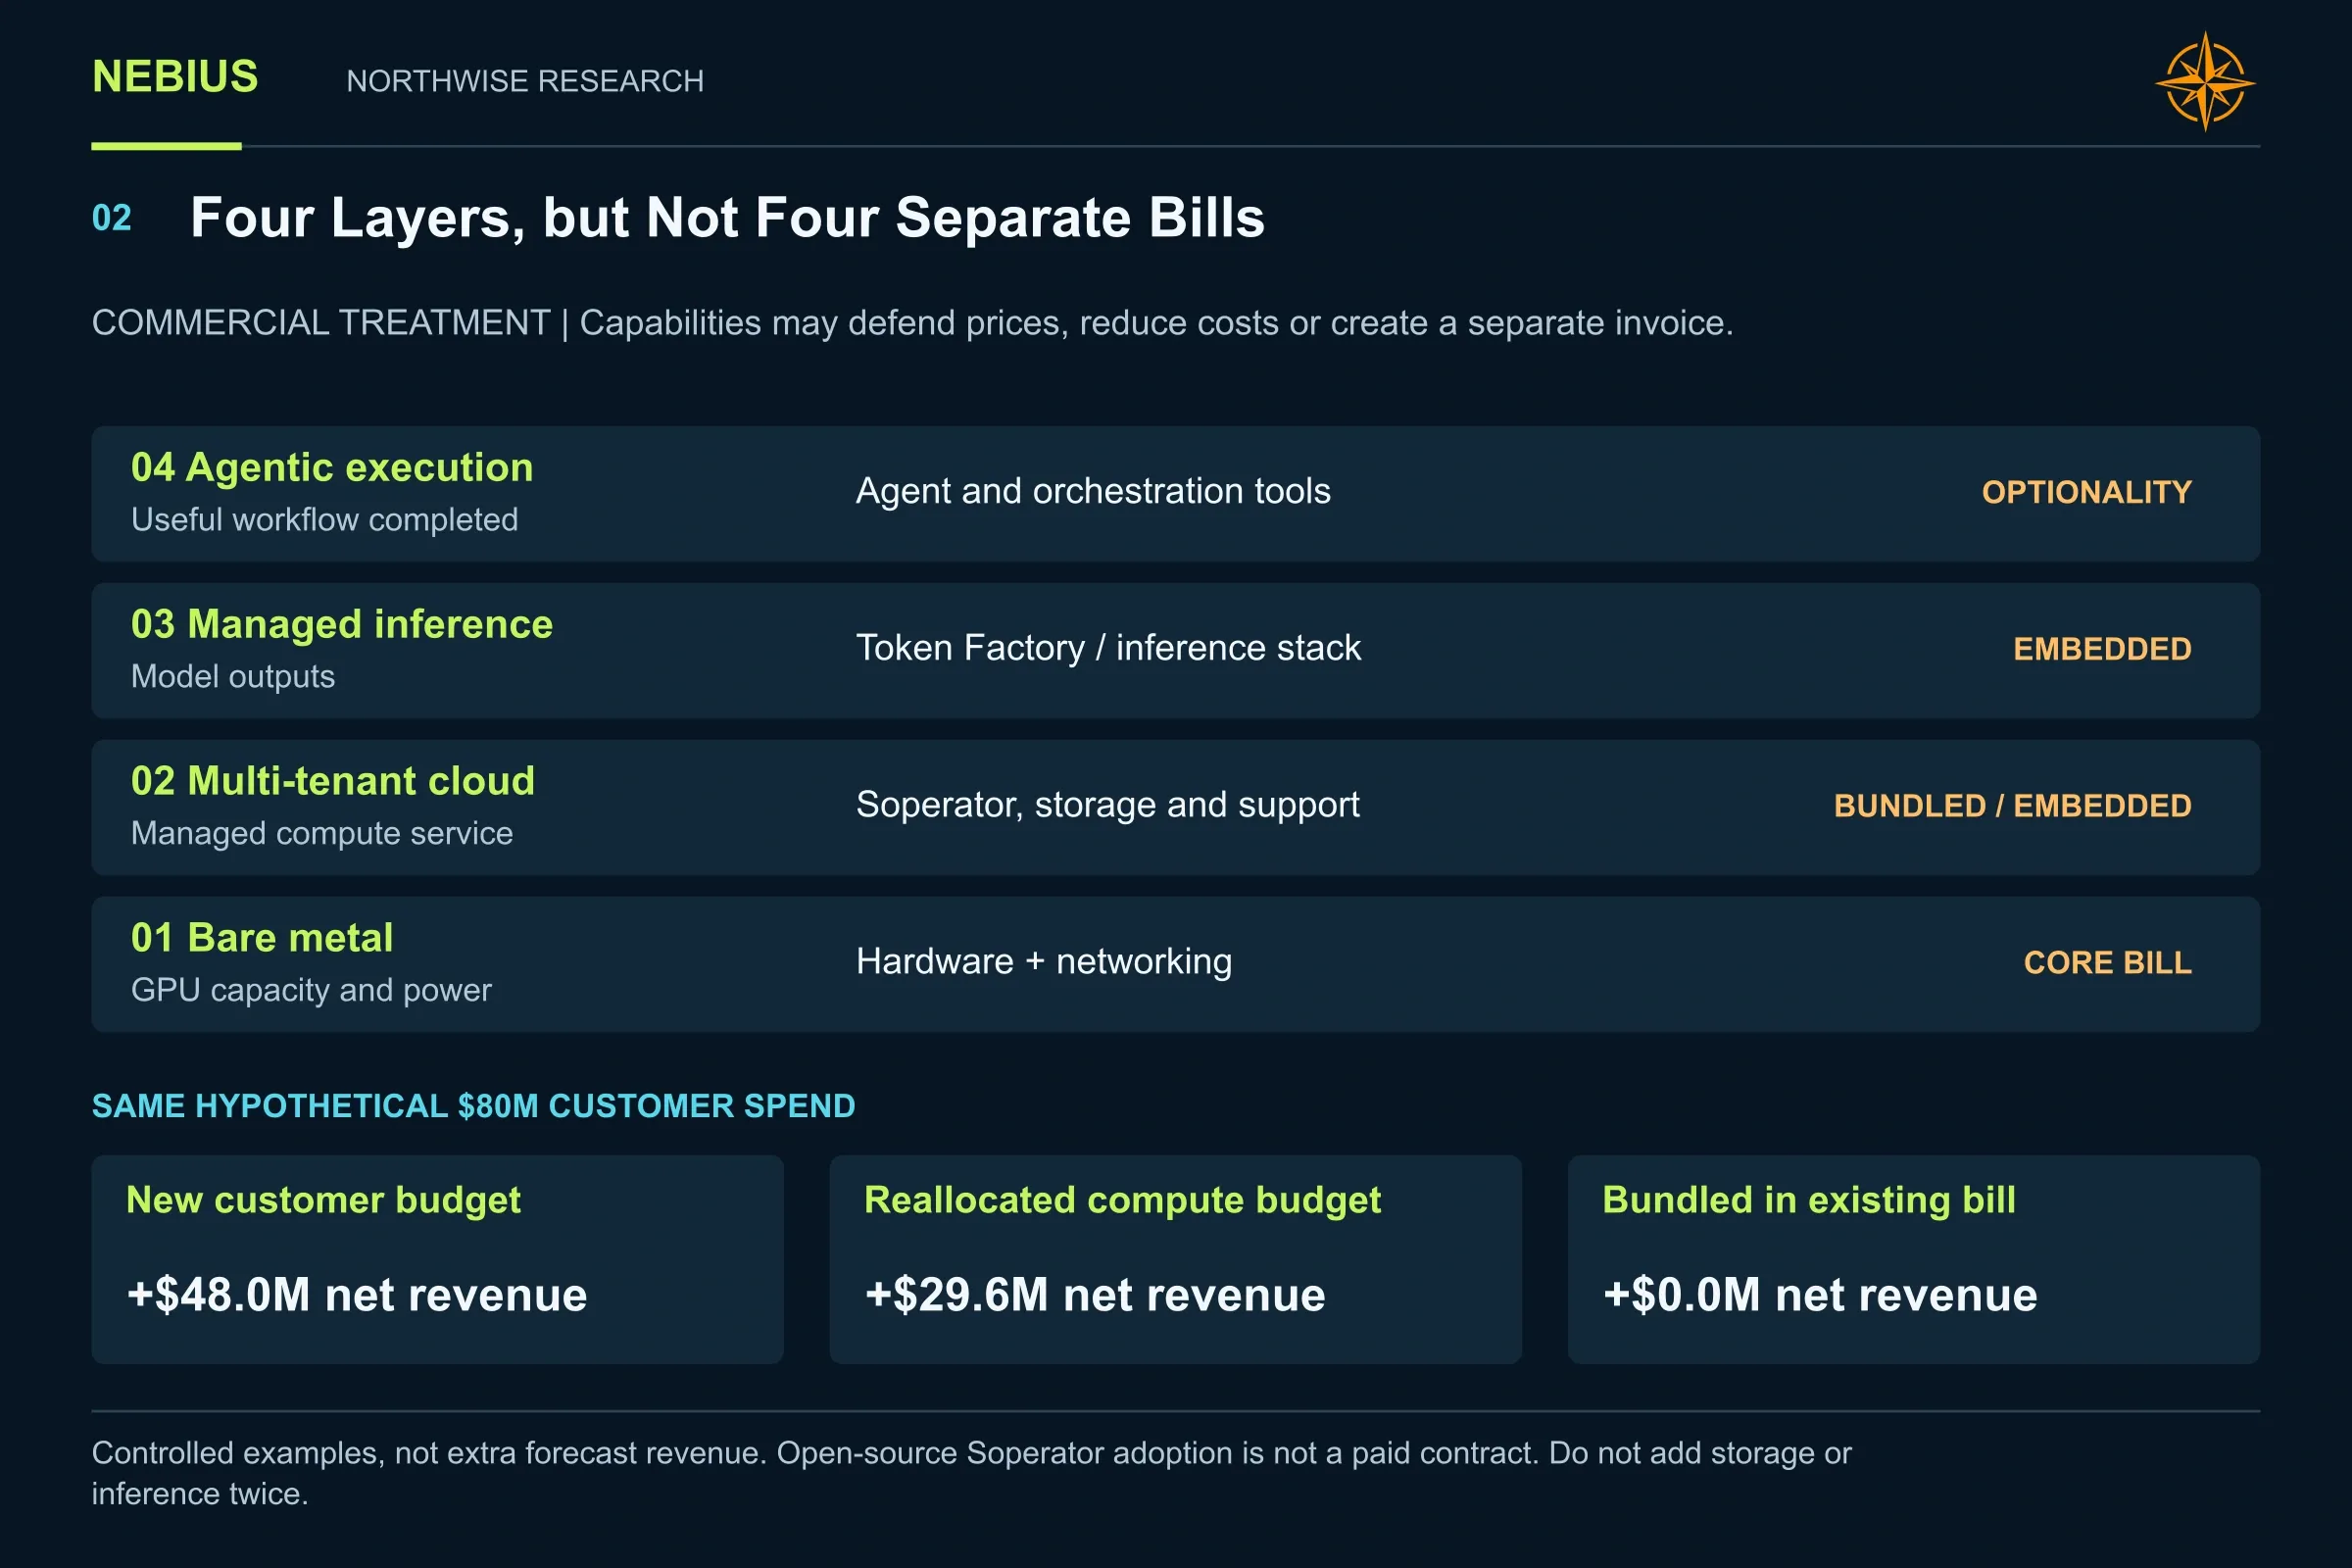
Northwise analyzes neoclouds with a 4-layer view of revenue per megawatt. Each layer adds a different service to the same underlying compute. It can defend pricing, reduce costs or support a separate invoice. It does not automatically create another bill.
At the bottom is bare metal: GPUs, networking and power rented by the hour or the year, the layer closest to a commodity. Above it sits the multi-tenant cloud, where orchestration, storage, security and reliability turn racks into a service many customers can share. The third layer is managed inference, where the customer stops renting hardware and starts buying model outputs. The fourth is agentic execution, where AI systems run workflows on the customer's behalf and pricing follows the work done.
Nebius has capabilities across this stack, but the presence of a product does not establish a separate revenue stream. AI Cloud supplies managed Kubernetes, storage and Soperator, which brings Slurm scheduling onto Kubernetes. Token Factory moves into managed inference. The Inferize acquisition and the Clarifai team and licensed technology are aimed at improving that service. The model does not add another revenue line simply because a higher layer exists.
Nebius reports a Platinum result in SemiAnalysis ClusterMAX 3.0. Its Q3 platform update added interconnection and enterprise management features designed for operations across sites. Those are relevant capabilities for a partner network, although neither announcement establishes the margins or reliability of an as-yet-unbuilt partner installation.
A single piece of evidence cuts the other way, and it shaped our assumptions. Soperator is open source, so a partner could install it without paying anyone. Whatever Nebius charges has to be earned by everything around the software: the service guarantee, the operations team, the supply chain and, above all, the customers.
The market and its lanes
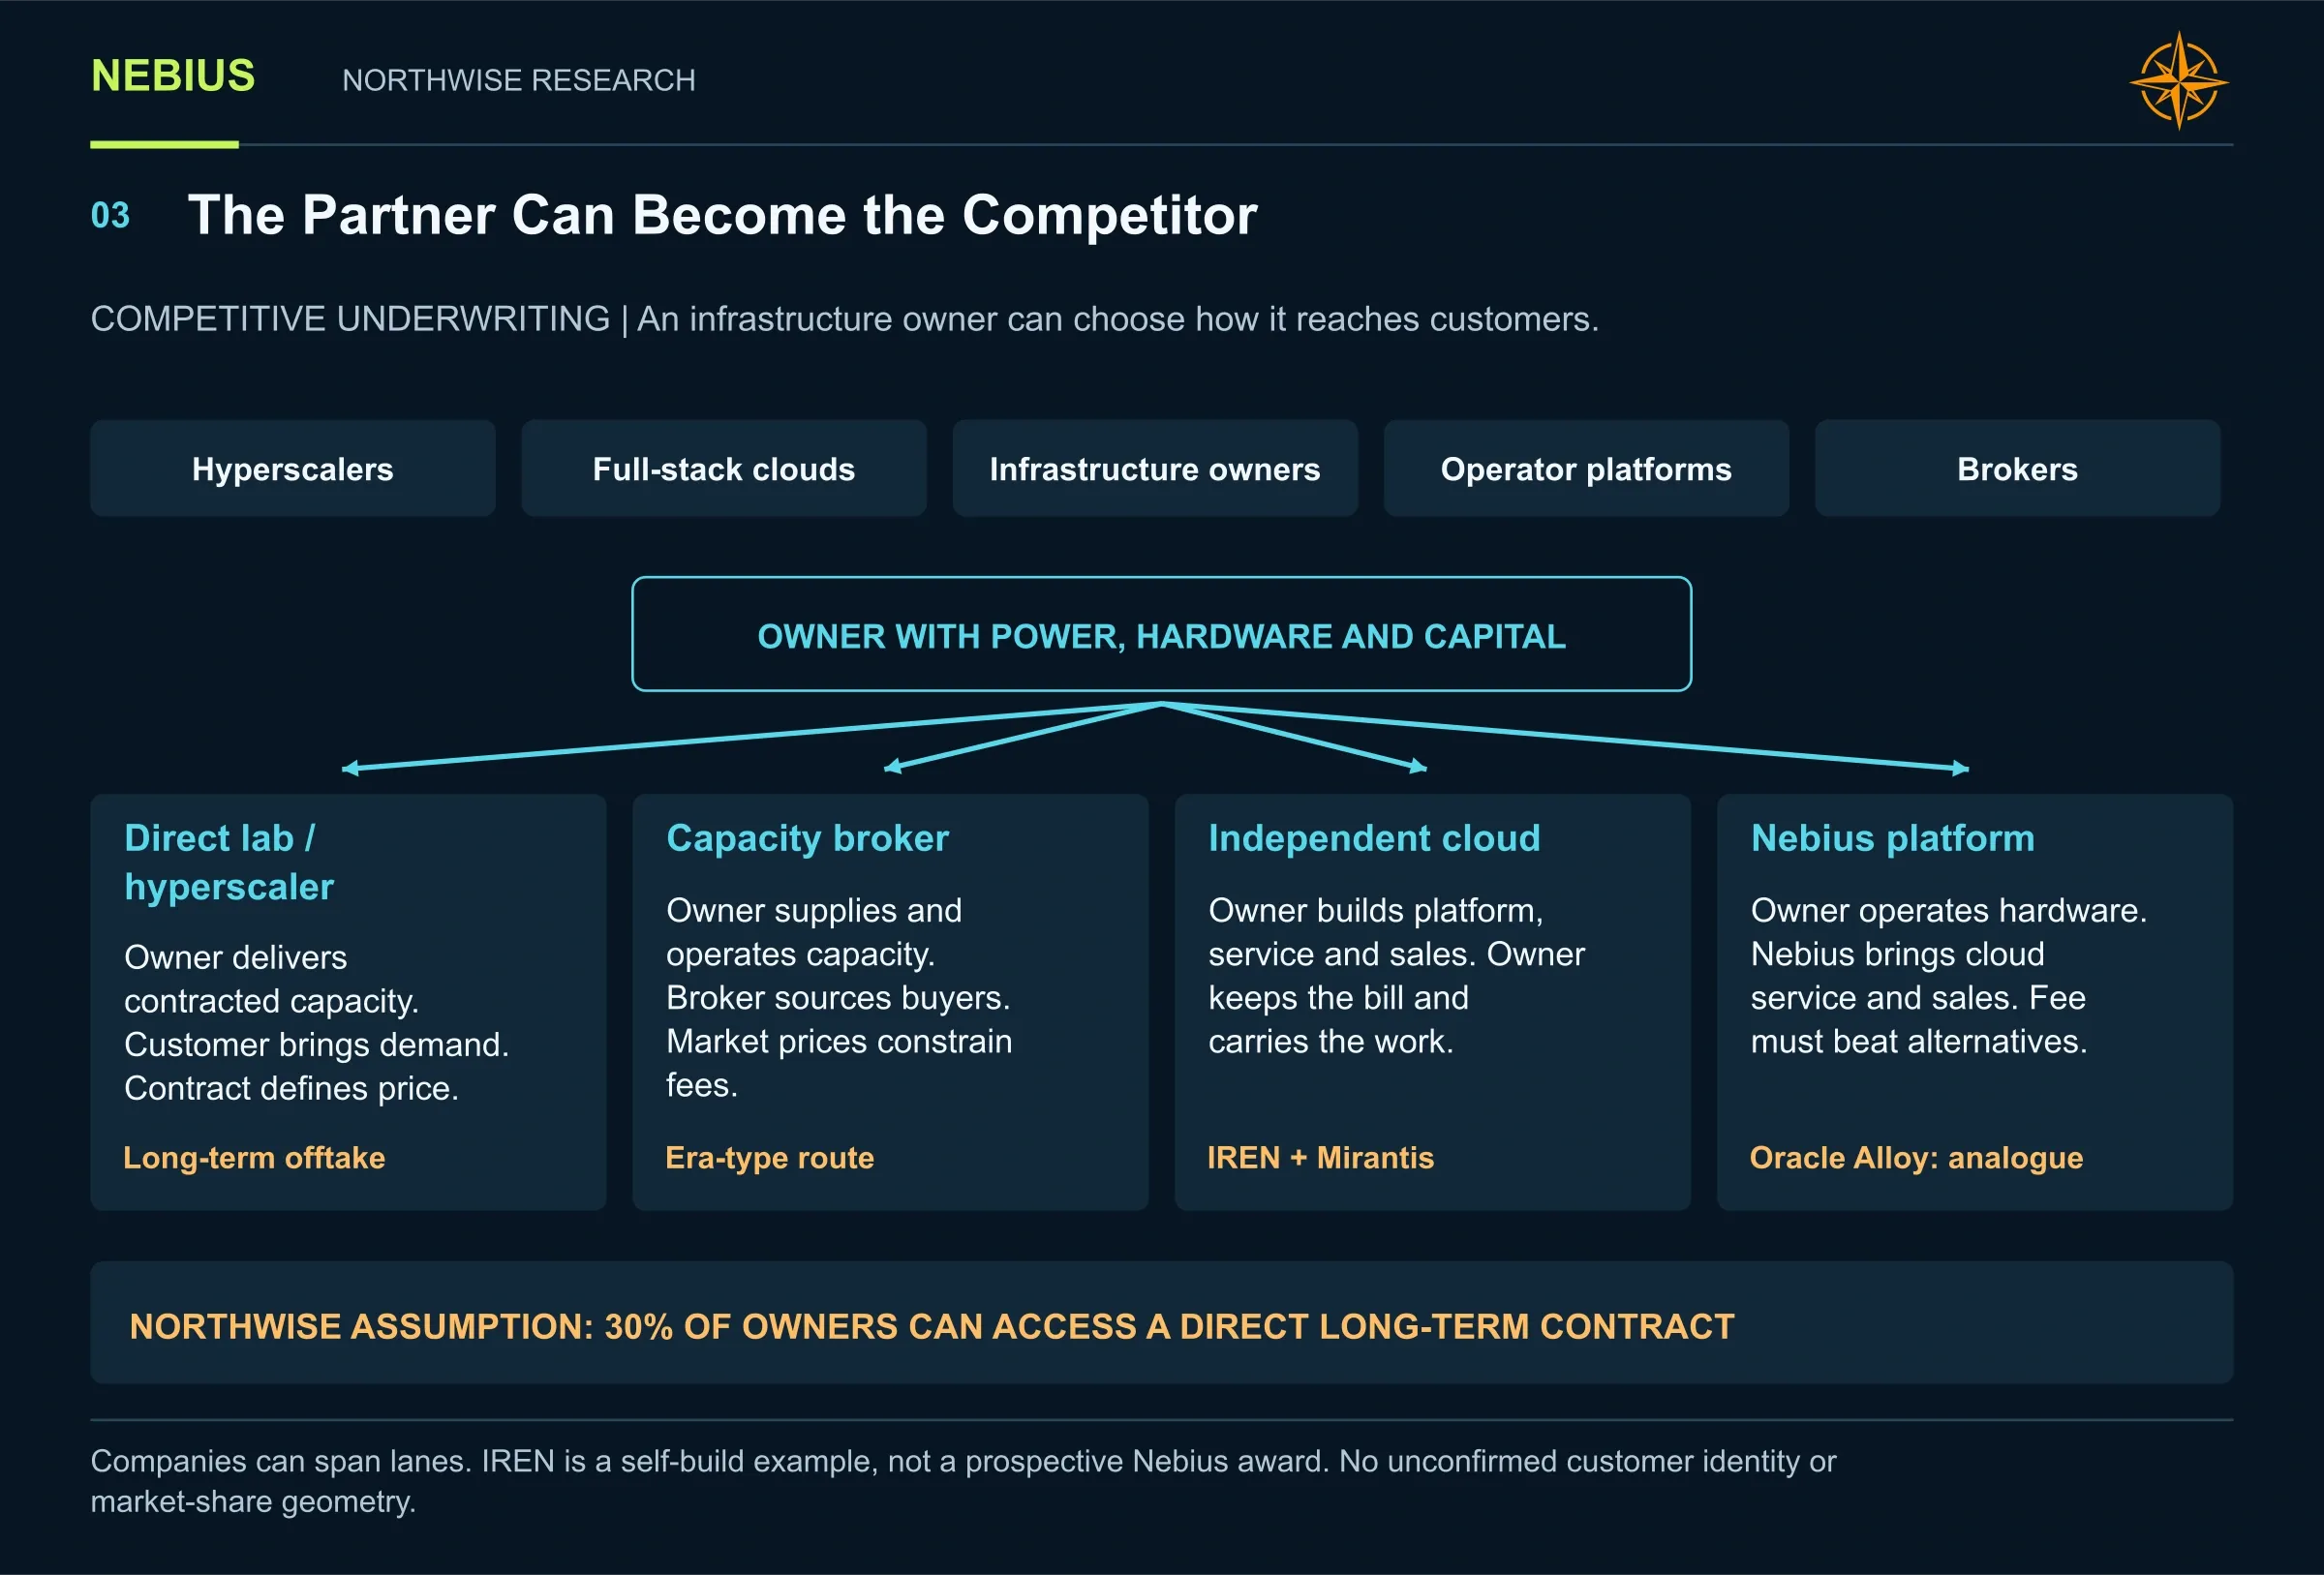
The AI compute market has sorted itself into 5 lanes, and the asset-light model only makes sense once you can see all of them.
The hyperscalers (Amazon, Microsoft, Google and Oracle) combine owned and leased infrastructure with broad cloud platforms. They are also major buyers of outside capacity, which is how Microsoft became one of Nebius’s biggest customers.
Full-stack neoclouds, led by CoreWeave and Nebius, buy GPUs, lease or build data centers and run the cloud themselves. They carry the hardware capital burden and must fund replacement as well as expansion.
Infrastructure owners make up the third lane. Former bitcoin miners such as Cipher, developers such as AIB Data Centers, and new entrants such as Volt in Rotterdam control land, power and buildings, and their business is renting that capacity to a cloud or a lab.
The lanes are not fixed, and IREN shows how an infrastructure owner can move into the cloud platform business. Its Mirantis acquisition announcement described a $625 million transaction at signing and the addition of k0rdent and enterprise software capabilities. The transaction closed on August 3 and was announced as completed on August 4. That is an alternative to paying an outside operator for software and customer access.
An owner with power, hardware and capital can choose to build its own software layer and customer relationships. IREN illustrates that choice; it is not evidence of a prospective Nebius award. Every owner that can operate competitively on its own has more leverage in fee negotiations.
The fourth lane is the operator platform: a company that runs its cloud on infrastructure someone else paid for. Oracle's Alloy program, which lets outside operators sell a full Oracle cloud under their own brand, is the closest existing example. Nebius's asset-light model puts it in this lane alongside its owned cloud.
The fifth lane is the broker. Companies such as Era Compute source capacity for buyers. Era advertises HGX B300 capacity from $4.50 per GPU-hour, while Nebius lists $9.50. These are public offers with different terms, availability and service scope. They are not a matched measurement of realized pricing or the value of Nebius software.
The asset-light model is an attempt to recruit lane 3 owners into lane 4, turning landlords into cloud operators with Nebius's software, standards and sales force.
Its competition for those owners comes from 3 directions. Hyperscalers and labs offer long, creditworthy contracts. Software such as Mirantis lets an owner build a cloud of its own. Brokers offer a quick, platform-free way to sell hours, and the fee Nebius can charge depends on staying meaningfully better than all 3.
How the partnership model works
The partner program is unusually specific about who does what. The partner funds and owns 100% of the facility and hardware, sources powered land, builds the site, imports the GPUs, runs on-site operations and handles maintenance and physical security.
Nebius supplies the data center and network designs, the bill of materials, access to its supply chain, a certified assembly partner, the cloud platform, validation of every cluster, the service guarantee customers see and its global sales organization. Partner capacity joins the same pool customers already buy from, at the same standard. Partners can also bring customers of their own.
Nebius can earn from a partner site in 3 ways, and mixing them up is the fastest way to overstate the business. In a shared partner cloud, customers rent capacity and Nebius keeps a share of their bill, so customer billings and Nebius revenue are different numbers. In a private deployment, an enterprise runs dedicated infrastructure and pays Nebius for licenses, support and implementation, with no resale bill to take a share of. In a committed-capacity deal, Nebius guarantees the partner a minimum payment, which raises revenue along with risk.
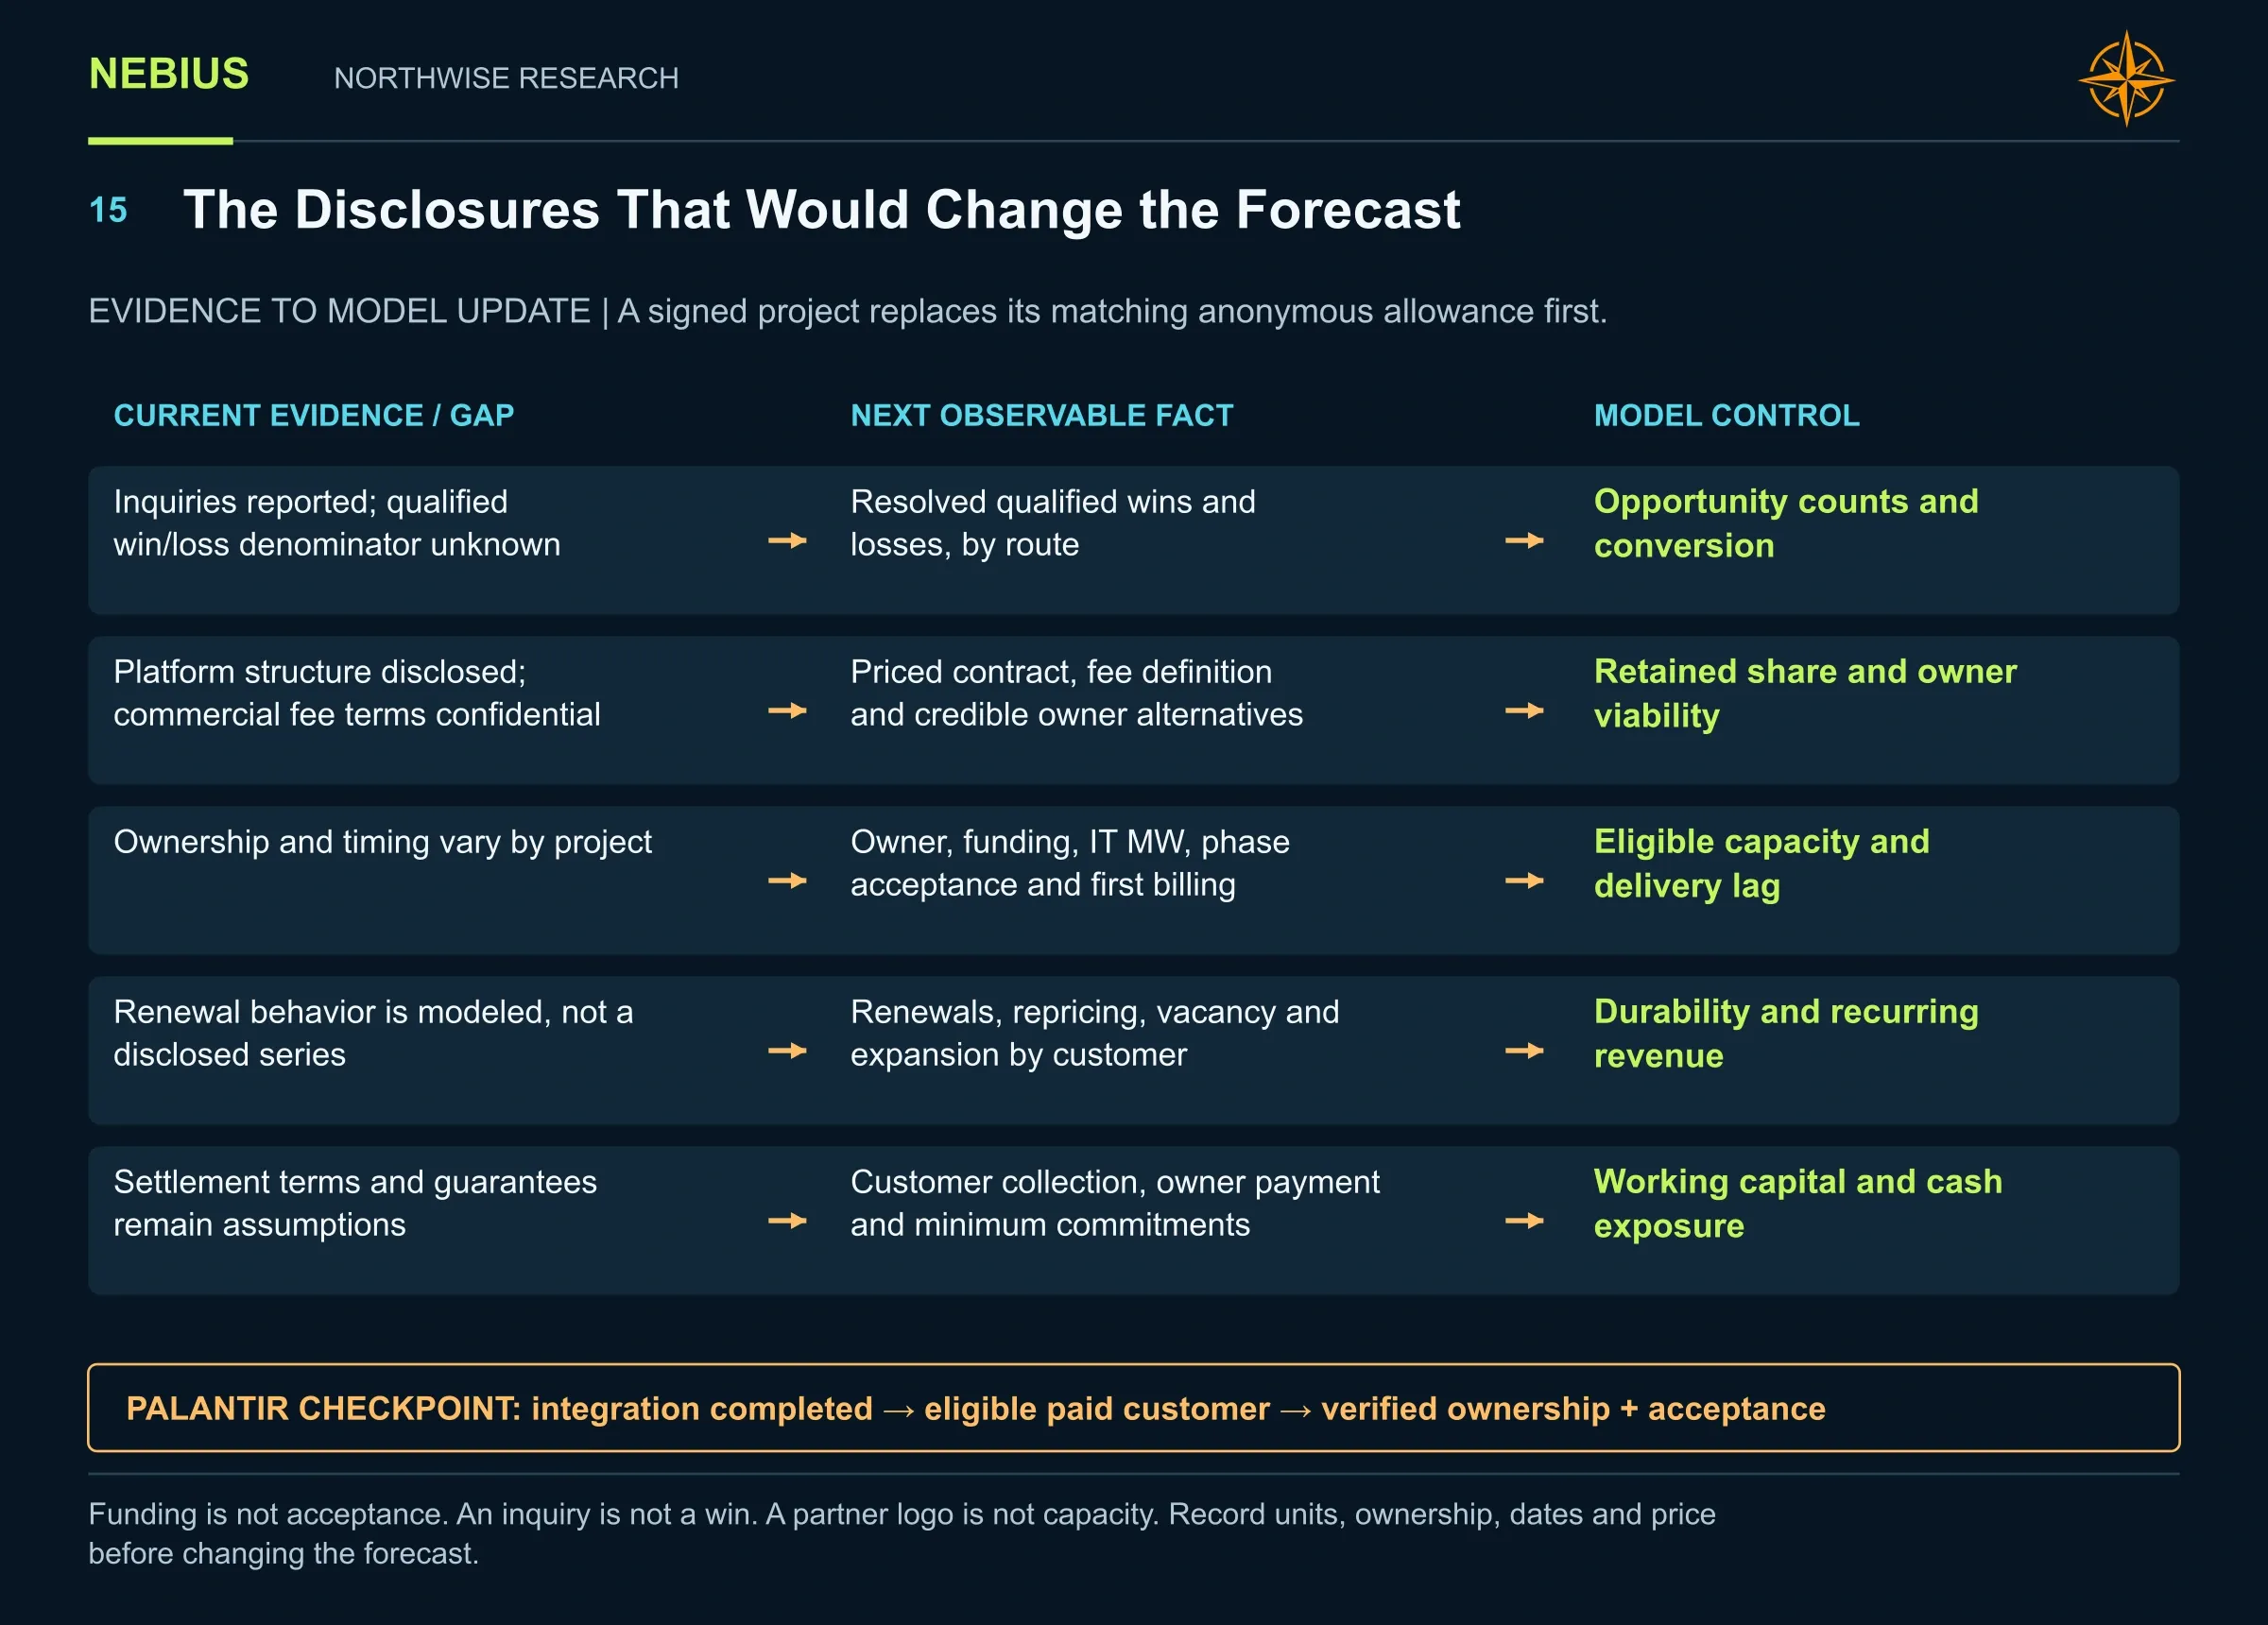
On the Q2 earnings call, management described an early program attracting inquiries from prospective partners with capacity and capital, with a possible capacity contribution in 2027 and beyond. It also reported an early profit contribution without quantifying it. The public program specification explains the division of responsibilities but does not disclose a fee schedule or a signed-project conversion record.
Those statements support a funded-partner starting point and a slow ramp, but they do not prove that financing is easy or establish how many inquiries will become paid capacity. We model sponsor capital separately and treat every close rate, timing distribution and negotiated fee as a Northwise assumption.
An early contribution supports the existence of the program. It does not validate the billions of dollars generated by even our lower modeled scenarios. The absence of disclosed partner volumes and fees leaves a wide range around every forecast.
The partnerships, and what each actually does
NVIDIA is an important enabling relationship. Hardware access and technical support can improve a partner proposition, and financing structures can allocate capital and revenue risk among different participants. They are not a guarantee of funding for the anonymous projects in this model.
Microsoft and Meta sit in the owned cloud, though they matter here too. A partner choosing between Nebius and a direct lease is weighing Nebius's ability to fill capacity, and 2 of the largest contracts in the neocloud industry are strong evidence that it can.
Palantir is the partnership closest to the asset-light model. In September, Palantir named Nebius its preferred sovereign AI infrastructure partner for eligible commercial customers. Nebius compute will sit inside Palantir's security perimeter after an integration period, and the 2 companies plan modular deployments at sites where power is already available.
The fit is strong. Palantir argues that companies should own their AI models and data instead of renting intelligence by the token, and its customers include regulated companies in finance and industry for whom sending sensitive data to a public cloud is a hard sell. Many of those deployments will run on hardware the customer or a partner owns, which is exactly the private deployment route.
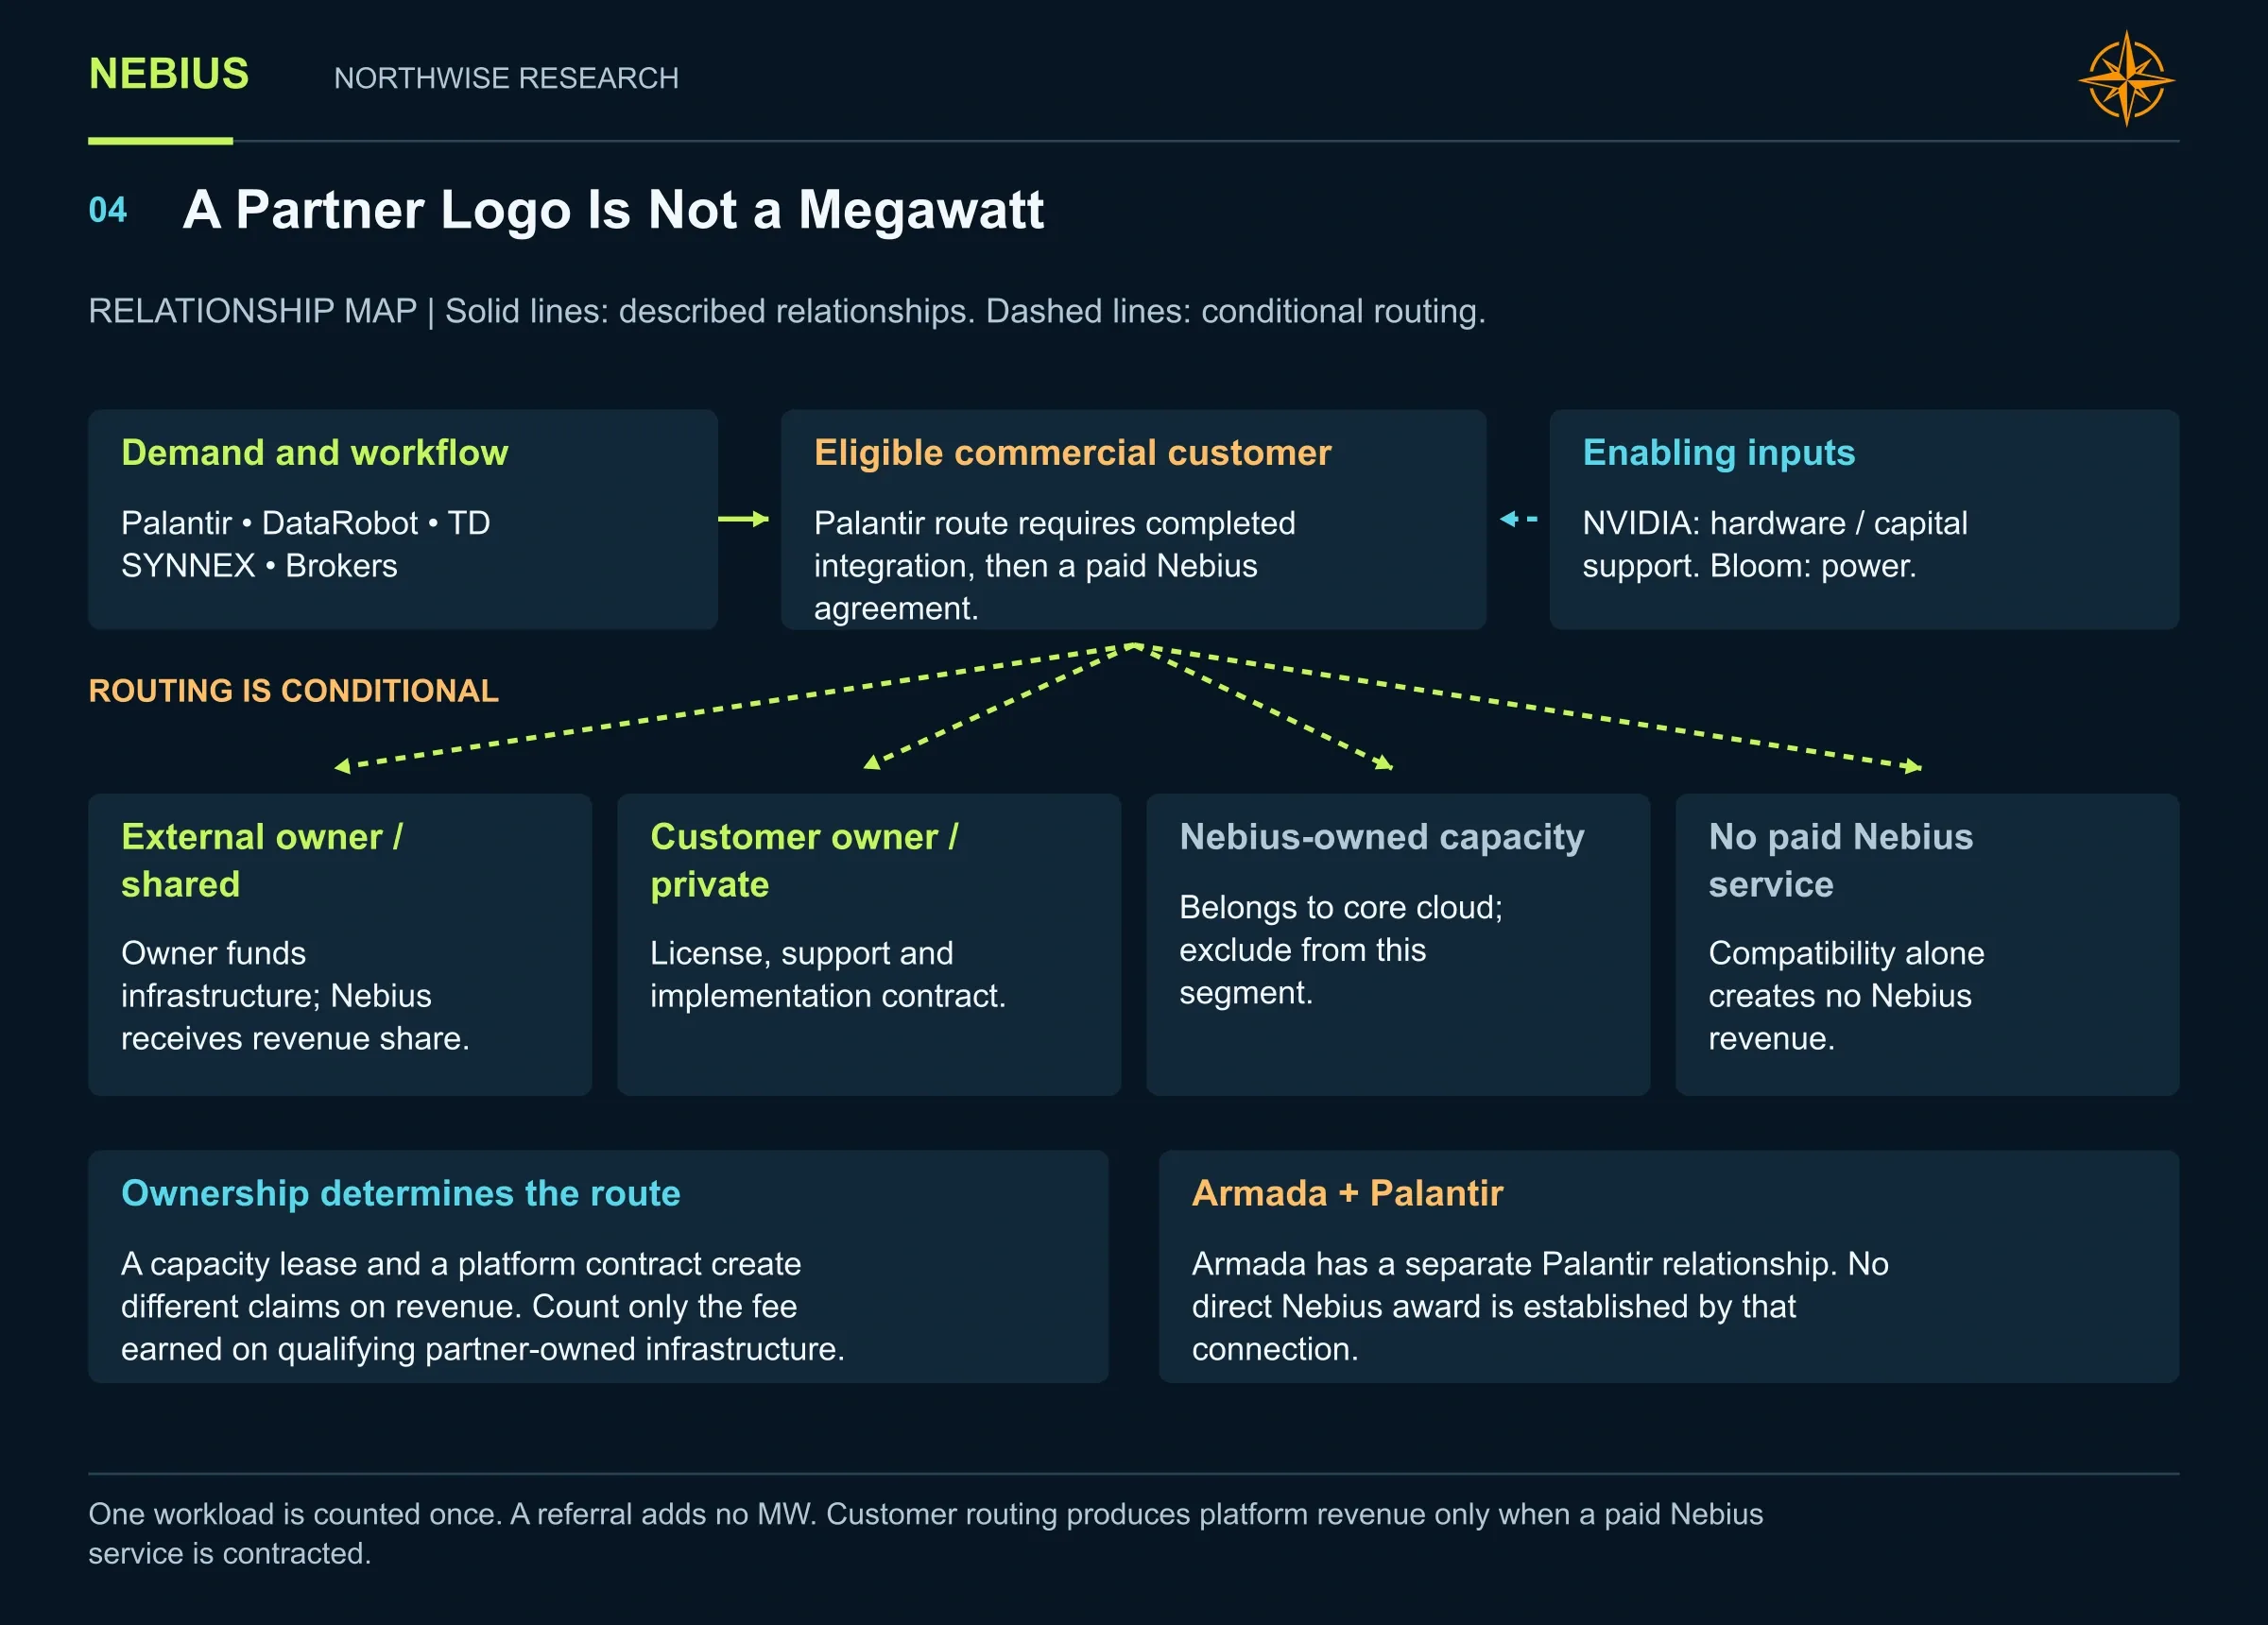
The fine print points to a slower ramp than the headlines implied. Preferred status applies only after an undated integration period, and government customers run on a separate track with NVIDIA. No volumes, megawatts or economics were disclosed. Palantir has also partnered with Armada, a maker of modular data centers whose announcement does not mention Nebius, so Palantir has more than a single route to its customers.
We therefore treat Palantir as a supporting channel. We assume integration completes during 2027 and conversions begin thereafter; the announcement gives no completion date. We do not allocate a fixed share of Palantir customers to Nebius, and we exclude the government track from this particular commercial route.
Smaller channels can widen the funnel without adding megawatts. DataRobot brings enterprise applications, TD SYNNEX brings distribution and Bloom Energy brings a potential power solution. Brokers can help match buyers with available capacity. We test faster reletting separately and assign no capacity or signed customer volume to that channel.
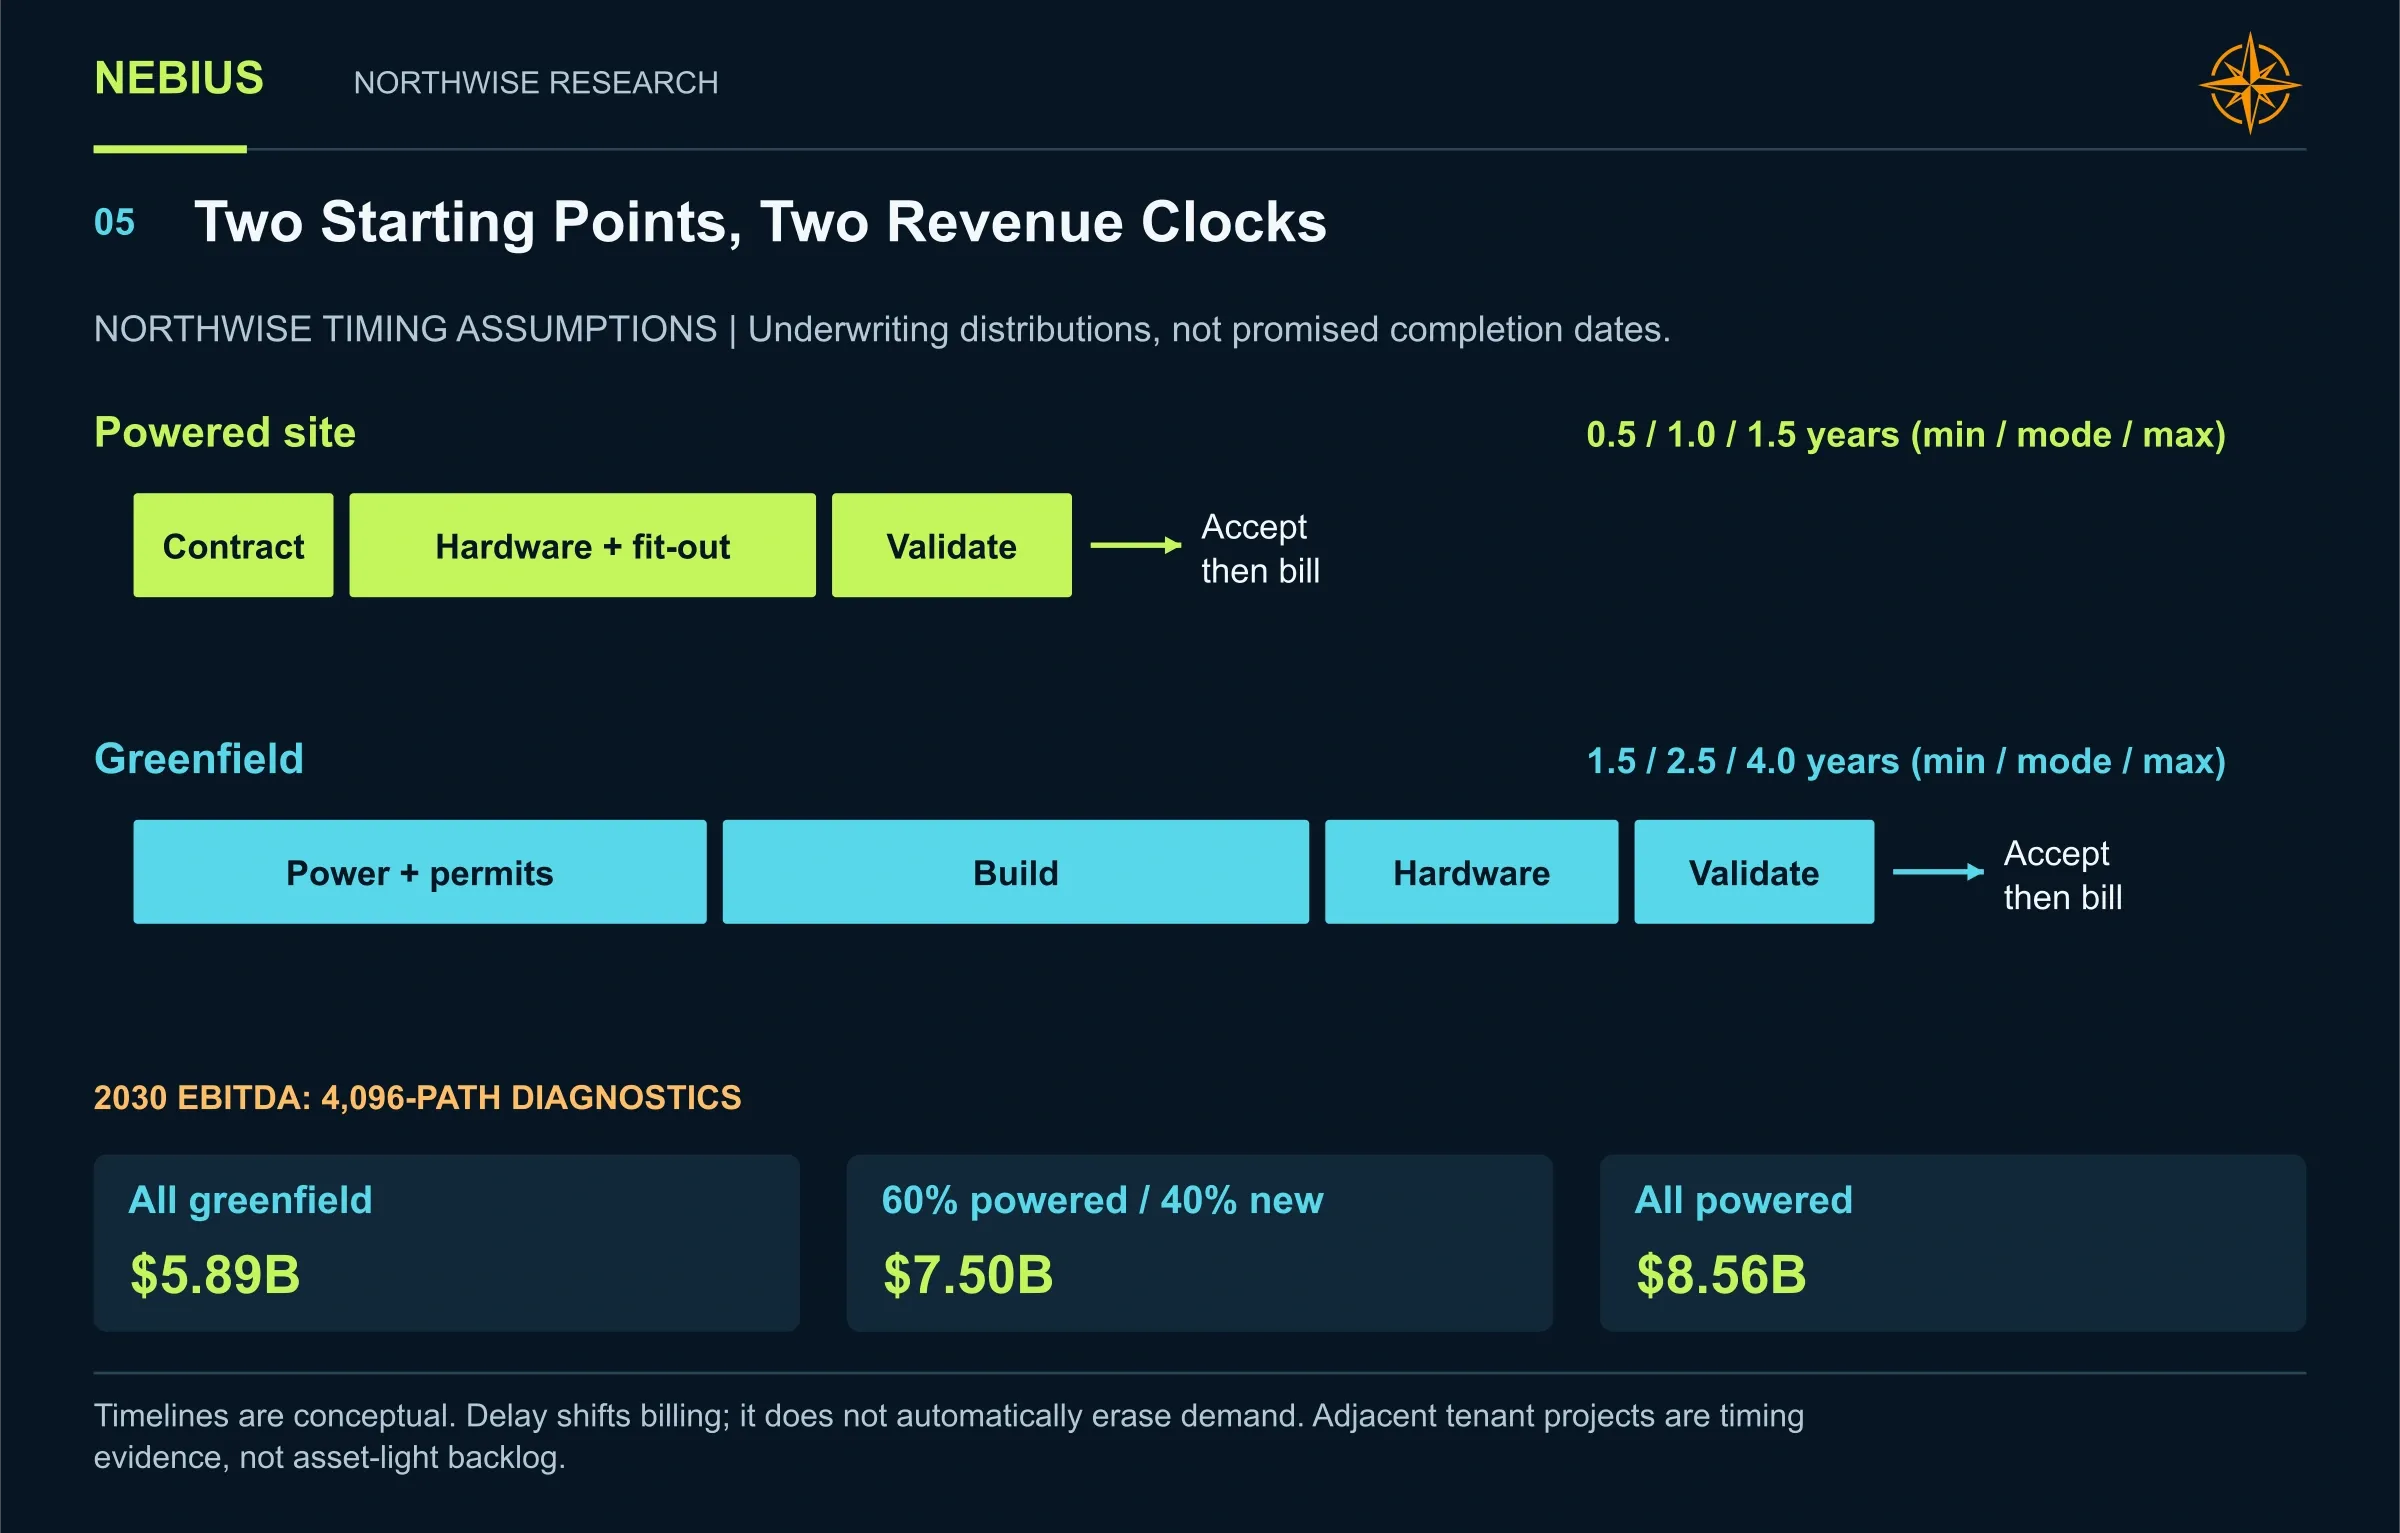
Powered buildings and greenfield projects require different delivery clocks. We assume 0.5 to 1.5 years for powered sites and 1.5 to 4 years for greenfield projects, with modes of 1 and 2.5 years. These ranges allow for construction, hardware installation and acceptance before billing begins.
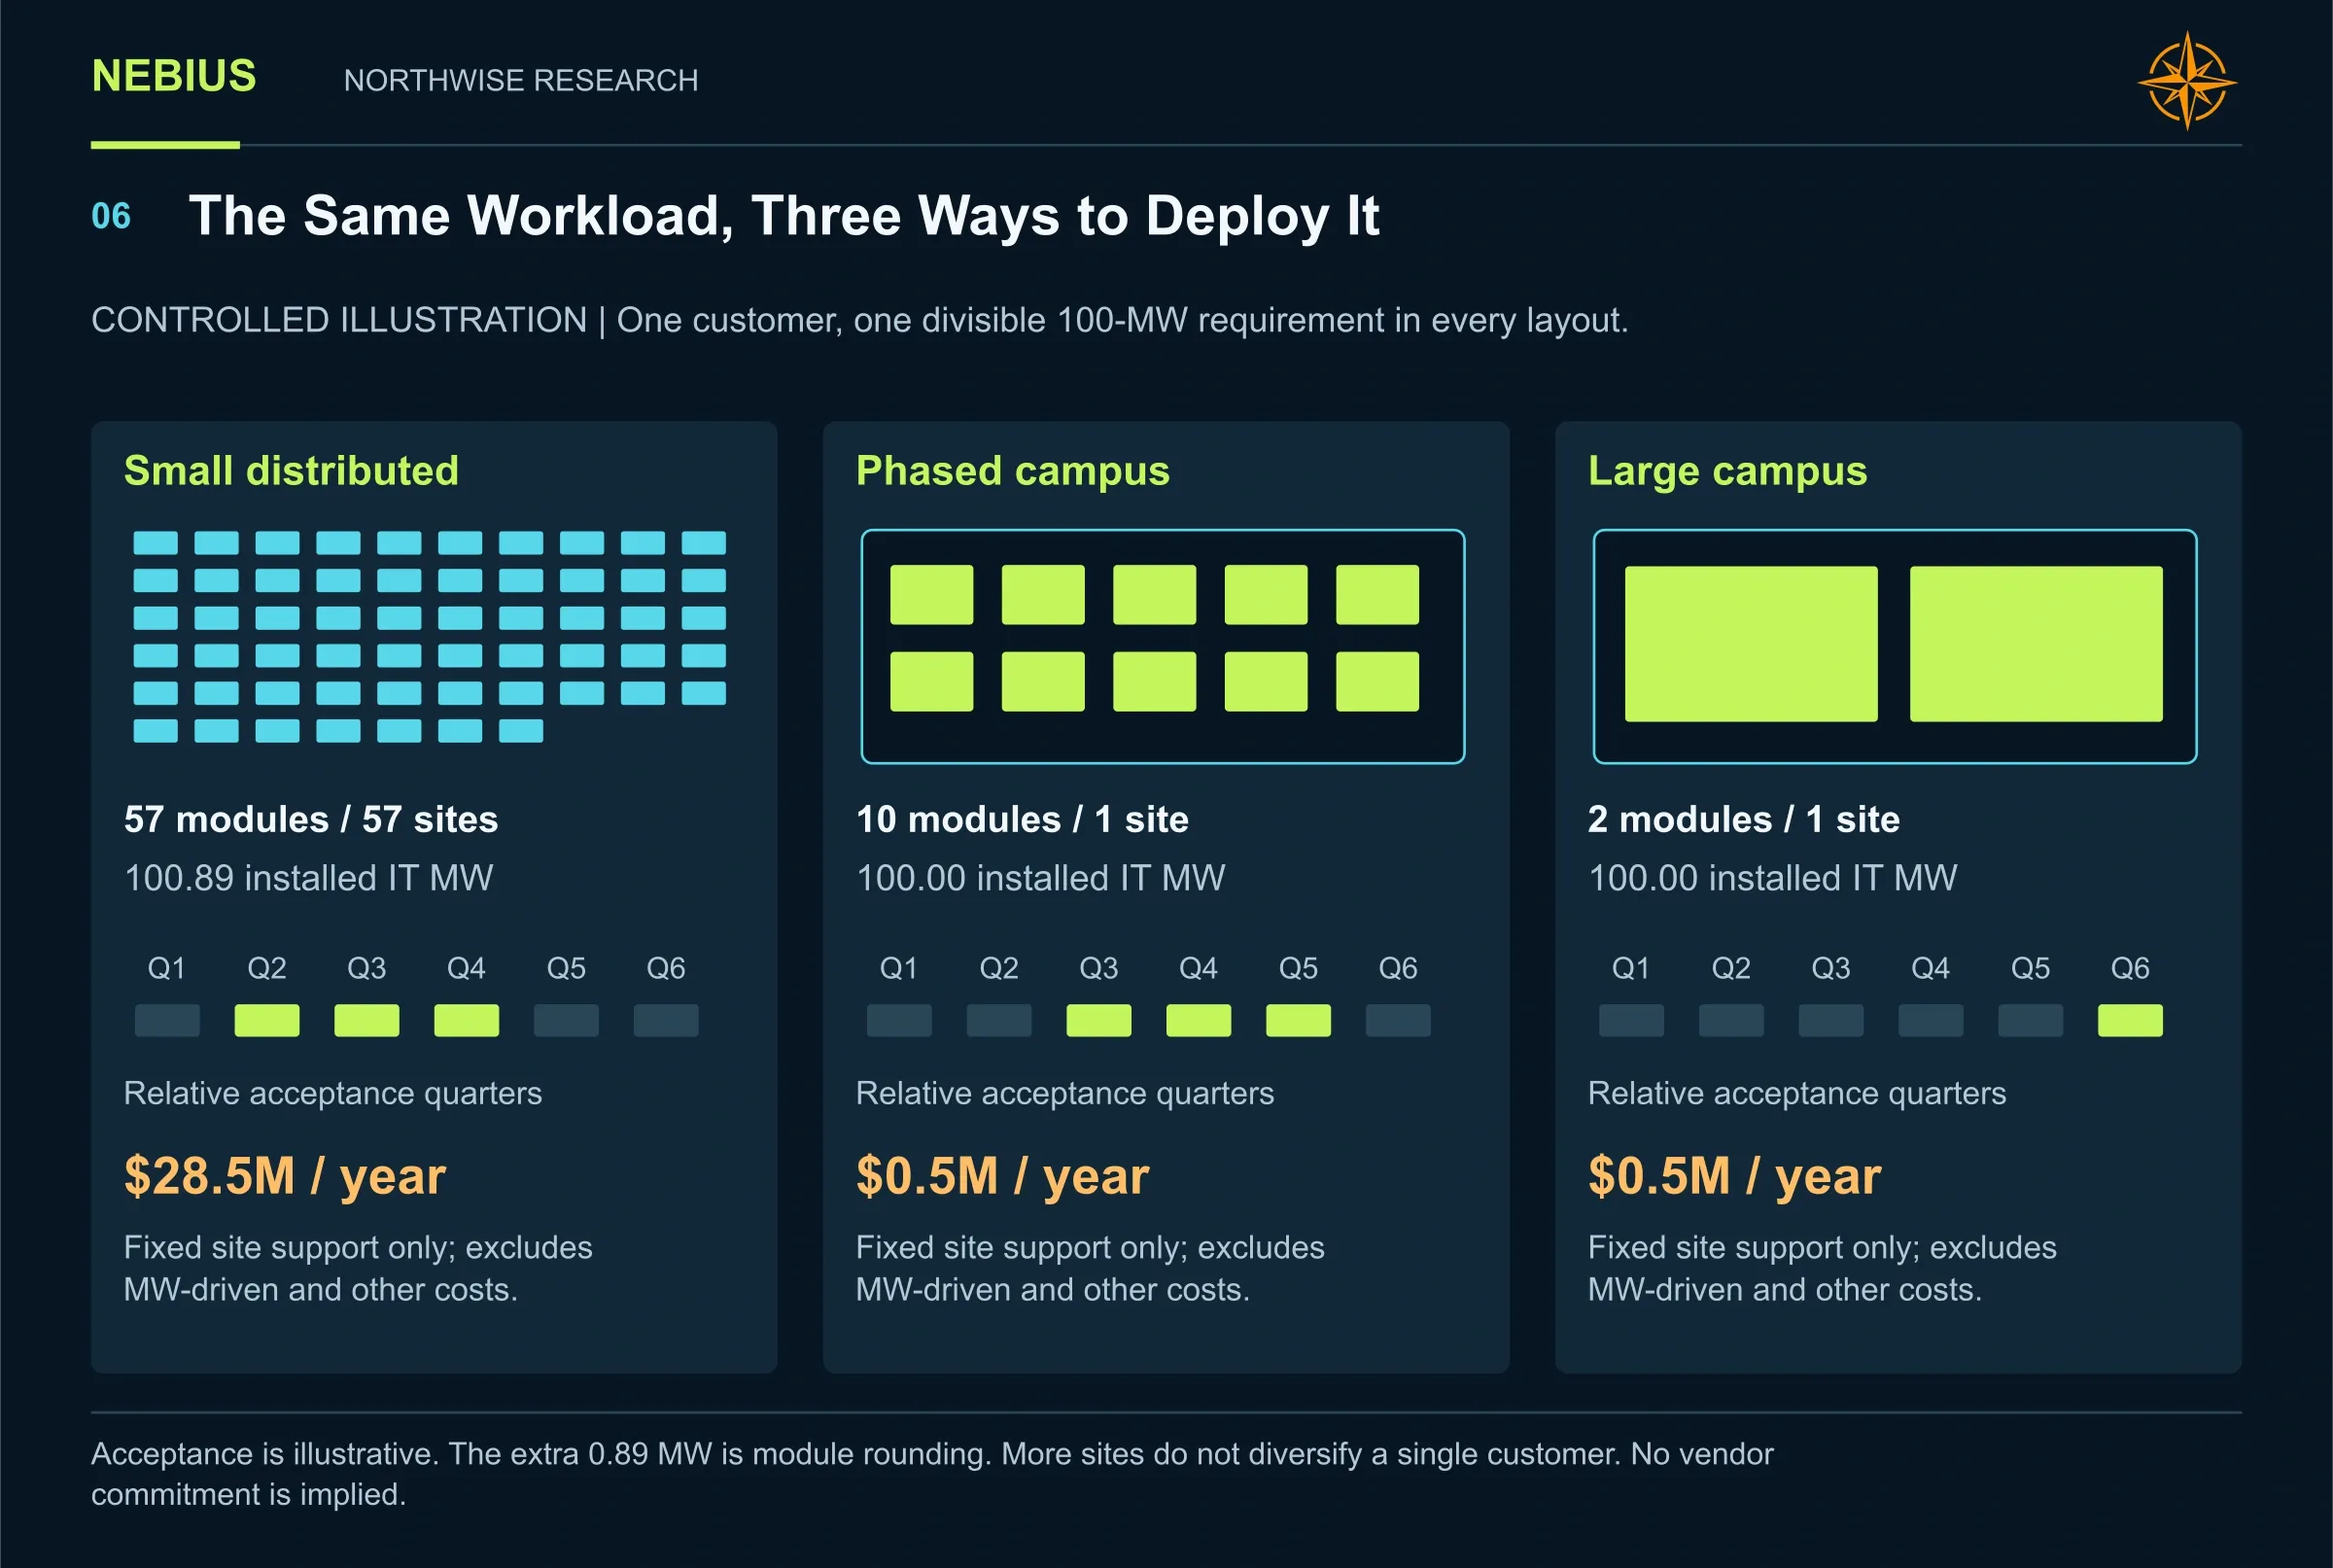
Modularity changes the sequence of acceptance, not the amount of demand by itself. Our controlled example gives one customer the same divisible 100-MW requirement in each layout. Smaller units can arrive in phases, but many separate sites create repeated support costs. They do not diversify that single customer.
What this means for existing shareholders
For shareholders, the asset-light model changes the capital structure of growth. In our Base case, the platform reaches $11.2 billion of revenue by 2030 while Nebius spends about $0.8 billion on platform capital over 5 years. External owners deploy about $128 billion. These are separate capital accounts within the partner model, not an estimate of how much Nebius saves against an otherwise identical owned-cloud buildout.
It could also diversify the customer base if multiple independent partners and enterprise customers scale. Counting several sites for one buyer does not create several independent demand relationships. The number of customers, the number of sites and accepted IT megawatts need to remain separate.
The model also brings 3 tensions. First, the fee is net revenue, so the platform's billings look large and its reported revenue looks small by comparison. Second, partner capacity and owned capacity compete for the same customers, and Nebius will have to decide whose racks get filled first. Third, owned-cloud returns could suffer if the best demand flows to partner sites, so the platform should be judged as part of the whole company before it is layered onto any existing forecast.
The owner's math is where the fee gets decided
Every partner faces the same question: am I better off paying Nebius, or doing something else with my capital? The answer sets the fee, and the fee sets the business.
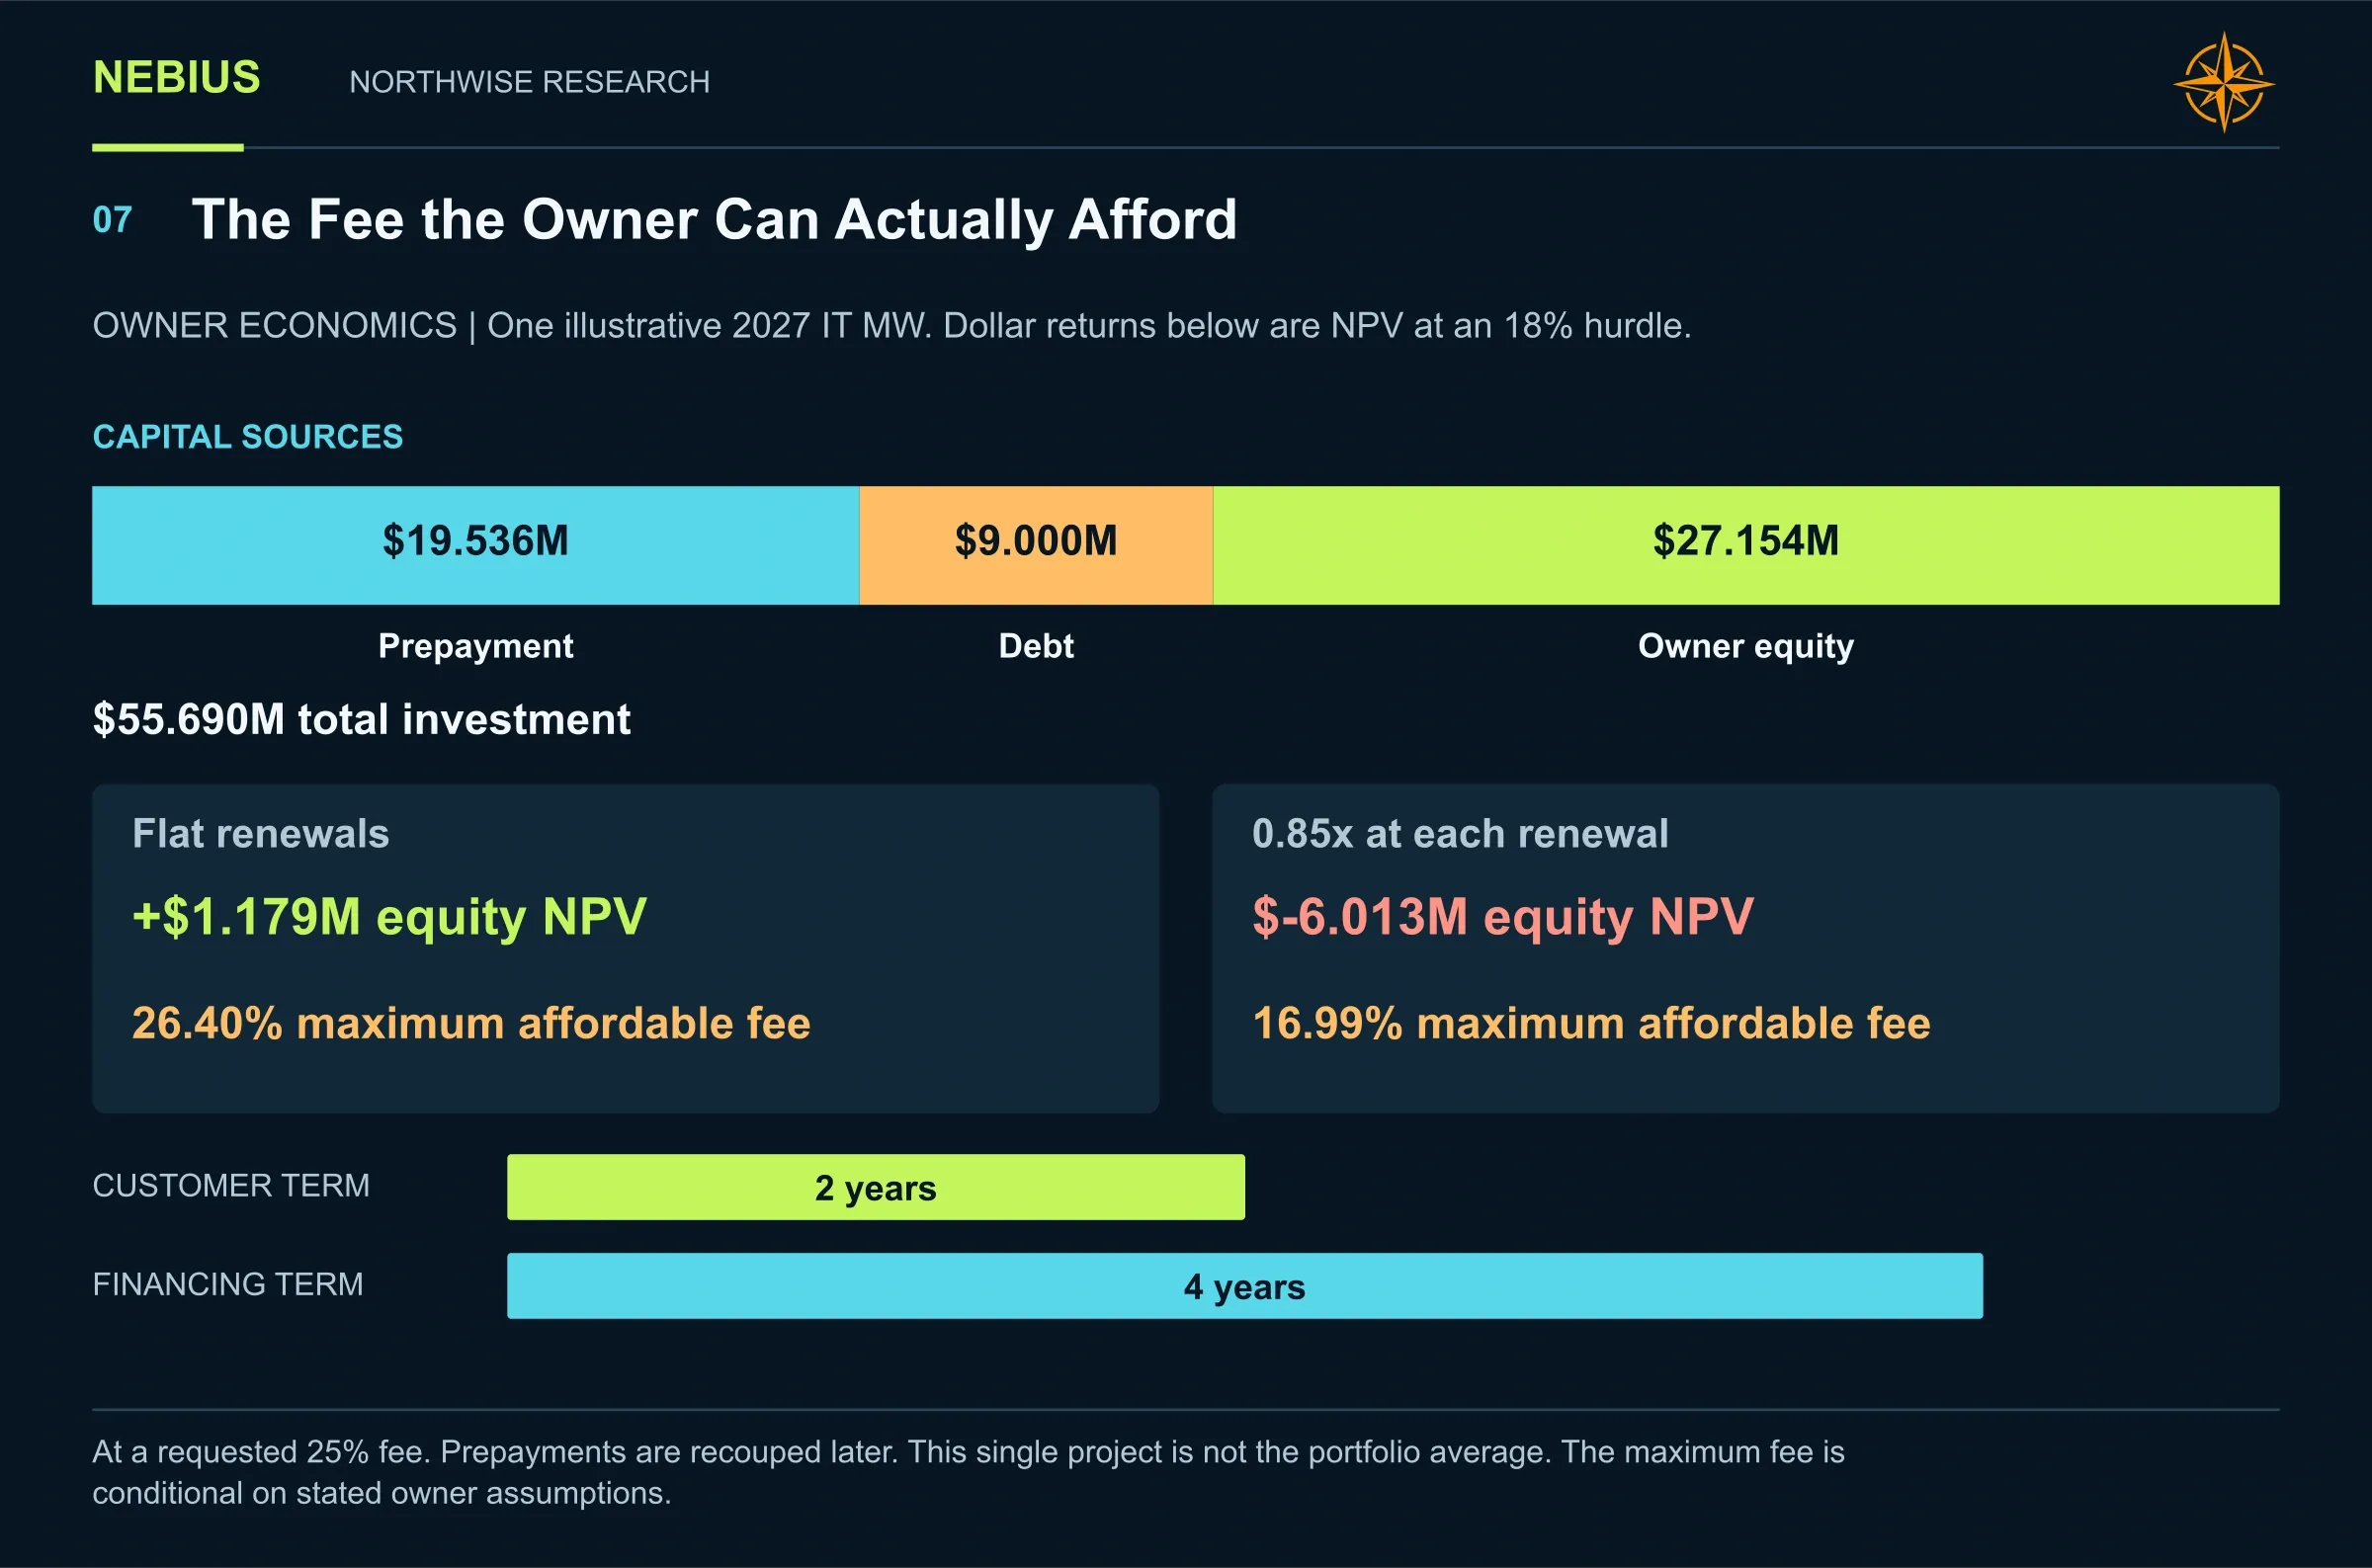
Take a single illustrative megawatt deployed in 2027. The partner spends about $55.7 million on GPUs and facilities, funded with a customer prepayment of $19.5 million, $9.0 million of debt and $27.2 million of its own equity. Customers pay $26 million a year for capacity. Northwise assumes an opening requested platform fee of 25%; Nebius has not disclosed that fee.
If renewal prices held flat, that project would clear both its 12% project hurdle and its 18% equity hurdle. We assume prices fall instead. GPU generations now turn over every 1 to 2 years, so each 2-year renewal on aging hardware should reprice lower, and we assume about 15% per renewal.
With that repricing, the project misses both hurdles at a 25% fee, and the highest fee that still clears the equity hurdle is about 17%. The owner pushes back and the fee falls. In our simulation, Nebius's retained share starts near 18% in 2027 and rises to about 22% by 2030, as newer, more valuable capacity enters the fleet.
The owner's alternatives push in the same direction. It could sell hours through a broker, sign a long contract directly with a hyperscaler or lab, or buy its own software layer and build a cloud, the route IREN took with Mirantis. We give 30% of partners access to a direct long-term contract and cap Nebius's fee wherever that contract wins, and we price the self-built cloud into each owner's outside option.
The Era and Nebius quotes are useful pricing references, but the $5 difference cannot be booked as a software premium. A proper comparison would hold hardware configuration, term, availability, utilization and service responsibilities constant. The fee must be justified against the owner’s actual alternatives, not a simple subtraction of two advertised prices.
How we built the forecast
We built the forecast from individual deals up, simulating 16,384 portfolios and allowing uncertain inputs to move together. No 2030 capacity target was chosen in advance. Each portfolio follows projects from the first inquiry through negotiation, financing, delivery and renewal.
Each simulated portfolio starts with a pool of partner inquiries, most likely 36, consistent with management's "dozens," plus new inquiries growing about 30% a year. Each draws its own close rate around 35%. Winning projects then pass through fee negotiation, financing with limited sponsor equity, and delivery, with 60% on powered sites and 40% built new.
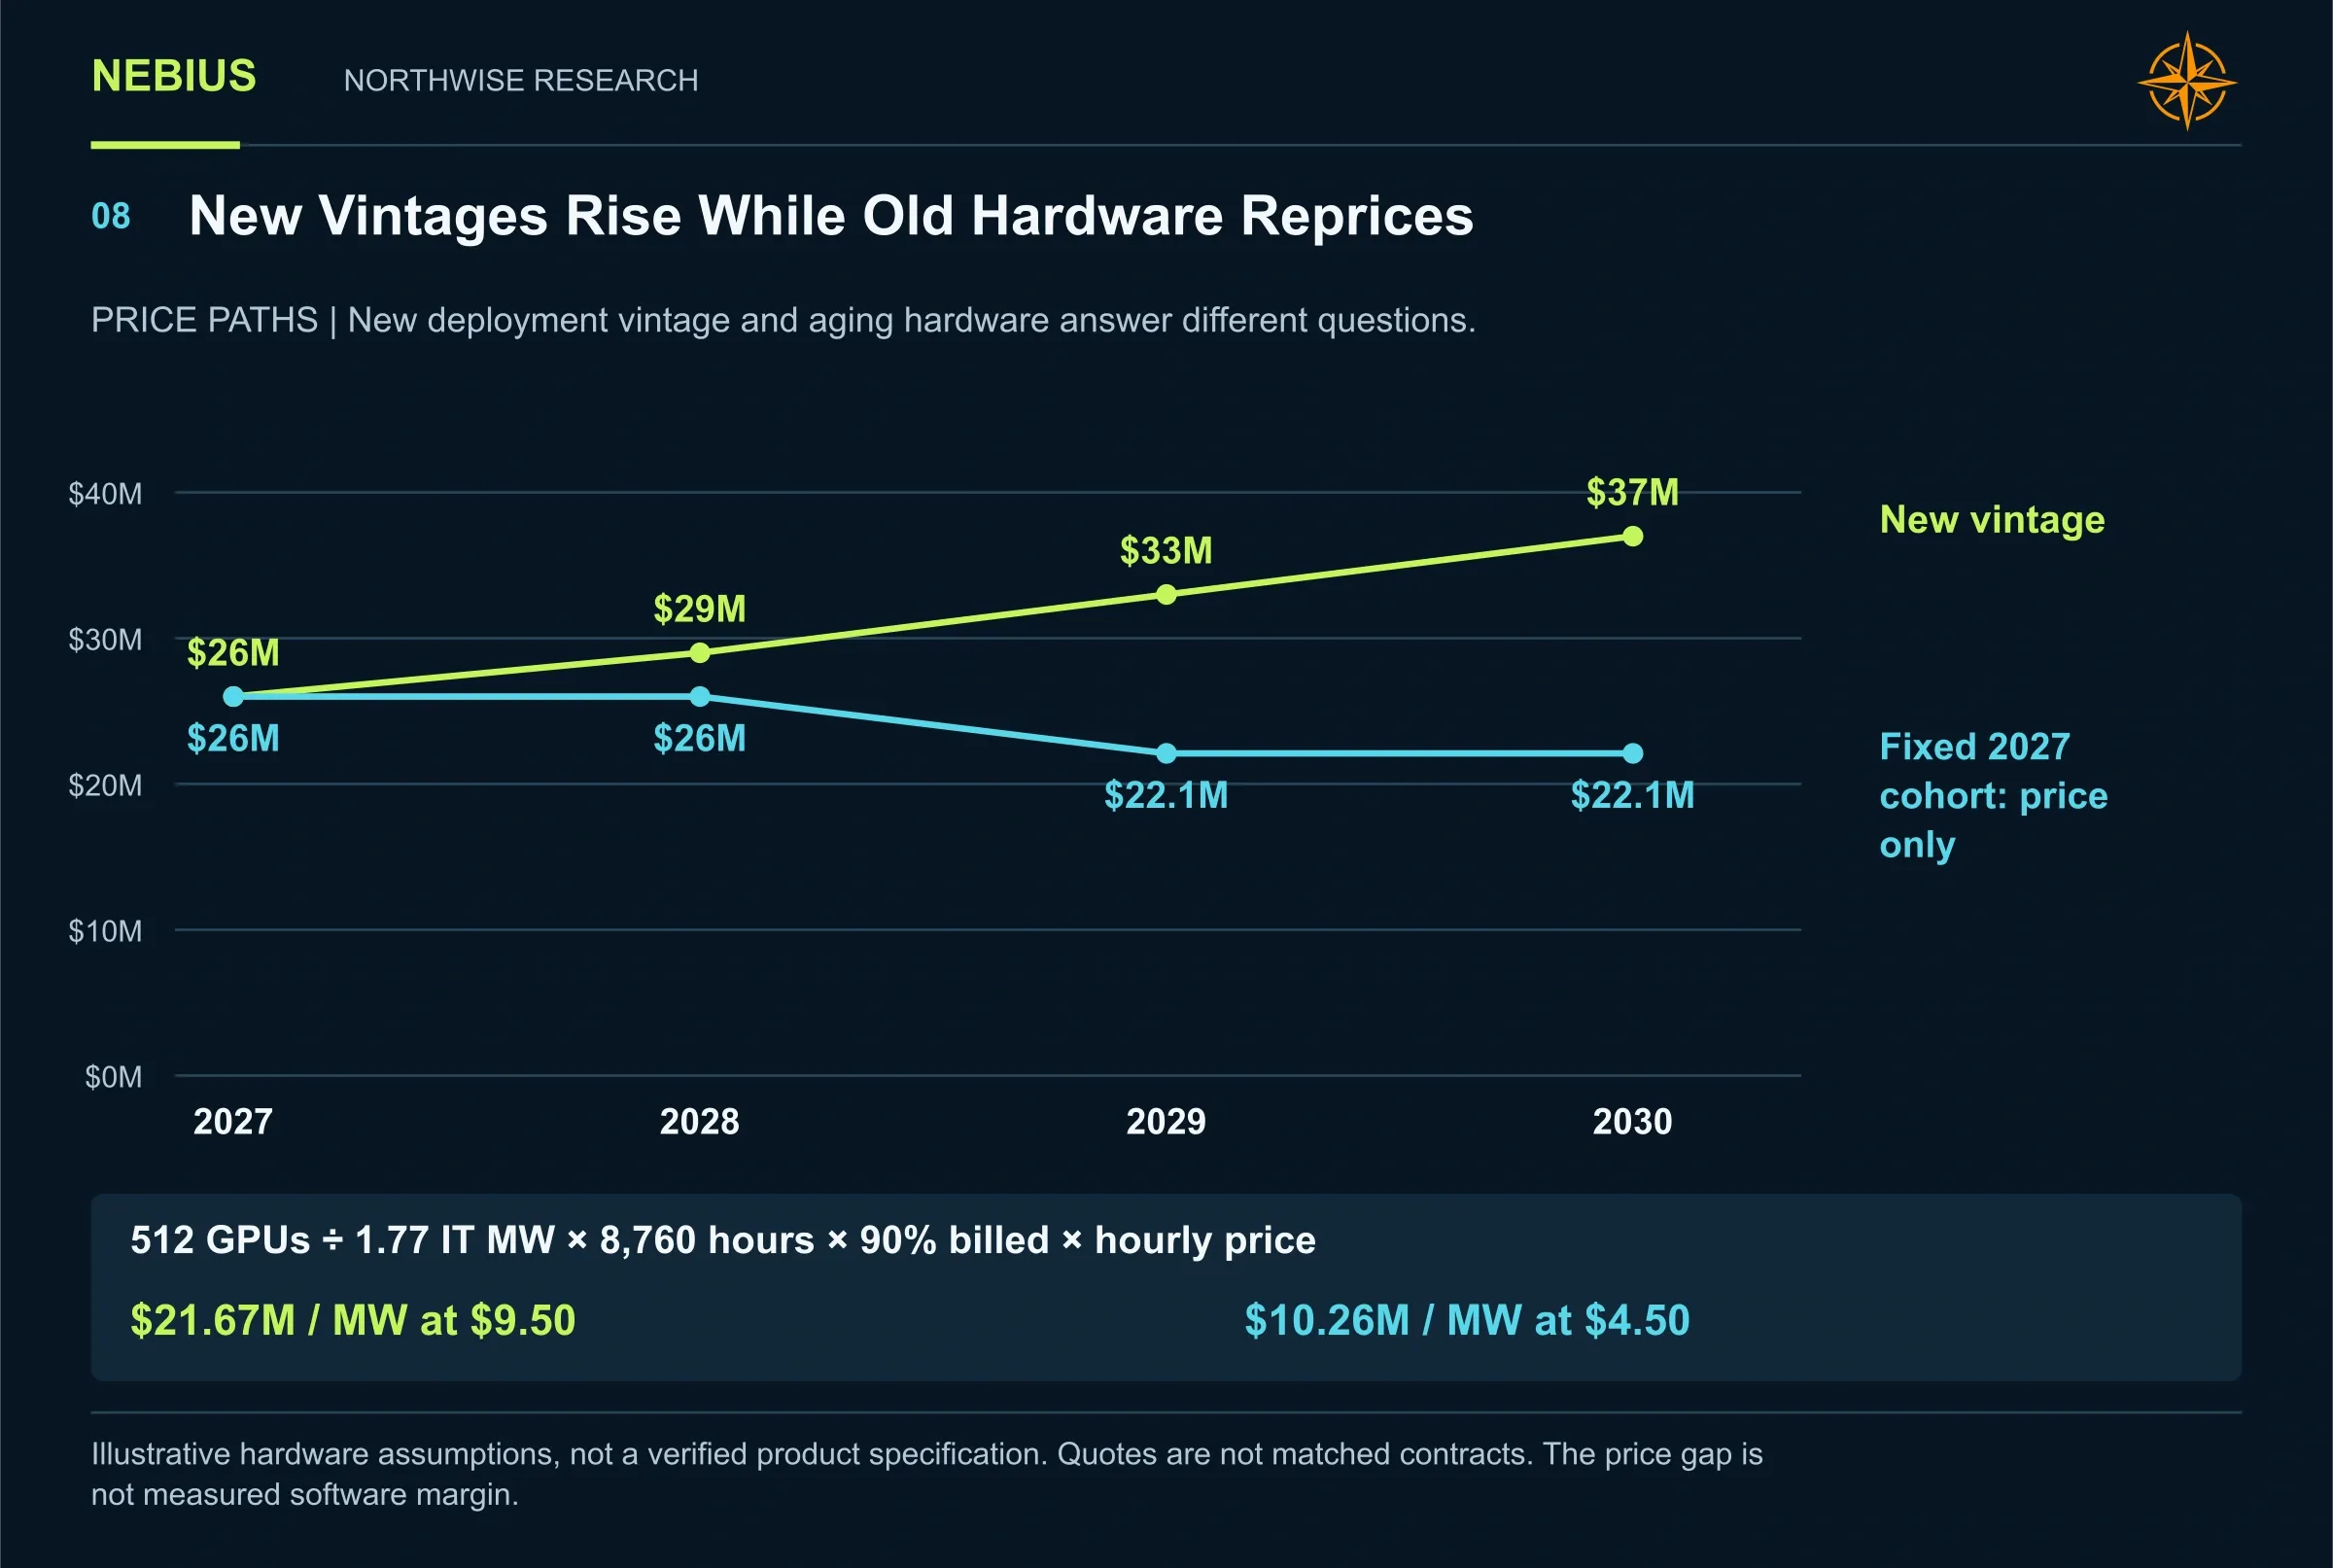
Our new-deployment pricing curve rises from $26 million per IT MW in 2027 to $37 million in 2030. Adjacent owned-cloud disclosures describe higher pricing opportunities, but they are not executed partner economics. An illustrative configuration of 512 GPUs per 1.77 IT MW produces $21.67 million per MW at $9.50 per GPU-hour and 90% billable time. Those hardware figures are assumptions, not a verified product specification. Reaching our forecast requires better hardware economics, pricing or separately billed services. A higher headline density on another contract does not, by itself, make this forecast conservative.
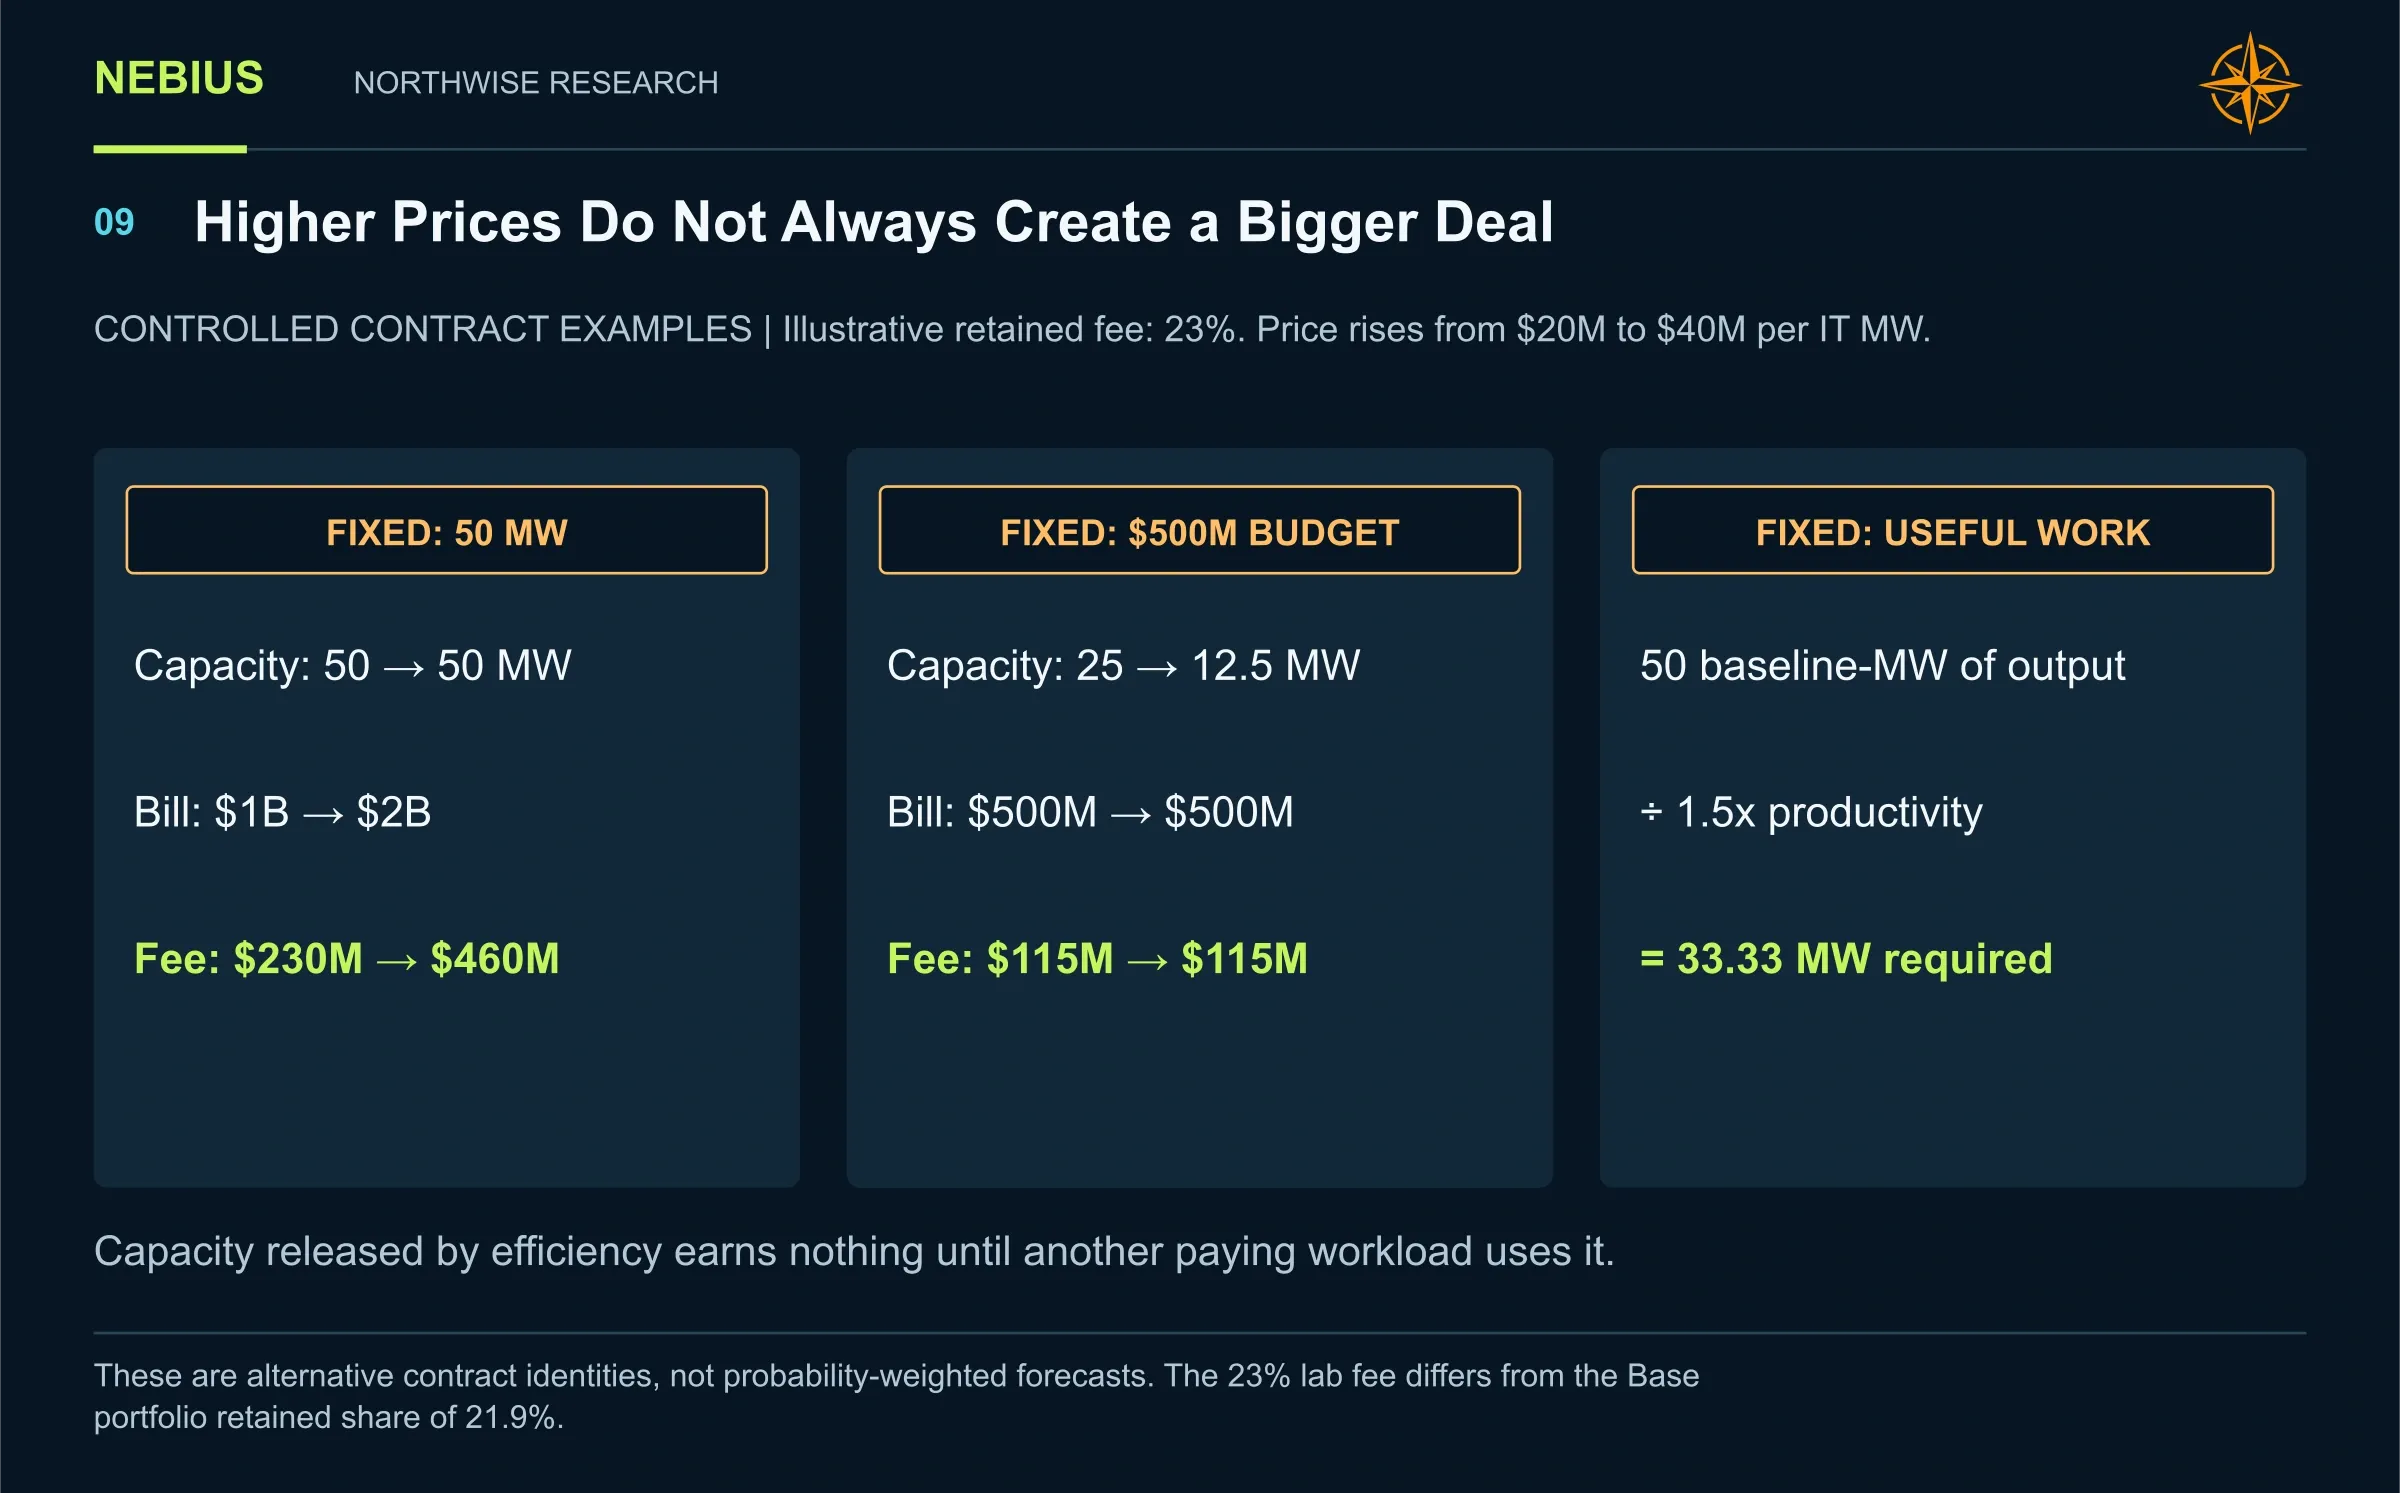
A higher price per MW also has different effects under different contracts. A customer fixing capacity spends more as prices rise; a customer fixing its budget buys fewer MW. A customer fixing useful work can need less hardware when productivity improves. Released capacity produces revenue only if another paying workload fills it.
Private deployments run in parallel, with an average close rate of 15% and license and support fees of about $3.2 million per megawatt in 2027, rising to $4.2 million by 2030.
The Base case: an $11 billion fee business by 2030
Base case | 2027 | 2028 | 2029 | 2030 |
|---|---|---|---|---|
Retained revenue, $B | 0.57 | 2.87 | 6.10 | 11.23 |
Adjusted EBITDA, $B | 0.11 | 1.56 | 3.80 | 7.49 |
Net cash to Nebius, $B | (0.13) | 0.66 | 2.01 | 4.51 |
Installed IT capacity, MW | 404 | 861 | 1,525 | 2,302 |
The ramp is slow for 2 years and then steep. Revenue in 2027 is just $0.57 billion, as early projects work through construction and acceptance. By 2029 the fleet is large enough, and newer capacity valuable enough, for the fee stream to compound quickly.
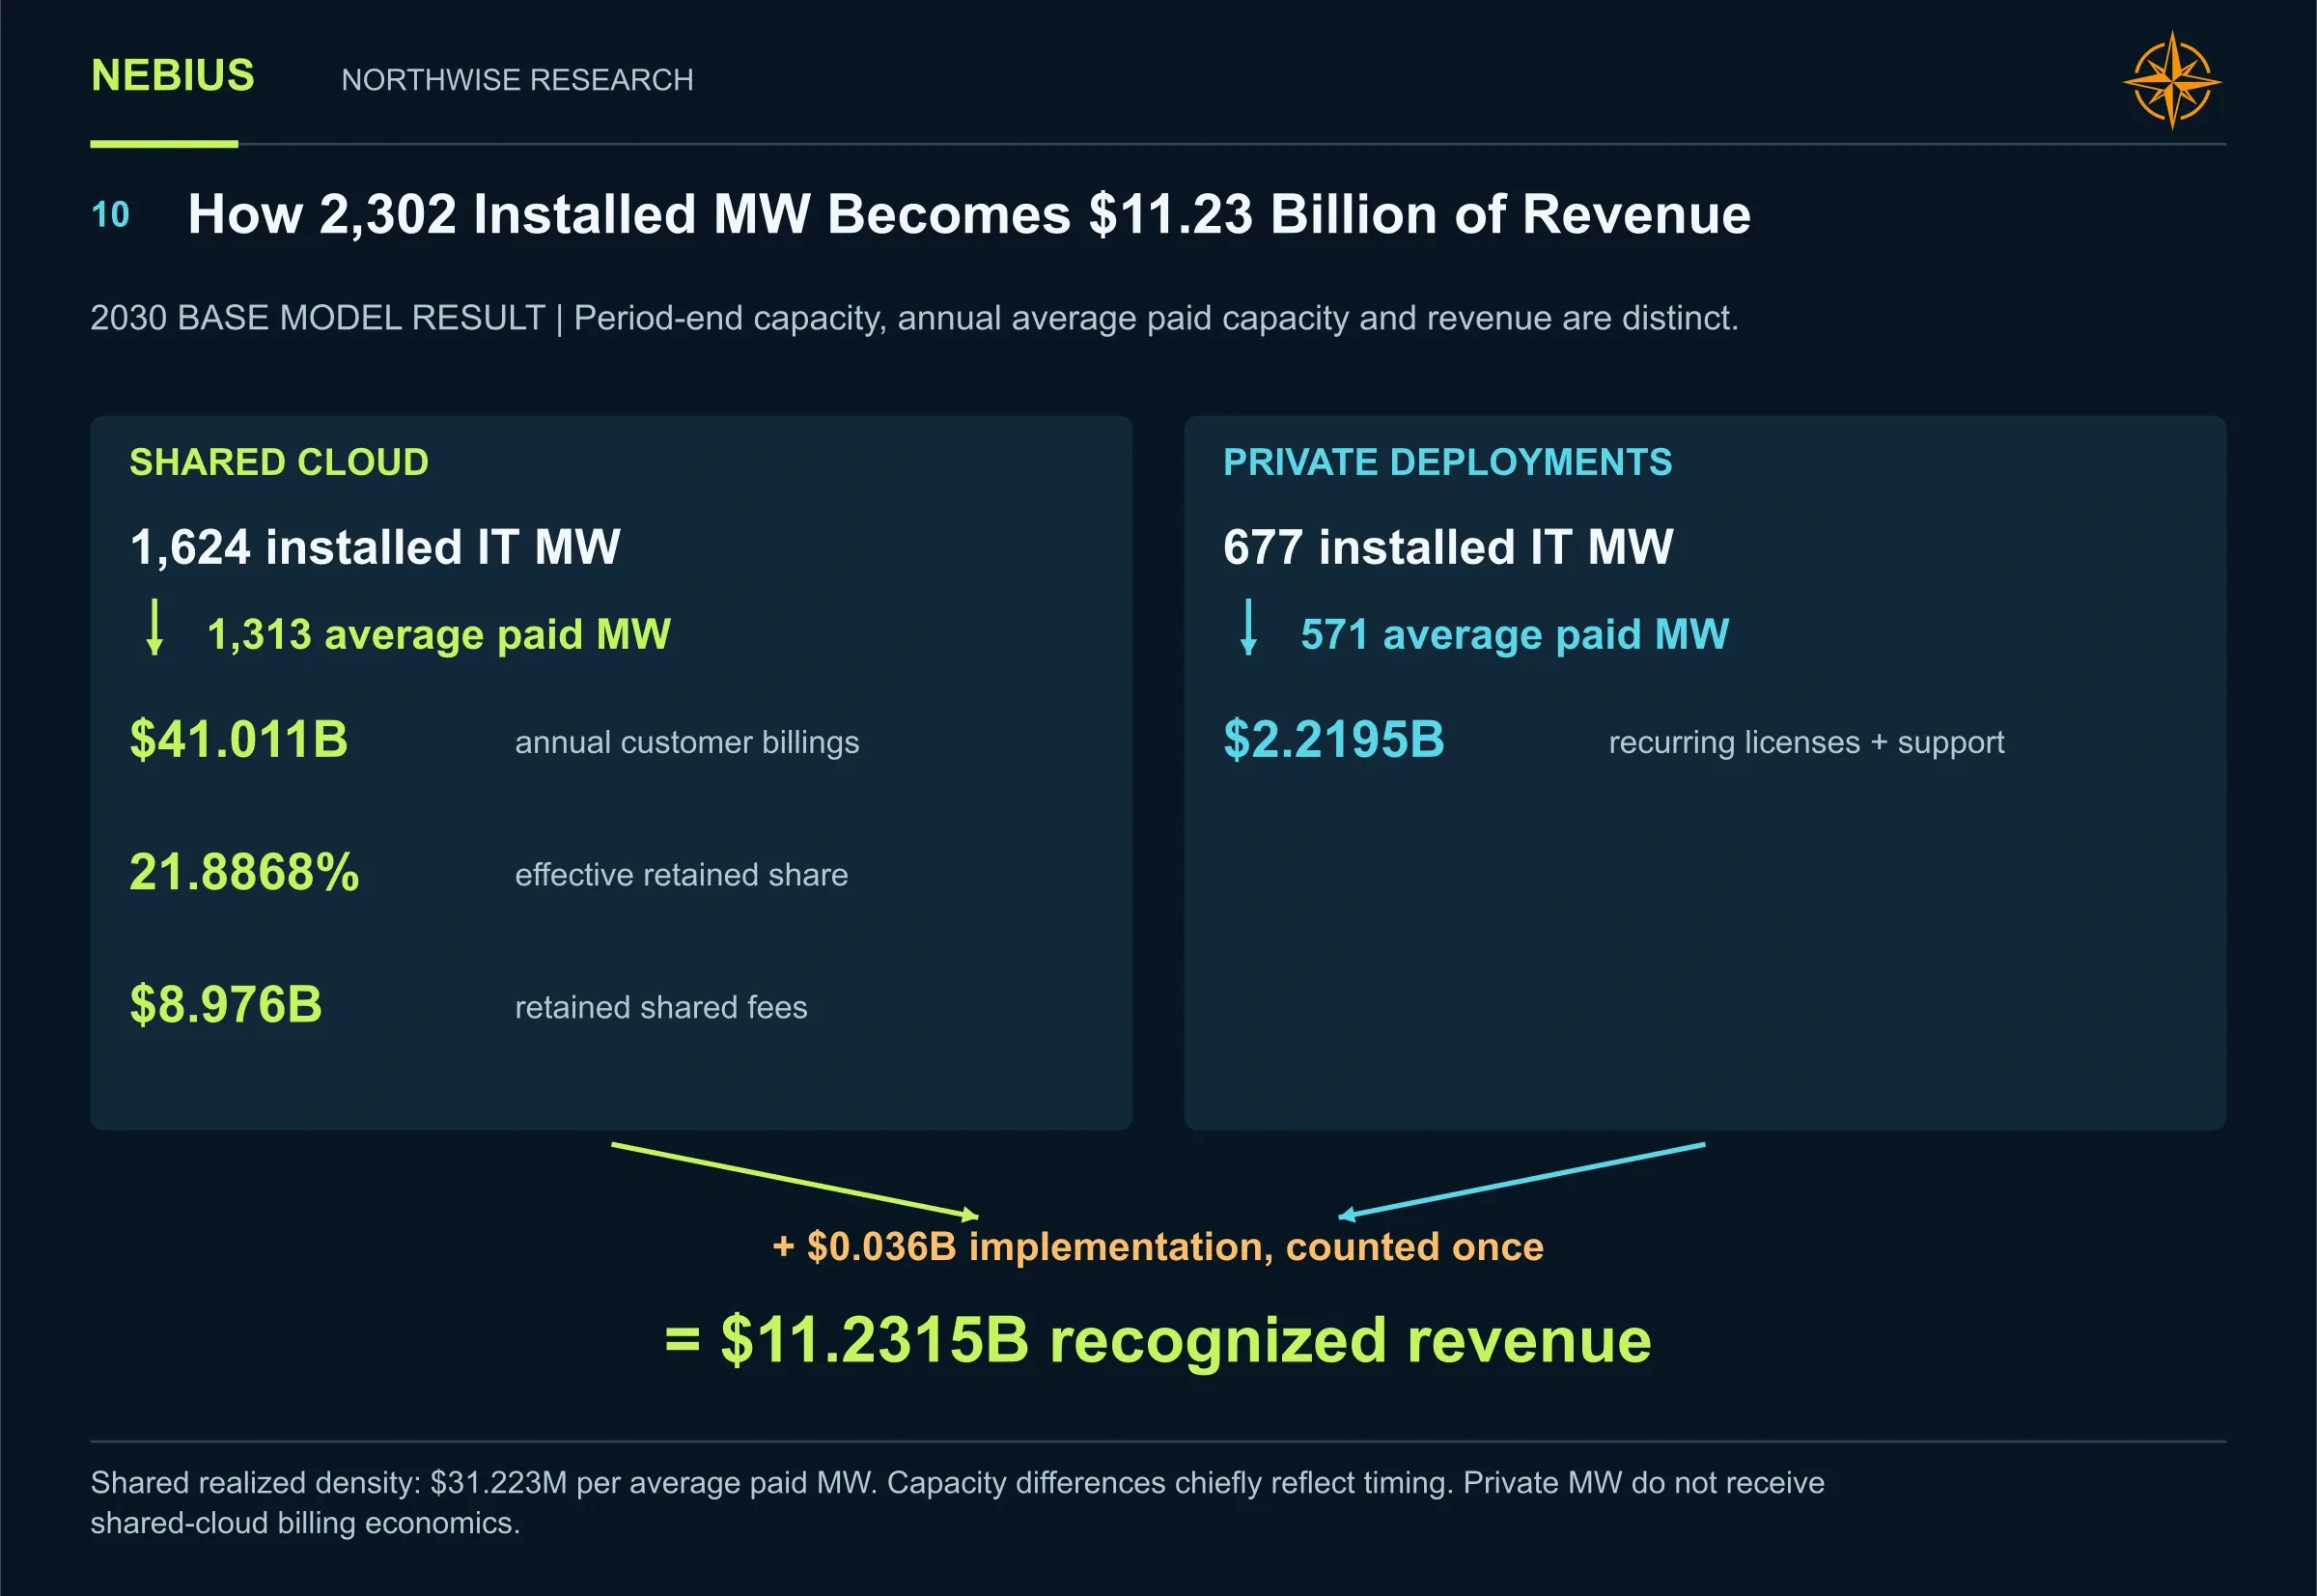
In 2030, the Base case averages 1,313 MW of paid shared capacity at about $31 million of customer billings per MW. Customers pay $41.0 billion and Nebius retains 21.9%, or $8.98 billion. Private deployments add $2.22 billion of recurring revenue across 571 average paid MW, compared with 677 MW installed at year-end. That is about $3.9 million per average paid private MW, versus $6.8 million of retained shared-cloud revenue on the same time basis. Implementation adds about $36 million once.
What makes the modeled business attractive is its operating leverage. Service delivery, royalties and onboarding cost $1.69 billion in 2030, sales $0.75 billion, research and development $1.01 billion, and overhead $0.29 billion. Adjusted EBITDA of $7.49 billion is a 67% margin, and Nebius platform capex that year is $311 million. Those margins depend on the modeled fee, service cost and scale. They are not observed segment results.
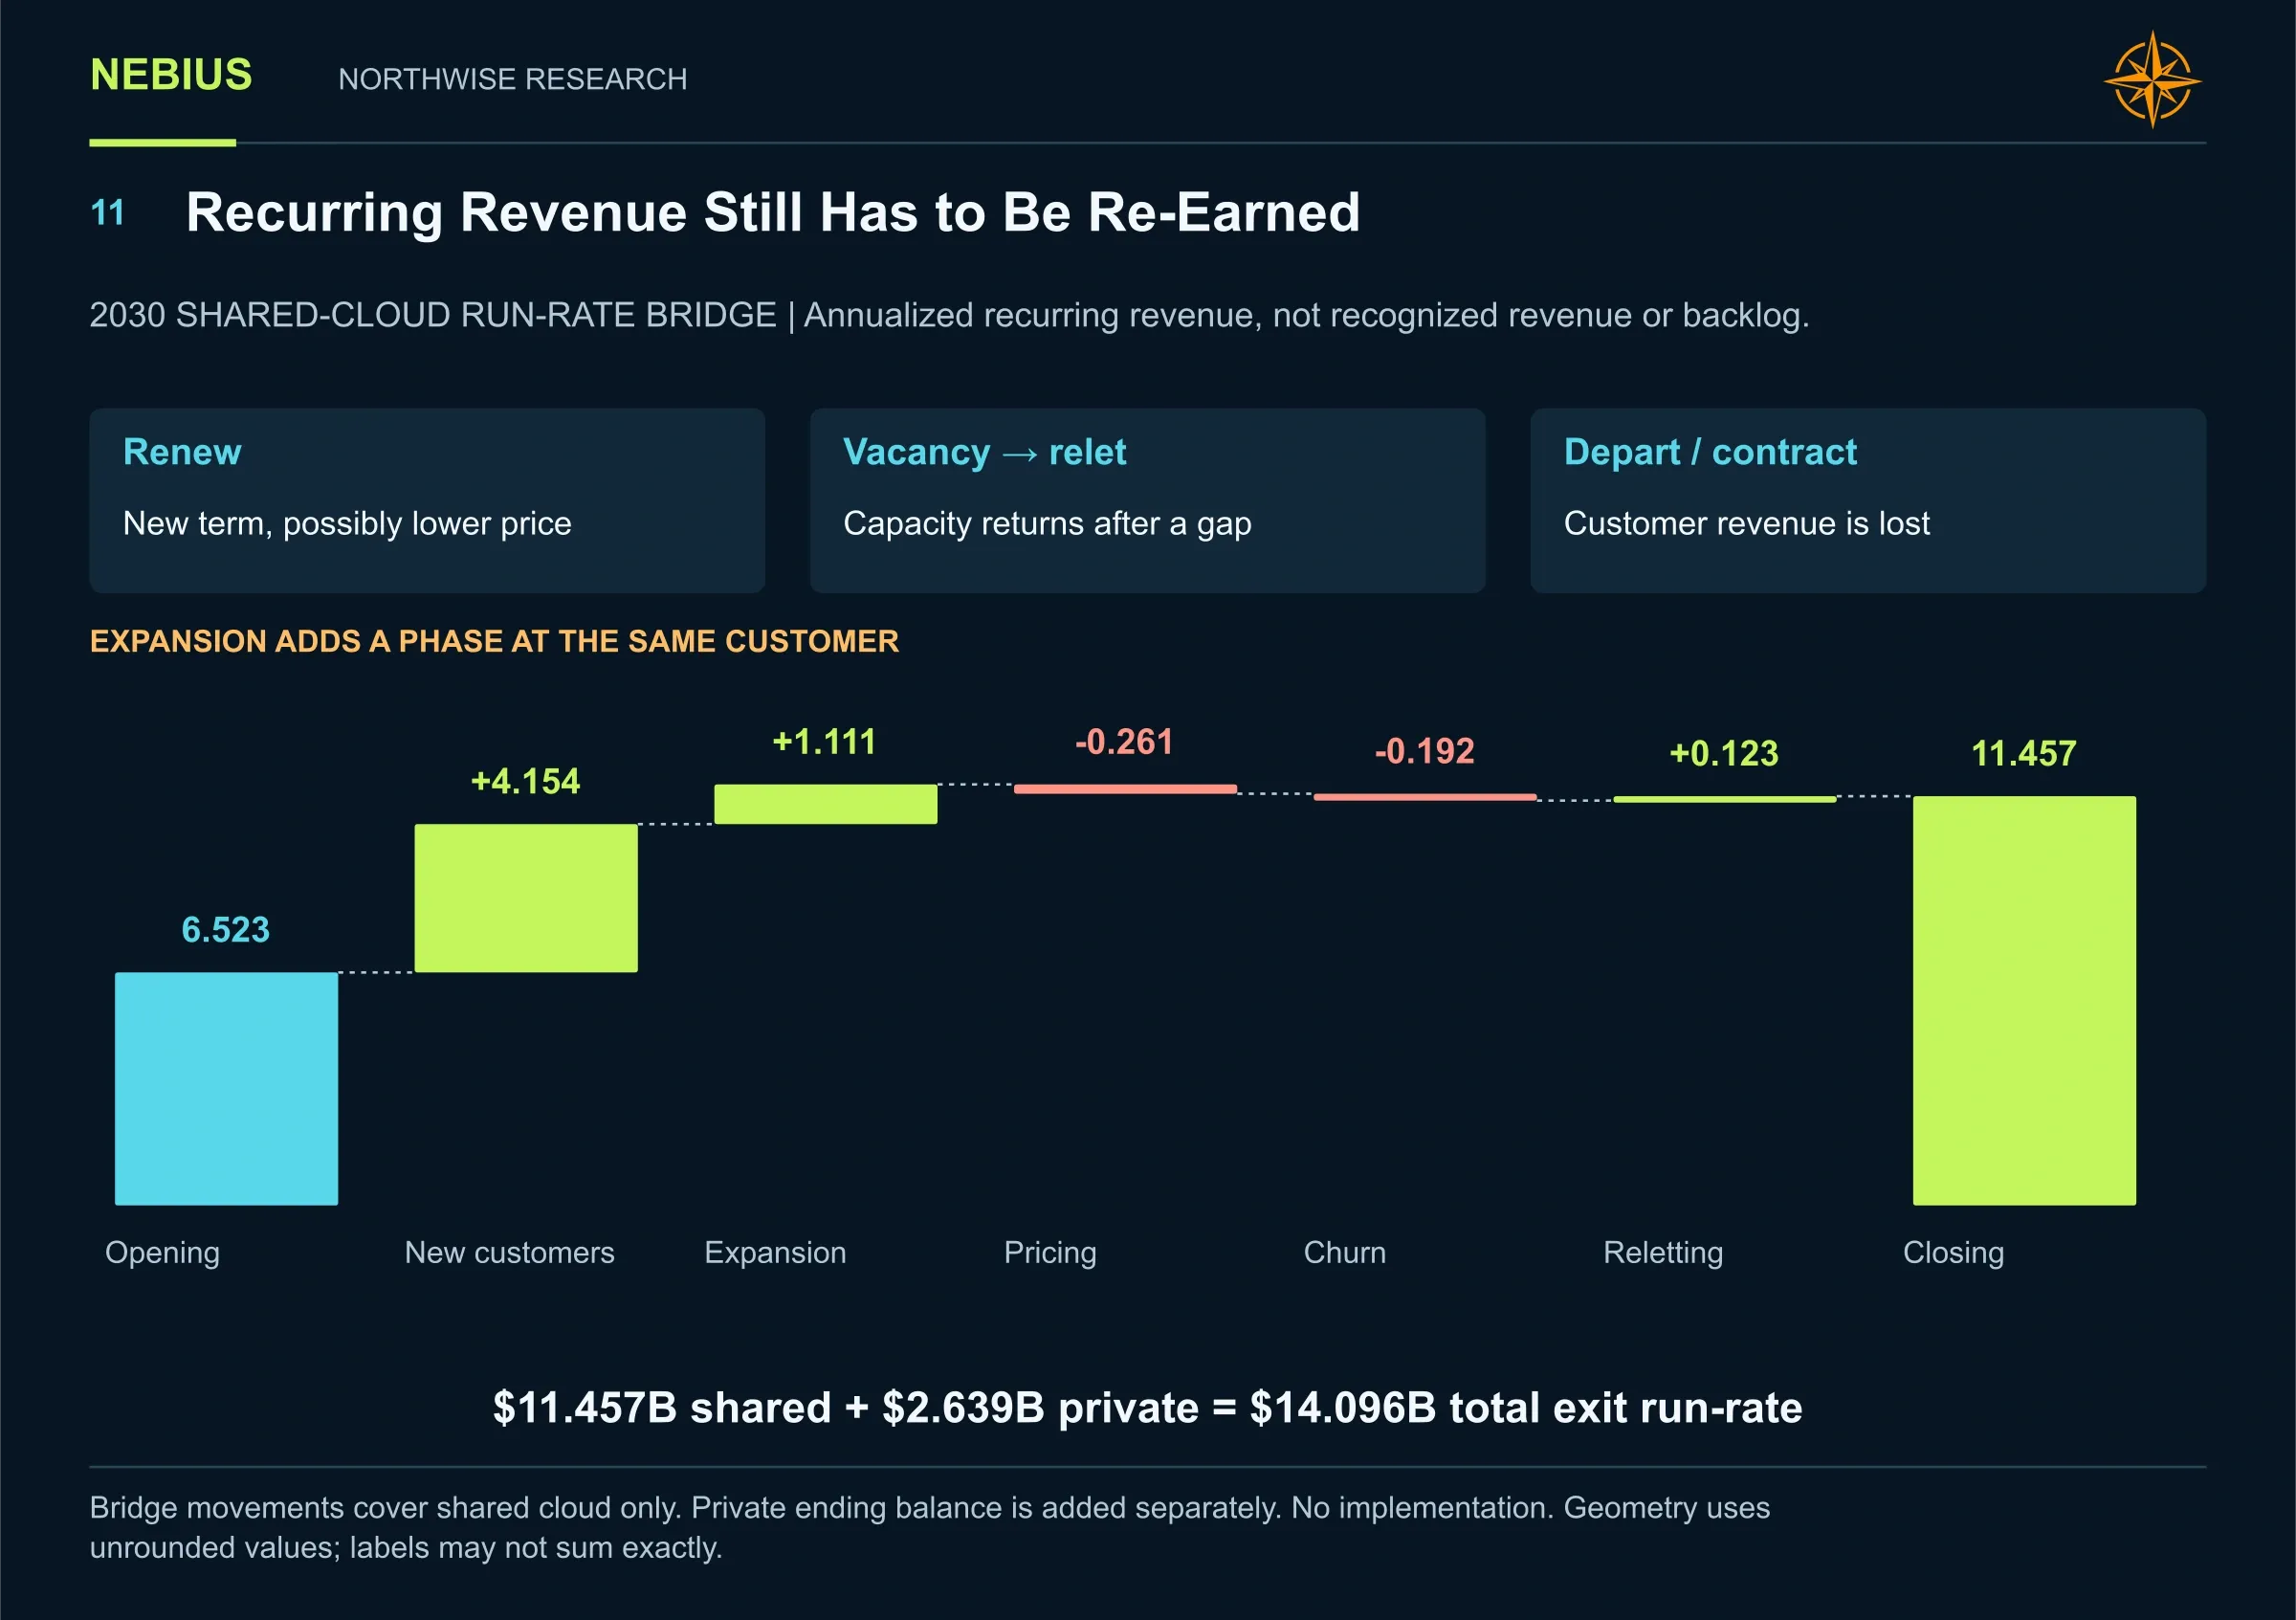
The Base exits 2030 with $14.10 billion of annualized recurring revenue, including $11.46 billion of shared-cloud fees and $2.64 billion of private recurring revenue. This is an ending run-rate, not the $11.23 billion recognized during the year. New customers and expansions add revenue, while repricing, departures and reletting change the existing book.
Bear, Base and Bull, and an honest word about the middle
2030 outcome | Bear | Base | Bull |
|---|---|---|---|
Retained revenue, $B | 5.79 | 11.23 | 17.78 |
Adjusted EBITDA, $B | 3.48 | 7.49 | 12.50 |
Net cash to Nebius, $B | 2.03 | 4.51 | 7.72 |
Cumulative net cash 2026-2030, $B | 2.74 | 6.79 | 12.40 |
Installed IT capacity, MW | 1,375 | 2,302 | 3,194 |
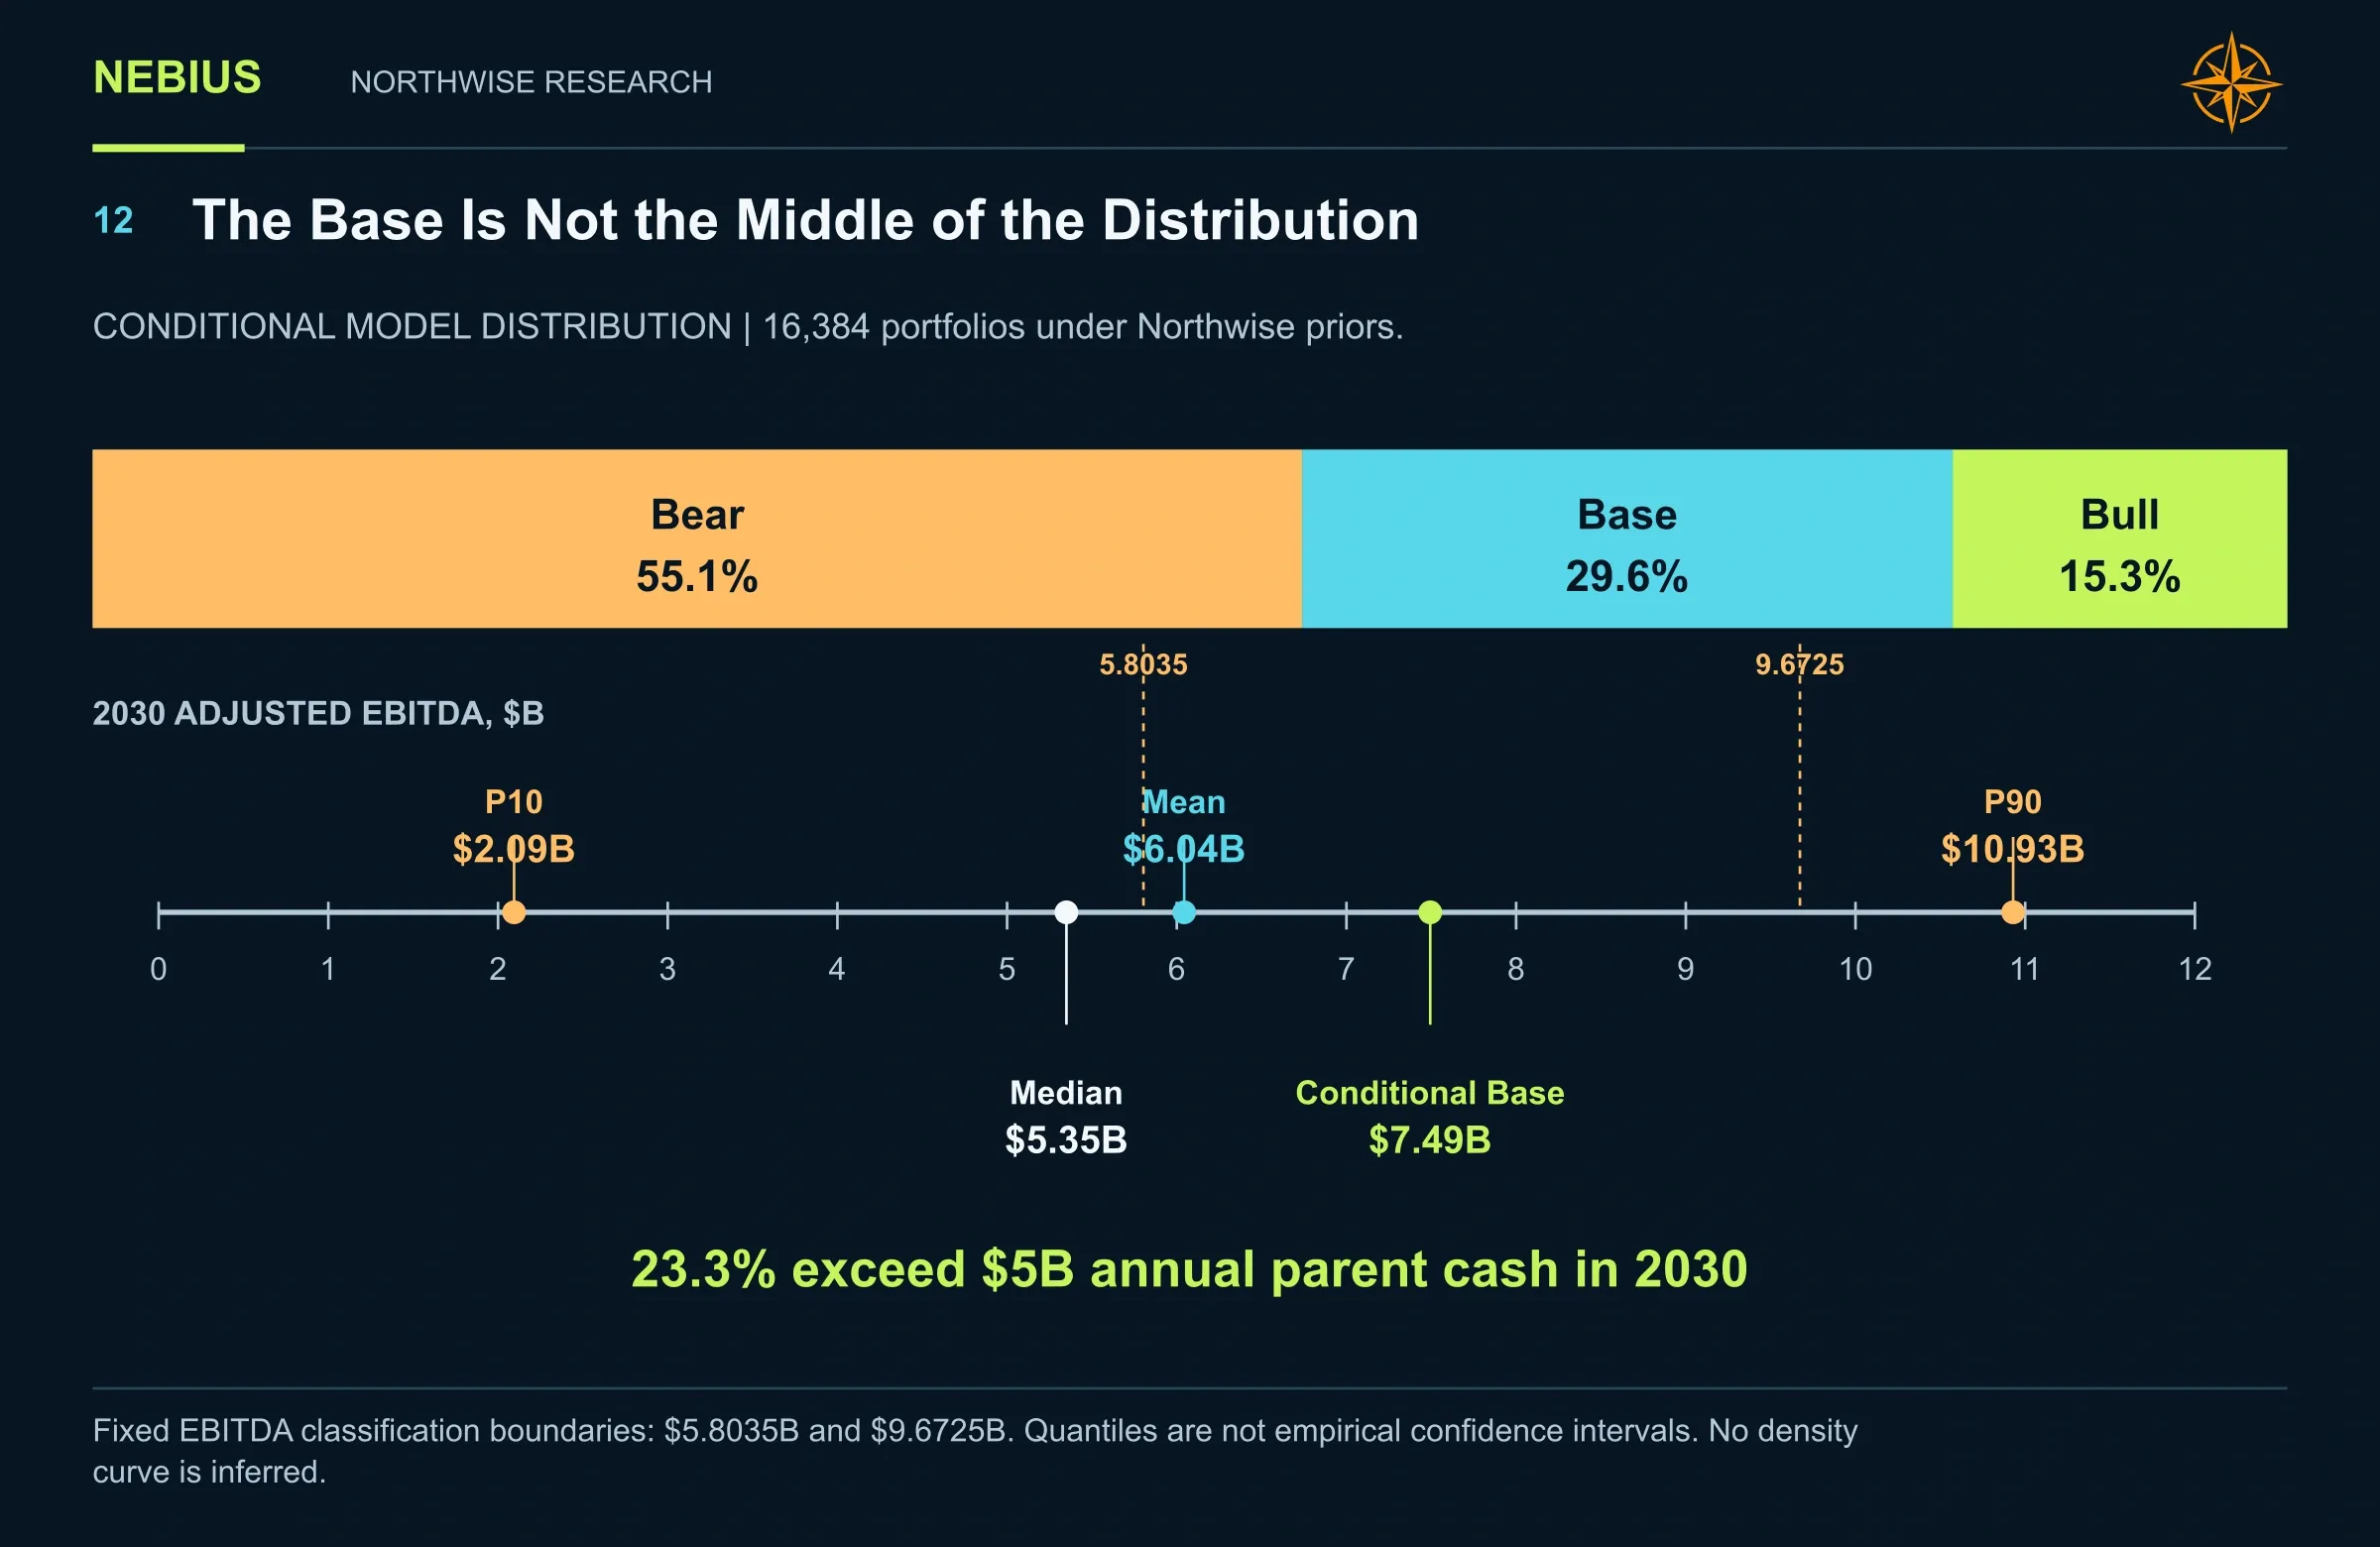
Each case averages the simulated portfolios that land in a fixed range of 2030 EBITDA: below $5.8 billion for Bear, $5.8 billion to $9.7 billion for Base, and above $9.7 billion for Bull.
We hold ourselves to an uncomfortable fact here. More of our simulated outcomes land in the Bear range than in the Base range. The Base is a credible execution path that requires things to go somewhat right, and anyone underwriting Nebius on a Base-case contribution from this business should know that.
The Bear case is still a meaningful modeled business: $3.5 billion of adjusted EBITDA in 2030 on 1,375 MW. It is the average of outcomes in a specified band, not a floor. The full distribution has a median of $5.35 billion and a mean of $6.04 billion of adjusted EBITDA; 55.1% of modeled portfolios fall in the Bear band, 29.6% in Base and 15.3% in Bull. These probabilities are conditional on the chosen priors, not observed odds of success.
What moves the outcome most
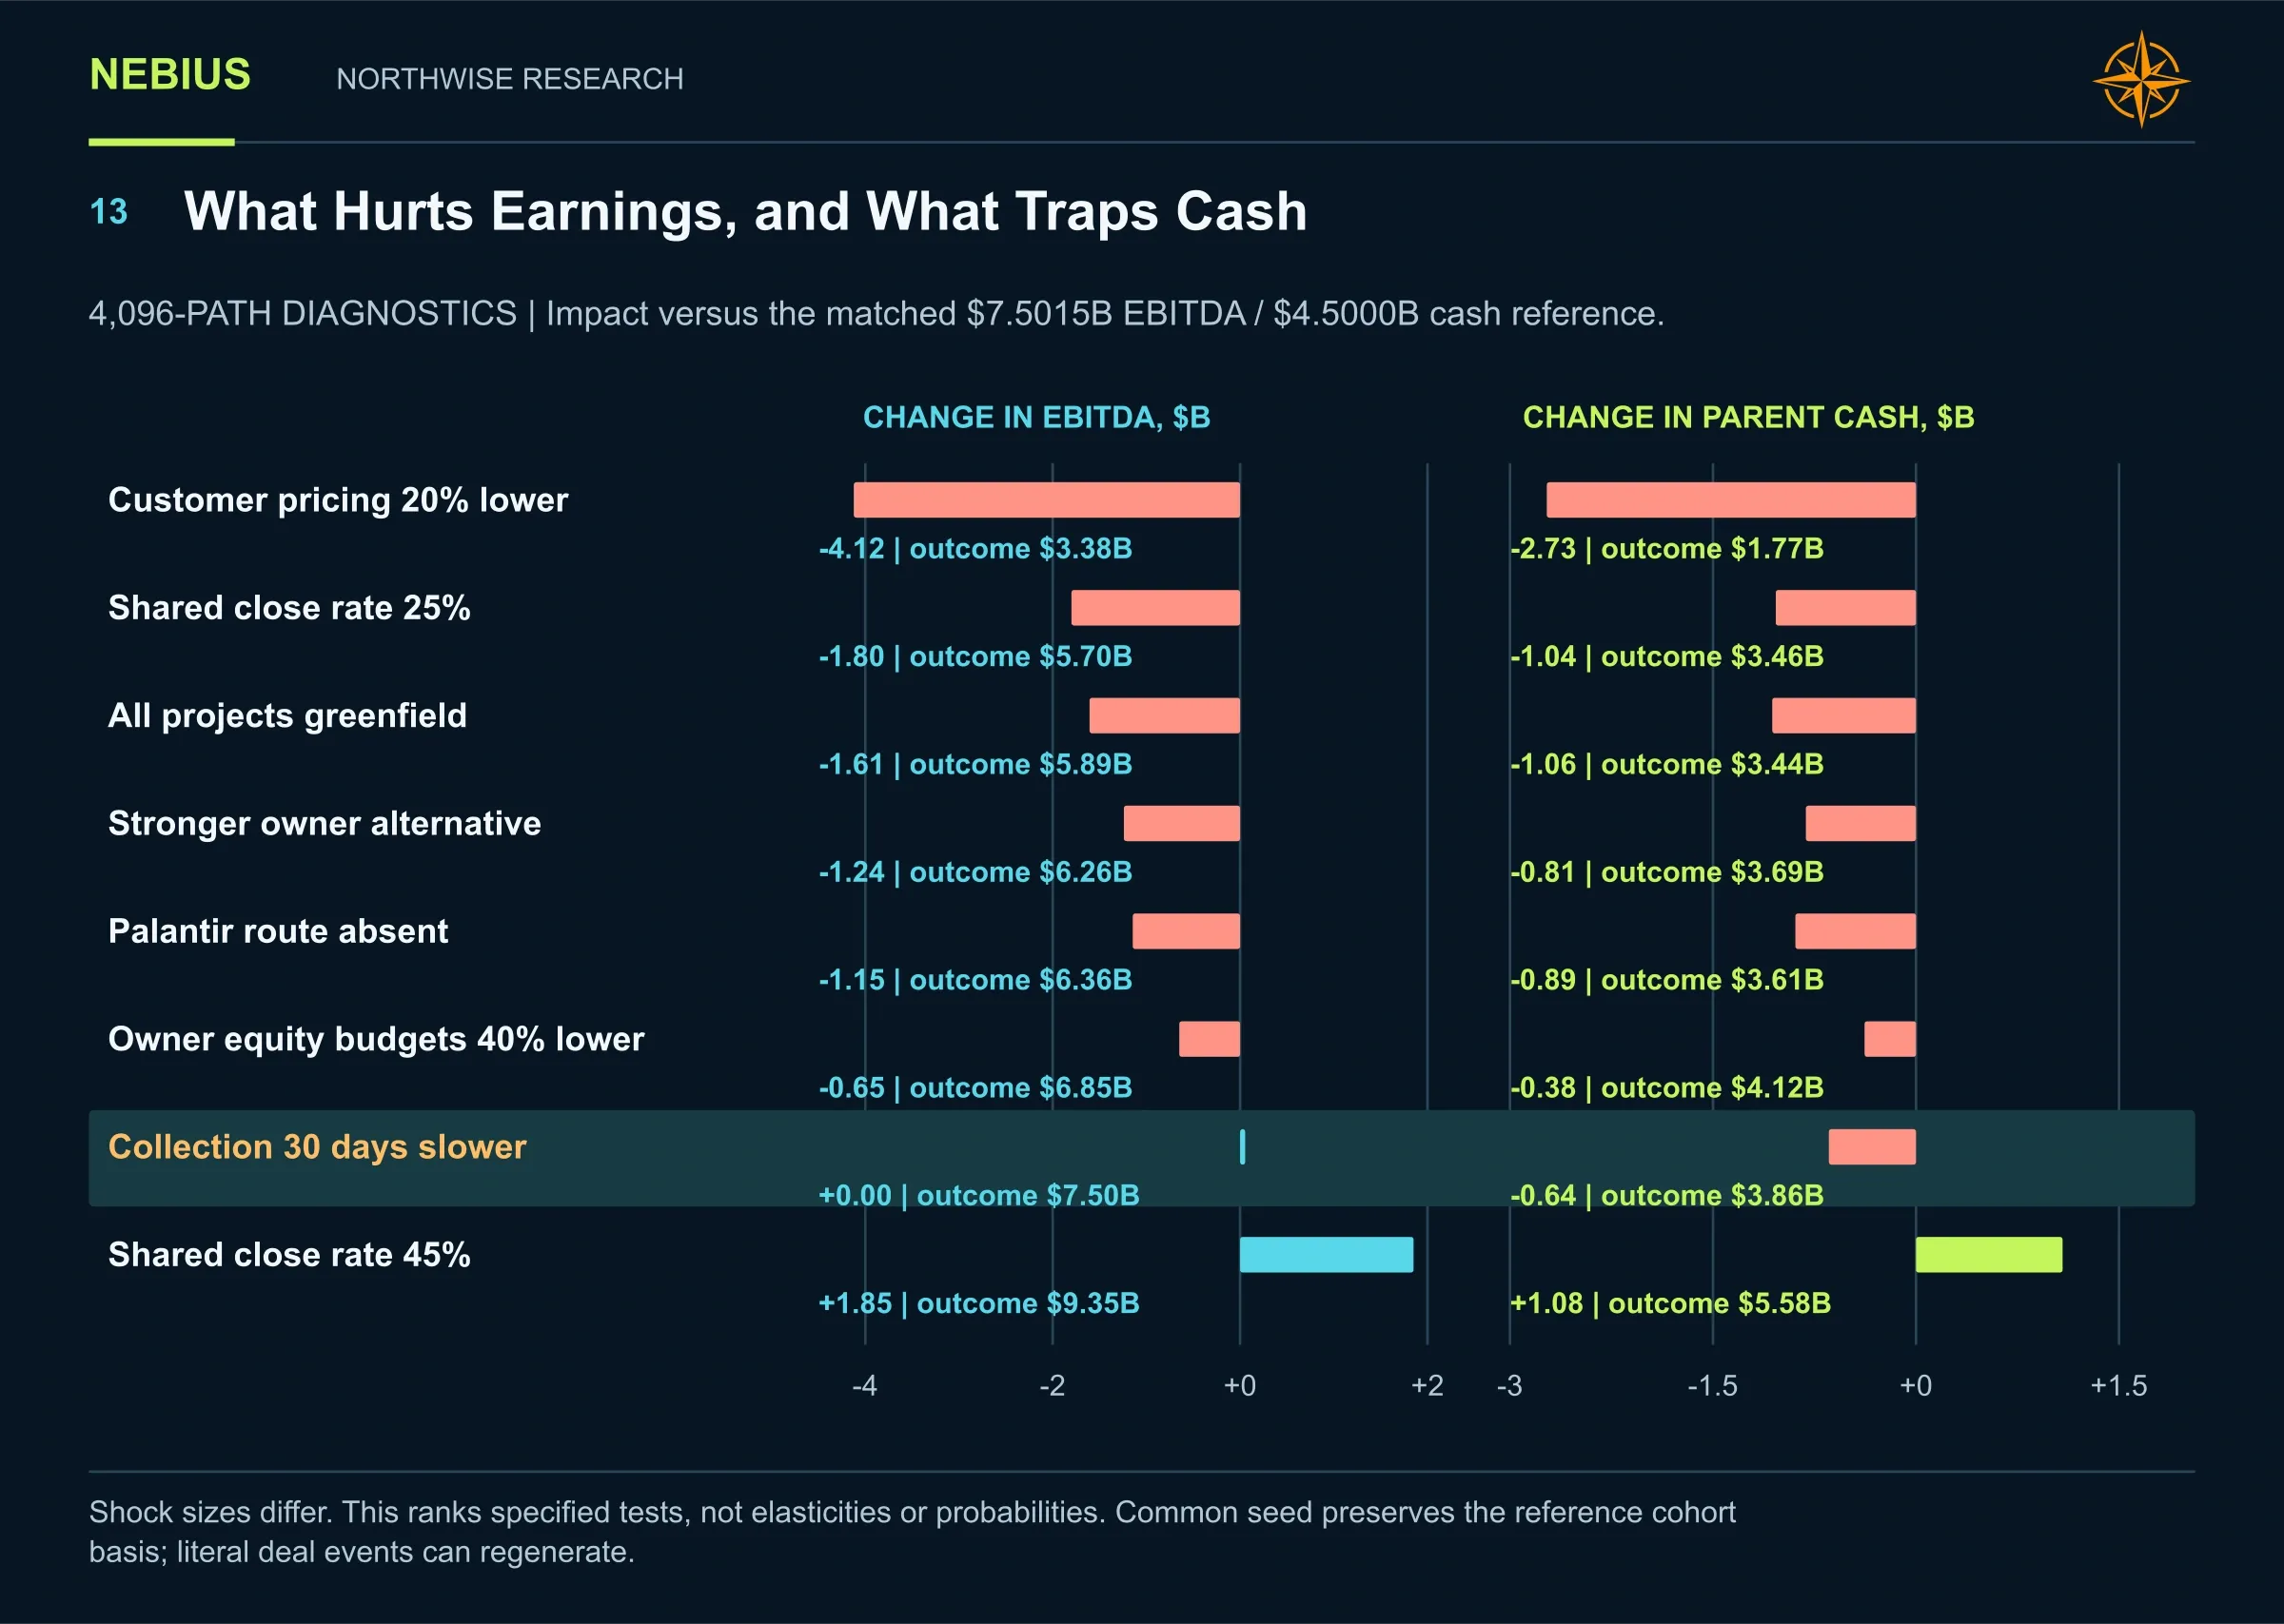
Our stress study uses 4,096 portfolios, changes one assumption at a time and compares the same reference Base group using common random seeds. Deal outcomes can change under each shock. Its matched reference is $7.50 billion of adjusted EBITDA and $4.50 billion of parent cash, slightly different from the main 16,384-portfolio Base.
Single change (Base-case portfolios) | 2030 EBITDA, $B | 2030 net cash, $B |
|---|---|---|
Reference | 7.50 | 4.50 |
Customer pricing 20% lower | 3.38 | 1.77 |
Shared close rate 25% instead of 35% | 5.70 | 3.46 |
Every project built from bare land | 5.89 | 3.44 |
Owners better at running their own clouds | 6.26 | 3.69 |
Palantir route never materializes | 6.36 | 3.61 |
Steeper renewal repricing (25% per renewal) | 6.45 | 3.76 |
No renewal repricing | 8.45 | 5.15 |
Every project on a powered site | 8.56 | 5.21 |
2030 capacity priced at $45M per MW | 8.70 | 5.21 |
Shared close rate 45% | 9.35 | 5.58 |
Pricing dominates. A 20% lower customer price cuts 2030 EBITDA by more than half, since lower prices shrink both the fee and the number of projects owners will finance. Close rates come next, then delivery timing, then the owner's bargaining position.
Financing is less sensitive within these particular assumptions. Cutting sponsor equity budgets by 40% lowers Base adjusted EBITDA to $6.85 billion; adding 200 basis points to owner borrowing costs lowers it to $7.39 billion. That result follows from the model’s funded-partner selection, capital structure and project economics. It does not establish that real-world financing will be readily available. Shock sizes also differ, so this table is not a standardized ranking of causal importance.
Palantir matters less to 2030 than the headlines suggest. Losing the route entirely costs about $1.1 billion of EBITDA, and a 12 to 18 month integration delay barely moves 2030 at all. Brokers such as Era help at the margin by filling vacant capacity faster, worth about $0.1 billion.
Where the cash goes
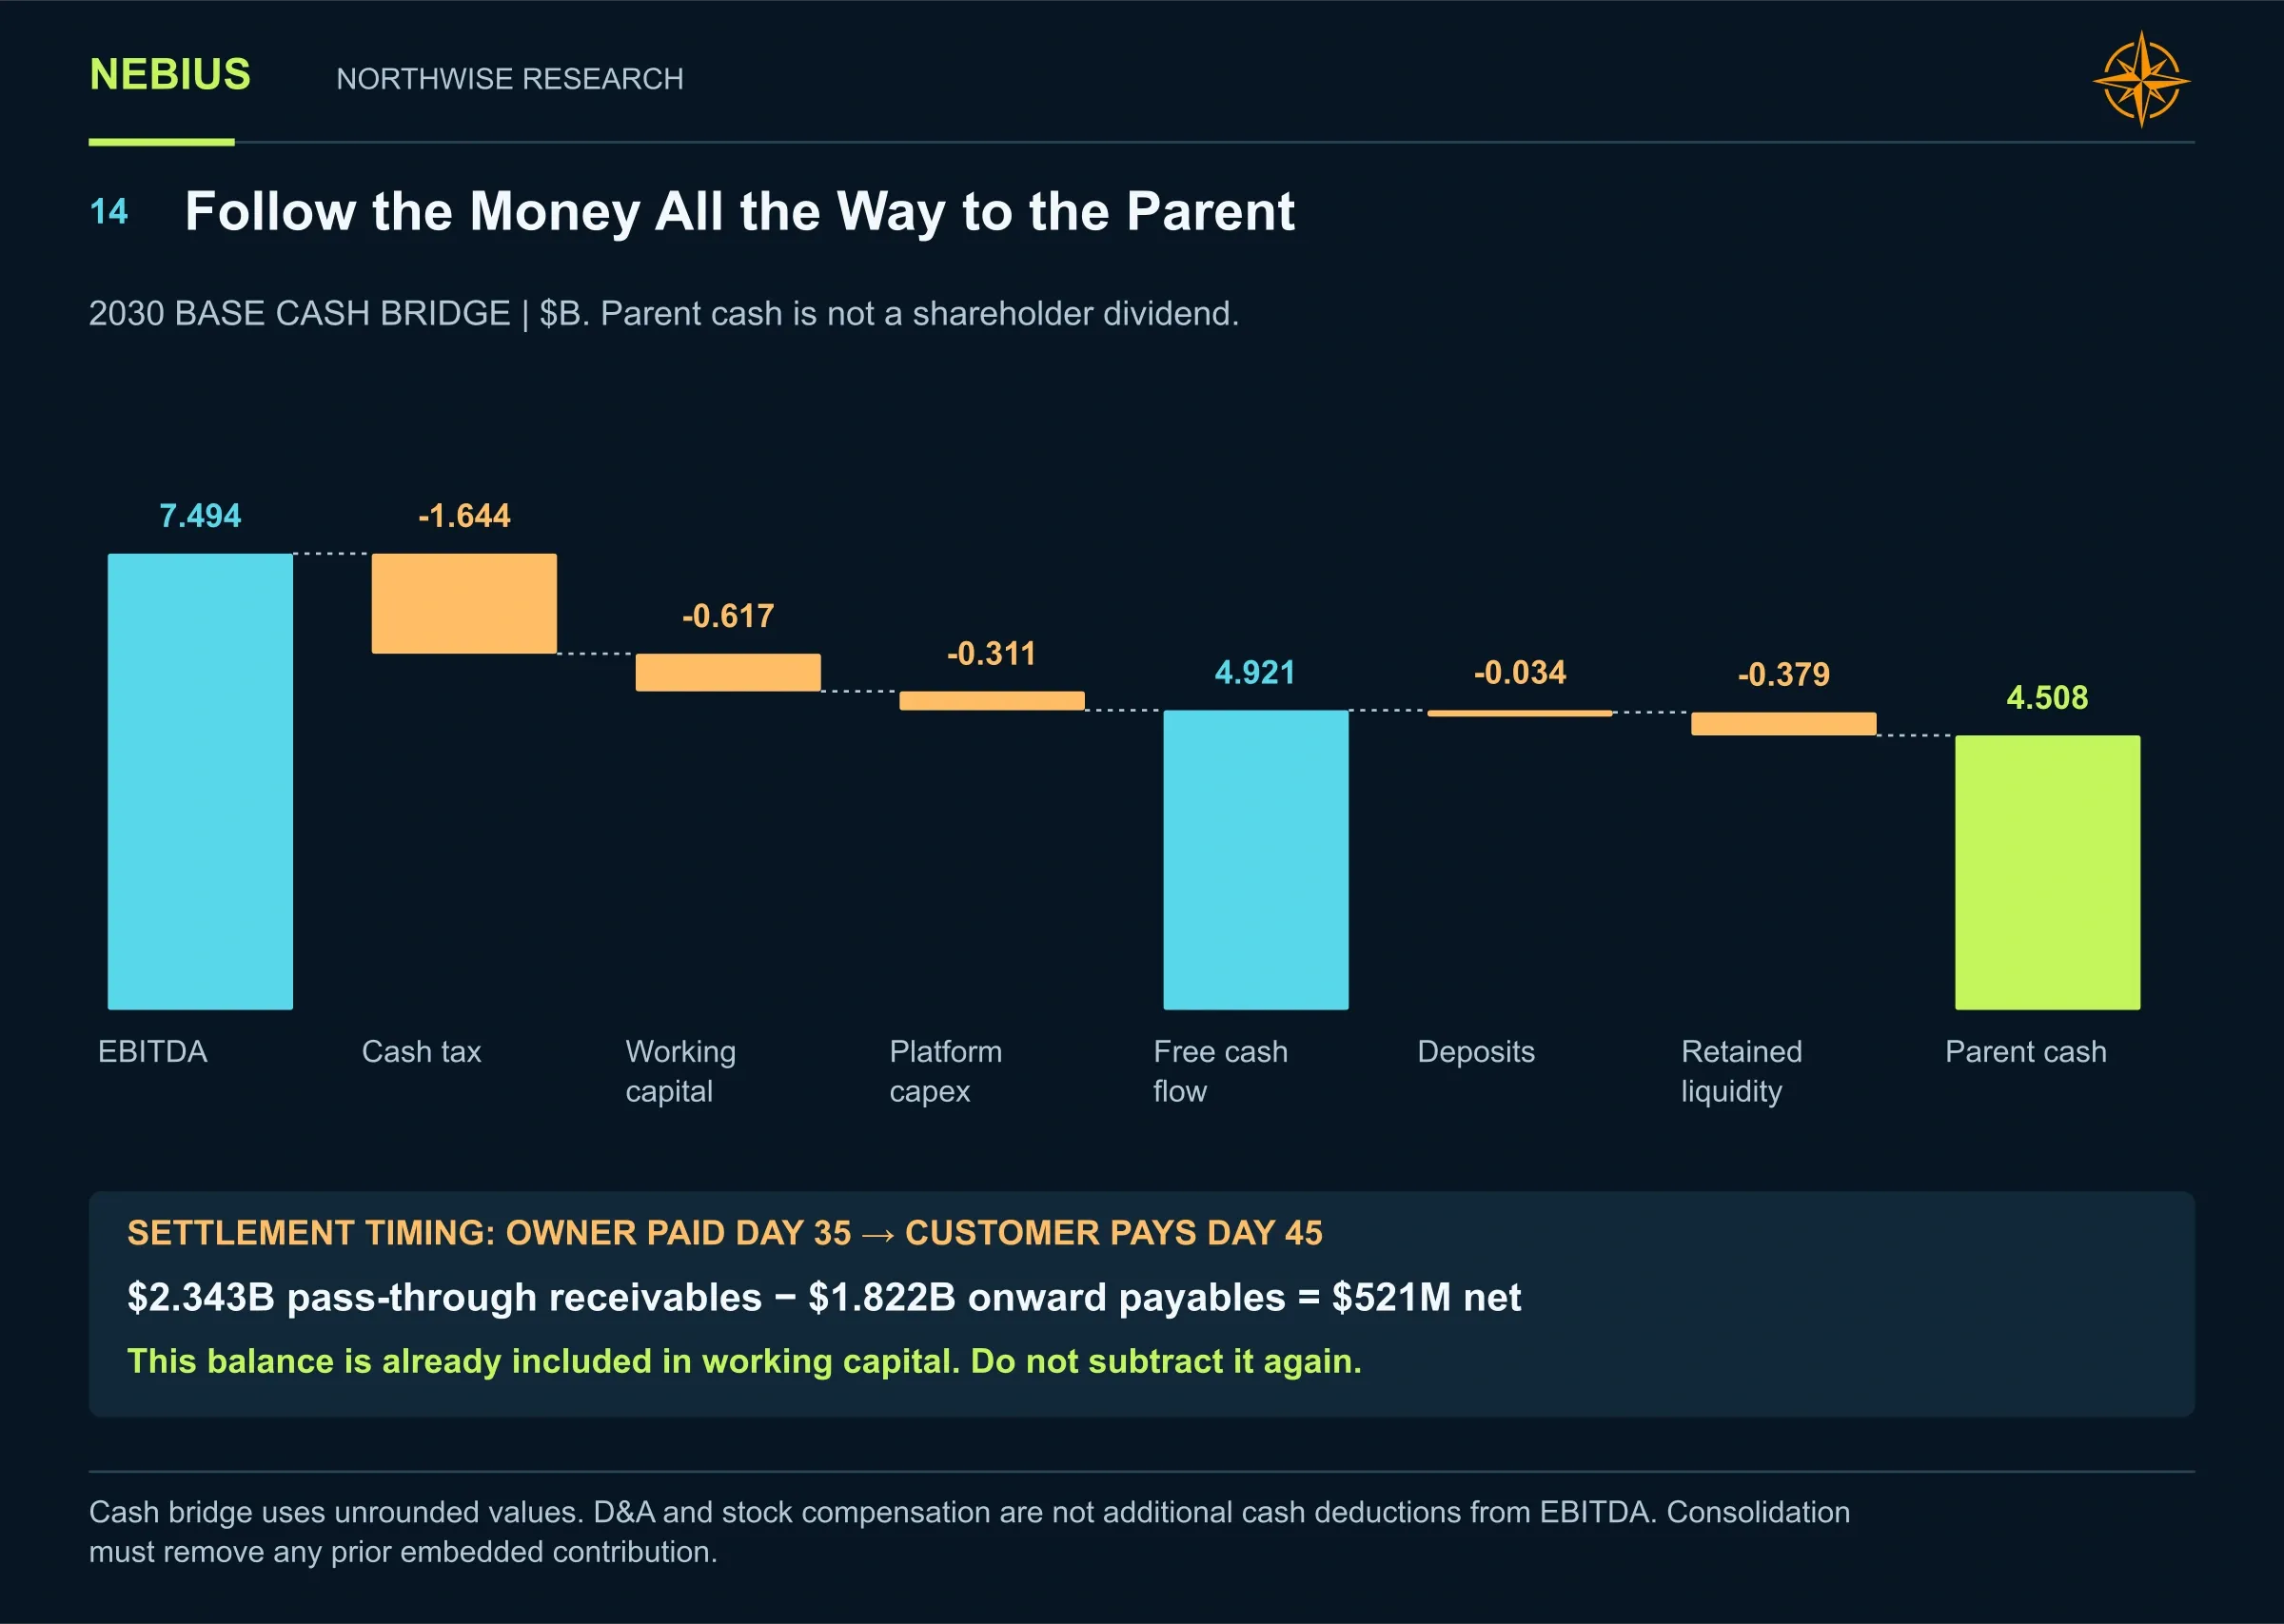
Fee income does not reach Nebius shareholders in full. Nebius collects customer payments on part of the shared business and passes the owners' share through, so at the end of 2030 it holds about $2.34 billion of receivables, partly owed onward, against $1.82 billion it owes partners.
Payment timing matters as much as earnings. Adding 30 days to customer payment terms leaves 2030 EBITDA unchanged at $7.50 billion, yet cuts cumulative net cash through 2030 from $6.75 billion to $5.18 billion.
The main Base cash bridge begins with $7.49 billion of adjusted EBITDA, deducts taxes, working capital and platform investment, and reaches $4.92 billion of free cash flow. Required operating liquidity and restricted deposits reduce cash available to the parent to $4.51 billion. The pass-through receivable and payable balances are already included in working capital; they are not another deduction.
The launch itself is cheap by Nebius standards. The deepest cumulative funding need in the Base case averages about $455 million, reached in 2027, before the platform turns cash positive in 2028. For a company spending billions a quarter on its own cloud, that is a small bet.
Where we stand
The constructive case is that an externally financed platform could become a high-margin second business with limited Nebius hardware capex. The partner program exists, Palantir has named a preferred relationship and Nebius has the technical and commercial capabilities to compete. The billions in our scenarios remain forecasts of execution, not proof that the opportunity has already been secured.
The cautious case is that fees are negotiable and the clock can be long. Hardware prices reprice, owners have alternatives, and project-level partner megawatts and fee terms remain undisclosed. Those pressures explain why our Base retained share is closer to 22% than the 25% opening request we assume, and why most simulated outcomes fall below the Base band.
Our view is that the asset-light platform is a real and underappreciated second engine for Nebius. Its value rests on a single condition: Nebius must keep its cloud measurably better than anything a partner could assemble alone. Every lever that protects that gap (reliability ratings, demand from the largest buyers, the inference stack, the Palantir channel) protects the fee, and every quarter in which partners learn to sell their own capacity erodes it.
What we are watching
The first named partner project, with megawatts, ownership and fee terms, will do more for this forecast than any estimate of market size. It replaces an anonymous project in our simulation and gives us the first real data point on the fee.
Q3 results are next. A quantified revenue figure for the model, or a count of signed partners, would narrow the range considerably, as would any early evidence on how partner contracts renew.
On Palantir, we are watching for completed integration and the first named eligible commercial customer on paid Nebius infrastructure. On pricing, we want comparable realized contracts, not merely the gap between two public price lists. On delivery, we want acceptance dates and owner responsibilities. Those observations can replace assumptions instead of being added on top of an anonymous forecast allowance.
The full model
Premium members can download the companion Excel workbook. Its 32 worksheets include distribution summaries, case probabilities, quarterly scenario statements, 24 stress tests, owner economics, financing and cash schedules, analytical worksheets and a 2030 operating valuation of the asset-light business. Financial inputs recalculate in Excel. Changing the deal-level operating assumptions requires a new simulation; the workbook provides the results rather than running that simulation.
The full report and all 15 exhibits are free. The workbook complements our existing NBIS stock forecast 2030 company model, which remains available separately on the Nebius company page. Reconcile any asset-light allowance already in that model before combining them. Segment operating enterprise value is not NBIS equity value.
Download the asset-light workbook with Premium. Download latest company model. Download the full report PDF free.
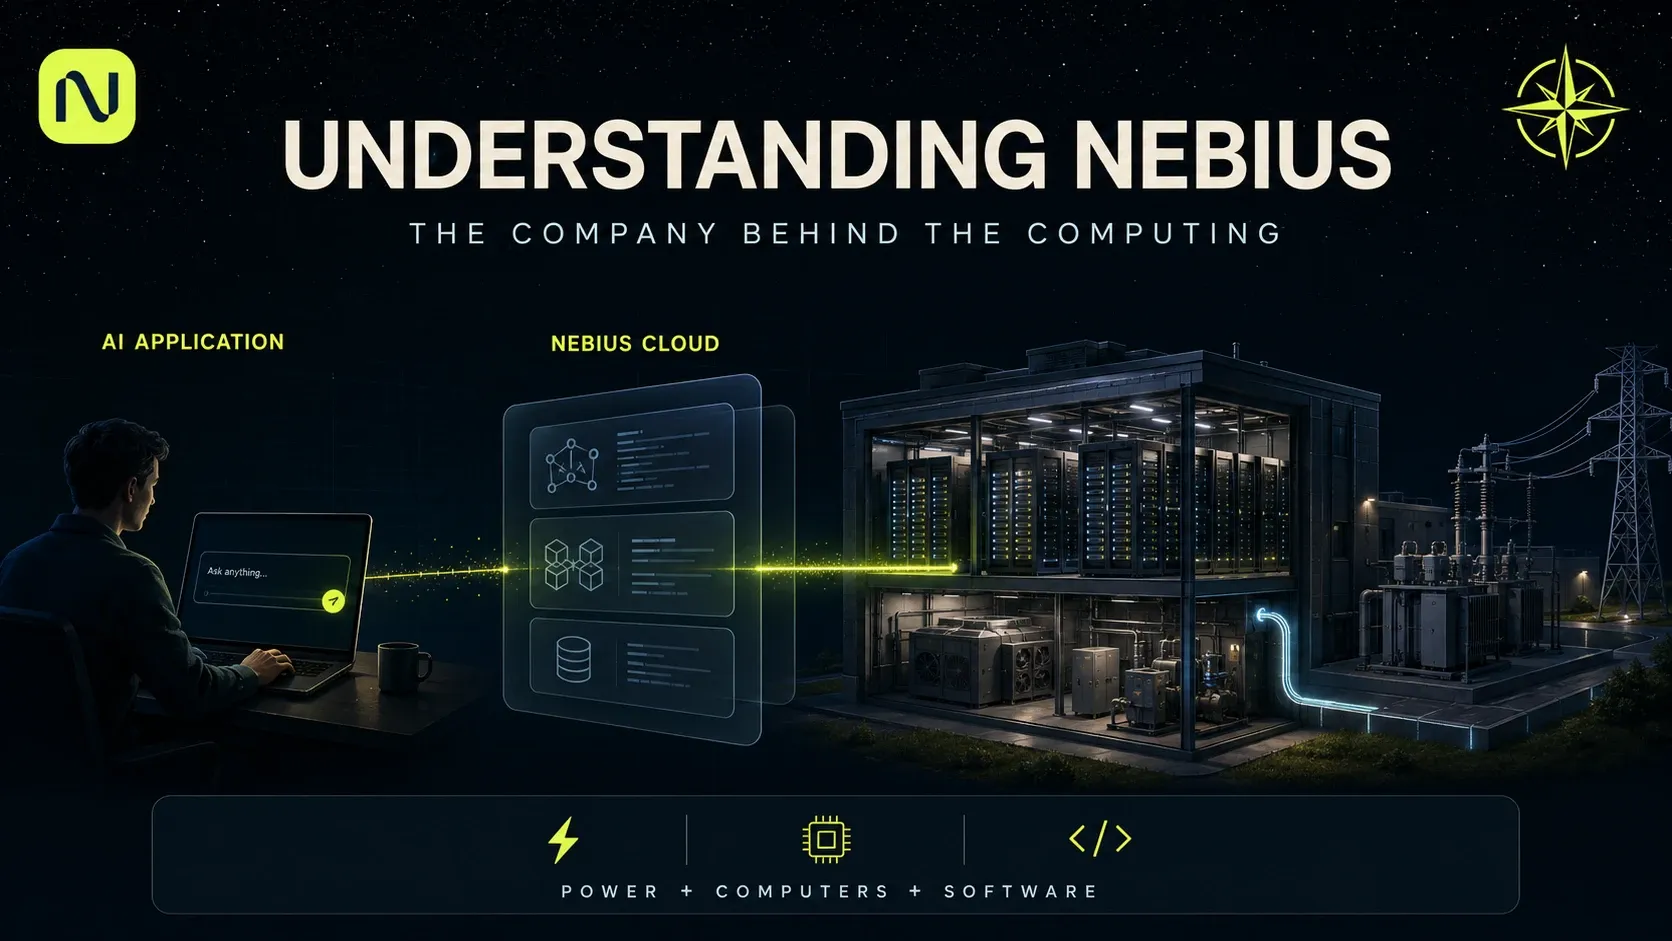
Understanding Nebius: A Complete Guide to the Company
Understand Nebius from the ground up: its AI cloud, competitors, subsidiaries, funding, and growth opportunities. A complete NBIS guide with 14 illustrations.
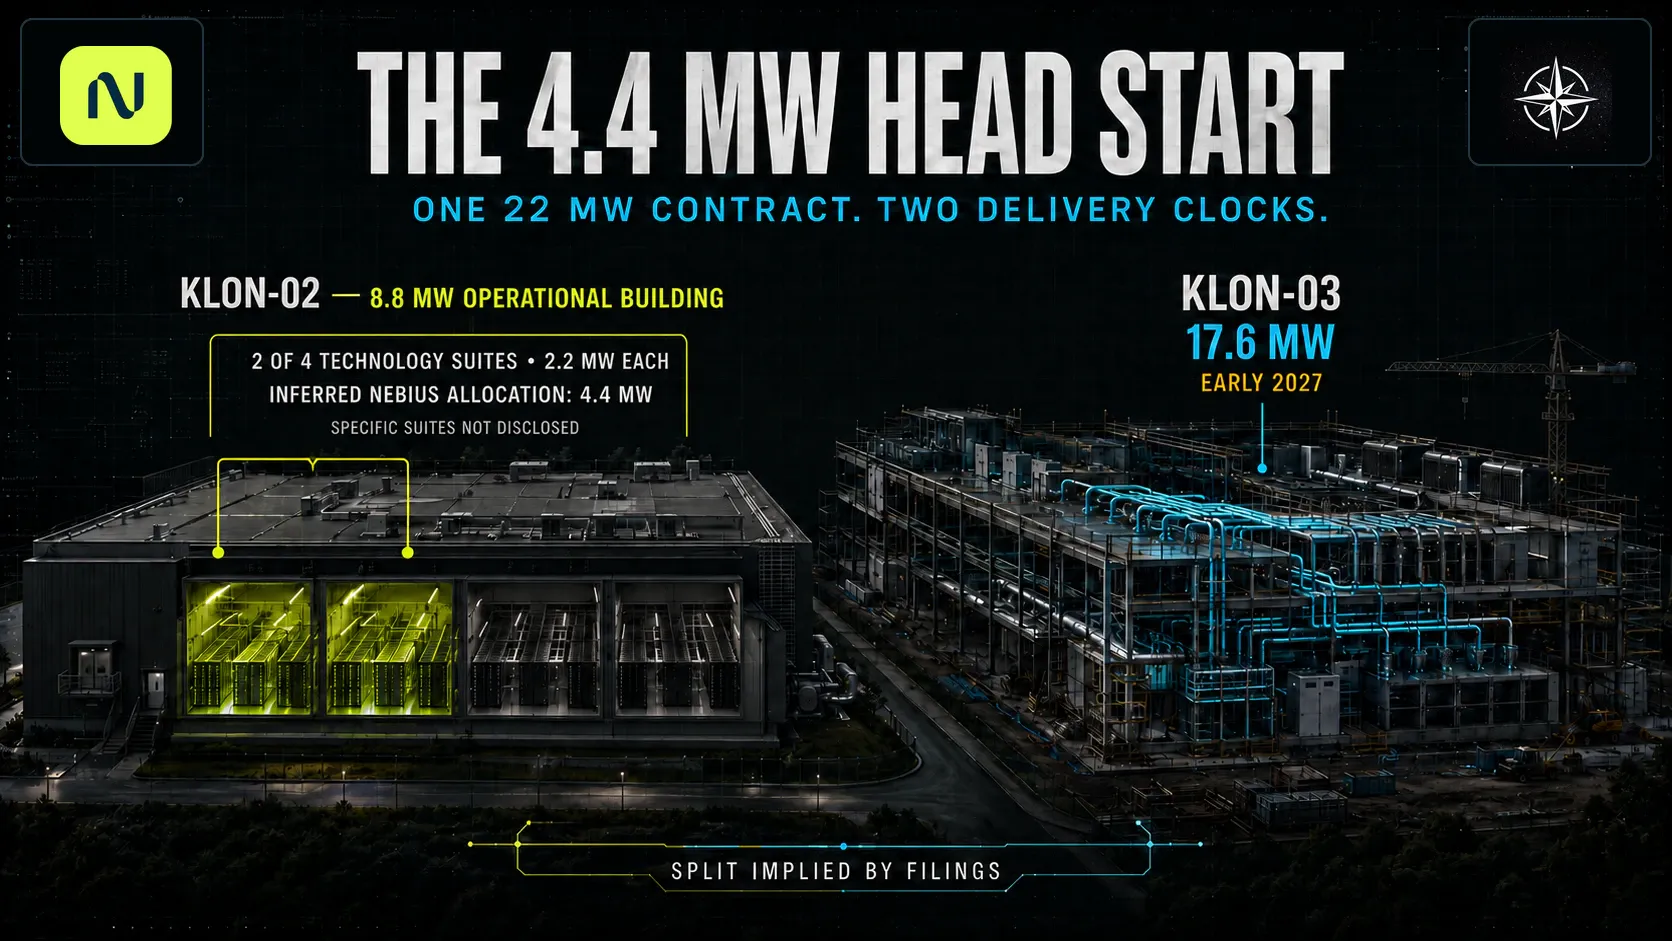
Nebius in Europe: Sovereign AI, UK Expansion and Harlow
How European AI sovereignty supports Nebius’s UK expansion, where Harlow fits, and what its potential 4.4 MW deployment could add to Q3 revenue and 2026 ARR.
NBIS Stock Forecast 2030: The Conversion Problem
A ground-up Nebius model rebuild after Q2 2026, covering AI factory economics, capital structure, valuation scenarios, and the NBIS stock forecast to 2030.
Northwise Portfolios
See how the research becomes real decisions
Reader discussion
Discuss the research
Create a Free account to join the discussion with a display name.
Create a Free Account
No comments yet. Start a thoughtful discussion.