
NBIS Stock Forecast 2030: The Conversion Problem

A ground-up Nebius model rebuild after Q2 2026, covering AI factory economics, capital structure, valuation scenarios, and the NBIS stock forecast to 2030.
In this article
The Easy Questions Are Answered
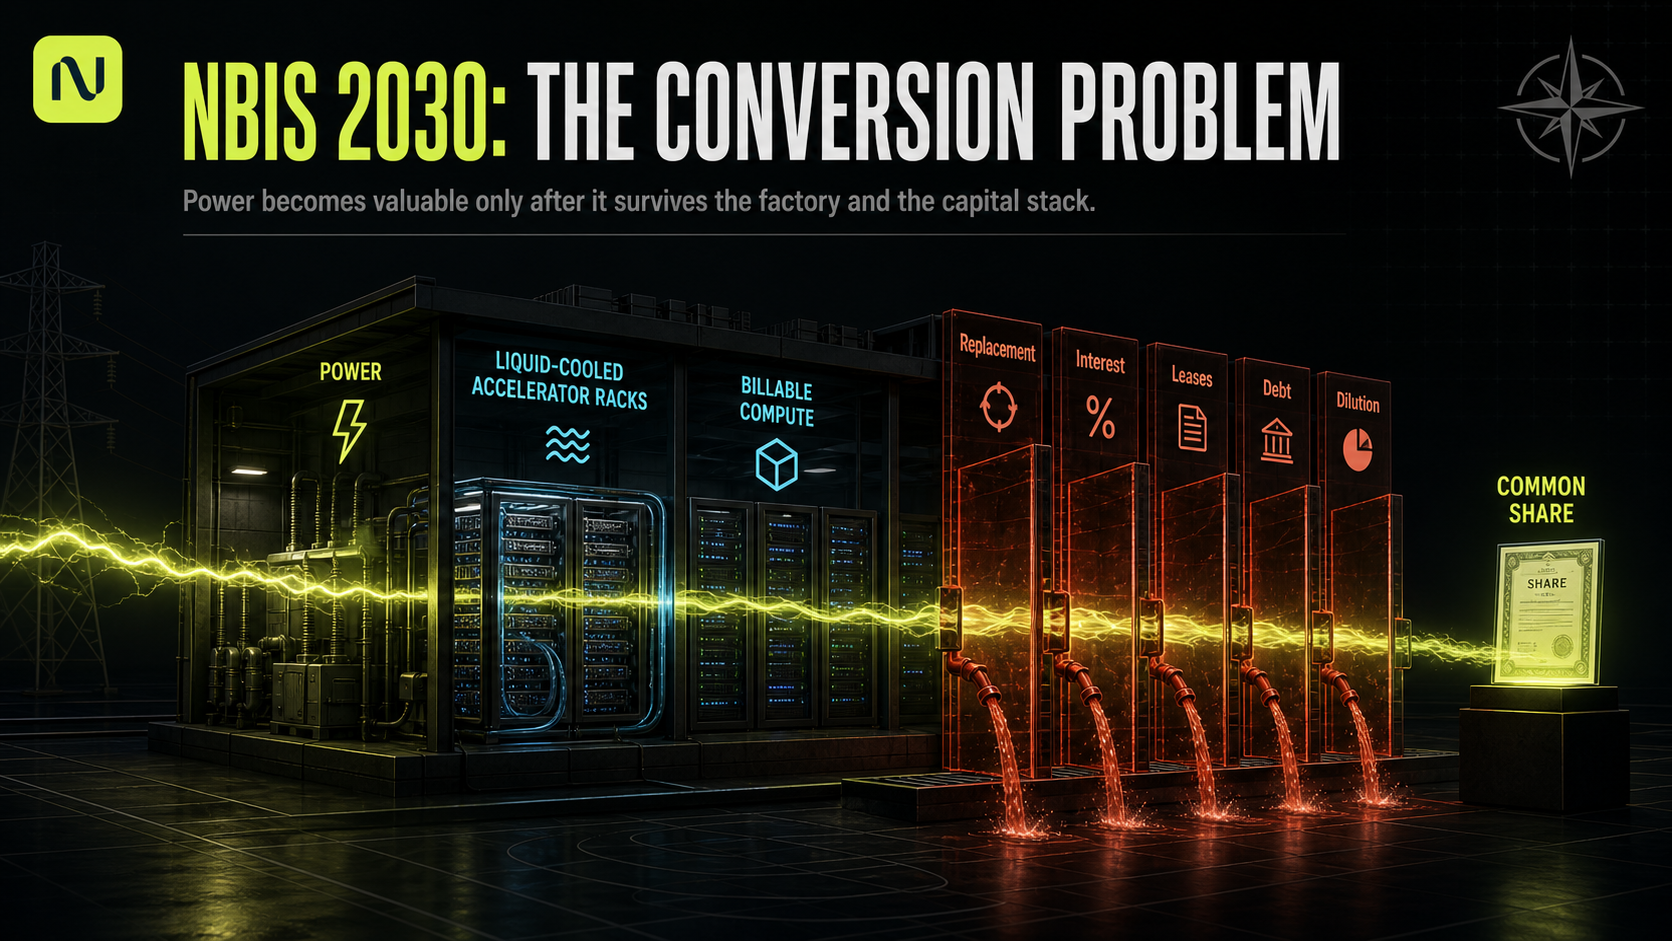
Nebius rents AI compute at industrial scale. It secures power, builds data centres, fills them with accelerators, and sells the resulting capacity to companies training and running large models. Twelve months ago the argument about the stock was existential: could it get power, land customers not already locked to a hyperscaler, obtain allocation on frontier hardware, and raise the money for all three at once.
The second quarter of 2026 closed that argument. Group revenue reached $582.3M, up 454% year over year, AI Cloud revenue reached $574.9M, and AI Cloud annual recurring revenue ended June at $3.0B on a 49.7% adjusted EBITDA margin. Four landmark AI cloud deals closed in the quarter, each averaging more than $1B in total contract value, priced at $20M to $25M of annual contract value per megawatt, with 50% to 60% of the associated capital expenditure paid by the customer in advance. Roughly 70% of everything closed in the quarter carried a prepayment, an all-time high.
Management told investors it could sell every megawatt of planned 2027 capacity today on current terms and is deliberately holding some back for better-priced demand. A capacity auction pilot cleared at roughly 15% above the highest price Nebius had ever received for Blackwell hardware.
Every one of those facts makes the operating story easier to believe. Not one makes the equity easier to value, and several make it considerably harder. The build is larger than it was, the capital required to deliver it is larger, and the number of claims standing between enterprise value and a share of common stock has grown.
Two pieces of arithmetic are circulating right now, and both are internally consistent.
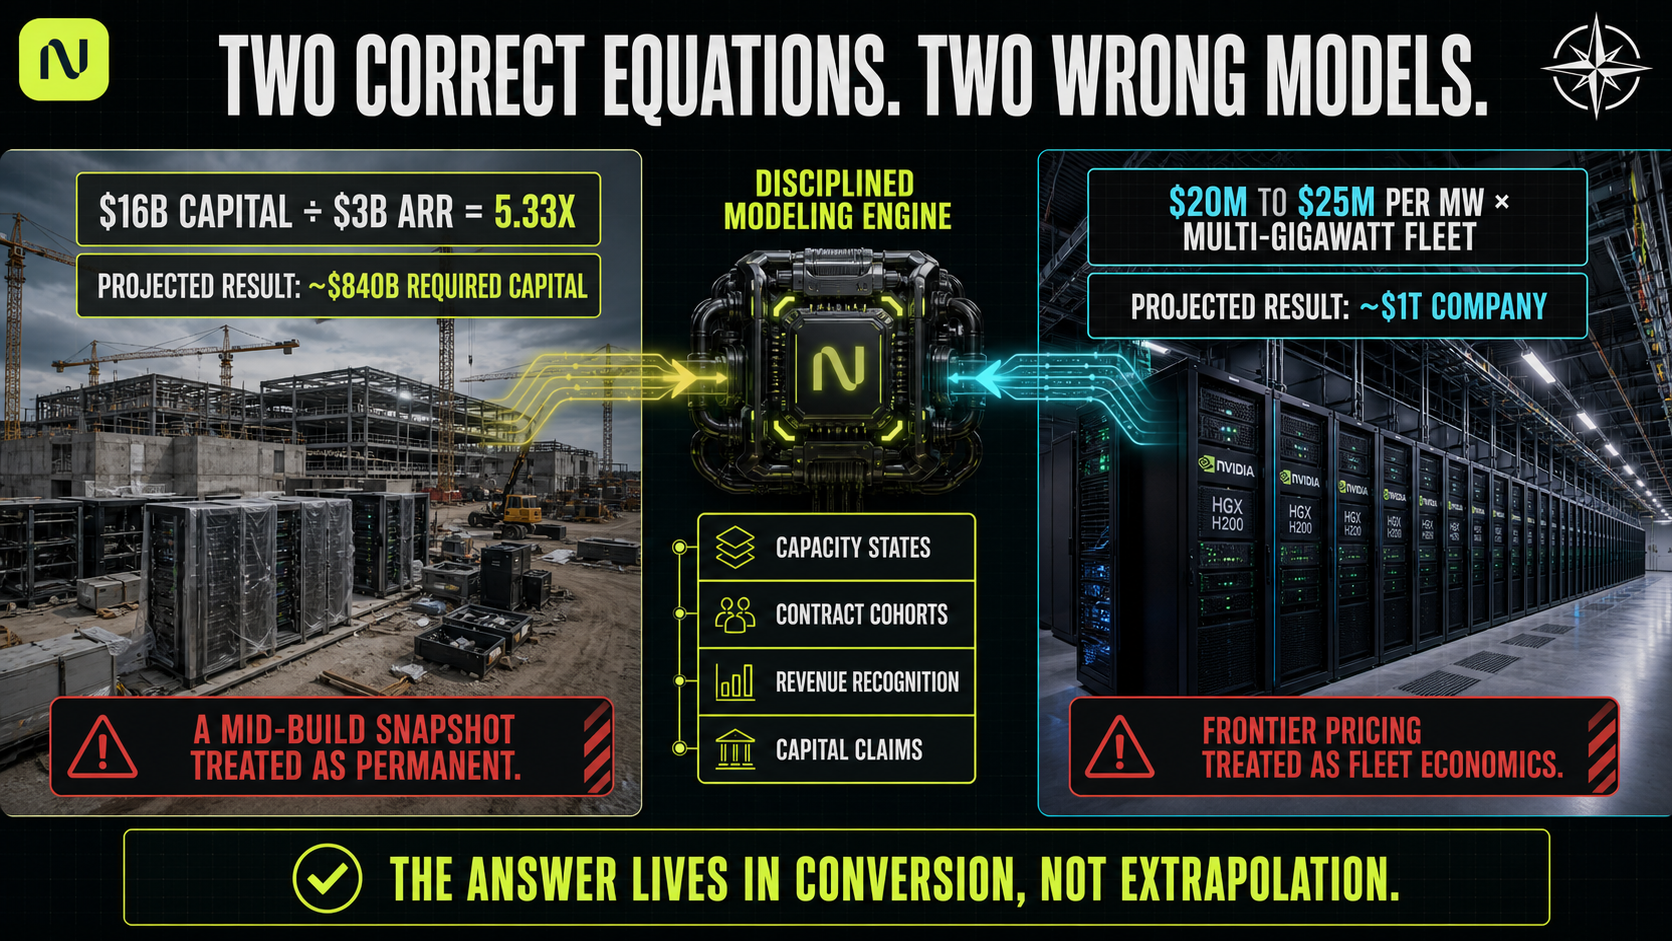
The first belongs to Jim Chanos, the short seller who built his reputation on Enron and who has spent much of 2026 arguing publicly that the economics of the AI infrastructure buildout do not survive contact with a balance sheet. Nebius has been a recurring subject, and his central claim about the company rests on a single ratio. Take the roughly $16B of capital Nebius currently has employed against its $3.0B of recurring revenue. That is 5.33x. Scale it to the $157.5B of revenue that bullish 2030 forecasts imply and the company would need something near $840B of capital, which is not a sum anyone raises.
The second runs in the opposite direction and circulates widely among the stock's supporters, in published models and across investing X. Take the $20M to $25M per megawatt Nebius is signing today, multiply it across a multi-gigawatt 2030 fleet, apply a multiple appropriate to a mature hyperscaler, and arrive at a company worth $1T.
Neither calculation is careless. Both commit the same error pointed in opposite directions, treating a snapshot of a company in the middle of a build as a permanent property of the company it becomes.
Today's capital-employed ratio is measured against billions of dollars of assets under construction that have not earned a dollar. Today's contract pricing is measured on the scarcest capacity in the market, sold to the customers who need it most urgently. Neither number survives contact with a 2030 fleet holding four hardware vintages, expiring contracts, partial-year revenue recognition and a competitive position that will not resemble the one Nebius holds now. The interesting work sits between the two, and a ratio cannot do it.
We published our first full Nebius model in June 2026. Q2 broke enough of its machinery that we rebuilt it from the foundation instead of patching it, and this report is written from that rebuild.
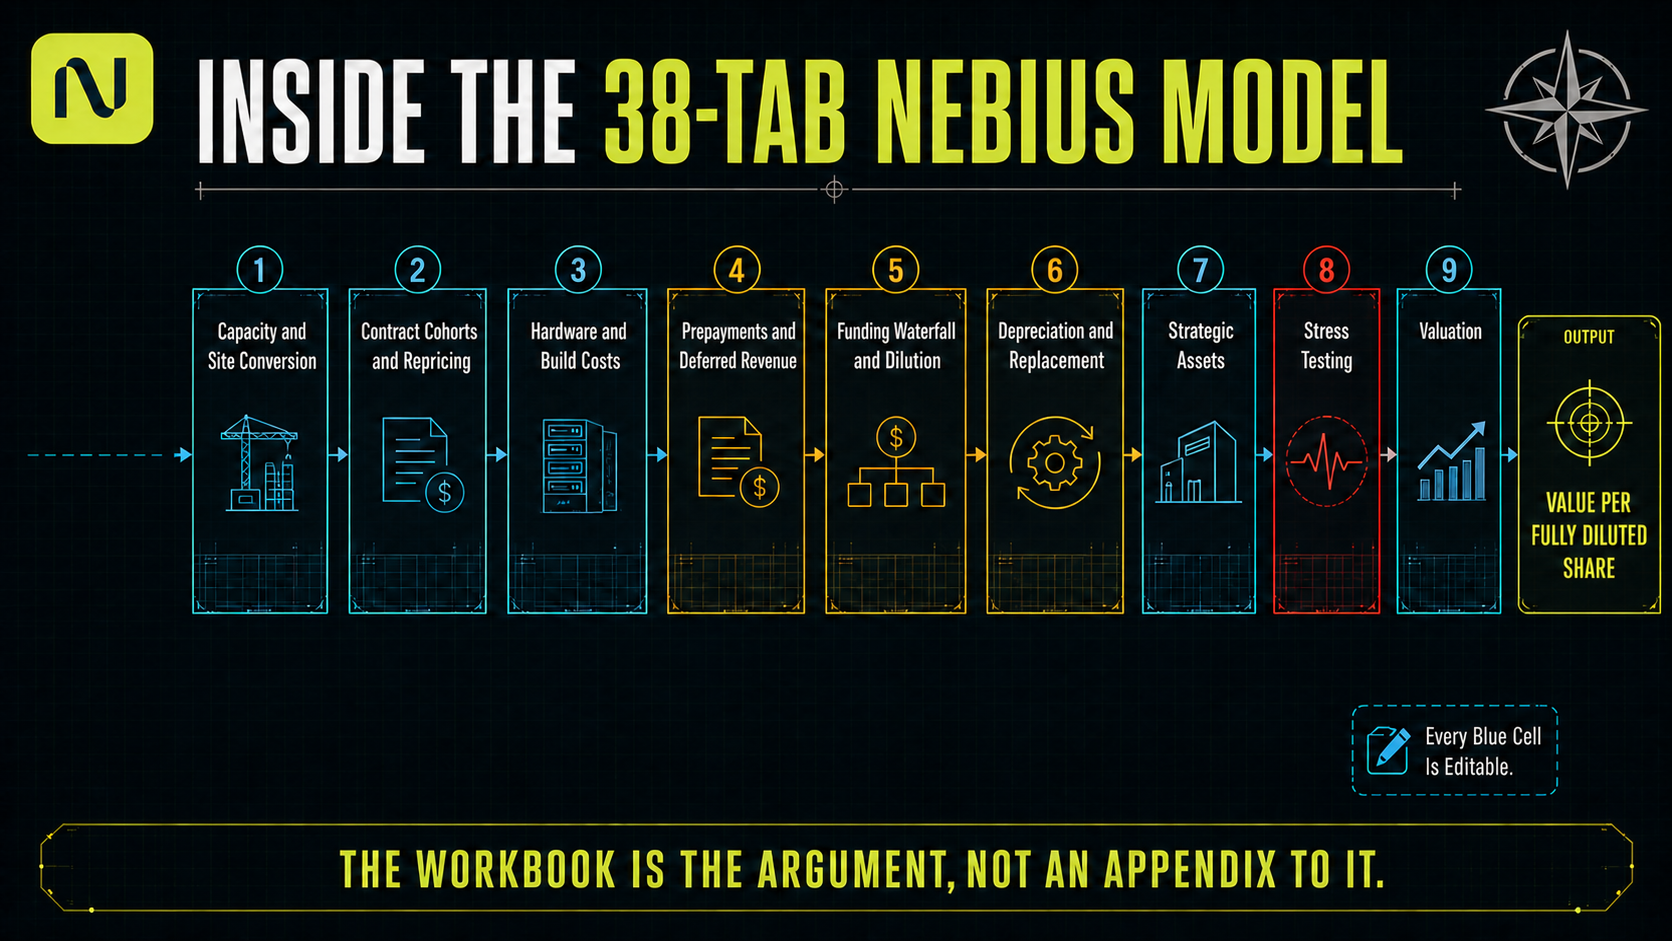
The new model starts from a site-by-site energisation schedule covering fifteen named facilities, and it moves capacity through four distinct physical states before allowing it to earn anything. It costs every megawatt at the actual structure of the site it belongs to. It assigns each year's new capacity to a contract group that expires and reprices on its own schedule. It runs customer prepayments through deferred revenue instead of counting them twice, separates accounting depreciation from the economic cost of replacing a fleet, carries lease obligations as the capital claims they are, converts every outstanding convertible note, and allows management to behave rationally under funding stress instead of passively issuing stock.
It runs to 38 tabs, and members can download it and change any assumption in it. We will come back to that at the end.
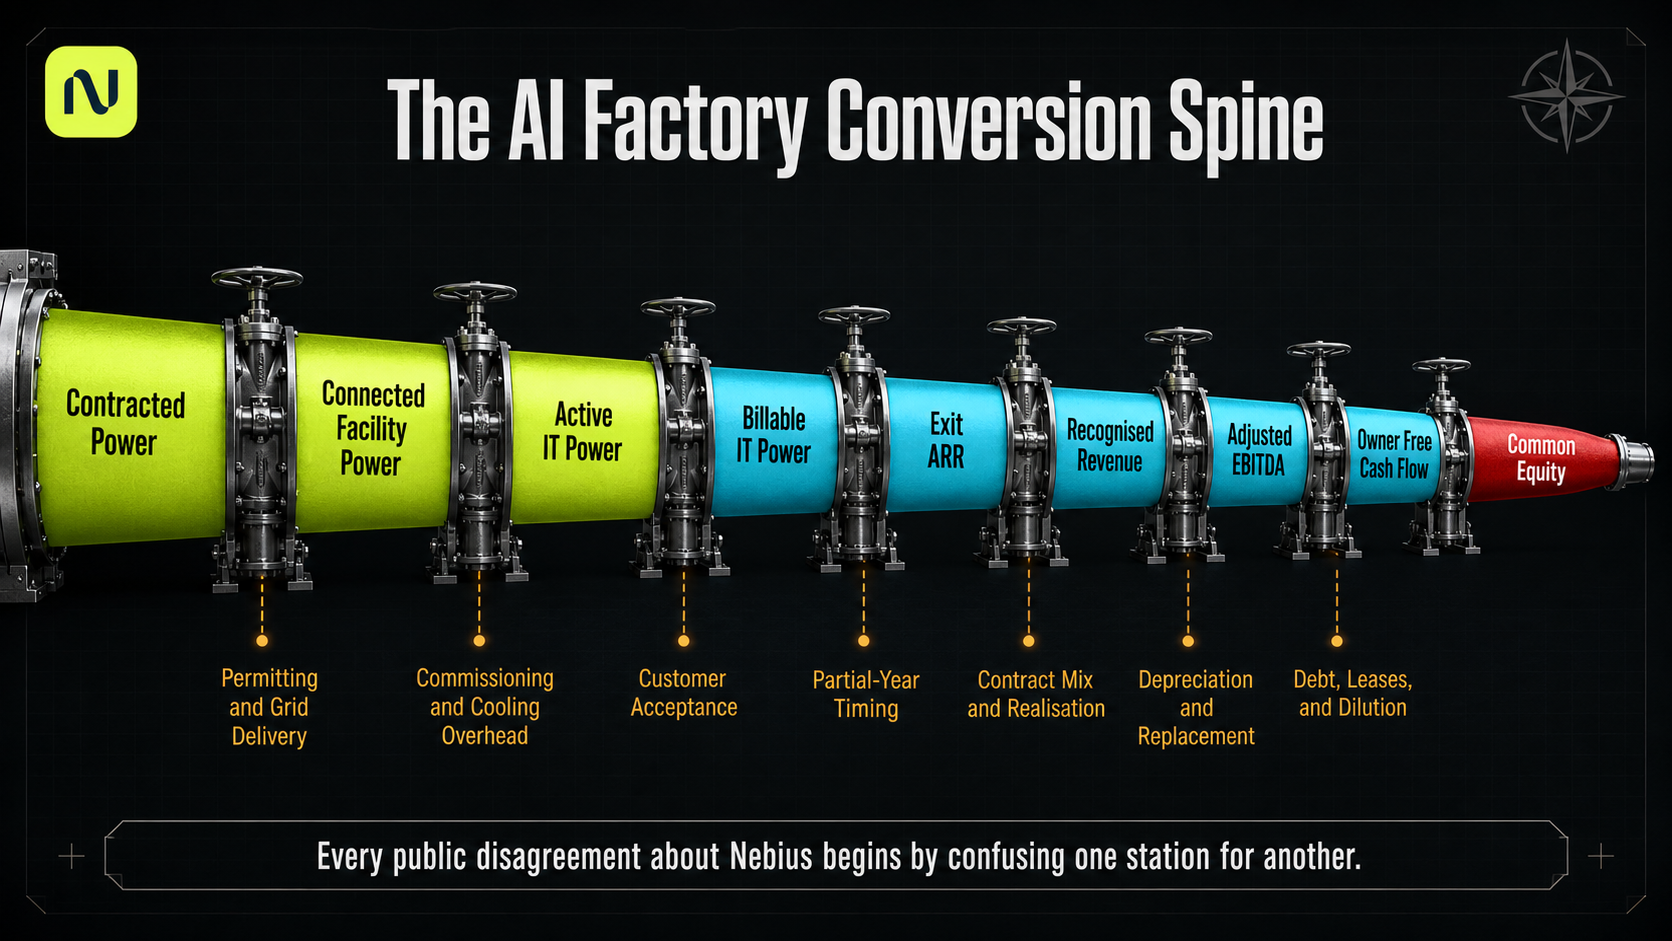
The chain it follows moves in one direction and every link is a real constraint. Contracted power becomes connected facility power. Connected power becomes active IT power once commissioning is finished and cooling overhead is paid. Active power becomes billable power once a customer accepts it. Billable megawatts meet contract pricing to produce recurring revenue, recurring revenue converts into recognised revenue, revenue converts into EBITDA, and EBITDA meets a sequence of capital claims that determines what is left for the shareholder.
Nearly every public argument about this company, bullish and bearish alike, is an argument about one link in that chain being mistaken for another.
What Nebius Actually Is
Nebius emerged from the restructuring of Yandex, the Russian search and technology group, and kept the part that is hardest to rebuild: a large engineering organisation with a decade of experience running distributed systems and cloud infrastructure at national scale. It is led by Arkady Volozh, who founded Yandex and now runs Nebius from Amsterdam.
The economic engine is Nebius AI Cloud. Around it sit stakes in ClickHouse, the analytics database company, alongside Avride in autonomous driving, Toloka in data labelling and TripleTen in technical education. Those holdings matter twice over in this report: as terminal value, and as a source of funding the company can reach for before it reaches for shareholders.
The product stack runs from power procurement and site development through data-centre infrastructure, accelerator clusters, networking and storage, orchestration, the cloud control plane, managed inference, enterprise security and governance, and developer tooling. Describing this as GPU rental is incomplete in a way that shows up directly in the numbers, since nearly every managed customer touches the software layer and Q2 revenue already includes contribution from the higher-margin products.
Describing it as a software company is premature in a way that shows up just as clearly. The business consumes tens of billions of dollars of physical capital a year, and core cloud economics remain tied to hardware availability, power, and how fast concrete and copper go into the ground. The honest description is a company building the second thing on top of the first, where the first is expensive and the second is not yet proven at scale.
What Nebius operates is closer to a factory than to a traditional data centre business. It secures power and land, builds or accesses a facility through one of four structures, installs compute and networking, commissions and validates the integrated system, converts that active load into capacity a customer will accept and pay for, then allocates the result across three kinds of contract. Above all of it sits an attempt to capture economics that do not depend on owning the metal.
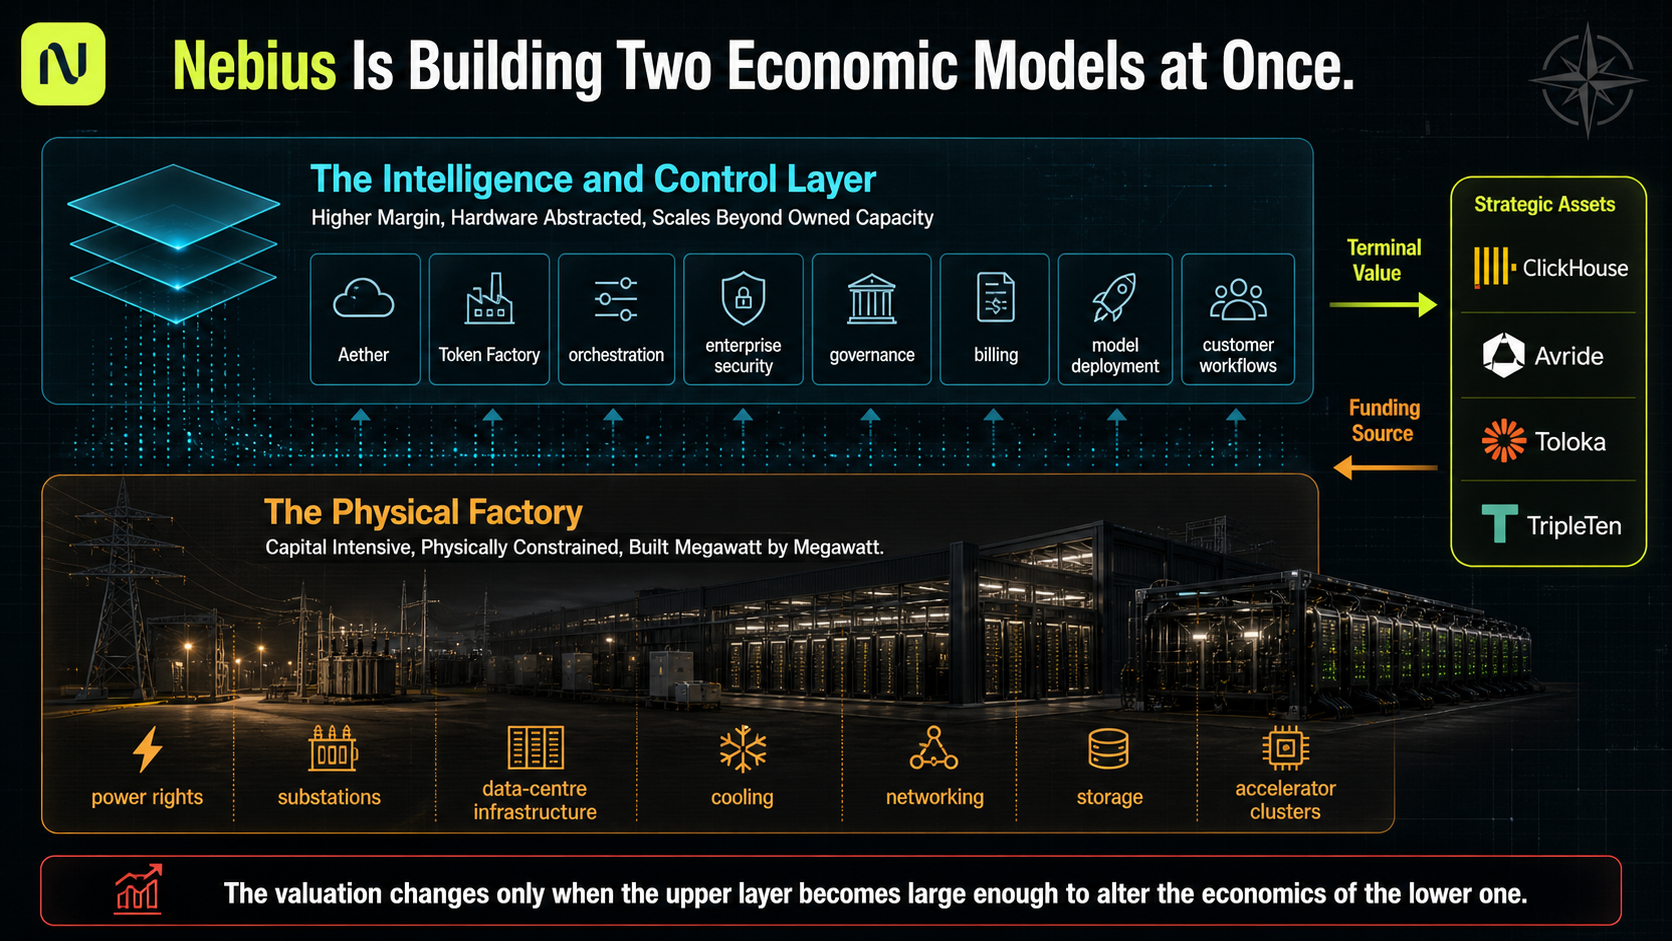
Every section that follows is one station on that line.
What Q2 Repriced
Our June model was right about the things that were structurally hard and wrong about the things that turned out to be measurable. Power and throughput were the correct starting point. Contracted capacity needed separating from monetised capacity. Hyperscaler contracts were financing instruments as much as revenue. Managed inference and the strategic stakes were real optionality, and a multi-region power pipeline was going to matter more than any single announced site.
What could no longer stand was the machinery underneath. Applying a scenario-wide average cost per megawatt stopped working the moment the hardware generations and the four site structures diverged from one another. Connected facility megawatts could no longer stand in for revenue-producing capacity. Contract pricing on the newest deal had to be separated from what the whole installed fleet earns, and prepayments had to stop appearing twice in the cash flow.
The scale of the commercial shift is what forced the rebuild. Total contract value grew nearly 4x quarter over quarter and contract value from new customers grew more than 9x. The landmark deals include the AI labs Reflection and Cohere alongside a scaled US neolab and a large US quantitative trading firm, and management estimates payback on them at 1 year and 10 months against forecast costs, including capacity not yet built.
Short-duration capacity, meaning terms up to roughly six months, can price at $40M to $50M per megawatt or better, and the first such deal is expected to go live in Q4. That is the highest headline price in the business and the least useful capacity for financing anything, which is why it cannot be modelled as an average.
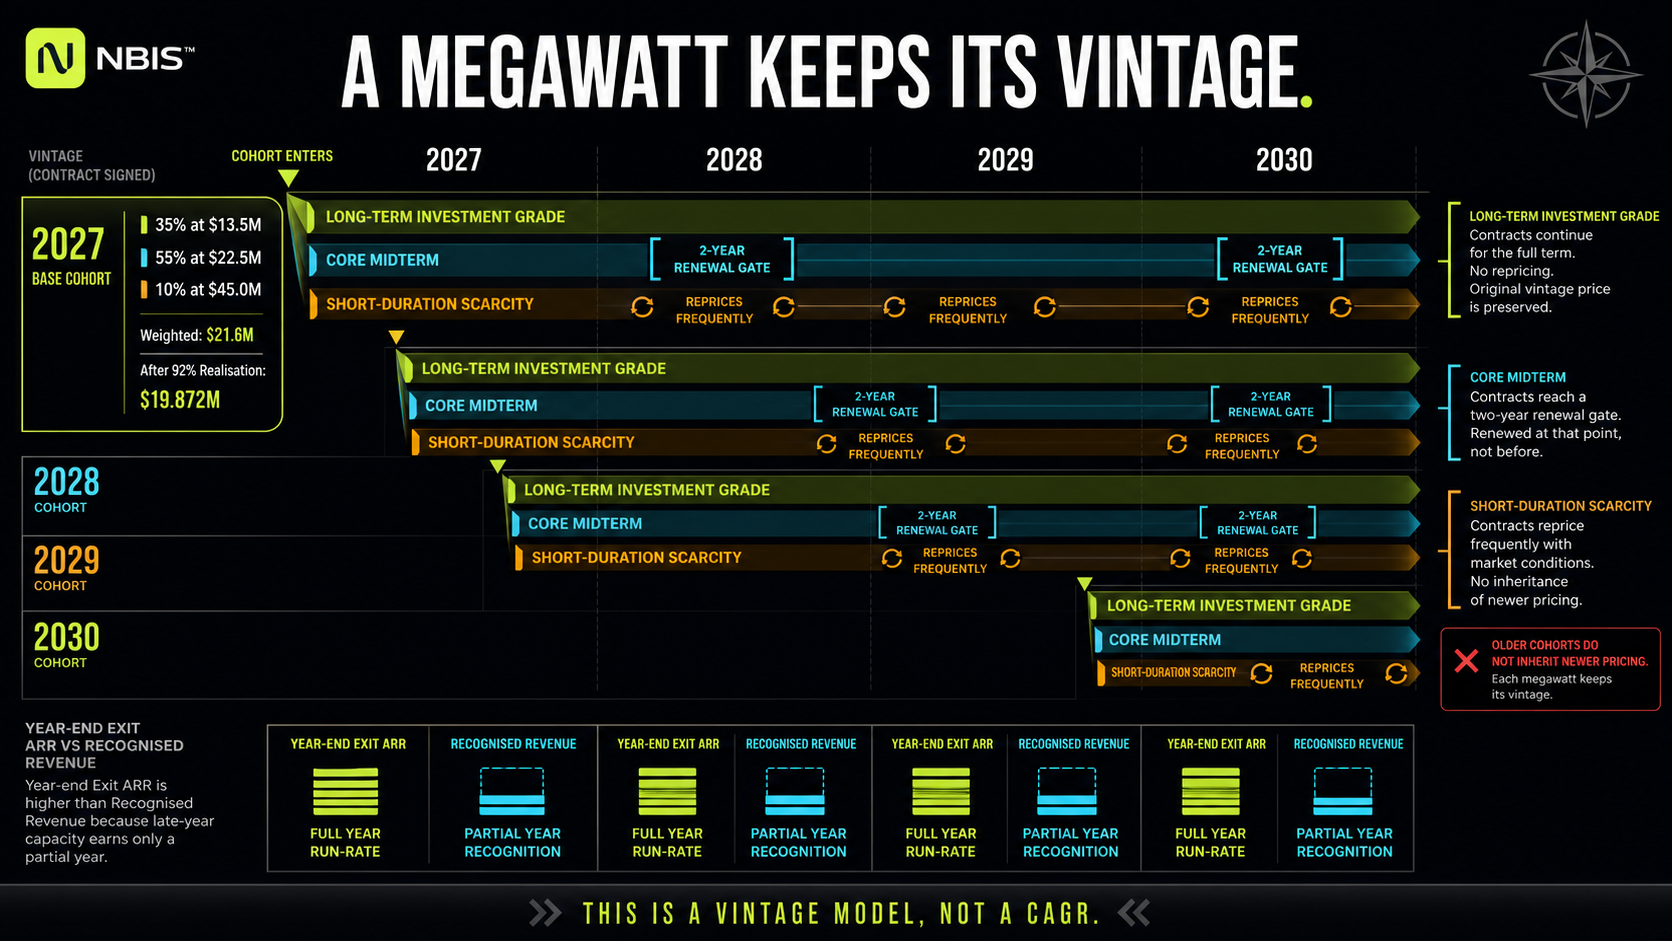
Discipline has to enter here, and the rest of this report depends on it. None of those prices belong on the 2026 fleet, since most of that capacity arrives in late Q4 or later and contributes primarily to 2027. From 2027 forward, our model treats each year's new billable capacity as a distinct group, or cohort, priced at the terms available in the year it was deployed. Each cohort then expires and reprices on its own clock, and no cohort inherits the pricing of a newer one.
The 2027 cohort in our Base case shows what that produces, and the gap between the headline number and the modelled one contains the whole method.
2027 Base new cohort | Share of new capacity | Contract value per MW |
|---|---|---|
Long-term investment grade | 35% | $13.5M |
Core midterm | 55% | $22.5M |
Short-duration scarcity | 10% | $45.0M |
Weighted price | $21.6M | |
After 92% realisation | $19.872M |
That $19.872M is what a 2027 megawatt actually earns in the model, once the realisation haircut for utilisation, availability and pricing slippage is applied. It sits below the $22.5M midterm rate that generates most of the excitement, above the long-duration anchors that generate most of the financing, and nowhere near the $45M figure that gets quoted when someone wants the stock to look cheap.
Four Kinds of Megawatt
Almost every reconciliation error in the public debate traces to the same source. Nebius reports capacity in units that are not interchangeable, and most commentary treats them as though they are. There are four, and the distance between them is large enough to move an argument by a factor of two.
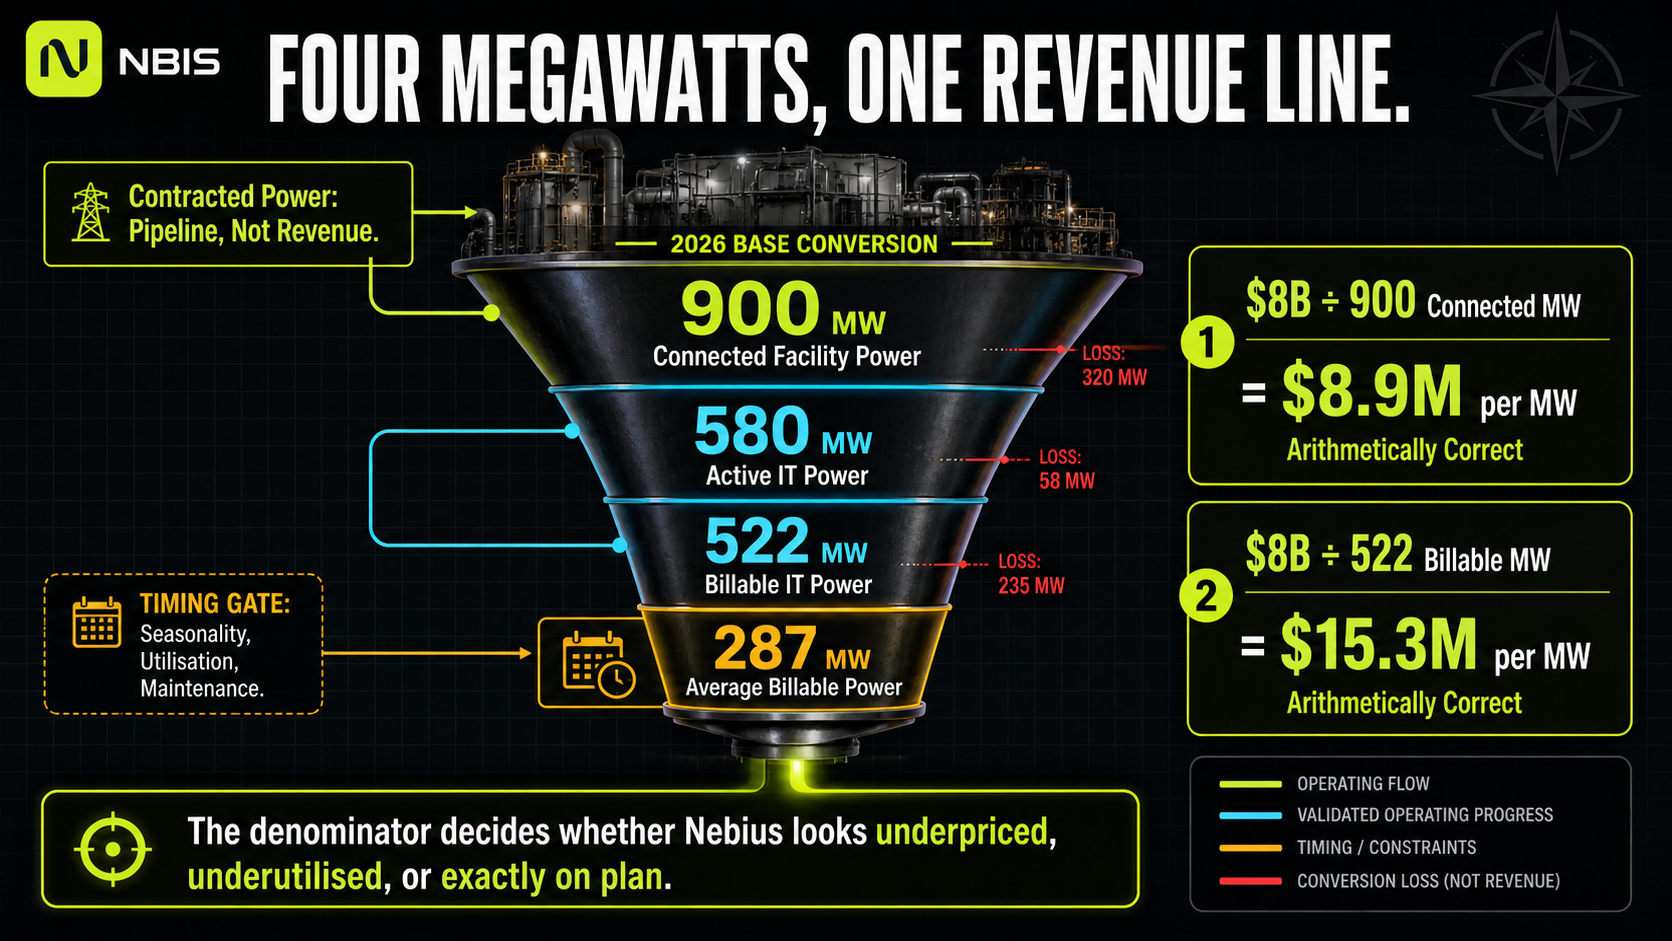
Contracted power is land and power commitments secured for future capacity. It is a pipeline, not a building. Connected power is gross facility power connected into fully built and equipped data centres, and it is the figure that appears in company targets. Active IT power is what installed operational equipment actually draws and can generate revenue from, after commissioning is complete and after cooling and electrical overhead is subtracted. Billable IT power is the subset of active power a customer has accepted and will pay for.
A fifth quantity does the work almost nobody accounts for. Average billable megawatts across a year determines recognised revenue, meaning the revenue that actually lands on the income statement, and during a fast build it sits far below the year-end figure that sets the exit run rate. Capacity energised in November earns for six weeks, not twelve months.
Two revenue measures follow from that, and mixing them is the second most common error after mixing the capacity states. Exit annual recurring revenue is a run rate: the annualised value of contracts in force on December 31. Recognised revenue is what the company actually booked across the year. During rapid expansion the first is always substantially larger than the second.
Running 2026 through our Base case shows how much room sits between the first capacity number and the last. Nebius ends the year with 900 MW of connected facility power. Commissioning readiness and cooling overhead take that to roughly 580 MW of active IT power. Customer acceptance takes it to roughly 522 MW of billable IT power. The average across the year, which is what the revenue line is built on, is roughly 287 MW.
Now put the company's own guidance against those denominators. At $8B of exit recurring revenue, the identical business reports either $8.9M per connected megawatt or $15.3M per billable IT megawatt. Both are arithmetically correct. They answer different questions, and choosing between them decides whether Nebius appears to be undercharging by half or pricing in line with what it has disclosed.
The same spread persists to the end of the forecast, which is why the 2030 capacity schedule should be read in all four states instead of only the headline.
2030 capacity, year end | Bear | Base | Bull |
|---|---|---|---|
Connected facility MW | 5,000 | 6,200 | 7,500 |
Active IT MW | 4,078 | 5,188 | 6,355 |
Billable IT MW | 3,997 | 5,136 | 6,324 |
Average billable IT MW | 3,681 | 4,553 | 5,523 |
Base 2030 connected capacity of 6.2 GW is not 6.2 GW of revenue-producing compute. It is 5,136 MW of billable IT power at the end of the year and 4,553 MW on average through it, and every revenue figure in this report is built on the latter two.
Hold those four definitions. Roughly half of what follows is an argument about which one belongs in the denominator.
The Permit Is the Scarce Asset
Everyone in this sector announces gigawatts. Announcements are cheap, land is available at a price, and capital is currently abundant for anyone with a credible AI story. What has become scarce is a site that has already cleared zoning, holds its environmental permits, and has a signed path onto a transmission network that will energise it on schedule.
That scarcity creates an asymmetry the market has been slow to price. Through 2026 a series of jurisdictions moved to slow new data-centre development, and the reflexive read is that regulatory tightening threatens any company with 5 GW of contracted power ambitions. For projects still seeking approval, it does. For projects already through the gate, tightening does the opposite, raising the replacement value of an entitlement that can no longer be easily obtained.
That asymmetry only becomes an analytical tool if you know which megawatts sit on which side of it. So the capacity forecast in this model no longer begins with a scenario total and works down. It begins with a site register, assigns each named facility its own energisation path year by year, and carries everything that cannot be tied to a specific site in an explicit residual.
Named site | Country | Structure | Design cap | Base 2030 connected |
|---|---|---|---|---|
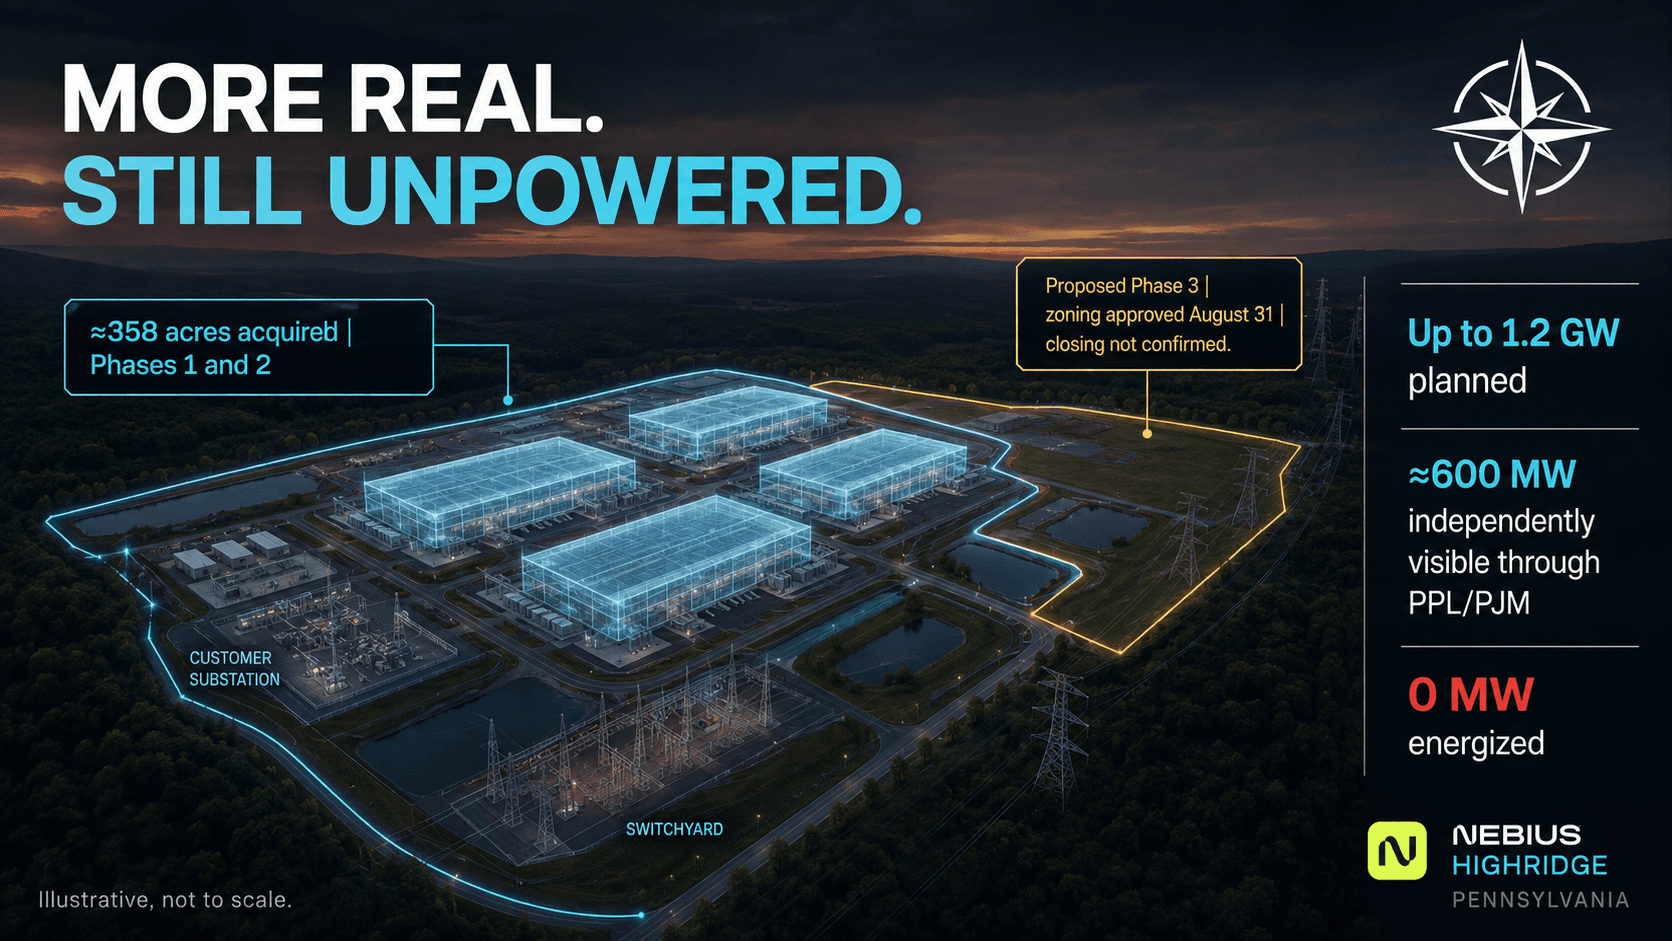
Pennsylvania (Highridge) | USA | Owned greenfield | 1,200 MW | 1,200 MW |
Independence, Missouri | USA | Owned greenfield | 1,200 MW | 1,100 MW |
Vineland, New Jersey | USA | Build-to-suit | 400 MW | 400 MW |
Lappeenranta | Finland | Owned greenfield | 310 MW | 310 MW |
Birmingham, Alabama | USA | Owned brownfield | 300 MW | 300 MW |
Béthune | France | Build-to-suit | 240 MW | 240 MW |
Beit Shemesh | Israel | Colocation | 222 MW | 222 MW |
Mäntsälä | Finland | Owned brownfield | 75 MW | 75 MW |
United Kingdom | UK | Colocation | 65 MW | 65 MW |
Masmiyya | Israel | Colocation | 64 MW | 64 MW |
Kansas City, Minneapolis, Modi'in, Keflavik, Paris | Mixed | Colocation | 110 MW | 110 MW |
Named subtotal | 4,086 MW | |||
Undisclosed and unannounced | 2,114 MW | |||
Total connected | 6,200 MW |
Two-thirds of Base 2030 capacity now maps to a facility we can name, describe and date. The remaining third sits in a residual we refuse to dress up. Oklahoma, Spain and Estonia appear in the site register as candidate geographies on the strength of hiring and footprint signals, and they carry no megawatts at all, since we have no site-level view of any of them. Inventing a plausible number for a plausible location is how capacity forecasts become fiction.
The residual behaves differently across scenarios, and the difference is instructive. Bear maps 3,886 MW of its 5,000 MW to named sites, or 78%, since a slower build leans harder on facilities already in progress. Bull maps the same 4,086 MW as Base but reaches 7,500 MW, which pushes 3,414 MW into the residual. Every megawatt of Bull upside beyond the Base named schedule is unannounced capacity, and readers should weigh it accordingly.
Pennsylvania is where we did the deepest work, in a separate site investigation published earlier this year, and it shows why diligence at this level separates a real megawatt from a press release.
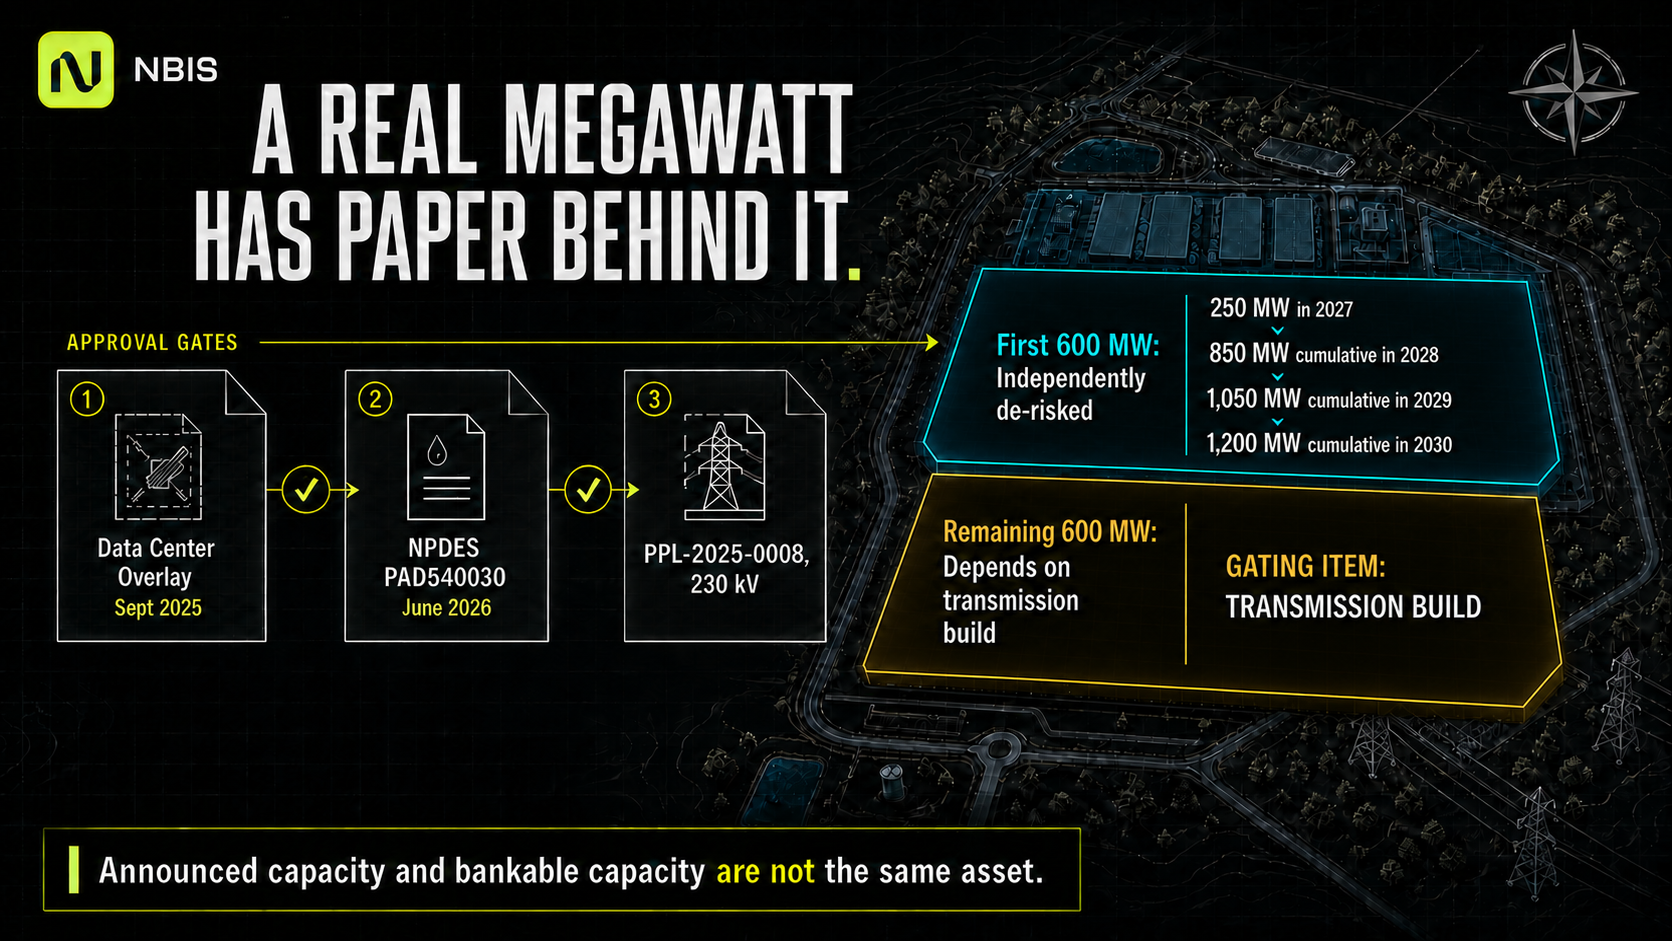
The relevant Highridge land was placed inside a Data Center Overlay in September 2025, which is the zoning permission. A Chapter 102 Individual NPDES permit numbered PAD540030 was issued in June 2026 to Highridge DC Propco LLC, which is the state environmental clearance for earth disturbance. Interconnection request PPL-2025-0008 establishes a defined 230 kV path onto the regional grid, which is the electrical permission. Our work on the utility ramp points to roughly 250 MW arriving in 2027, 850 MW cumulative by 2028, 1,050 MW by 2029 and the full 1,200 MW by 2030.
Follow that sequence closely and the front half and the back half stop looking like the same asset. The first 600 MW has cleared three separate regulatory and utility gates and is independently de-risked. The remainder depends on a transmission build that has been scoped and not yet delivered. Bear reflects that directly, holding Pennsylvania to 150 MW in 2027 and 1,100 MW by 2030 rather than applying a uniform haircut across the portfolio.
Vineland deserves a correction, since our earlier work gave it more weight than the evidence supports in either direction. The site is fully approved at a 400 MW design capacity, and it now sits in the schedule at 300 MW in 2026 and 400 MW from 2027 onward, identically across all three scenarios. It receives no special haircut and no special credit. A fully approved build-to-suit facility with a known operator is among the most predictable megawatts in the portfolio, and treating it as either a risk or a hidden asset was an error on our part.
The Rubin Paradox
A Vera Rubin rack costs roughly 2.6 times what a GB300 rack costs. It is approximately 12.6% more expensive per active IT megawatt.
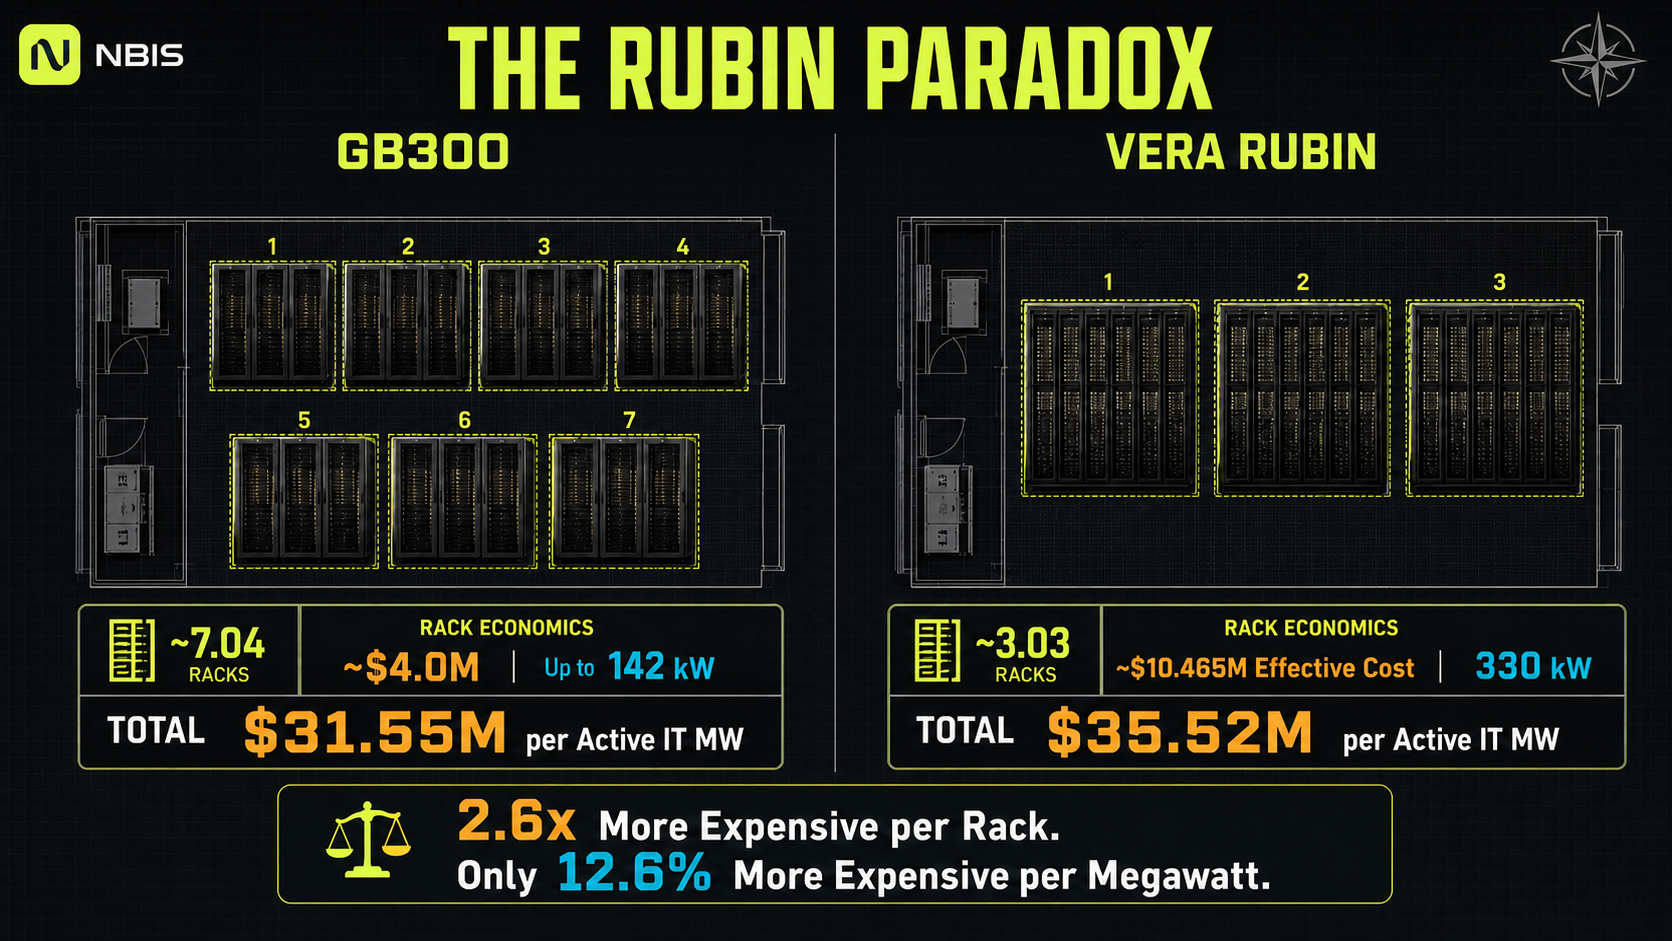
Both statements are true at once, and reconciling them is the entire reason this model prices hardware by power draw instead of carrying a generic capital-cost-per-megawatt assumption. GB300 and Vera Rubin are consecutive NVIDIA rack-scale system generations, with Rubin beginning deployment around the turn of 2027, and Nebius will run both simultaneously for years.
A GB300 rack runs to about $4.0M against NVIDIA reference power of up to 142 kW. Rubin comes in near $9.1M before a 15% procurement uplift, which reflects the AI server price increases reported across 2026, taking the effective price to roughly $10.465M against a reference cabinet draw of 330 kW. Since a megawatt of IT load absorbs about 7.04 GB300 racks and only 3.03 Rubin racks, most of the price increase gets swallowed by density before it reaches the cost per megawatt.
After adding 12% for off-rack fabric and installation, modelled compute cost lands near $31.55M per active IT megawatt for GB300 and $35.52M for Rubin in 2026 dollars. Anyone carrying a single GPU capital assumption through a generational transition will be wrong by a wide margin in one direction or the other, and the direction flips depending on which year they anchored to.
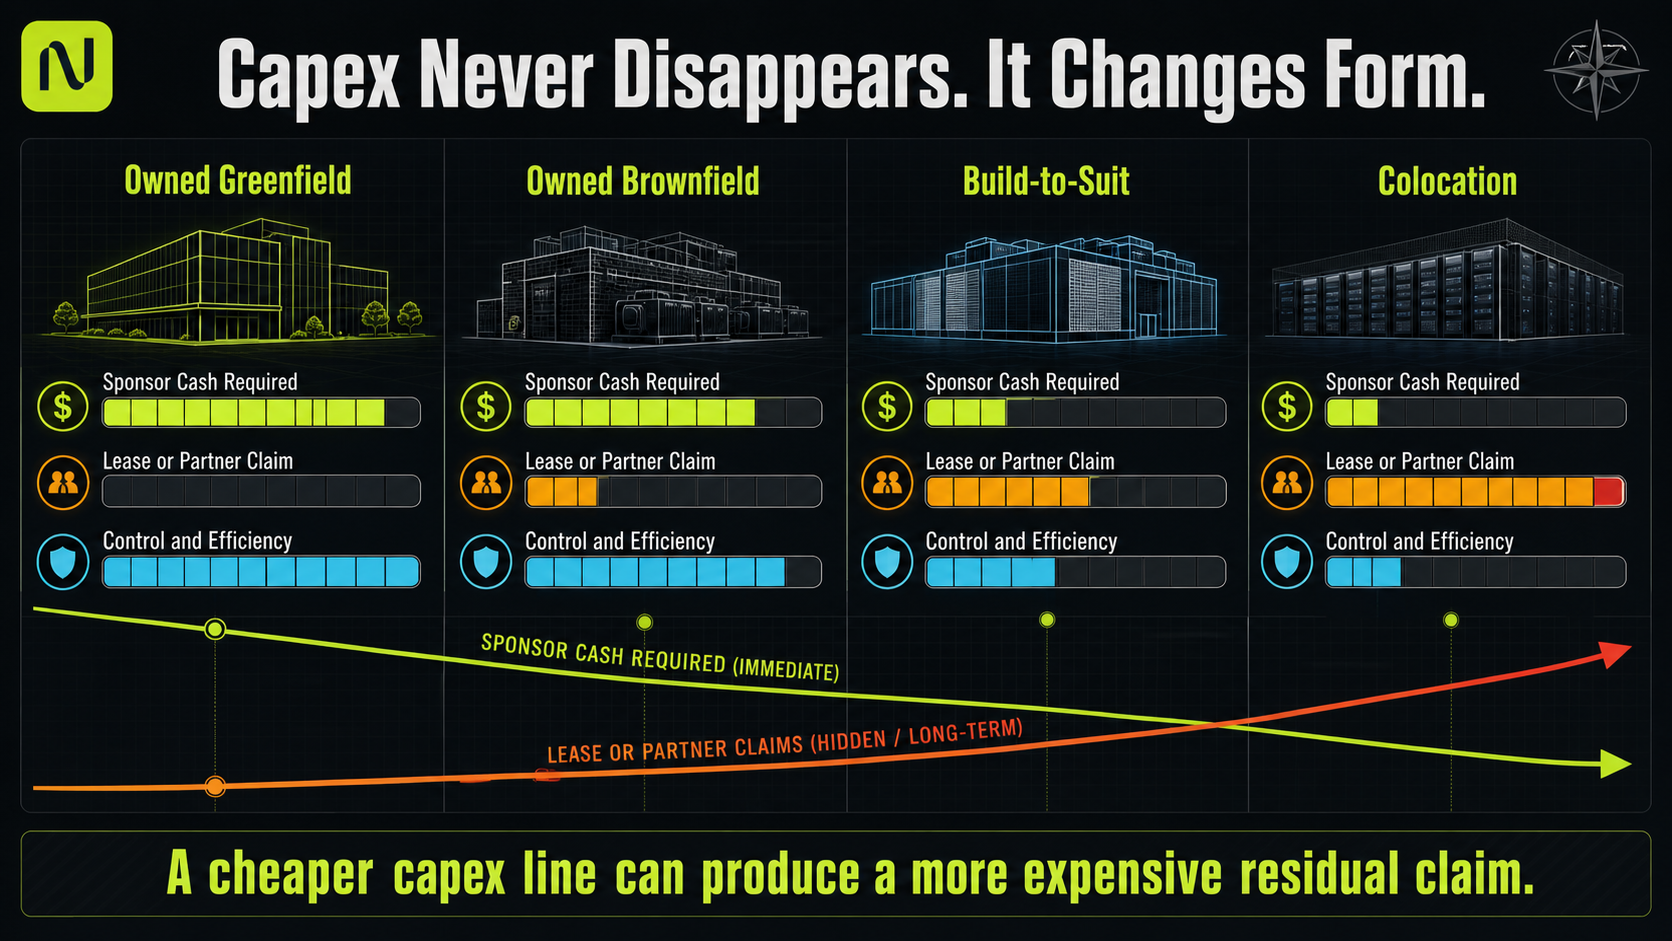
Compute is only part of the bill. The building underneath it varies just as much across four structures, each trading cash cost against a different claim on the business. Owned greenfield carries the heaviest cash burden, creates no lease claim, and delivers the best long-run control and cooling efficiency. Owned brownfield costs less in cash and gives back some efficiency. Build-to-suit demands very little sponsor cash and creates a large right-of-use lease obligation instead. Colocation costs the least cash, depends most on a partner, and carries the weakest modelled efficiency.
The trap sits in the third and fourth entries. Build-to-suit and colocation look inexpensive on a capital expenditure line, which is how they get misread. The economics of the facility do not disappear when Nebius funds it through a lease. The claim moves from the capital line to the lease line, and it remains a claim standing ahead of common shareholders. Our model carries lease obligations on their own line for that reason.
Costing those four structures correctly requires knowing which one each megawatt belongs to, which is the second reason the site schedule sits underneath everything. Pennsylvania, Independence and Lappeenranta carry owned-greenfield economics. Vineland and Béthune carry build-to-suit economics with the corresponding lease claim. The Israeli sites, the UK and the smaller regional facilities carry colocation economics. Applying a blended scenario-wide percentage to all of them, as we previously did, understates cost at the owned sites and overstates it at the colocated ones.
The corrected stack produces this.
Cost stack, 2030 Base | Per unit |
|---|---|
Physical infrastructure, after site, interconnect, cooling, electrical, inflation, contingency and capitalised interest | $18.89M per connected facility MW |
Compute, networking and storage | $37.69M per incremental active IT MW |
All-in cash build cost | $59.30M per incremental active IT MW |
Two external checks give those numbers credibility they could not earn alone. JLL, the commercial real estate firm whose data-centre research is the standard construction benchmark in this industry, puts 2026 global shell and core near $11.3M per megawatt excluding land and active IT equipment, with liquid cooling adding roughly 10%. Our physical stack sits above that by an amount fully explained by the items JLL excludes.
The second check is the more useful one, and the site-level rebuild moved it. Our 2026 build now splits 17.4% physical infrastructure against 82.6% compute, against management's description of current capital needs as roughly 20% data-centre implementation and 80% GPU fill. We land 2.6 points below that framework, where the previous scenario-average approach landed 2.3 points above it. The direction changed for a reason worth understanding: 2026 capacity is concentrated in colocation and build-to-suit facilities that consume very little owned physical capital, and the site schedule now captures that instead of averaging it away. By 2030, as the owned greenfield campuses energise, the physical share rises to 36.4%.
Total 2026 bottom-up cash capital expenditure comes to $24.36B against a company guide of $20B to $25B, landing 2.5% under the top of the range without being fitted to it.
In aggregate the programme is a large number that gets larger before it turns. Base owned growth capital expenditure runs $25B in 2026, then roughly $54.1B, $69.0B, $69.4B and $67.4B through 2030.
The stance this produces is unusual enough to state outright. This refresh is simultaneously more bullish on what a megawatt earns and more conservative on what it costs to create. Those move in opposite directions, and the second one wins more often.
The Most Expensive Contract Is the Worst One
A $45M per megawatt short-duration deal is the highest-priced business Nebius can write and close to the least useful capacity it can own.
That inversion organises the whole contract portfolio, and missing it is how most public models go wrong. Price, duration, customer credit and prepayment cannot be optimised independently. Each contract type buys one thing and surrenders another, which makes the choice of mix a capital allocation decision as much as a commercial one.
Long-duration investment-grade contracts carry the lowest headline contract value per megawatt in our model and the strongest everything else: five-year visibility, the best collateral a lender will see, and the deepest prepayment coverage. Core midterm contracts running one to three years combine high pricing with meaningful prepayments and are the intended commercial engine for AI-native customers. Short-duration scarcity capacity delivers the highest price and real option value on a tightening market, alongside almost no financing utility and no forward visibility.
The financing terms attached to each type make the trade concrete, and the middle column is where it bites.
Base deal economics | Prepayment coverage | Compute debt advance | Secured cash rate | Initial term |
|---|---|---|---|---|
Long-term investment grade | 65% | 90% | 5.5% | 5 years |
Core midterm | 55% | 82% | 6.0% | 2 years |
Short-duration scarcity | 25% | 55% | 7.5% | 0.5 years |
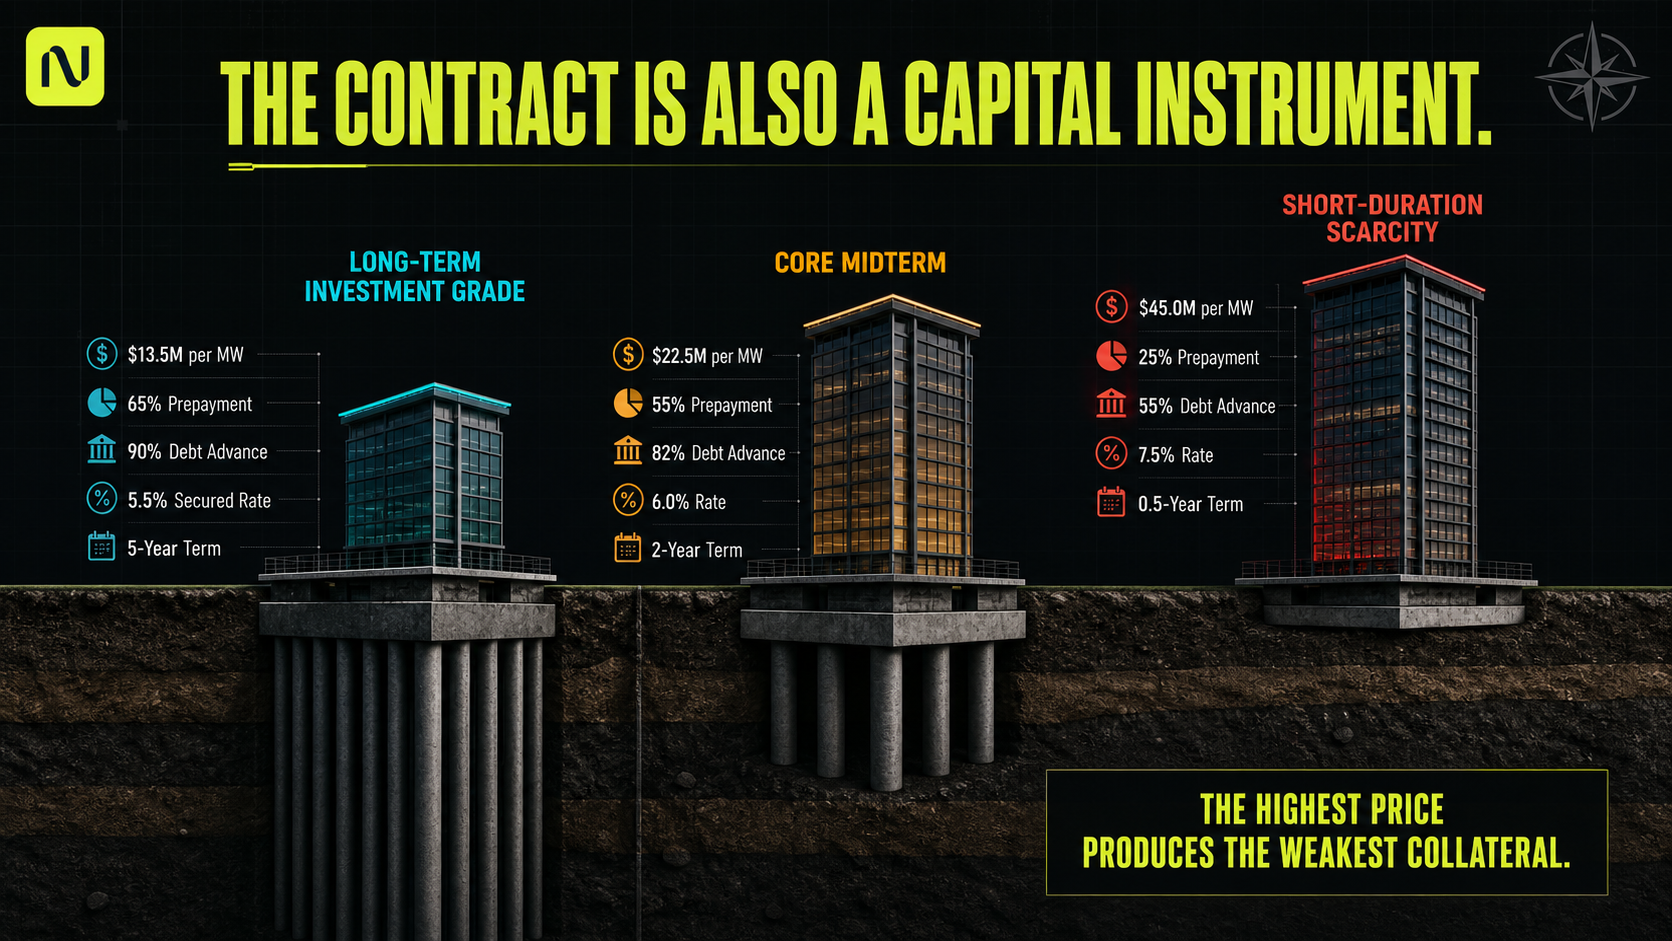
A lender will advance 90% against the cash flows of a five-year investment-grade contract and 55% against six months of scarcity pricing. The expensive deal funds barely half of the hardware it requires.
Mix determines the blend, and mix drifts. Base weighted marginal contract value rises from $21.6M per megawatt in 2027 to $22.36M by 2030 as short-duration capacity grows, and the financing quality behind it slips at the same time. The marginal megawatt in 2030 prices better than the marginal megawatt in 2027 and funds itself slightly worse.
This produces a result that surprised us and that we left in the model deliberately. Our Bear case gives Nebius better financing terms than our Base case, since a rational management team facing expensive capital shifts its commercial mix toward long-duration investment-grade customers and accepts lower headline pricing to secure upfront cash and lender-quality collateral. Most bear cases assume management stands still while conditions deteriorate. Ours assumes they fight, which makes the downside harder to dismiss and relocates the damage somewhere less obvious.
Which brings us to a criticism Chanos put to us directly in August, and the one we consider the most intellectually serious argument against this stock: customer prepayments are expensive financing wearing a costume.
He is right that they are not free. No customer advances billions of dollars without receiving something for it, whether a lower price, a longer term, priority access to scarce capacity, or terms that would otherwise sit differently. The public evidence establishes the scale clearly. In its most recent annual filing Nebius disclosed a Microsoft agreement with up to roughly $17.39B of estimated fees against approximately $6.96B of aggregate upfront payments, near 40% of estimated contract value. Management expects more than $9B of customer prepayments in 2026.
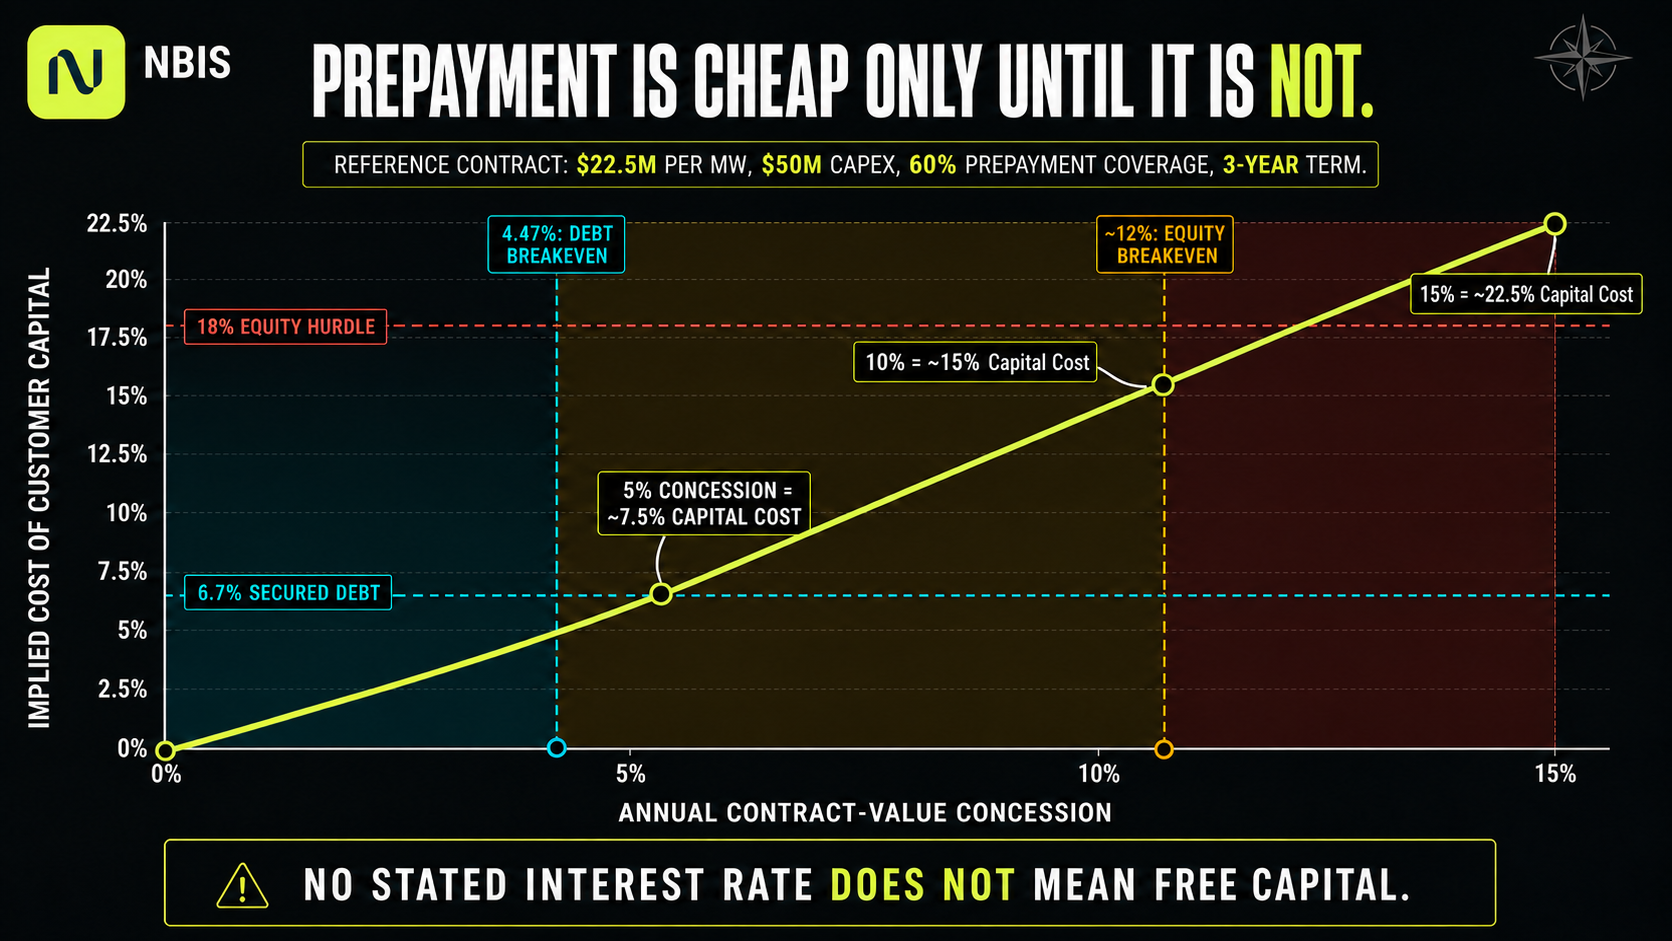
The public evidence cannot answer the question he is actually asking. Nobody has disclosed what the same customer, on the same hardware, over the same term, would have paid without prepaying. Absent that counterfactual, the implicit cost of customer capital cannot be read out of a filing by anyone, us included. Anyone quoting a precise figure is guessing.
So we bracketed it instead. Take a reference contract at $22.5M per megawatt with no prepayment, $50M per megawatt of associated capital expenditure, 60% prepayment coverage and a three-year term. A 5% annual concession on contract value implies a customer capital cost near 7.5%. A 10% concession implies roughly 15%, and 15% implies about 22.5%. Against a 6.7% secured debt benchmark, the breakeven annual concession is approximately 4.47% of reference contract value. Against an 18% equity hurdle, it is roughly 12%.
That bracket contains a decision rule, which is more useful than a point estimate we cannot defend. If Nebius is conceding less than about 4.5% of annual contract value to secure a prepayment, customer capital is cheaper than the secured debt it displaces. Below roughly 12%, it beats equity. Above that, Chanos is correct and the funding advantage is an illusion. Prepayments earn their place in the capital stack when the concession beats the capital displaced, and not on the strength of arriving without a stated interest rate.
$260 Billion of Capital, $12 Billion of Stock
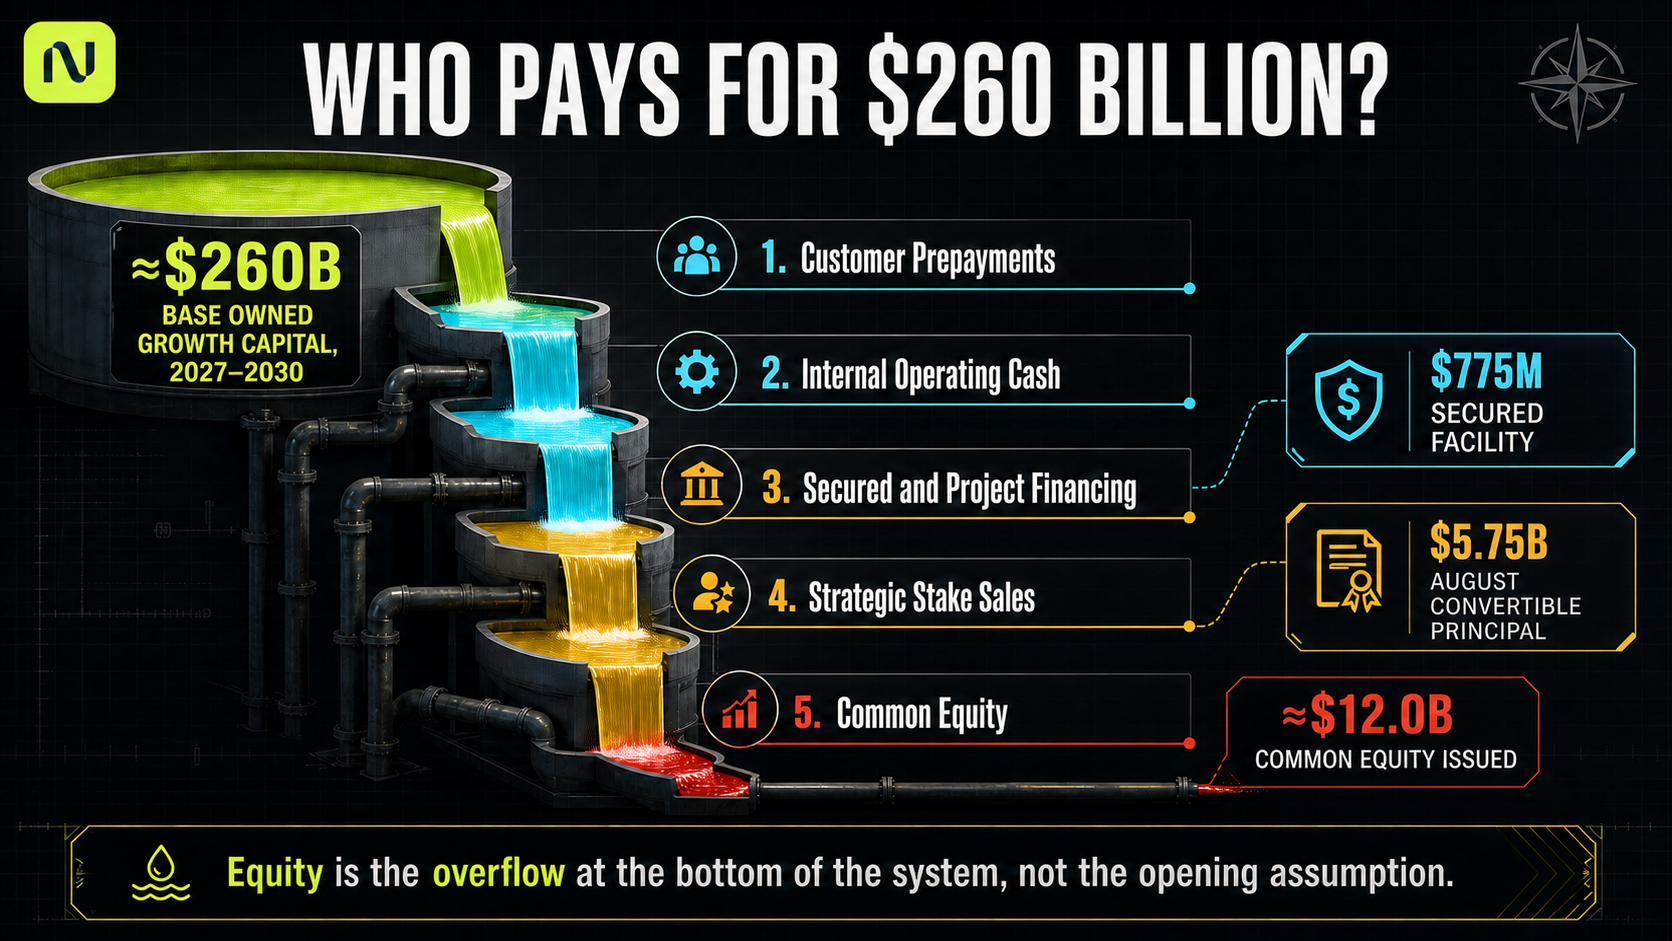
The Base case deploys roughly $260B of owned growth capital between 2027 and 2030 and issues $12.0B of common equity to do it.
Most reactions to a capital programme of that size assume something close to proportional dilution, and the gap between those two figures is where a great deal of the analytical work in this model lives. It is explained entirely by the order in which capital gets raised, a sequence we refer to throughout as the funding waterfall.
Customer prepayments come first, applied only against the portion of capital expenditure that contracts can actually cover. Internal operating cash comes second, after taxes, ordinary working capital, cash interest and the release of previously deferred revenue. Secured and project financing comes third, sized against real collateral in deployed GPUs, project assets and investment-grade contracted cash flows instead of against a scenario assumption. Selling down the non-core stakes comes fourth, and we cap how much of that management is allowed to do. Common equity comes last, and it absorbs whatever the four layers above it could not.
That ordering is not aspirational. Nebius closed a $775M secured facility in July 2026 priced at 2.50% over the benchmark rate, backed by deployed GPU infrastructure and contracted cash flows from an investment-grade customer, which is the third layer functioning as described. More than $40B of customer commitments sit behind future structures of the same kind.
The company also raised equity-linked capital in August. On the 24th it closed $3.45B of 0.50% notes due 2030 and $2.30B of 4.50% notes due 2034, $5.75B of principal after purchasers exercised their additional options in full, for roughly $5.68B of net proceeds. Those are convertible notes, meaning they can become shares at a fixed price, and we treat them punitively. Every issued note is assumed to convert by terminal valuation, which puts the shares in the denominator, and the converted principal is then removed from terminal net debt so the same obligation is not charged twice. The resulting fully diluted base before any future equity is approximately 396.834M shares, of which the August notes alone contribute roughly 18.091M.
From there the scenarios separate, and they separate far more violently than the capacity schedule did.
2030 | Bear | Base | Bull |
|---|---|---|---|
Owned growth capital, 2027 to 2030 | ~$222B | ~$260B | ~$295B |
Secured and project debt | $66.48B | $84.86B | $53.44B |
Lease liabilities | $14.85B | $12.07B | $11.06B |
Common equity issued | ~$43.5B | ~$12.0B | ~$2.0B |
Future common shares issued | ~289.9M | ~48.1M | ~5.7M |
Fully diluted shares | ~686.8M | ~445.0M | ~402.6M |
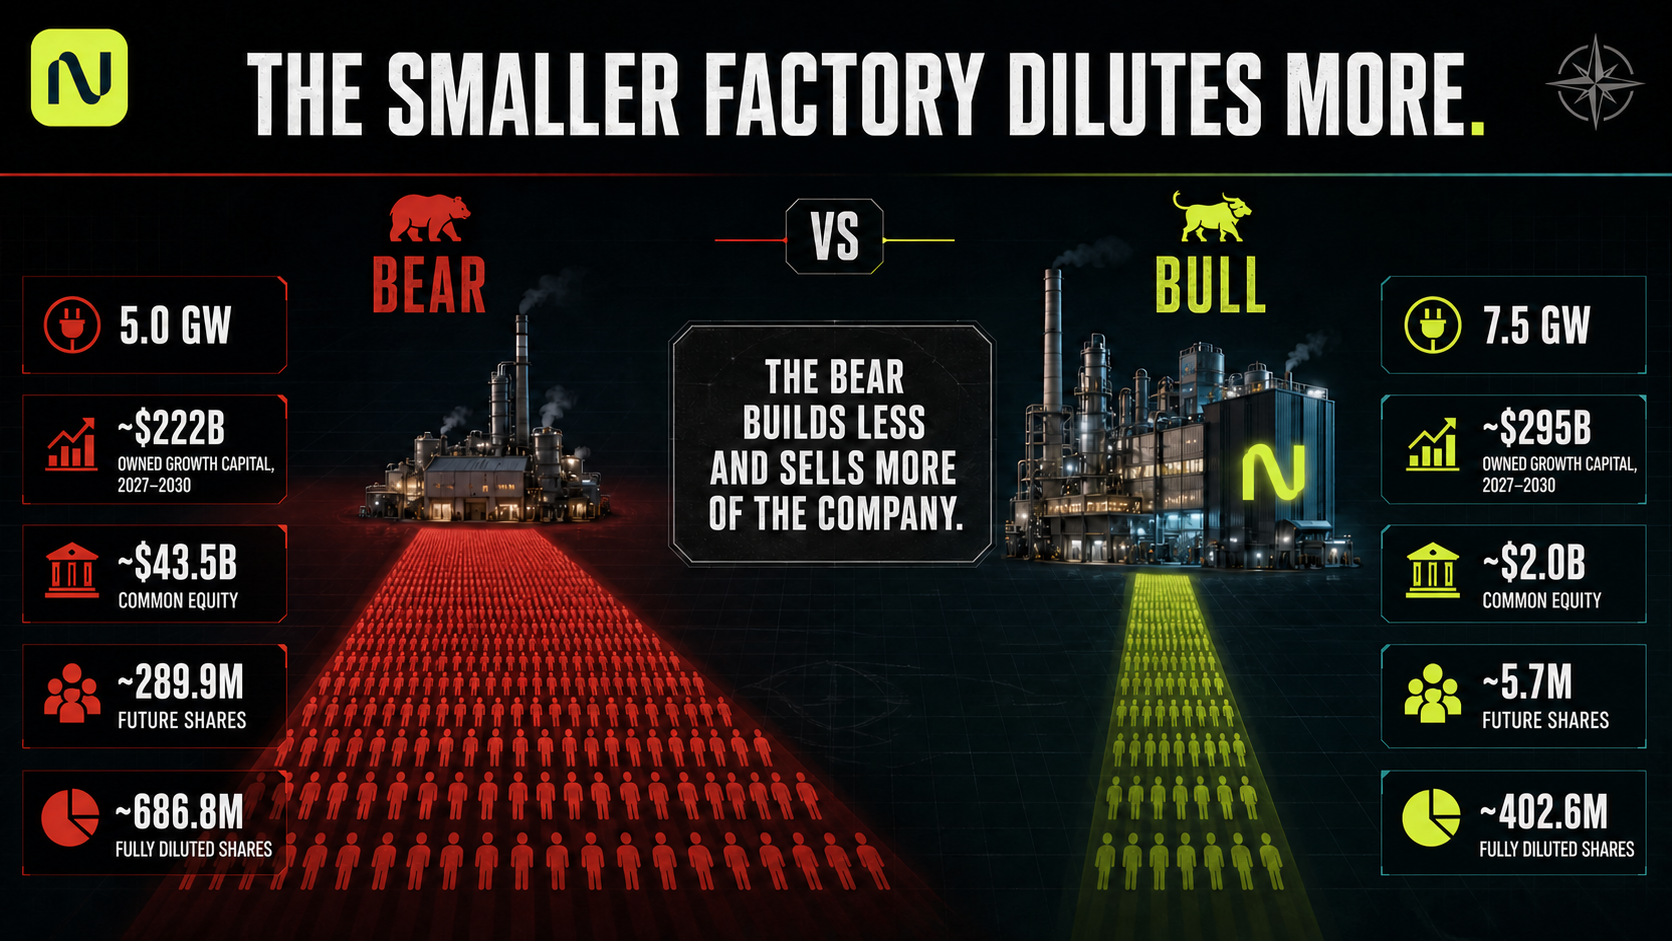
Compare the first and fourth rows. The Bear case builds 25% less than the Bull case and issues more than twenty times as much stock.
Look at the debt line to understand why. Bear does not simply borrow more to compensate for a harder environment. It borrows $18B less than Base, since debt capacity is a function of contracted cash flows and collateral quality, and both deteriorate in the same conditions that make the Bear case a Bear case. Lower revenue means less collateral, less collateral means a smaller advance, and the shortfall lands on the only layer of the waterfall with no capacity limit at all. Equity is not the last resort in the Bear case because management chose it. It is the last resort because everything above it filled up.
Two clarifications keep the table honest. Bear issuance is what remains after management has already shifted contract mix toward prepayment-heavy customers, pushed more deployment into partner-funded structures, and sold down strategic stakes to the modelled cap. Bull does not receive zero dilution as a gift either, issuing roughly $2.0B of common equity in 2027 before the business turns self-funding.
The 71% spread between 686.8M and 402.6M shares is the widest dispersion anywhere in this model, and it sits in the denominator of every valuation that follows. Nebius can build the capacity, sign the customers, hit the pricing, and still deliver a materially different outcome to the person holding the stock, depending entirely on how the last layer of the waterfall gets filled.
The Machine Wears Out Faster Than the Accounting Says
The most quoted criticism of this sector comes from Michael Burry, the investor who shorted subprime mortgages before the 2008 crisis and who has spent 2026 arguing, in comments widely reported, that AI infrastructure companies are understating depreciation. The claim is that five-year schedules overstate the useful life of AI compute, which flatters reported earnings and hides how much capital the business consumes to stand still.
The people repeating it and the people dismissing it both tend to collapse four separate questions into one, and each answer points a different way.
Accounting life is a policy choice, and Nebius uses five years for servers and networking equipment. Architecture commercial life is how long a hardware generation remains saleable for useful work, and the evidence here is stronger than the bears allow. CoreWeave, the closest listed comparable, disclosed an attractively priced contract on A100 accelerators running into 2029, against an architecture NVIDIA launched in 2020. NVIDIA itself states that A100 remains in active commercial use six years after introduction and retains full support status in its virtualisation documentation.
Economic retention is the third question, and it is where the bullish reading of that evidence falls apart. A six-year-old accelerator still finding a buyer does not mean it earns anything close to frontier economics. It means a second-life market exists. Those are different claims, and conflating them turns a reasonable observation about A100 longevity into an unreasonable assumption about fleet economics in 2030.
The fourth question is the one almost nobody asks, and in this business it dominates the other three. Call it power opportunity cost. A functioning older accelerator occupying a megawatt of scarce, permitted, energised capacity is not free to keep, since it displaces newer hardware that would generate substantially more revenue from the same megawatt. Where power is the binding constraint and silicon is not, the replacement decision turns on what the slot could earn, not on whether the machine still runs.
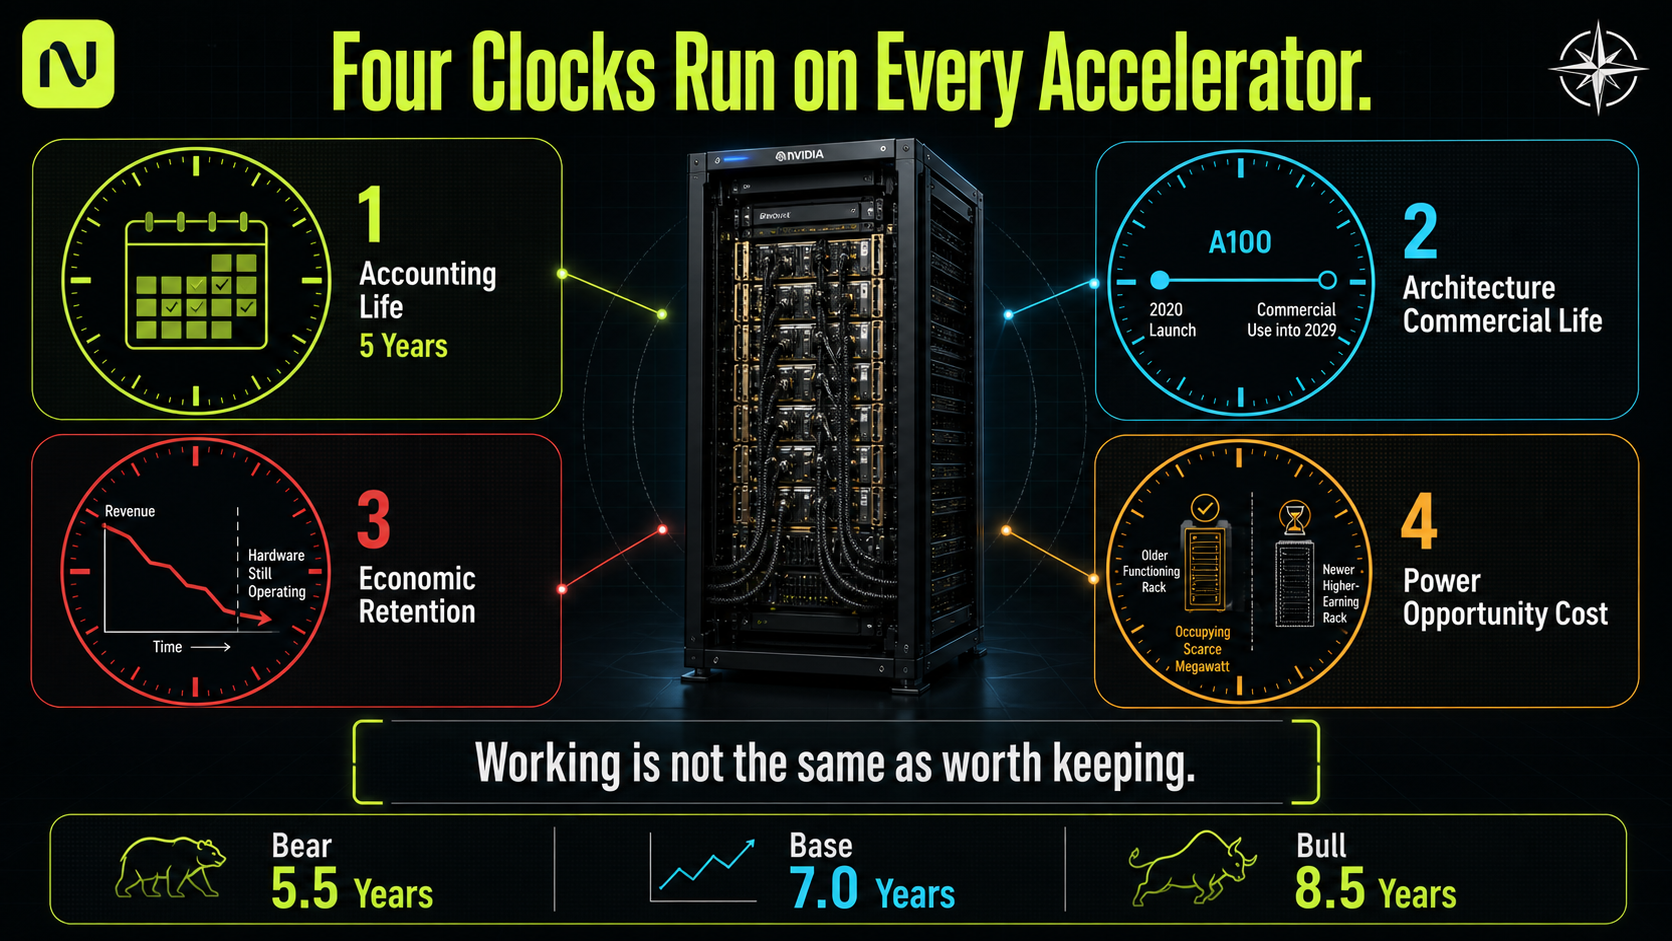
So we carry two separate lines. Accounting depreciation follows the five-year policy. Against it we run a normalised replacement reserve, which is our estimate of the annual economic cost of keeping the fleet current across repeated hardware cycles. The gap between them measures what the accounting hides.
2030 | Bear | Base | Bull |
|---|---|---|---|
Economic compute life | 5.5 years | 7.0 years | 8.5 years |
GAAP depreciation | $35.92B | $39.98B | $43.99B |
Normalised replacement reserve | $35.25B | $33.12B | $31.52B |
The seven-year Base life survived a direct audit against the A100 evidence and we left it unchanged. Bull at 8.5 years is plausible at an architecture level and unproven at 2030 fleet scale, and it is the more aggressive of our two upside assumptions. Bear at 5.5 years sits deliberately below what the second-life evidence supports, since we would prefer to be wrong in that direction.
Now run the Base case from revenue down to what an owner would keep, and watch the number shrink at every line.
Recognised revenue of $103.16B produces adjusted EBITDA of $56.15B at a 54.4% margin, which is where most valuations of this sector stop. Depreciation of $39.98B and interest expense of $5.00B come out below that line. Set the accounting charge aside and substitute the replacement reserve of $33.12B, which under a seven-year economic life is lower than depreciation, and normalised owner free cash flow before growth capital lands at $16.02B.
That is approximately 15.5% of revenue, against a 54% EBITDA margin. The distance between those two figures is the Burry argument quantified, and it is why one of the valuation methods we use later in this report is built on owner cash flow instead of EBITDA.
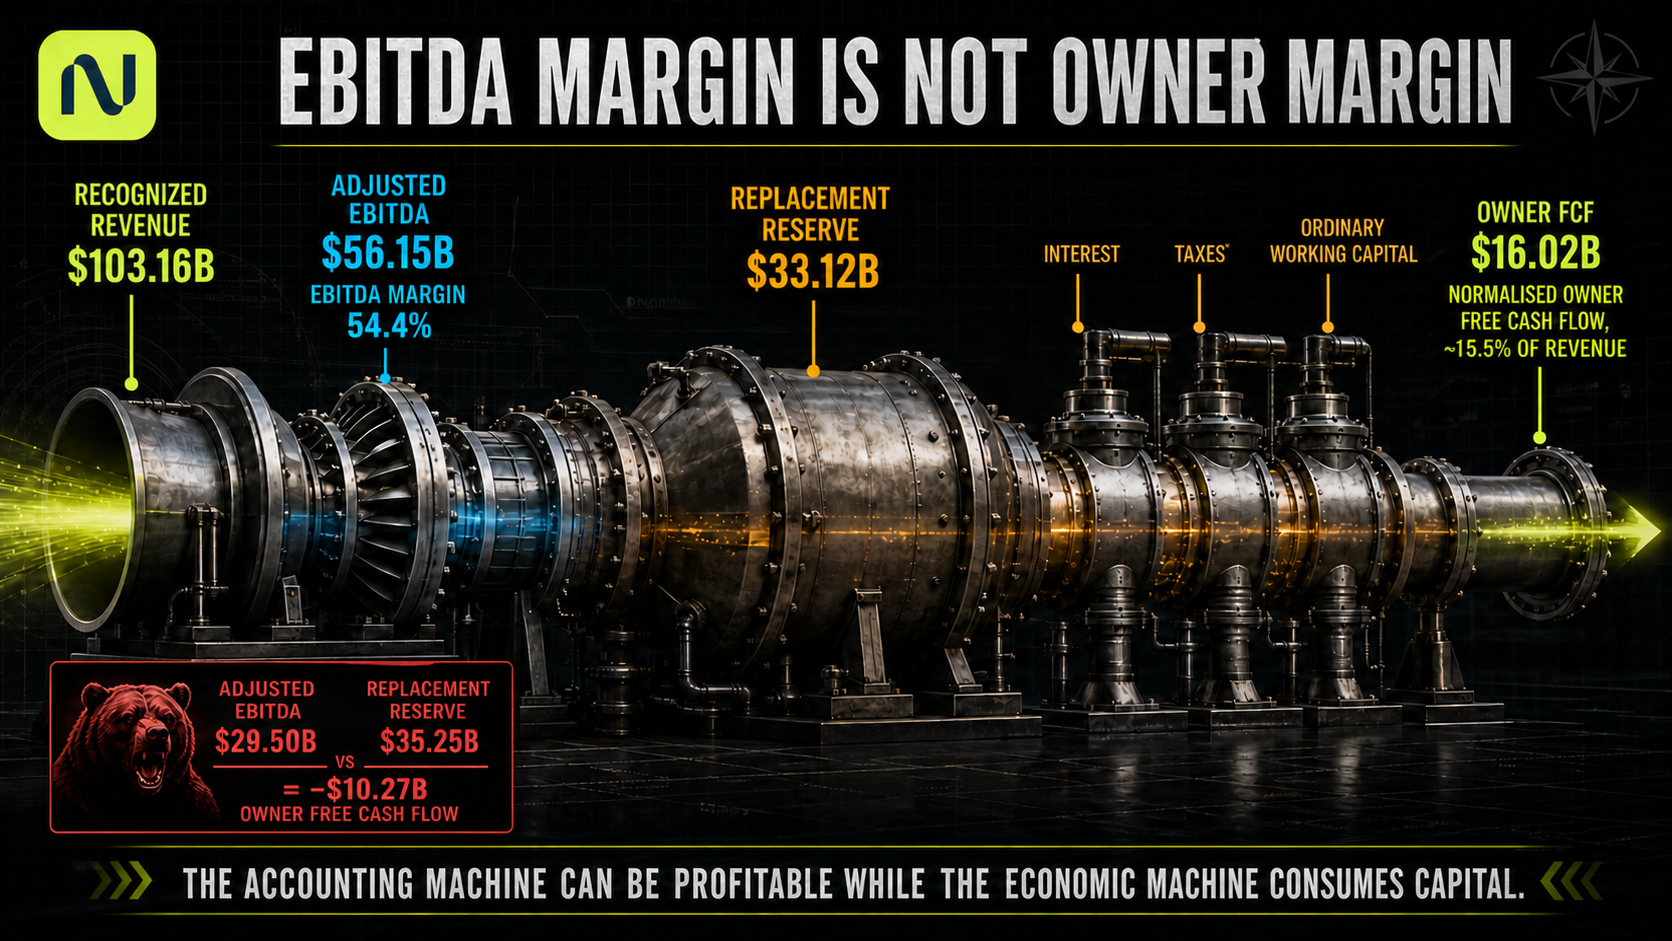
One caution about that number, since it is easy to misuse in our own favour. Normalised owner free cash flow is not conventional reported free cash flow. It is an economic construct that reserves for steady-state replacement while ignoring discretionary expansion, and it describes what a mature version of this business would throw off. The 2030 cash flow statement will show something different while the company is still building.
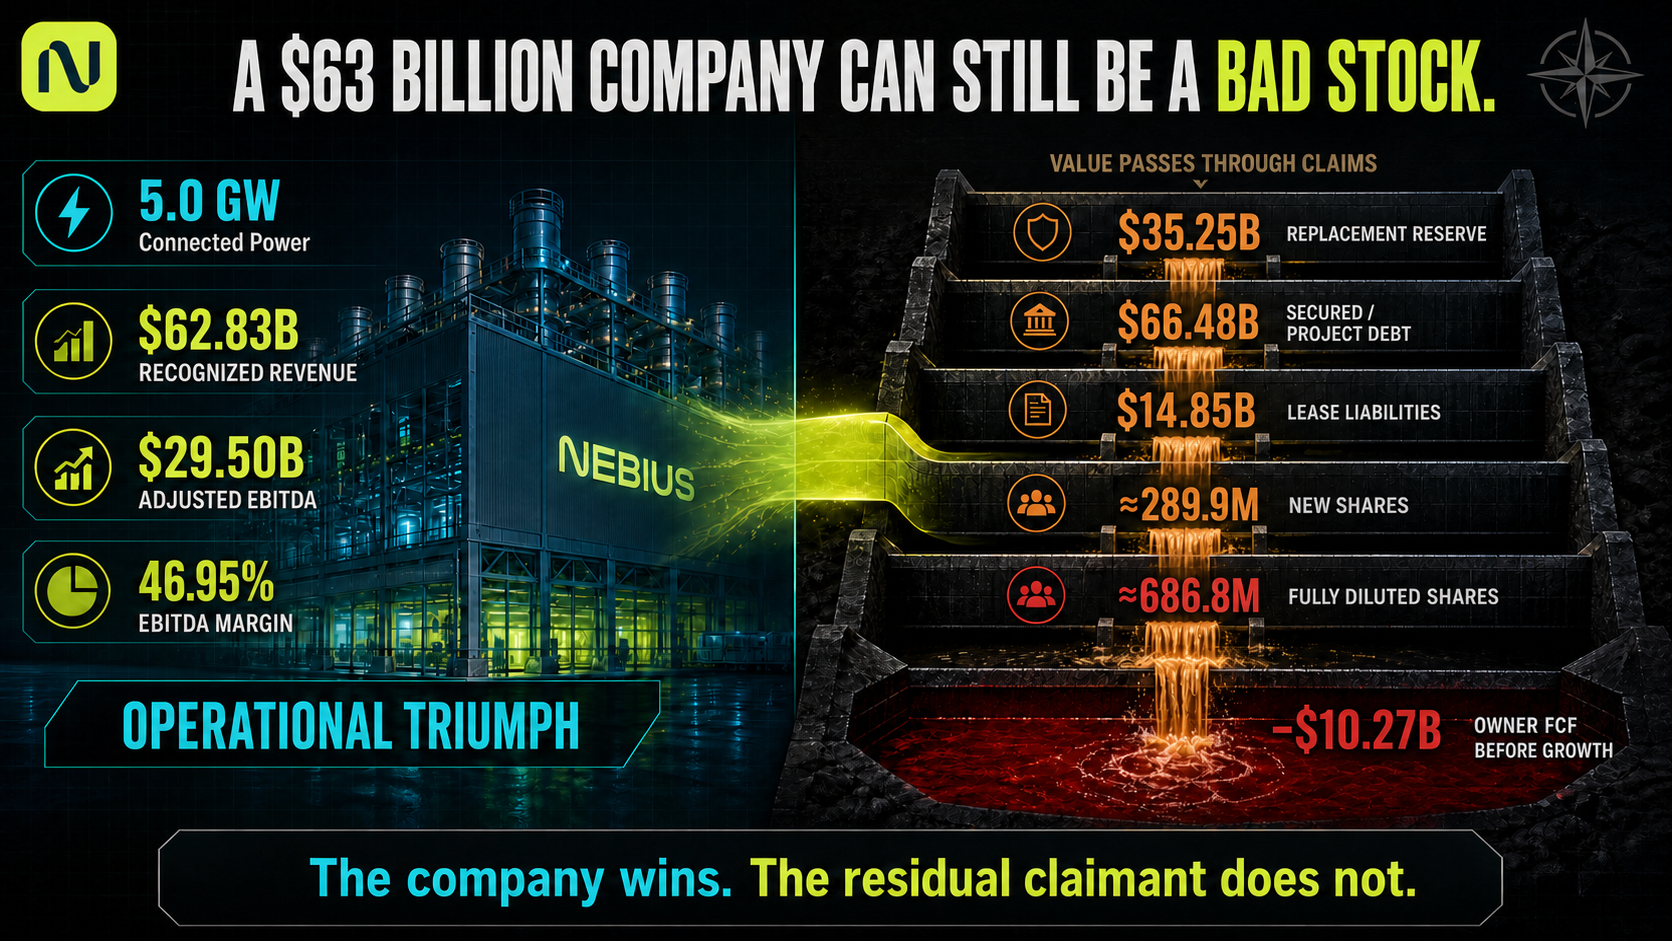
The Bear case makes the same point far less gently. At $62.83B of recognised revenue and $29.50B of EBITDA, the replacement reserve is $35.25B and owner free cash flow before growth capital is negative $10.27B. A company with $63B of revenue and a 47% EBITDA margin can consume more capital sustaining itself than it produces. Nothing has failed in that scenario. It is the ordinary outcome of building a very large fleet at high cost and earning ordinary returns on it.
The Part That Does Not Need $50 Billion a Year
Everything to this point describes a business converting enormous capital into revenue at a defined and stubborn ratio. Roughly $59M of cash builds one active IT megawatt, and that megawatt earns something near $20M a year. Those economics are attractive on a project basis and punishing on a growth basis, since scaling revenue requires scaling capital almost in lockstep, and the capital has to come from customers, lenders or shareholders every single year.
Two developments break that link, and we think the market is underrating both, for what they do to the shape of the business more than for what they contribute to revenue today.
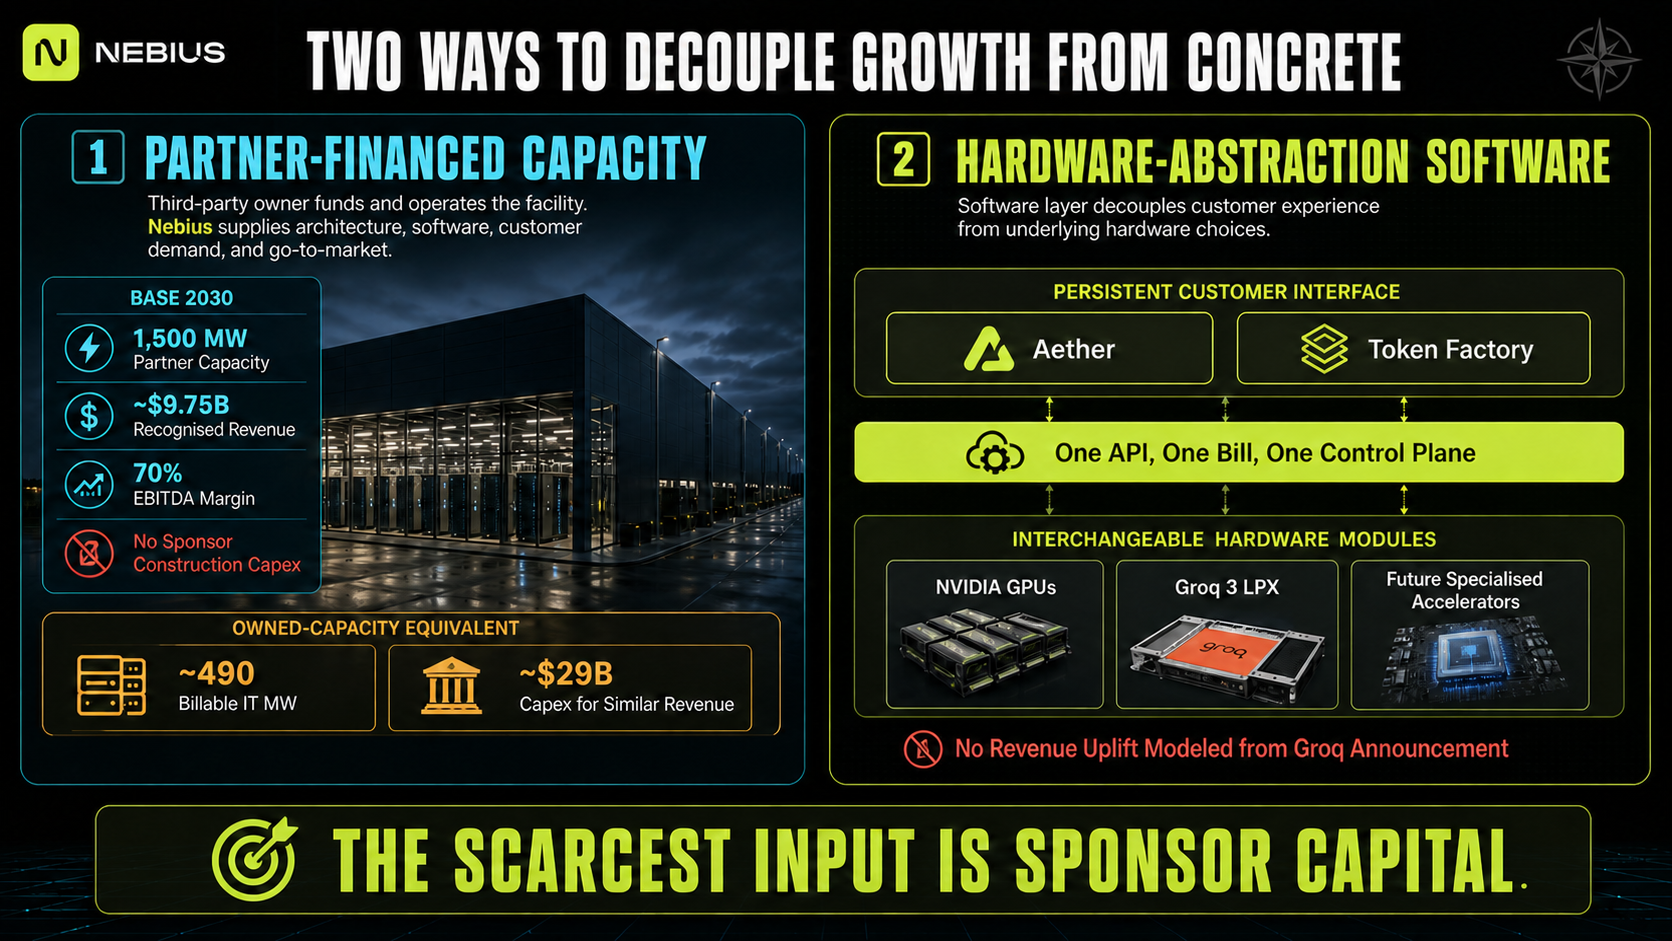
Start with the asset-light model. A partner finances, builds and operates the data centre. Nebius supplies the full-stack cloud software, the systems architecture and reference designs, and global go-to-market and demand. Volozh has said the company received dozens of inbound approaches from parties holding capacity and capital but lacking the technology and sales capability to monetise either.
That admission carries real strategic weight. Nebius cannot own-build every attractive market simultaneously, and a growing population of counterparties can fund the buildings without being able to fill them. The asset-light structure converts that mismatch into revenue arriving with no corresponding capital line.
Our Base path scales partner-financed capacity from 250 MW in 2027 to 600, then 1,000, then 1,500 MW by 2030, with revenue per partner megawatt rising from $6.5M to $8M. Recognised asset-light revenue reaches roughly $9.75B in 2030 at a modelled 70% EBITDA margin.
Set those two figures against the owned business for a moment. That is $9.75B of revenue at a 70% margin, generated on 1,500 MW Nebius did not pay to build. Delivering the same revenue through owned capacity would require roughly 490 MW of billable IT power at Base density, which at $59M per megawatt means something close to $29B of capital expenditure, run through the funding waterfall, carrying its proportional share of the dilution.
The argument for asset-light sits in that comparison. Partner capacity earns considerably less per megawatt than owned capacity does, and it earns without consuming the scarcest input in the entire business model. That input is not power and it is not silicon. It is sponsor capital, and the price of sponsor capital gets paid in shares outstanding.
Our Bear case leans on this hardest, pushing partner-financed capacity to 1,800 MW by 2030 at lower revenue per megawatt, precisely because a management team facing expensive equity should be shifting growth toward structures that require none of it. Bull reaches 2,500 MW and $25B of exit recurring revenue, which we carry as real upside with wide error bars.
The software layer works on the same principle from a different direction, and two products carry it. Aether is the full-stack cloud layer covering compute, orchestration, enterprise controls, security, compliance, storage and deployment, and its strategic value sits in customer workflow integration instead of accelerator ownership. Token Factory is the managed inference and open-model product, where customers run models without operating infrastructure, and Q2 commentary emphasised day-zero support for frontier open models alongside the shift toward specialised models tuned on proprietary enterprise data.
On August 24, Token Factory became the first AI cloud to adopt NVIDIA Groq 3 LPX. Groq 3 LPX is a dedicated inference accelerator, purpose-built for running models instead of training them, and it is not a GPU. Existing Nebius users reach it through the same operating model with no new development kit, vendor relationship or billing setup. NVIDIA has the product in full production and offers it alongside Vera Rubin as an addition to the platform.
We added zero dollars of revenue for that announcement. Nebius has disclosed no pricing, no token volume, no rack cost, no power draw, no deployment megawatts and no revenue. Modelling an uplift from a product launch with none of those disclosed would be the shortcut this report exists to argue against, and it would be embarrassing to make that mistake three sections after criticising other people for it.
What the announcement demonstrates is worth more than a revenue line anyway. The customer-facing Nebius platform can abstract a specialised inference accelerator that is not a GPU. That answers the concern that custom silicon from Google, Amazon, Microsoft or a startup eventually displaces NVIDIA and strands companies like Nebius, and it beats insisting NVIDIA will dominate accelerators indefinitely. The question worth asking has always been whether Nebius keeps the customer relationship, the orchestration layer and the billing relationship when the silicon underneath changes, and Groq is the first evidence that it can.
Our Base software assumption stays deliberately small. Incremental software and inference revenue equals 2% of owned cloud revenue in 2027, rising to 4%, 5% and 6% by 2030, at a 72% EBITDA margin. In 2030 Base that is $5.24B against $87.36B of owned cloud revenue, which nobody would call an aggressive attach rate.
We are comfortable being conservative in the model and direct about the implication anyway. Should asset-light and software together reach 15% of group revenue at 70% margins, the business emerging in the early 2030s is structurally different from the one being valued today. It would carry a materially higher blended margin, consume dramatically less capital per dollar of incremental revenue, and deserve a multiple reflecting both. Those are the conditions under which a company earns hyperscaler economics instead of merely hyperscaler scale.
None of that sits in our Base valuation, and it should not until partner revenue share, margin structure, customer ownership and adoption become visible. It is, however, the most credible path by which this model proves too conservative, and readers should understand that the largest upside in the Nebius story is not more gigawatts. It is a growing share of revenue that arrives without them.
Where $103 Billion Comes From
A 2030 revenue figure of $103.16B in the Base case invites immediate suspicion, and it should. Numbers that size usually arrive from a growth rate applied to a small base, and a growth rate is not an argument.
This one is built the other way, cohort by cohort. The discipline inside that machinery is what keeps the number from being larger, so it is worth following closely.
Each year adds a new billable megawatt cohort once capacity has cleared commissioning, cooling overhead and customer acceptance. Each cohort receives a contract-type mix and a price at the moment of deployment, and then it lives its own life. Long-duration contracts stay locked. Midterm contracts run a two-year initial term and reprice to whatever the market offers then. Short-duration capacity reprices annually. No cohort inherits the pricing of a newer one, so the 2027 vintage never enjoys 2030 economics and the 2030 vintage never carries 2027 rates.
Exit recurring revenue and recognised revenue then diverge, and the gap is not a rounding issue. Base 2030 owned-cloud exit recurring revenue is $98.80B against $87.36B of recognised owned-cloud revenue, and the difference is capacity that arrived too late in the year to earn a full twelve months of anything.
The machinery produces this.
2030 | Bear | Base | Bull |
|---|---|---|---|
Owned billable IT MW | 3,997 | 5,136 | 6,324 |
Recognised group revenue | $62.83B | $103.16B | $191.62B |
AI platform exit recurring revenue | $67.66B | $116.73B | $224.46B |
Adjusted EBITDA | $29.50B | $56.15B | $114.32B |
Fully diluted shares | 686.8M | 445.0M | 402.6M |
Now the part that answers both of this report's opening antagonists at once.
Watch what happens to fleet density as the cohorts roll. In the Bear case, realised fleet revenue per megawatt peaks near $16.09M in 2027 and declines to roughly $14.40M by 2030, even though every new cohort is priced above zero and the pricing environment never collapses. Older cohorts roll off, mix shifts, and the fleet average drifts down while the marginal contract holds up. In the Base case the same mechanic produces $19.19M of realised fleet revenue per average billable megawatt in 2030, against $19.24M of exit recurring revenue per year-end billable megawatt and $21.02M on the newest cohort.
Three densities, all correct, all measuring different things. The whole argument sits in that one line of the model.
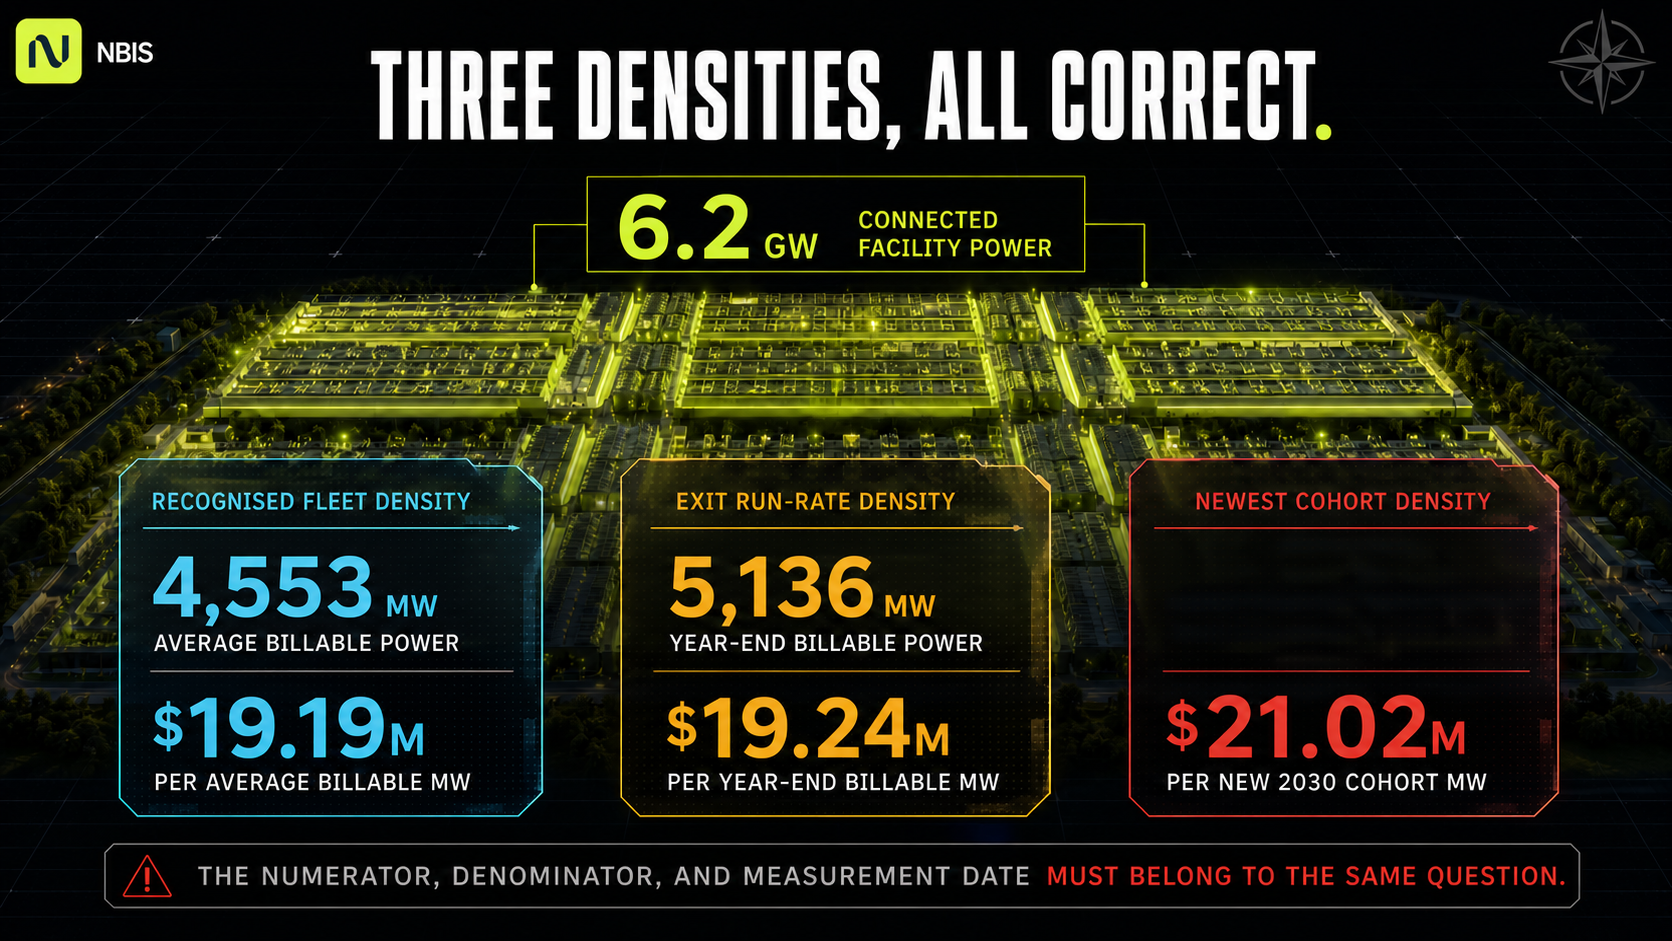
The bull shortcut from the opening fails twice over: in the numerator, since the newest contract price never applies to a whole fleet, and in the denominator, since connected gigawatts are not billable megawatts. The Chanos shortcut takes a capital-employed ratio measured mid-construction and projects it onto a mature business. Both are single-number arguments about a system with four capacity states, four hardware vintages, three contract durations and two revenue bases.
We are not splitting the difference between them. We are saying the difference is not the interesting quantity. What matters is which denominator belongs with which metric in which year, and once you insist on matching them properly, most of the public disagreement about this company stops being a disagreement about Nebius and becomes a disagreement about arithmetic.
The Bear Case Is Not That Nebius Fails
The most dangerous version of the bear argument has nothing to do with an AI winter. It assumes demand holds, capacity gets built, customers sign, and the company reaches roughly $63B of revenue in 2030. The stock still disappoints, and it disappoints for reasons fully visible in the model today.
Our Bear case builds 5.0 GW of connected power by 2030, converting to 4.08 GW of active IT power and 4.00 GW of billable capacity. Recognised group revenue reaches $62.83B, AI platform exit recurring revenue reaches $67.66B, and adjusted EBITDA reaches $29.50B at a 47% margin. By any ordinary standard that is a triumph, and it would place Nebius among the largest infrastructure businesses built in a decade.
Then the claims get paid. The replacement reserve runs to $35.25B against $29.50B of EBITDA, so sustaining the fleet costs more than the fleet produces and owner free cash flow before any growth capital is negative $10.27B. Secured and project debt ends the period near $66.48B, lease liabilities near $14.85B, and the net debt reference near $76.32B. Roughly 290M new shares get issued along the way, taking the fully diluted count to approximately 686.8M.
The mechanism is worth stating plainly, since it is what most bear cases get wrong. Nebius does not fail to build. It builds $222B of owned capacity, which is only a quarter less than the Bull case builds. What it cannot do is fund that build the same way, since every non-equity layer of the waterfall is sized against the very things a Bear environment weakens. Prepayment coverage depends on customer willingness. Debt capacity depends on contracted cash flows and collateral value. Both compress at exactly the moment the capital requirement does not.
So management does everything available to them and the arithmetic still grinds the residual claim down. They shift the contract mix toward prepayment-heavy investment-grade customers. They push deployment into partner-funded structures. They sell down the strategic stakes to the modelled cap, reducing terminal value dollar for dollar. And $43.5B of common equity still has to be issued at the bottom of it, at prices that reflect the environment that made it necessary.
This scenario gets less attention than it should, since it requires nothing unusual to happen. No demand collapse, no technology discontinuity, no financing crisis. It requires only that costs run at the high end, pricing runs at the low end, and capital markets charge a normal price for the risk. Investors who lose money on capital-intensive infrastructure buildouts usually lose it in exactly this fashion, holding stock in a company that succeeded.
Building the Failure Cases on Purpose
The Bear case above is the ordinary downside, produced by the same engine as Base and Bull with less favourable inputs. Real impairment needs different machinery. Modelling catastrophe by dialling down the assumptions in your main scenario lets the catastrophe assumptions leak into the base case, which quietly makes it more pessimistic than intended.
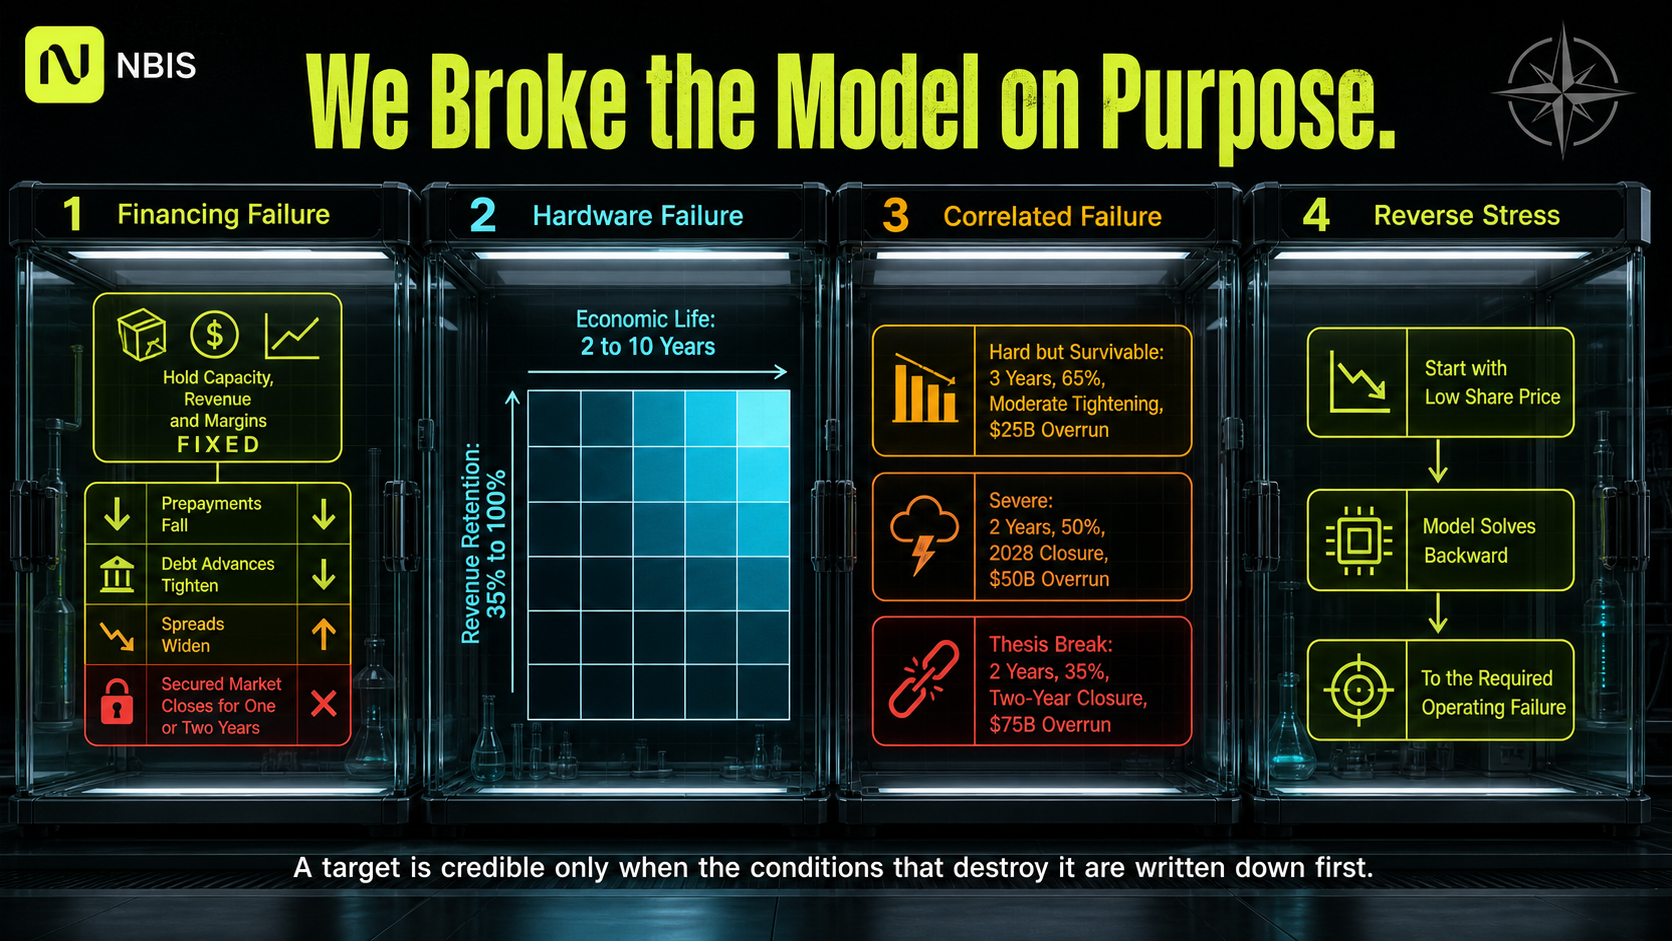
So we built three stress exercises that sit outside the scenario engine entirely. Each takes the Base case as its starting point, breaks one thing on purpose, and reports what comes out the other side. We describe how each one works here; the resulting share prices appear in the members' section below.
The first exercise holds the operating business completely still and breaks only the financing. Revenue, margins and physical capacity stay fixed at their Base values while prepayment coverage falls, lender advance rates tighten, secured spreads widen, and the price at which residual equity clears drops. In the harder versions the secured debt market shuts entirely, for one year and then for two.
We would rank this the most underappreciated risk in the whole thesis, and the reason sits in the structure. Every other failure mode requires something to go wrong with the business. This one requires nothing to go wrong with the business at all. A company committed to $54B to $69B of annual deployment, funded by a waterfall whose third layer is secured debt, cannot pause when credit markets close. It either issues equity into a hostile market at a punishing price or walks away from construction it has already committed to.
The second exercise attacks the hardware, and it tests two failure paths that are usually conflated. Short life is a replacement-speed problem: the machines have to be bought again sooner. Low retention is a repricing problem: the machines keep running and simply stop earning what they used to. We cross economic compute life from 2 to 10 years against economic retention from 35% to 100%, which produces a grid instead of a single answer. The most severe corner, a two-year economic life combined with 50% retention, is the quantitative form of the depreciation critique set out earlier, and it is painful.
The third exercise responds to the fairest criticism of the first two, which is that bear variables are correlated. Hardware lives do not collapse in a year when credit markets are relaxed and construction is running to budget. Bad things arrive together, so we stacked them.
Combined failure case | Economic life | Retention | Financing | Cost overrun | Multiple factor |
|---|---|---|---|---|---|
Hard but survivable | 3 years | 65% | Moderate tightening | $25B | 0.90x |
Severe combined | 2 years | 50% | 2028 market closure | $50B | 0.75x |
Thesis break | 2 years | 35% | Two-year closure | $75B | 0.60x |
All three cases now compress the exit multiple as well, since a market watching hardware lives shorten and financing tighten will not pay the same multiple for whatever survives. Applying that compression only to the worst cases understated the middle one.
One further exercise runs the whole thing backwards. Instead of choosing inputs and reading the output, we fix a low terminal share price and solve for the operating scale, leverage or share count that would be required to produce it. That version is more useful than forward stress testing, since it converts an unfocused worry into a falsifiable claim about how much of the business would have to fail. A target price is only worth something if the analyst can also say what would destroy it.
None of these are sensitivity tables bolted onto a bull thesis after the fact. They are the conditions under which we would be wrong, written down in advance so that readers can hold us to them later.
The Arguments Against Us
Nebius has attracted more serious public criticism this year than any other company in this sector, which is a compliment of sorts. Some of it comes from professional short sellers, some from working investors on X and Reddit, and some from readers who have written to us directly. We have collected the substantive versions here and grouped them by what kind of question each one is, since that determines whether a model can settle it at all.
The most persistent critic has been Chanos, whose capital-employed ratio opened this report. Across a series of posts through August he has made three distinct claims, and he replied directly to us on one of them. All three need answering, and one of them is the sharpest argument against this company anyone has made.
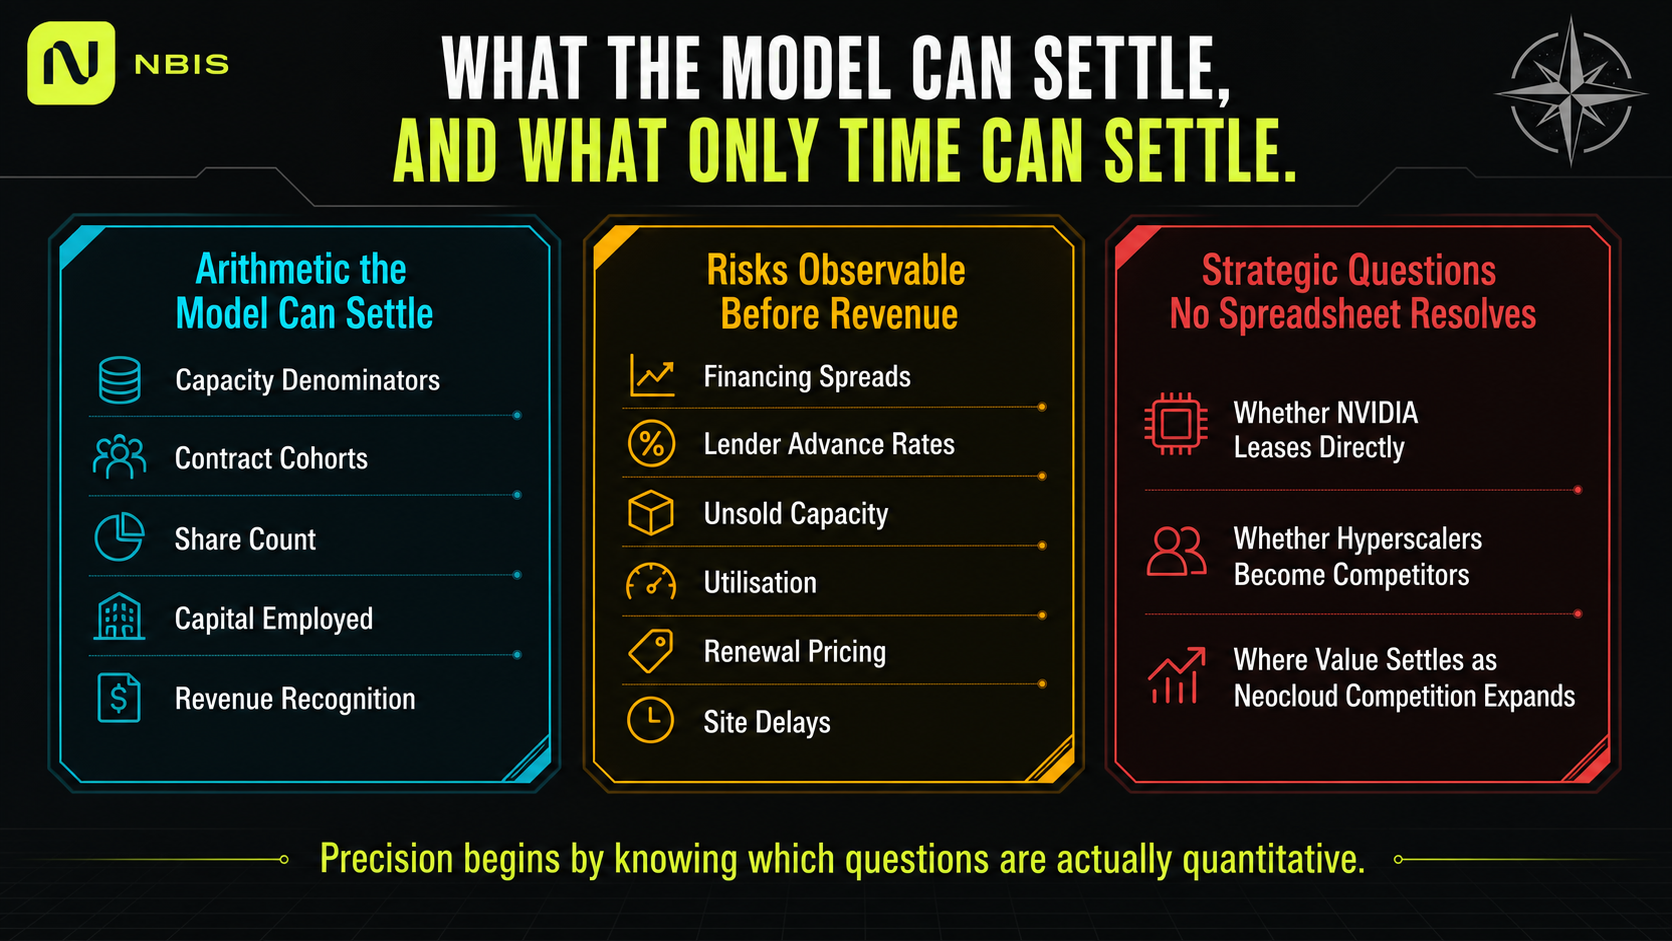
Questions the model settles
His capital argument produces roughly $840B of required capital at $157.5B of recurring revenue, and we can reproduce the figure. The problem is what the ratio is measured on. Today Nebius is mid-build, with billions of dollars of assets under construction sitting in the numerator that have not yet energised and therefore contribute nothing to the denominator. A ratio taken at that moment describes a company in a particular state, not a property that persists.
Run the same question through a mature fleet using the build costs and revenue density set out earlier, and it compresses substantially. Reaching $157.5B of recurring revenue through fully owned capacity requires approximately $477.6B of gross commitments, a ratio near 3.03x. Under a mix that includes partner-funded asset-light capacity, it falls to roughly $398.7B, or 2.53x. Those are enormous numbers and we are not pretending otherwise. They are also 43% to 53% below what the spot ratio produces.
The part that cuts against us comes next, and we would rather say it than have someone else point it out. There are combinations of assumptions under which Chanos lands in the right place. If long-run fleet revenue density settles into the $10M to $12M per megawatt range that his connected-power framing implies, and build costs run at the top of our range, his $600B to $800B band is reachable on our own cost engine. His conclusion follows from a density assumption. That assumption is the thing to argue about, and everyone currently arguing about the ratio is arguing about the wrong variable.
His second claim is more recent and our answer is less accommodating. On August 24 he pointed out that Street consensus for 2027 revenue sits near $11.5B, that Nebius should have roughly 1.5 GW of average connected power that year, and that the implied revenue of under $10M per megawatt cannot be reconciled with contracts priced at $20M to $25M. He treats the inconsistency as evidence that something in the Nebius story does not hold together.
The comparison mixes four quantities that this report has spent considerable time separating. It divides recognised annual revenue by average connected facility power, then compares the result against annualised contract value on newly deployed billable IT capacity. Different denominators, different capacity states, different points in time.
Our 2027 Base runs as follows. Average connected power is roughly 1.50 GW, matching his figure. Average billable IT power, which is the denominator that recognised revenue is actually earned on, is roughly 1.059 GW. Year-end billable IT power reaches roughly 1.596 GW. The new billable cohort added during the year is roughly 1.074 GW priced at $19.87M of recurring revenue per megawatt, contributing about $21.35B to exit recurring revenue. Owned-cloud exit recurring revenue reaches $29.35B, AI platform exit recurring revenue reaches $31.56B, and recognised group revenue comes to $20.01B.
Against the $11.5B consensus figure he cites, our model sits roughly 74% higher. We do not read that gap as an inconsistency in what Nebius has disclosed. We read it as consensus that has not yet rebuilt its 2027 model around the physical ramp and contract economics the company put on the table in Q2. Sell-side models tend to lag when a capacity schedule moves this quickly, and we are comfortable stating plainly that current 2027 Street revenue is materially too low if the disclosed ramp holds.
His third claim, that customer prepayments carry an implicit capital cost, was answered at length above. He is right that they are not free, no public disclosure reveals what the same contract would have cost without prepayment, and we bracketed the concession instead of inventing a number.
Several other objections in this group have already been answered by the architecture of the report. The puzzle of how $7B to $9B of 2026 exit recurring revenue coexists with 800 to 1,000 MW of connected power dissolves in the 2026 capacity bridge. The concern about hidden fixed claims is why lease obligations carry their own line rather than disappearing into a capital expenditure figure. The question of whether custom silicon displaces NVIDIA is the one that Groq running inside Token Factory begins to answer.
Risks the model cannot dissolve
Financing closure is the first, for the reasons already given. Demand weakening is the second, and it is clearly observable well before it reaches revenue: watch utilisation, unsold capacity at energisation, renewal pricing, contract value per megawatt on new cohorts, and the pace at which management commits to fresh construction. Current evidence points the other way, with commitments and pricing both moving in the company's favour. A demand slowdown belongs in the model when those indicators turn and not while it remains merely conceivable.
Power opportunity cost is the third, and if forced to name one risk that both bulls and bears underweight, this is it. The depreciation section treated it as a modelling question. As an investment risk it is simpler: in a market where energised, permitted capacity binds, revenue that a newer accelerator would have earned in an occupied slot is lost silently, without ever appearing as an impairment charge.
Judgments no spreadsheet resolves
If GPU leasing is as attractive as the returns imply, why does NVIDIA not lease the chips itself and keep the residual value? Chanos has raised this too, and we do not consider it disproved. The strategic answer involves capital intensity, channel neutrality, the operational difficulty of running multi-tenant infrastructure, the software layer, and NVIDIA's incentive to maximise ecosystem volume across many buyers. Supplier power in this industry is real and asymmetric, and anyone modelling it as settled is being careless.
Whether hyperscalers remain customers is the same category of question. The Microsoft and Meta contracts function today as accelerators of scale, cash flow, prepayment, collateral and utilisation, all of which are valuable. Assuming they stay captive through 2030 requires assuming those companies stop building internal capacity, which none of them has said. Our own view is that the largest customers today are best understood as financing partners now with the potential to become competitors later, and that the long-run platform has to diversify toward AI-native labs, enterprise and software economics.
Whether too many neoclouds emerge is a question about where value settles. Competition compresses the commodity hardware layer quickly and reliably. It compresses orchestration, managed inference, enterprise controls and open-model tooling far more slowly, if at all, which is the same argument the software section made from the other side.
And the blunt one, which every reader should sit with. Can Nebius execute operationally and still be a poor investment? Yes. That possibility is why this model runs the full capital waterfall instead of stopping at EBITDA, and the Bear case above is what it looks like.
The Bull Case, Held to the Same Standard
Symmetry is easy to claim and awkward to practise, since challenging optimism about a company you are constructive on feels like arguing against yourself. It is the more useful exercise, and two public bull models on Nebius are serious enough to engage with by name.
The first was published in June 2026 by the writer behind Misunderstood Multibaggers, a substack that publishes full transparent models instead of conclusions. Their 2030 case assumes 6.4 GW of active capacity, $14M of recurring revenue per megawatt, a 52% EBITDA margin, and exit multiples of 10x recurring revenue and 28x EBITDA, arriving at roughly $1.1T of market capitalisation and approximately $2,973 per share. The second comes from Jonah Lupton, an investor who publishes on X and through FirstWave, who after Q2 put Base 2030 revenue at $50B to $55B with 20% to 25% EBIT margins and a Bull case at $70B to $75B with 25% to 30%, later suggesting $1,500 or more was achievable and above $2,000 in an upside outcome, partly on blended pricing moving toward $20M per megawatt.
Neither is a pump. Both acknowledge execution and financing risk, and the capacity assumptions sit within range of a company targeting more than 1 GW of annual deployment. Our disagreements are specific.
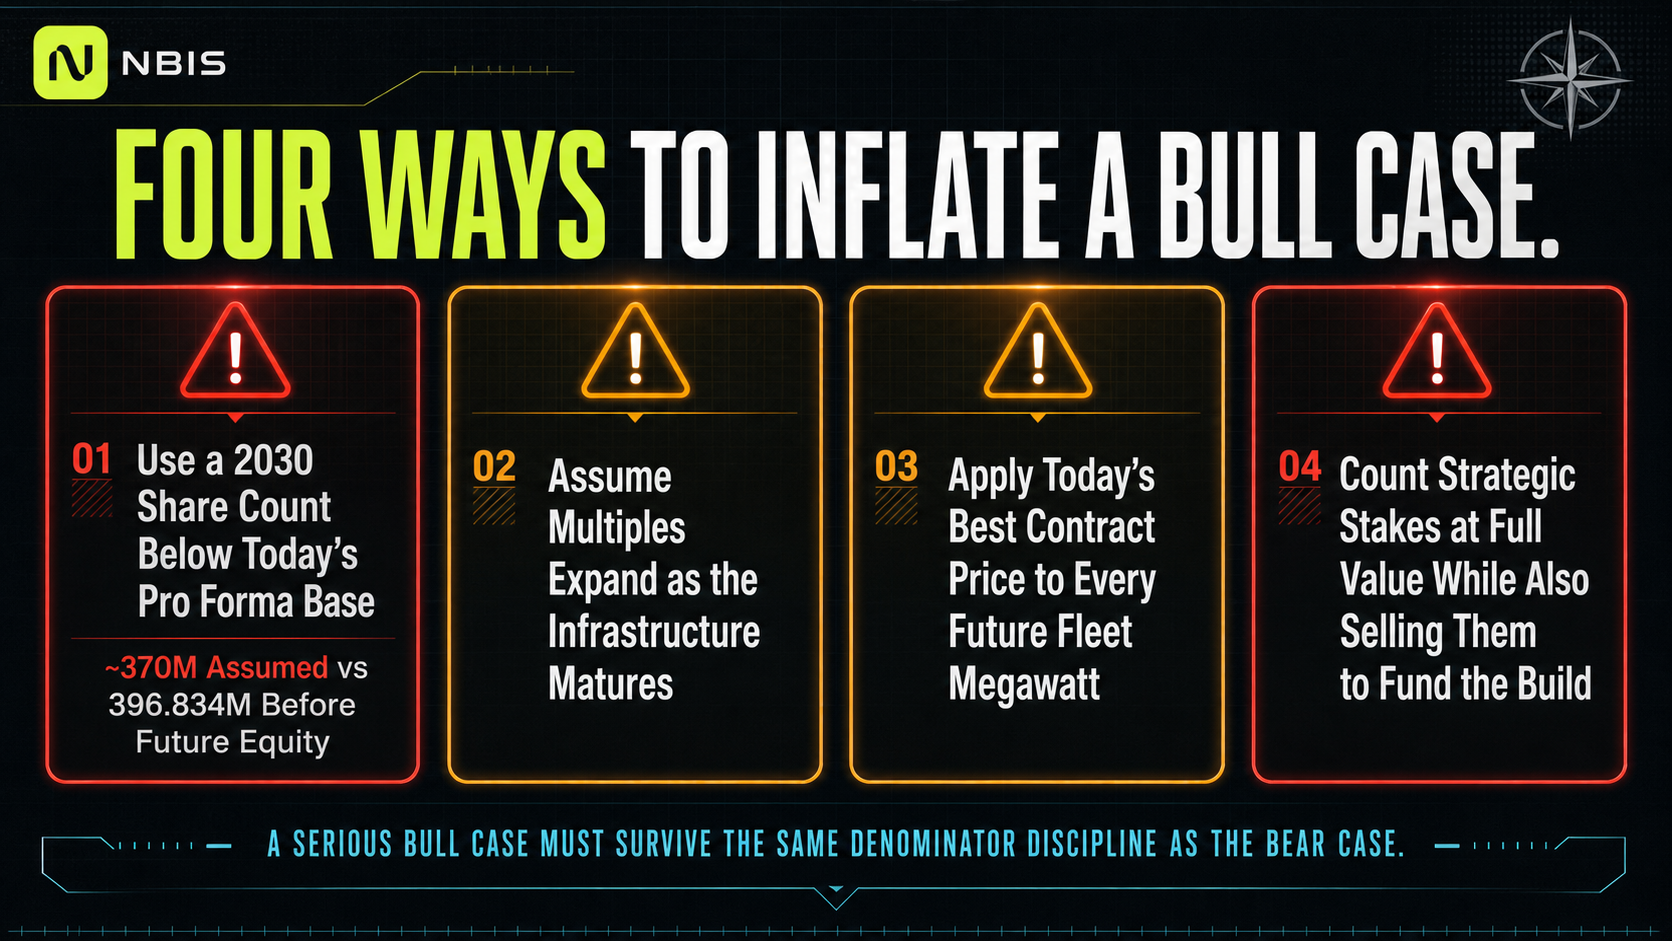
The first is a share count problem, and it is arithmetic instead of judgment. The Misunderstood Multibaggers model carries roughly 370M fully diluted shares in 2030. Our pro forma fully diluted base today, after the August convertible closing and before a single dollar of future equity, is approximately 396.834M. A 2030 count below the current base implies net share retirement across a period in which the company intends to deploy hundreds of billions of dollars. Every per-share output in that model is divided by a denominator we do not think is reachable.
The second is a multiple problem. Both cases assume 2030 multiples at or above what the market pays now, on the logic that maturity earns a rerating. Infrastructure-heavy businesses more commonly see multiples compress as growth normalises and the asset base ages. A rerating in the other direction requires the software and asset-light layer to grow large enough to change what kind of company is being valued, which is the outcome described earlier as the most credible path to our own model proving too conservative. It is a legitimate thesis. It is not something to assume while the disclosure that would support it does not yet exist.
The third is the mirror image of the bear shortcut this report has already dismantled. Applying today's best contract economics to every future megawatt assumes a 2030 fleet that looks like the marginal deal signed in 2026, when the cohort mechanics above show it cannot. We will not let bulls make an error we have refused to let bears make.
The fourth concerns capacity provenance, and the site schedule makes it concrete. Reaching a 6.4 GW active fleet in 2030 requires roughly 7.5 GW of connected capacity on our conversion factors. Our own named-site register accounts for 4,086 MW of that. The remaining 3,414 MW is unannounced, unentitled and in most cases unsited today. It may well arrive, and management has been explicit about targeting more than 1 GW of annual deployment. Modelling it as equivalent in certainty to a permitted campus with a signed interconnection agreement is a different claim entirely.
The fifth concerns the non-core stakes. ClickHouse, Avride, Toloka and TripleTen hold real value, and private marks are not cash. More to the point, our own funding waterfall reaches for those assets before it reaches for shareholders, and any proceeds reduce terminal sum-of-the-parts value dollar for dollar. Counting them at full value while also counting on them to help finance the build is double counting, and the Bear case is where that temptation bites hardest.
Which brings us to the challenge we would level at ourselves. We could be right about demand, right about pricing, right about the capacity ramp and right about technical execution, and still overestimate how much of the resulting enterprise value survives the trip through debt, leases, replacement capital and dilution to reach a common shareholder. That is the specific failure mode this model was rebuilt to detect, and it is why the equity conclusion comes after the capital work instead of before it.
What We Know and What We Do Not
The public half of this report has covered how the business works, what a megawatt costs, what it earns, who funds it, and what would have to go wrong. A ledger is the honest way to close it.
The following are increasingly established. Demand exists at scale and runs ahead of deployable capacity. Nebius can sign large customers across hyperscalers, AI-native labs and enterprise verticals. Midterm contract economics have rerated into the $20M to $25M per megawatt range, with short-duration scarcity capacity pricing well above that. Customer prepayments can fund a substantial share of associated capital expenditure, and contract-backed GPU financing exists at attractive spreads and appears repeatable. The AI Cloud operates at a very high adjusted EBITDA margin at current utilisation. Two-thirds of the Base 2030 capacity forecast maps to a named, dated facility. Older architectures retain commercial usefulness considerably longer than two-year obsolescence claims allow. Token Factory can integrate inference hardware that is not a GPU.
The following remain open, and none is close to settled. Whether marginal contract value above $20M per megawatt survives to mature fleet scale in 2030. What customer prepayments actually cost in commercial concession. Whether secured financing stays open across a multi-year cycle of $54B to $69B in annual deployment. Whether the 2,114 MW currently sitting in our undisclosed bucket materialises on schedule and at the costs we have assumed. Whether customer diversification keeps pace as hyperscalers internalise capacity. Whether Token Factory, Aether and asset-light revenue become a material high-margin moat or remain a useful attachment. Whether a seven-year economic compute life holds once power opportunity cost is observed across two or three architecture transitions. And whether, after every claim ahead of it has been paid, enough value reaches the common shareholder.
That last question is what this entire model was rebuilt to answer, and it is the only one that determines whether the stock works.
We have now given away the apparatus. The site schedule, the capacity states, the cohort engine, the build cost stack, the financing waterfall, the depreciation treatment, the replacement reserve, the dilution mechanics and every stress exercise have been laid out in the open, along with the assumptions we think are most likely to be wrong. What remains is the conversion of all of it into a number.
Behind the gate: Bear, Base and Bull values per share, built from five separate valuation methods and weighted instead of averaged. The probabilities we assign to each scenario and how we arrived at them. The probability-weighted 2030 value, what it is worth today at our required rate of return, and the expected return from the current share price. The per-share outcome of every stress exercise described above, including the two-year financing closure and the combined failure cases. And the Northwise rating, with the entry, trim and thesis-break thresholds that follow from it.
Members also receive the workbook itself. Not a summary and not a static table, but the full 38-tab model this report was written from, downloadable and fully editable. Every assumption is a blue cell, including the site-by-site energisation schedule underneath the entire capacity forecast. Disagree with our Pennsylvania ramp, our seven-year economic compute life, our build cost per megawatt, our contract mix, our probabilities or our exit multiples, change them, and the entire chain recalculates through to a value per share. This report has argued that most disagreements about Nebius are really disagreements about which number belongs in which denominator. The most useful thing we can hand you is the machine that keeps them straight.
Northwise Premium
Choose how to continue with Northwise
Join Northwise Premium
Unlock the rest of this report, its complete valuation, the downloadable model, portfolios, and action framework.
Join Northwise PremiumCreate a Free Account
Continue across Free Northwise research, follow companies, save reports, and receive updates.
Create a Free Account
Understanding Nebius: A Complete Guide to the Company
Understand Nebius from the ground up: its AI cloud, competitors, subsidiaries, funding, and growth opportunities. A complete NBIS guide with 14 illustrations.
Nebius in Europe: Sovereign AI, UK Expansion and Harlow
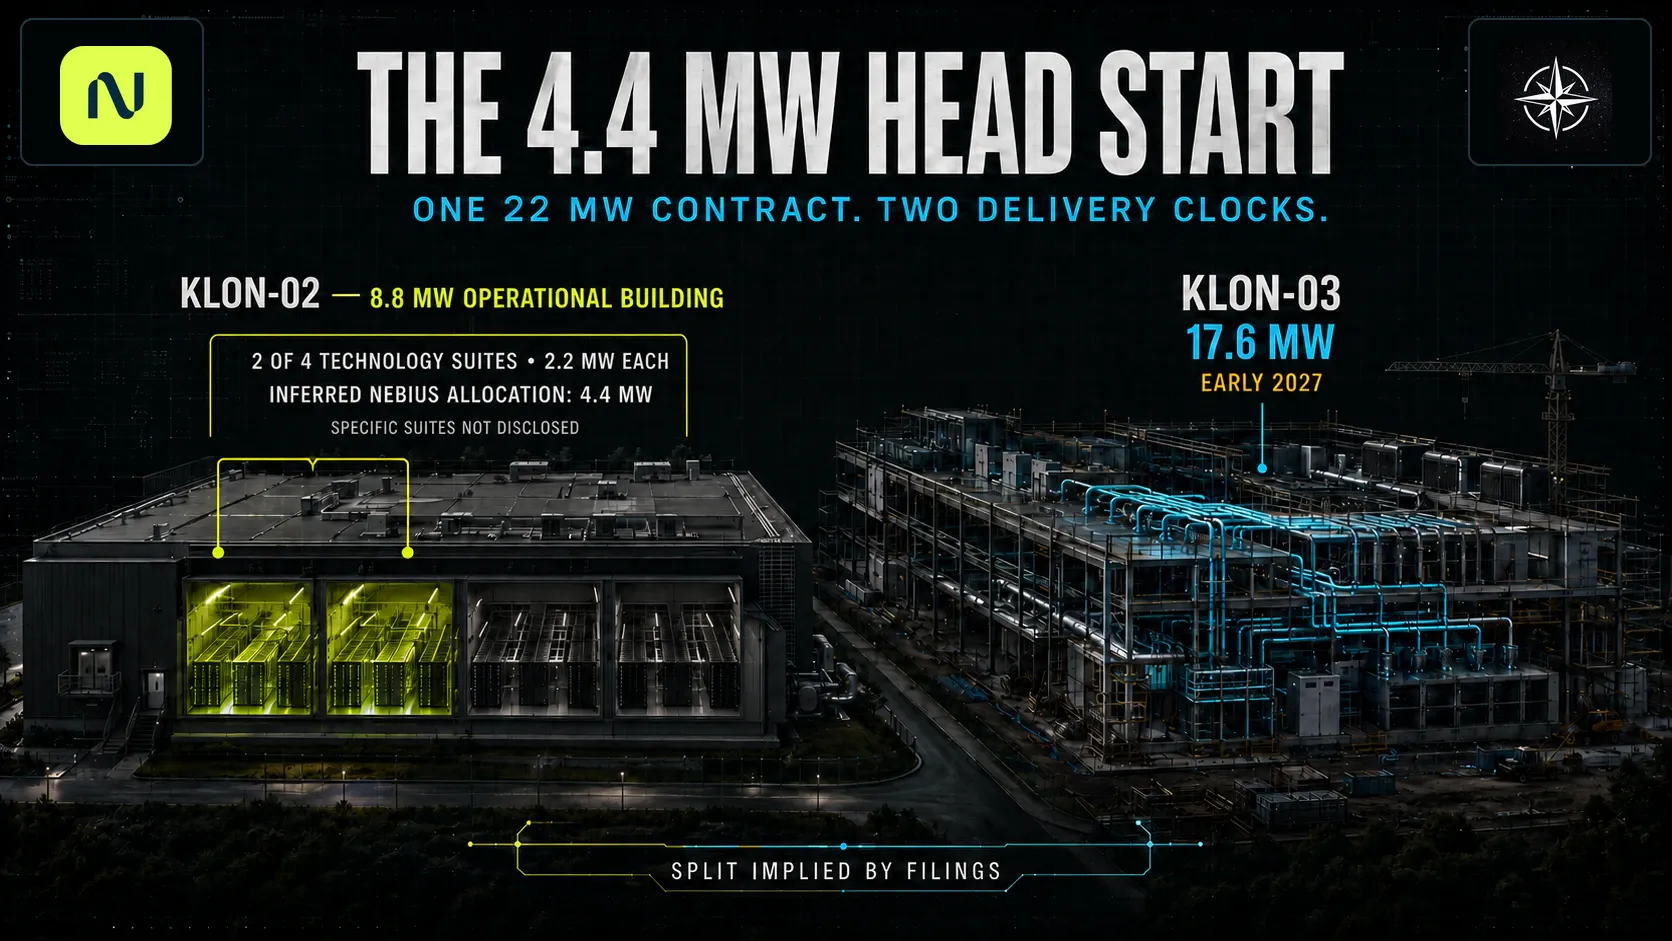
How European AI sovereignty supports Nebius’s UK expansion, where Harlow fits, and what its potential 4.4 MW deployment could add to Q3 revenue and 2026 ARR.
Nebius Pennsylvania: The Full Highridge Footprint Clears Zoning
Nebius has cleared the zoning gate for the full planned Highridge footprint. The back half is more credible, but final land, development, and grid approvals still separate 1.2 GW from reality.
Northwise Portfolios
See how the research becomes real decisions
Reader discussion
Discuss the research
Premium access is required to join this report's discussion.
Join Northwise Premium
No comments yet. Start a thoughtful discussion.