Nebius Stock Forecast
Nebius Stock Forecast analyzing MW ramp, ARR per MW, capex intensity, and bear, base, bull valuation outcomes through 2030.
In this article
Nebius Stock Forecast analyzing MW ramp, ARR per MW, capex intensity, and bear, base, bull valuation outcomes through 2030.
Executive Summary
Nebius Group enters 2026 in a structurally different position than it occupied twelve months ago. The company closed Q4 2025 with $228M in quarterly revenue, representing 547% year-over-year growth, and exited the year with an annualized run rate revenue of $1.2B. Core AI cloud revenue expanded 830% year-over-year and 63% sequentially, while adjusted EBITDA margin improved to 24%, up from 19% in Q3. Operating cash flow in Q4 reached $834M, and year-end cash totaled $3.7B.
Guidance for 2026 calls for $3B to $3.4B in revenue, approximately 40% adjusted EBITDA margin, and $16B to $20B in capital expenditures. The magnitude of that CapEx plan is the defining feature of the investment case. Nebius is not scaling cautiously. It is attempting to compress a multi-year infrastructure build into a narrow execution window while demand remains structurally supply constrained.
The central thesis of this report is that Nebius is not behaving like a traditional cloud provider. It is using hyperscaler contracts and long-term enterprise agreements as financing instruments to construct a large-scale, power-anchored AI infrastructure platform. The objective is not merely to rent GPUs. The objective is to control physical AI throughput at scale and then layer higher-margin cloud services, inference workloads, and enterprise implementation capabilities on top of that foundation.
At the end of 2025, Nebius had secured more than 2 gigawatts of contracted power and is targeting more than 3 gigawatts by the end of 2026. Management indicated that 800 megawatts to 1 gigawatt of capacity should be operational by year-end, with additional projects advancing into 2027. The company has announced nine new data centers globally and continues to expand its site portfolio to avoid concentration risk in any single geography or deployment schedule.
Demand indicators remain elevated. Management described AI start-ups ordering tens of thousands of GPUs and enterprise clients extending contract duration and increasing order size. The pipeline exceeds $4B, deal terms are lengthening, and premium workloads are expanding. At the same time, equipment shortages and deployment complexity remain real operational constraints. Nebius is attempting to manage those risks by diversifying sites, securing long-lead components in advance, and structuring contracts that support forward capacity commitments.
The investment debate is therefore not centered on whether AI demand exists. The binding constraint is throughput. Power availability, data center build cadence, hardware delivery, and capital structuring determine how quickly Nebius can convert contracted capacity into revenue and free cash flow.
This report proceeds in two stages. First, we provide a comprehensive analysis of Nebius’s global footprint, including quarter-by-quarter energization timelines across all major sites and a detailed examination of the infrastructure build. That section stands on its own and outlines the operational ramp required to reach approximately 2.6 gigawatts of connected power by the end of 2029.
Second, we transition into a full capital bridge, multi-scenario valuation framework, and probability-weighted outcome analysis. Our scenarios are driven by execution risk and capital structure decisions rather than demand collapse. The model assumes that supply chain slippage or deployment delays shift ARR capture to the right and increase the likelihood of opportunistic equity issuance. Conversely, disciplined execution supports higher valuation multiples and reduced dilution.
We are explicit about the limitations of this framework. The model assumes minimal monetization lag once power is connected. It assumes ARR per megawatt increases over time as density improves and the revenue mix shifts toward higher-value enterprise and inference workloads. In this framework, ARR refers to annualized revenue run-rate derived from connected and monetized megawatts, not contracted backlog or theoretical capacity.
It assumes capital markets remain accessible for secured and asset-backed financing. Each of these assumptions carries risk, and we dedicate an entire section to stress-testing them.
Nebius is attempting to move from infrastructure builder to vertically integrated AI platform. Hyperscaler contracts fund the physical backbone. Nebius Aether and its software stack provide the control layer. Strategic investments and subsidiaries offer optionality and financing flexibility. Physical AI initiatives extend the opportunity beyond pure cloud services into embodied intelligence and autonomous systems.
The valuation outcome will be determined less by quarterly revenue beats and more by the company’s ability to execute a synchronized expansion of power, capital, and platform services. If Nebius succeeds, the result is a durable AI utility with embedded software leverage. If it stumbles, the capital intensity amplifies downside.
The remainder of this report examines whether the current trajectory supports the former outcome.
Table of Contents
1. The Structural Thesis
1.1 NBIS Is Not a Traditional Cloud Provider
1.2 Throughput as the Binding Constraint
1.3 The Hyperscaler-Funded Infrastructure Loop
1.4 The Ultimate Goal: AI Cloud Higher in the Stack
2. Company Architecture and Strategic Position
2.1 Business Segments Overview
2.2 Nebius Aether and the Vertically Integrated Software Stack
2.3 Asset Portfolio and Subsidiary Optionality
2.4 Strategic Investments and Embedded Optionality
2.5 Why NBIS Is Structurally Different from Infrastructure Peers
3. Capital Stack and Infrastructure Strategy
3.1 Capital Hierarchy Framework
3.2 Asset-Backed Financing and Balance Sheet Flexibility
3.3 Equity as Optimization, Not Survival
3.4 Strategic Investments and Their Impact on Cost of Capital
3.5 Comparison to Equity-Heavy Infrastructure Models
4. Global Footprint and Energization Timeline
4.1 Methodology and Modeling Assumptions
4.2 Independence, Missouri
4.3 Vineland, New Jersey
4.4 Birmingham BHM01
4.5 Béthune, France
4.6 Beit Shemesh, Israel
4.7 Masmiyya, Israel
4.8 Mäntsälä, Finland
4.9 Modi’in, Israel
4.10 Minneapolis
4.11 Kansas City Colo
4.12 London Longcross
4.13 Keflavik, Iceland
4.14 Paris Saint-Denis
4.15 Modeled Additions Block
4.16 Year-End Connected MW Summary (2026–2029)
4.17 Operational Dependencies and Execution Requirements
5. Revenue Architecture and Mix Evolution
5.1 ARR per MW Framework
5.2 Density and Hardware Upgrade Path
5.3 Revenue Mix Transition (Hyperscaler to Enterprise)
5.4 Margin Expansion Pathway
6. Nebius Aether and Platform Verticalization
6.1 Aether as the Control Layer
6.2 Software Integration and Enterprise Stickiness
6.3 Moving Up the Stack: From Compute to Implementation
6.4 Long-Term Margin Implications
7. Physical AI Opportunity
7.1 What Physical AI Means in the NBIS Context
7.2 Infrastructure as the Foundation for Embodied Intelligence
7.3 Avride and Autonomous Systems
7.4 Optionality and Long-Duration Upside
8. Competitive Landscape and Strategic Positioning
8.1 Hyperscaler Relationship Dynamics
8.2 AI Cloud Peer Comparison
8.3 Platform Ambition vs Rental Compute Models
8.4 Strategic Optionality and Long-Term Differentiation
9. Execution Risks and Model Limitations
9.1 Monetization Lag Risk
9.2 ARR per MW Sensitivity
9.3 Capital Intensity and Refresh Burden
9.4 Supply Chain and Hardware Timing Risk
9.5 Multiple Compression Risk
9.6 What Would Invalidate the Thesis
10. Financial Model and Capital Bridge
10.1 CapEx Baseline (2026–2029)
10.2 Sources and Uses Framework
10.3 2026 Funding Reconciliation
10.4 2027 Strategic Decision Point
10.5 2028–2029 Capital Discipline
10.6 Equity Strategy and Dilution Framework
11. Scenario Architecture and Fair Value Outcomes
11.1 Bear Case (Execution Slippage)
11.2 Base Case (Disciplined Ramp)
11.3 Bull Case (On-Time Deployment and Margin Expansion)
11.4 Share Count and Dilution Impact
11.5 Probability Weighting
11.6 Weighted 2029 Price Target
11.7 Discounted Present Value Analysis (12%, 15%, 18%)
11.8 Interpretation of Asymmetry
12. Portfolio Allocation and Positioning
12.1 Current Allocation and Sizing Logic
12.2 Risk Management Framework
12.3 What Would Increase Allocation
12.4 What Would Reduce or Exit Allocation
13. Valuation Zones and Capital Allocation Playbook
13.1 Deep Value Accumulation Zone
13.2 Accumulation Zone
13.3 Fair Value Transition Zone
13.4 Trim Zone
13.5 Overextension / Full Exit Consideration Zone
13.6 Conditions That Override Price Zones
13.7 Long-Horizon Orientation
13.8 Portfolio Reality and Concentration Drift
14. Final Northwise Synthesis
14.1 What the Model Ultimately Proves
14.2 Why This Opportunity Exists
14.3 The Discipline Behind the Conviction
14.4 Closing Perspective
1. The Structural Nebius Thesis
1.1 NBIS Is Not a Traditional Cloud Provider
Nebius closed 2025 with $228M in Q4 revenue, representing 547% year-over-year growth, and exited December with a $1.2B annualized run rate. Core AI cloud revenue grew 830% year-over-year and 63% quarter-over-quarter. Adjusted EBITDA margin expanded to 24%, and operating cash flow in Q4 reached $834M. Cash on the balance sheet ended the year at $3.7B.
Those numbers describe a company scaling rapidly. They do not yet describe what the company is building.
Most cloud providers scale by adding customers to existing infrastructure. Nebius is scaling by expanding the physical substrate itself. Management has secured more than 2 gigawatts of contracted power and expects to exceed 3 gigawatts by the end of 2026. In capital terms, the company plans to deploy between $16B and $20B in 2026 alone. Revenue guidance of $3B to $3.4B sits alongside that capital plan.
This ratio between revenue and capital expenditure defines the business model. Nebius is compressing infrastructure buildout into a narrow window while AI demand remains supply constrained. The objective is to secure power, deploy high-density compute, and establish control over throughput before the market equilibrates.
In practical terms, Nebius resembles a utility constructing generation capacity during a demand surge. The near-term income statement matters, though the long-term asset base matters more. Power is the scarce input. Data center shells, liquid cooling systems, and GPU clusters form the conversion layer between electricity and intelligence. Revenue is the output of that conversion process.
The distinction becomes clearer when comparing operating metrics:
Metric | Q4 2025 |
|---|---|
Revenue | $228M |
YoY Growth | 547% |
Core AI Cloud Growth | 830% YoY |
Adj. EBITDA Margin | 24% |
Q4 Operating Cash Flow | $834M |
Year-End Cash | $3.7B |
2026 Revenue Guidance | $3B–$3.4B |
2026 CapEx Guidance | $16B–$20B |
The gap between $3.4B of projected revenue and $20B of capital deployment signals an expansion phase. Nebius is constructing an infrastructure backbone sized for demand several years forward.
Traditional cloud providers optimize utilization on existing capacity. Nebius is optimizing speed of capacity creation.
1.2 Throughput as the Binding Constraint
Management commentary reinforces the structural framing. The company described AI start-ups ordering tens of thousands of GPUs. Enterprise clients are expanding contract duration and increasing order size. The pipeline exceeds $4B. Deal terms are lengthening.
Demand has not been the gating variable. Throughput has.
Throughput is defined by several linked components:
- Power secured and energized
- Data center construction timelines
- Long-lead equipment delivery
- GPU availability and installation
- Network and cooling integration
Each stage forms a segment of a pipeline. When one segment slows, the entire system constricts. Nebius is addressing this constraint by diversifying its site portfolio and securing more than 2 gigawatts of contracted power, with visibility toward 3 gigawatts by year-end 2026. Management expects 800 megawatts to 1 gigawatt operational by year-end, with additional projects moving into 2027.
A useful analogy is to view Nebius as constructing a series of dams along a fast-moving river. The water represents AI demand. The dams represent energized megawatts. Revenue is generated only when the water flows through turbines installed inside those dams. The challenge is not the existence of water. The challenge is finishing construction quickly enough to capture it.
This framing shifts how valuation should be approached. Quarterly revenue growth tells part of the story. Energized megawatts tell the rest.
1.3 The Hyperscaler-Funded Infrastructure Loop
Nebius’s financing strategy is intertwined with its customer strategy. Management outlined a capital stack that prioritizes operating cash flow, existing cash, prepayments from long-term contracts, asset-backed financing, and corporate debt. Equity issuance is positioned as a strategic tool rather than a default funding mechanism.
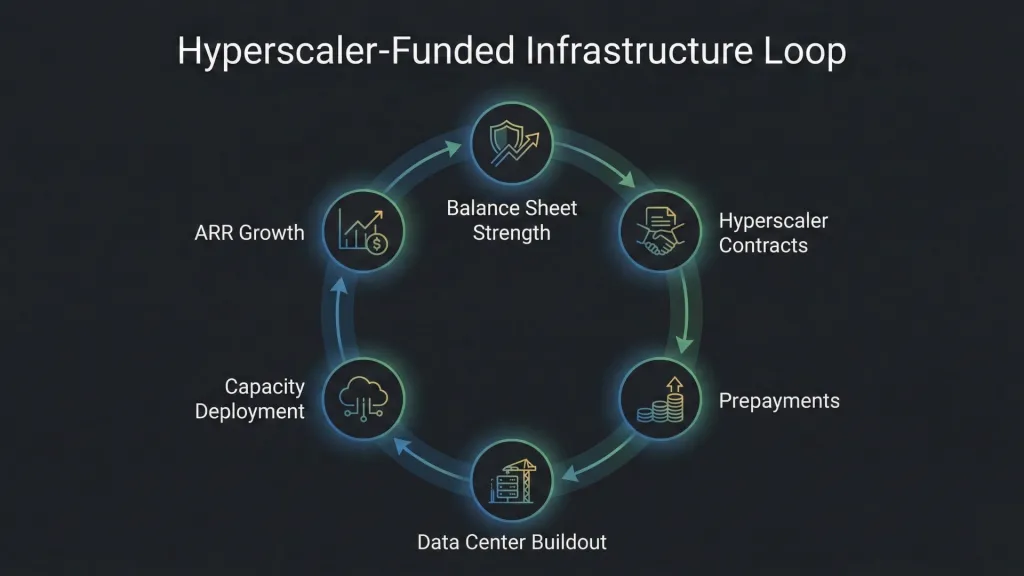
The loop operates as follows:
- Long-term hyperscaler and enterprise contracts
- Prepayments and predictable revenue streams
- Asset-backed and secured financing
- Construction of additional data centers
- Deployment of GPU clusters
- Expansion of available capacity
- Renewed long-term contracts at greater scale
Hyperscaler relationships therefore serve dual roles. They generate revenue and de-risk the capital structure. Contracted power commitments function as both demand signals and financing support.
During Q4, operating cash flow reached $834M, a function of hyperscaler prepayments. Adjusted EBITDA margins expanded to 24% and are guided toward approximately 40% in 2026. Margin expansion improves internal funding capacity precisely as capital intensity increases.
This loop creates a compounding dynamic. As more power is secured and energized, the company becomes a larger counterparty in negotiations with suppliers, lenders, and enterprise customers. Scale improves bargaining leverage, which supports margin progression and financing flexibility.
1.4 The Ultimate Goal: AI Cloud Higher in the Stack
Infrastructure alone does not capture the full opportunity. The long-term objective extends beyond GPU rental toward vertically integrated AI cloud services.
Core AI cloud revenue already grew 830% year-over-year in 2025. Enterprise clients are integrating AI into production workflows. Start-ups are evolving into durable businesses that require stable infrastructure partners. Average deal sizes are increasing, and contract duration is extending.
The revenue mix transition envisioned in the broader thesis relies on this progression. Hyperscaler contracts fund and stabilize the infrastructure layer. Enterprise and start-up clients represent the layer where higher-margin services, inference workloads, and implementation support reside.
One can think of the infrastructure layer as the steel skeleton of a skyscraper. It supports the structure and defines its height. The value of the building, however, is determined by what tenants do inside it. Nebius is erecting the skeleton first. The ambition is to own the interior spaces as well.
The strategic importance of Nebius Aether, its vertically integrated software stack, and its strategic investments will be explored in subsequent sections. They represent the control systems that sit atop the physical layer. Physical AI initiatives extend the opportunity into embodied intelligence and autonomous systems, broadening the surface area beyond pure cloud workloads.
The structural thesis rests on the coordination of these layers. Power, capital, software, and enterprise integration must advance together. When synchronized, they form a platform with durable throughput and expanding margins. When misaligned, capital intensity amplifies risk.
The remainder of this report examines whether the operational trajectory observed in 2025 supports a synchronized expansion into 2026 and beyond.
2. Company Architecture and Strategic Position
2.1 Business Segments Overview
Nebius operates as a layered system rather than a single product company. The infrastructure layer anchors the structure. The cloud layer monetizes it. The investment layer expands its optionality.
The infrastructure segment includes global data center deployments, secured power, GPU clusters, cooling systems, and network architecture. This layer determines how much compute capacity Nebius can physically bring online. The cadence of power energization ultimately governs revenue expansion.
Above that sits the AI cloud platform. This is where enterprise clients and AI-native start-ups deploy training and inference workloads. As contracts lengthen and deal sizes increase, this layer evolves from simple compute rental toward integrated AI services.
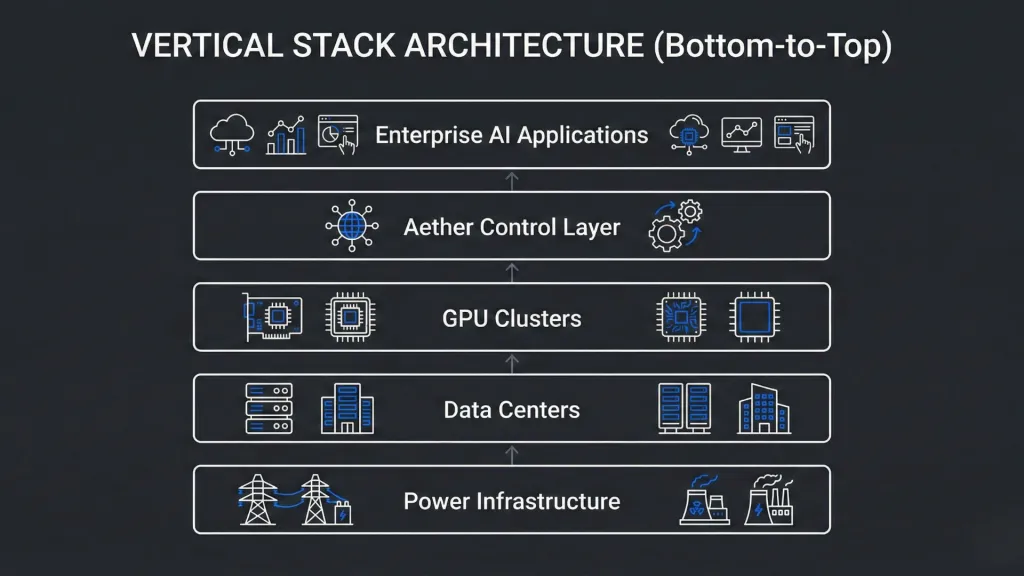
Beyond operating infrastructure, Nebius maintains strategic subsidiaries and investments. These assets serve both operational and financial roles. They extend reach into adjacent markets and influence capital flexibility.
The architecture resembles a three-tier system: physical capacity at the base, orchestration and service in the middle, and optionality at the top.
2.2 Nebius Aether and the Vertically Integrated Software Stack
As data center scale increases, software becomes the governing constraint.
Nebius Aether functions as the orchestration and control layer across its GPU fleet. It coordinates scheduling, resource allocation, workload distribution, and performance optimization. In smaller clusters, inefficiencies are tolerable. In gigawatt-scale deployments, minor inefficiencies compound.
Aether therefore plays two roles. Operationally, it maximizes utilization and reduces latency across clusters. Strategically, it embeds Nebius deeper into customer workflows.
When enterprise clients integrate through Nebius’s platform tooling and APIs, switching costs rise. Compute capacity becomes integrated into operating systems and product pipelines rather than serving as a temporary resource.
If the data centers are power plants, Aether is the dispatch center balancing load across regions and customers. As scale increases, that control layer determines margin quality and service differentiation.
2.3 Asset Portfolio and Subsidiary Optionality
Nebius’s strategic holdings extend its footprint beyond cloud infrastructure.
Avride connects the company to autonomous systems and robotics. ClickHouse intersects with data-intensive analytics and enterprise performance workloads. TripleTen operates within education and technical workforce development.
Each of these entities exists at a different point in the AI value chain. Their presence broadens Nebius’s strategic surface area.
From a structural standpoint, these assets contribute to optionality. They can operate as independent growth vectors. They can enhance ecosystem integration. They can also support structured financing arrangements.
In capital-intensive industries, optional liquidity sources and collateralizable assets reduce fragility. This flexibility influences how markets perceive risk and assign valuation multiples.
2.4 Strategic Investments and Embedded Optionality
The existence of strategic investments alters the capital conversation.
Infrastructure expansion requires scale and sustained funding. Companies dependent on single revenue streams often face tighter constraints when capital markets shift.
Nebius holds assets that diversify both operational exposure and financing options. This diversification strengthens negotiating leverage with lenders and counterparties. It reduces dependency on a single funding mechanism.
Strategic investments also expand long-term opportunity. Physical AI initiatives connect infrastructure to embodied intelligence. Analytical databases connect compute to enterprise data ecosystems. Education initiatives support adoption pathways and workforce expansion.
These elements create a platform with multiple extension points rather than a single narrow revenue channel.
2.5 Why NBIS Is Structurally Different from Infrastructure Peers
Infrastructure-only operators typically monetize utilization of leased compute capacity. Growth is driven by deployment speed and capital access.
Nebius pursues a broader ambition. It aims to control physical AI throughput, orchestrate that capacity through its own software stack, and capture higher-value workloads across enterprise and start-up ecosystems.
This distinction matters.
A pure infrastructure model behaves like a landlord leasing space. A vertically integrated platform behaves more like a utility building a grid and then layering services on top of it.
As scale increases, the advantages of integration compound. Software improves utilization. Strategic assets support financing. Enterprise services increase margins. Physical AI initiatives extend duration of opportunity.
The structural thesis rests on the coordination of these elements. Infrastructure provides the base. Aether provides control. Strategic investments provide flexibility. Together, they define a platform with broader ambition than a conventional cloud provider.
3. Capital Stack and Infrastructure Strategy
3.1 The Capital Hierarchy
Nebius has outlined a clear capital hierarchy. Expansion is financed first through operating cash flow and existing balance sheet cash, then through long-term contract prepayments, followed by asset-backed and corporate debt. Equity is positioned as a strategic lever rather than a default funding source.
This hierarchy reflects the nature of the buildout. Multi-gigawatt infrastructure requires front-loaded capital. At the same time, long-duration enterprise and hyperscaler agreements create forward visibility. The pairing of contracted demand with structured financing is the central mechanism that enables scale.
Operating cash flow provides the initial flywheel. Prepayments reduce upfront strain on the balance sheet. Secured facilities convert contracted revenue into financing capacity. Debt then bridges the remaining gap.
Equity enters the picture when valuation and market conditions support opportunistic issuance rather than necessity-driven dilution.
This structure transforms the CapEx plan from a blunt spending program into a coordinated capital deployment strategy.
3.2 Hyperscaler Contracts as Financing Instruments
Hyperscaler and enterprise contracts serve a dual function. They generate revenue and reduce funding uncertainty.
Long-term commitments support prepayments and structured financing. In capital-intensive infrastructure businesses, forward revenue visibility lowers perceived risk for lenders and partners. When demand is contracted before capacity is fully built, capital becomes cheaper and more accessible.
The relationship resembles project finance in energy markets. A utility secures long-term power purchase agreements before constructing generation assets. Those agreements anchor the financing stack.
Nebius applies a similar model to AI compute. Contracted megawatts provide the foundation upon which additional capacity is financed.
As contracted power increases toward the 3 gigawatt target, the financing base expands proportionally. The growth of the contract base and the growth of the capital stack move together.
3.3 Infrastructure Deployment as the Primary Constraint
The physical rollout of capacity remains the binding constraint.
Securing power rights is the first step. Building or converting facilities follows. High-density racks, liquid cooling systems, networking fabric, and GPU clusters must then be installed and integrated. Long-lead components introduce scheduling risk. Equipment shortages require diversification across sites.
Nebius has approached this by constructing a portfolio of geographically distributed projects. No single site defines the entire timeline. Diversification reduces exposure to localized delays.
In heavy industry terms, the company is operating multiple construction sites simultaneously while standardizing core engineering processes. The objective is to compress the time between power energization and revenue generation.
Throughput capacity therefore becomes the pacing variable. Revenue acceleration follows energization.
3.4 Managing Leverage and Optional Equity
Capital intensity introduces leverage risk. The rational response is balance sheet discipline.
Maintaining a cash floor provides resilience during high-CapEx years. Asset-backed facilities allow borrowing against infrastructure and strategic holdings. Corporate debt spreads risk across maturities.
Equity, when used opportunistically, strengthens rather than weakens the capital structure. Raising modest percentages of equity at favorable valuations can rebuild liquidity buffers, reduce reliance on debt, and lower interest burden over time.
Markets differentiate between defensive dilution and strategic capital optimization. In a high-growth infrastructure buildout, disciplined equity issuance can improve long-term multiple stability by reducing fragility.
The distinction lies in intent and timing.
3.5 Capital Structure as Competitive Advantage
Cost of capital influences expansion velocity.
Companies with lower perceived risk and diversified funding levers can move faster in land acquisition, equipment procurement, and long-term contracting. Access to secured and asset-backed facilities reduces dependence on volatile equity markets.
Strategic investments and subsidiaries expand financing flexibility. Collateralizable assets provide optional borrowing capacity. Potential monetization events create additional liquidity pathways.
When paired with contracted revenue visibility, this structure lowers funding uncertainty during expansion cycles.
In infrastructure markets, speed compounds. Earlier power connection enables earlier revenue. Earlier revenue strengthens cash flow. Stronger cash flow supports additional expansion.
The capital stack is therefore not an auxiliary consideration. It is a core component of execution.
The next section transitions from capital structure to the physical footprint itself, mapping Nebius’s global energization ramp and the operational backbone of the thesis.
4. Global Footprint and Energization Timeline
4.1 Methodology and Modeling Assumptions
The energization roadmap reflects connected and monetizable megawatts. Capacity is assumed to convert into revenue shortly after power is live and hardware is deployed. Utilization lag is treated as minimal within the modeling framework.
Sites are grouped into three categories:
- Existing and stabilized facilities
- Active ramp campuses with multi-year build curves
- Modeled additions required to bridge toward disclosed multi-gigawatt targets
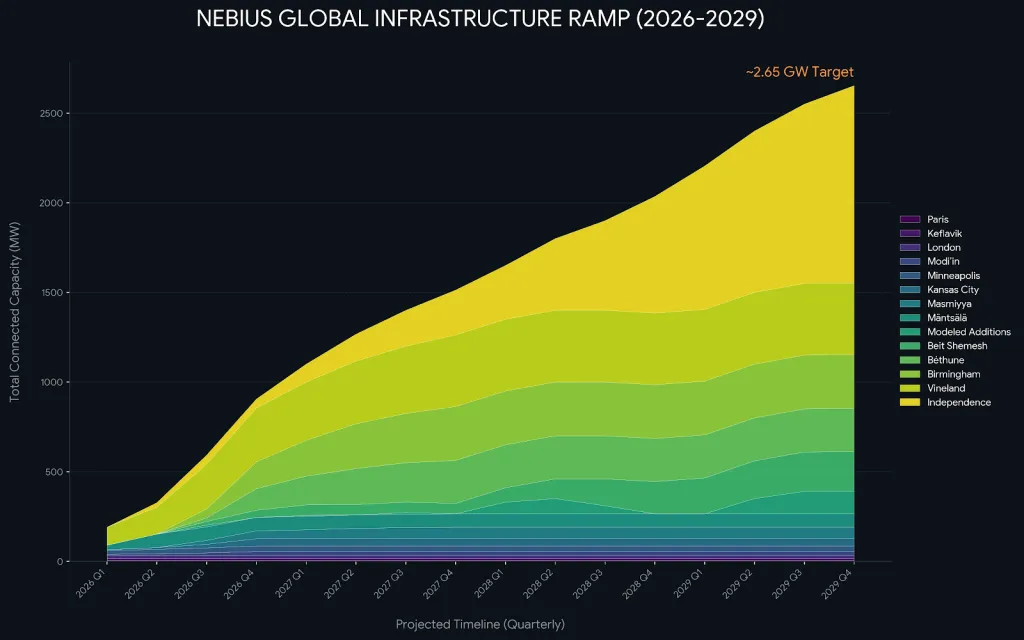
The objective of this section is operational clarity. Gigawatt targets are directional. Quarter-by-quarter energization defines execution reality. Revenue modeling in later sections is derived directly from this physical ramp.
4.2 Independence, Missouri
Independence functions as the long-duration anchor campus. Its ramp is back-end weighted, with acceleration concentrated in 2028 and 2029.
Quarter | Connected MW |
|---|---|
2026Q1 | 0 |
2026Q2 | 25 |
2026Q3 | 50 |
2026Q4 | 50 |
2027Q1 | 100 |
2027Q2 | 150 |
2027Q3 | 200 |
2027Q4 | 250 |
2028Q1 | 300 |
2028Q2 | 400 |
2028Q3 | 500 |
2028Q4 | 650 |
2029Q1 | 800 |
2029Q2 | 900 |
2029Q3 | 1000 |
2029Q4 | 1100 |
By 2029, Independence represents the largest single contributor to network throughput.
4.3 Vineland, New Jersey
Vineland provides early stabilized capacity before reaching design limits.
Quarter | Connected MW |
|---|---|
2026Q1 | 100 |
2026Q2 | 150 |
2026Q3 | 250 |
2026Q4 | 300 |
2027Q1 | 325 |
2027Q2 | 350 |
2027Q3 | 375 |
2027Q4 | 400 |
2028–2029 | 400 flat |
The site transitions from ramp to steady-state by late 2027.
4.4 Birmingham BHM01
Birmingham ramps aggressively through 2027 before stabilizing.
Quarter | Connected MW |
|---|---|
2026Q1 | 0 |
2026Q2 | 0 |
2026Q3 | 50 |
2026Q4 | 150 |
2027Q1 | 200 |
2027Q2 | 250 |
2027Q3 | 275 |
2027Q4 | 300 |
2028–2029 | 300 flat |
The early step function reflects modular campus deployment.
4.5 Béthune, France
Béthune anchors European diversification.
Quarter | Connected MW |
|---|---|
2026Q1 | 0 |
2026Q2 | 0 |
2026Q3 | 20 |
2026Q4 | 120 |
2027Q1 | 160 |
2027Q2 | 200 |
2027Q3 | 220 |
2027Q4 | 240 |
2028–2029 | 240 flat |
Ramp intensity moderates after 2027.
4.6 Beit Shemesh, Israel*
Beit Shemesh expands in two waves, with renewed acceleration beginning in 2028. Beit Shemesh numbers could very the most in this site by site breakdown. Full energization could push back into the early 2030s, this is accounted for and within the margin of error for our energization outlook.
Quarter | Connected MW |
|---|---|
2026Q1 | 0 |
2026Q2 | 0 |
2026Q3 | 20 |
2026Q4 | 40 |
2027Q1 | 58 |
2027Q2 | 58 |
2027Q3 | 58 |
2027Q4 | 58 |
2028Q1 | 80 |
2028Q2 | 110 |
2028Q3 | 150 |
2028Q4 | 180 |
2029Q1 | 200 |
2029Q2 | 210 |
2029Q3 | 220 |
2029Q4 | 222 |
4.7 Masmiyya, Israel
Masmiyya reaches steady-state capacity by late 2027.
Quarter | Connected MW |
|---|---|
2026Q1 | 0 |
2026Q2 | 0 |
2026Q3 | 22 |
2026Q4 | 44 |
2027Q1 | 50 |
2027Q2 | 58 |
2027Q3 | 62 |
2027Q4 | 64 |
2028–2029 | 64 flat |
4.8 Mäntsälä, Finland
Quarter | Connected MW |
|---|---|
2026Q1 | 25 |
2026Q2 | 75 |
2026Q3 | 75 |
2026Q4 | 75 |
2027–2029 | 75 flat |
Mäntsälä contributes stable European capacity.
4.9 Modi’in, Israel
Quarter | Connected MW |
|---|---|
2026Q1 | 8 |
2026Q2 | 12 |
2026Q3 | 16 |
2026Q4 | 24 |
2027–2029 | 24 flat |
4.10 Minneapolis
Quarter | Connected MW |
|---|---|
2026Q1 | 21 |
2026Q2 | 24 |
2026Q3 | 28 |
2026Q4 | 31 |
2027–2029 | 31 flat |
4.11 Kansas City Colocation
Quarter | Connected MW |
|---|---|
2026Q1 | 5 |
2026Q2 | 10 |
2026Q3 | 20 |
2026Q4 | 40 |
2027–2029 | 40 flat |
4.12 London Longcross
2026–2029: 16 MW flat
4.13 Keflavik, Iceland
2026–2029: 10 MW flat
4.14 Paris Saint-Denis
2026–2029: 5 MW flat
4.15 Modeled Additions Block
This block reconciles disclosed gigawatt targets with site-level visibility.
Quarter | Connected MW |
|---|---|
2026Q1 | 0 |
2026Q2 | 50 |
2026Q3 | 100 |
2026Q4 | 200 |
2027Q1 | 250 |
2027Q2 | 300 |
2027Q3 | 350 |
2027Q4 | 400 |
2028Q1 | 450 |
2028Q2 | 500 |
2028Q3 | 550 |
2028Q4 | 600 |
2029Q1 | 650 |
2029Q2 | 700 |
2029Q3 | 750 |
2029Q4 | 800 |
These additions represent the incremental campuses required to support contracted power expansion toward the multi-gigawatt objective. This block is built as a mix of known and unknown site expansions. Known locations include Oklahoma and secondary colocations in Paris and London, other MW is built from assumed expansions rumored in the US, as well as strategic locations such as Singapore. These sites are not confirmed. This section of energization also includes upside surprises from existing sites that end up with more MW online than publicly shared today.
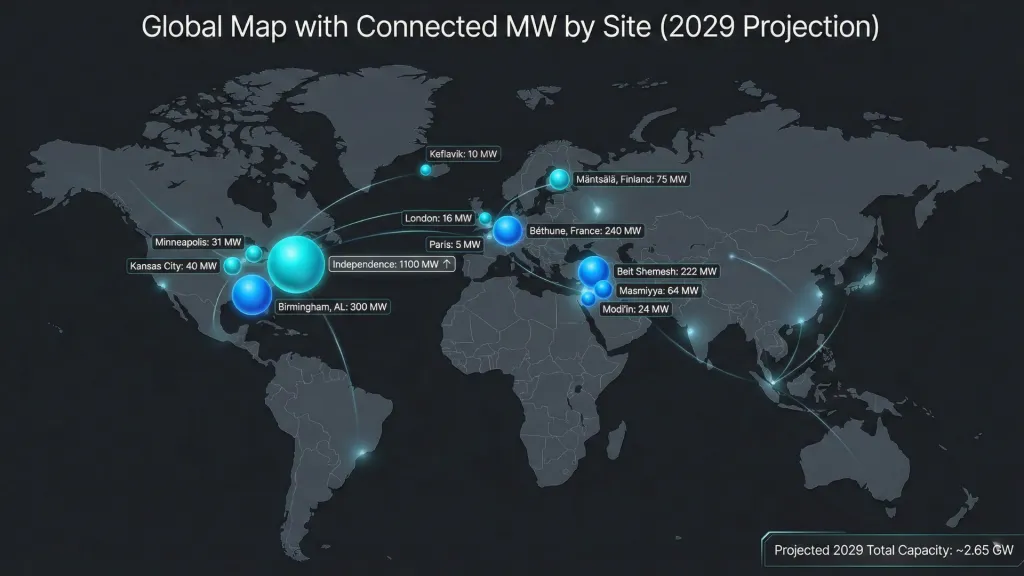
4.16 Year-End Connected MW Summary (2026–2029)
Year | Connected MW |
|---|---|
2026 | ~900 |
2027 | ~1500 |
2028 | ~2000 |
2029 | ~2650 |
Capacity nearly triples across the modeled period. The steepest acceleration occurs in 2028 and 2029.
4.17 Operational Dependencies and Execution Requirements
The ramp above depends on synchronized execution across multiple variables:
- Power interconnection approvals
- Data center construction timelines
- Long-lead equipment procurement
- GPU availability
- Cooling and networking integration
- Workforce scaling
Any delay shifts ARR, online monetized annual run rate, capture to the right. Supply chain friction or permitting bottlenecks alter timing and potentially capital structure decisions. The energization curve therefore functions as both an opportunity map and a risk map.
5. NBIS Revenue Architecture and Mix Evolution
The energization roadmap defines physical throughput. Revenue architecture defines economic throughput.
Megawatts alone do not determine value. Revenue per megawatt, customer mix, workload type, and margin structure determine how efficiently that physical capacity converts into durable cash flow.
The modeling framework assumes rising monetization intensity over time, driven by hardware density, software orchestration, and a gradual shift in customer mix.
5.1 ARR per MW Framework
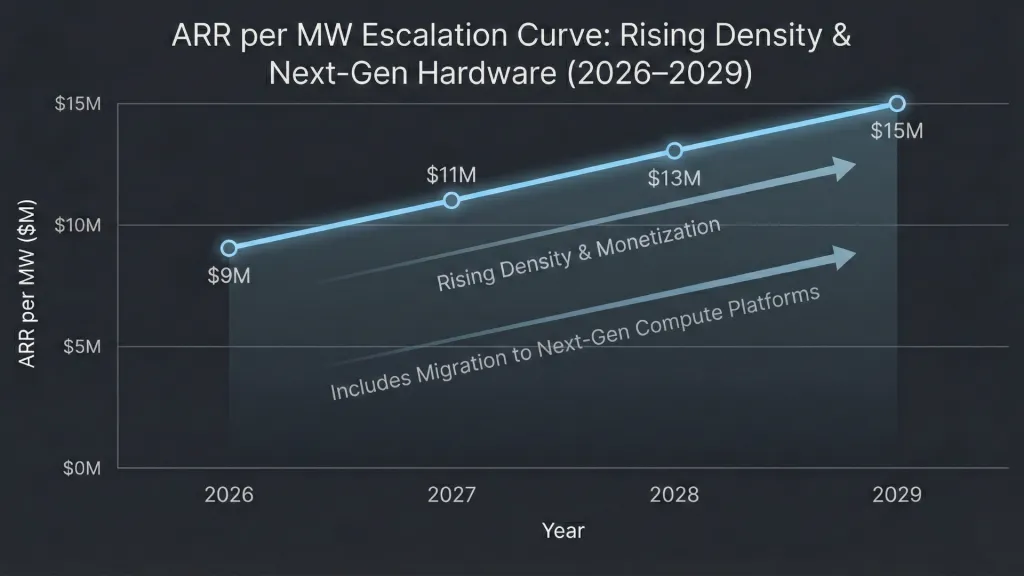
The model applies an increasing ARR per megawatt profile across the forecast horizon. These are locked assumptions derived from density improvements, product layering, new generation chip deployments, and revenue mix evolution.
Year | ARR per MW (Midpoint) | Range |
|---|---|---|
2026 | $9M | $8M–$10M |
2027 | $11M | $10M–$12M |
2028 | $13M | $12M–$14M |
2029 | $15M | $14M–$16M |
The progression reflects three structural forces:
- Higher compute density per rack
- Improved power utilization effectiveness and cooling efficiency
- Greater enterprise and inference workload contribution
The key concept is monetization intensity. A megawatt in 2029 represents more revenue-generating throughput than a megawatt in 2026.
As GPU architectures evolve and liquid cooling infrastructure scales, watt-to-compute conversion improves. Revenue per unit of physical power therefore increases without requiring proportional increases in footprint.
This framework assumes the company continues climbing the value stack rather than operating as a fixed-price infrastructure landlord.
5.2 Density and Hardware Upgrade Path
Hardware evolution drives monetization intensity.
New GPU generations increase performance per watt. Higher density rack configurations allow more compute output within the same power envelope. Liquid cooling systems enable sustained high-performance operation without thermal constraints.
As clusters transition toward more advanced architectures, revenue per installed megawatt rises. The upgrade cycle therefore functions as a revenue accelerator rather than merely a maintenance requirement.
The relationship resembles upgrading turbines in a power plant. The physical dam remains the same, though the efficiency of energy conversion improves.
The model incorporates this effect through rising ARR per megawatt rather than assuming static monetization.
Refresh cycles are capital intensive, though they extend asset life and preserve competitive positioning. Later sections address refresh CapEx explicitly. From a revenue perspective, refresh supports sustained pricing power and workload competitiveness.
5.3 Revenue Mix Transition (Hyperscaler to Enterprise)
The revenue mix evolves gradually across the forecast horizon.
Year | Hyperscaler | Cloud / Enterprise |
|---|---|---|
2026 | 85% | 15% |
2027 | 80% | 20% |
2028 | 72% | 28% |
2029 | 65% | 35% |
Hyperscaler relationships anchor early scale. Long-duration contracts provide revenue visibility and financing support during the most capital-intensive phase of expansion.
Over time, enterprise and AI-native clients represent a larger portion of incremental revenue. These customers typically demand integration support, orchestration, and inference optimization. They also tend to carry higher effective monetization per unit of compute.
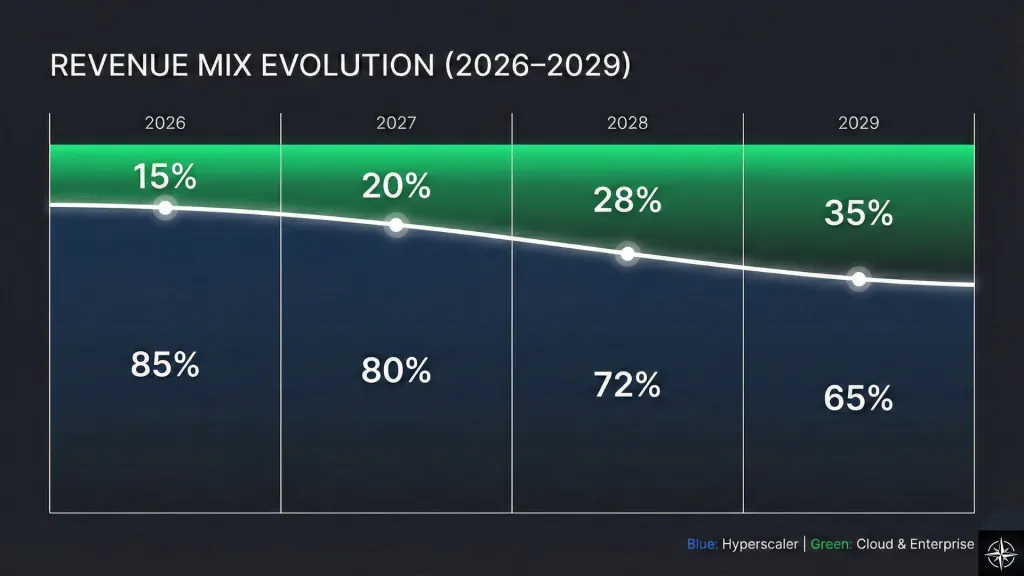
The transition is measured rather than abrupt. Hyperscalers remain significant through 2029. The shift reflects incremental layering rather than replacement.
This mix evolution influences both valuation and margin quality. Infrastructure-heavy revenue streams are durable though priced competitively. Enterprise-layer services introduce higher value capture.
As the enterprise layer expands, Nebius’s profile begins to resemble a vertically integrated AI platform rather than a pure compute wholesaler.
5.4 Margin Expansion Pathway
Margin expansion follows three coordinated drivers:
- Scale effects across fixed infrastructure
- Improved hardware efficiency
- Mix shift toward enterprise and inference workloads
Adjusted EBITDA margin guidance for 2026 is approximately 40%, up materially from the 24% achieved in Q4 2025. Early margin expansion reflects pricing discipline, utilization, and operating leverage.
Longer term, incremental margin improvement depends on maintaining utilization rates while increasing monetization intensity per megawatt.
Infrastructure carries high fixed costs and relatively lower marginal costs once deployed. As capacity scales toward the 2.6 gigawatt level by 2029, fixed cost absorption improves. Software orchestration enhances cluster efficiency. Enterprise workloads increase average revenue per unit of compute.
The pathway resembles operating leverage in heavy industry. Once the production base is established, incremental output carries higher contribution margins.
Margin durability depends on two conditions:
- Sustained demand for high-performance AI workloads
- Continued differentiation through orchestration and integration capabilities
If density improvements materialize and the mix shift progresses as modeled, economic throughput rises faster than physical throughput.
The next section transitions to physical AI and platform extension opportunities, expanding the addressable market beyond core cloud workloads.
6. Nebius Aether and Platform Verticalization
Physical infrastructure determines how much compute exists. Software determines how well it is used.
Nebius Aether represents the coordination layer that binds hardware, networking, and customer workloads into a unified operating environment. As the megawatt base expands toward multi-gigawatt scale, orchestration becomes as economically important as energization.
6.1 Aether as the Control Layer
Aether functions as the control plane across Nebius’s distributed GPU fleet. It governs:
- Resource scheduling
- Workload allocation
- Cluster balancing
- Monitoring and performance optimization
- Multi-site coordination
At small scale, orchestration inefficiencies remain tolerable. At gigawatt scale, small percentage differences in utilization translate into meaningful economic variance.
When thousands of GPUs operate across multiple campuses, the system behaves less like a server rack and more like a power grid. Load must be balanced. Bottlenecks must be minimized. Idle capacity must be redeployed quickly.
Aether is the dispatch center in that grid. It determines how effectively physical power converts into billable throughput.
The long-term value of the infrastructure build depends on this conversion efficiency.
6.2 Software Integration and Enterprise Stickiness
As enterprise clients integrate AI into production workflows, compute becomes embedded inside business processes rather than treated as a temporary training resource.
Aether and associated platform tooling increase switching friction by:
- Integrating APIs and deployment pipelines
- Supporting distributed inference workloads
- Enabling monitoring and performance tuning
- Coordinating multi-region scaling
When infrastructure is deeply integrated into product stacks, the relationship shifts from transactional to embedded.
Embedded infrastructure carries longer contract duration and higher retention stability. As enterprise adoption expands, platform integration becomes a strategic moat.
Infrastructure alone is replaceable. Integrated workflow infrastructure is materially harder to displace.
6.3 Moving Up the Stack: From Compute to Implementation
The infrastructure layer captures training demand. The implementation layer captures long-duration inference and workflow integration.
As enterprise clients mature their AI strategies, demand shifts from experimentation toward deployment. That transition increases demand for:
- Managed inference environments
- Optimization services
- Workflow automation
- Data integration
- Performance engineering
Compute remains foundational. Implementation captures higher economic value.
The megawatt ramp in Section 4 supports the physical base. The revenue mix shift in Section 5 reflects increasing enterprise penetration. Aether enables that transition by providing the programmable layer required for production-grade deployment.
This progression resembles the evolution of cloud markets more broadly. Early infrastructure providers captured hosting demand. Integrated platforms later captured software and service layers with higher margins and stickier relationships.
Nebius is attempting to compress that evolution into a shorter timeframe.
6.4 Long-Term Margin Implications
Platform verticalization influences margin through several mechanisms:
- Higher average revenue per workload
- Improved utilization efficiency
- Greater customer retention
- Reduced pricing sensitivity
- Service-layer monetization
Infrastructure economics benefit from scale. Platform economics benefit from integration.
As enterprise mix increases from 15% in 2026 toward 35% by 2029 under the modeled trajectory, revenue quality improves alongside revenue quantity.
Margin expansion therefore depends on both physical density and software leverage.
Physical scale creates operating leverage. Platform integration creates economic leverage.
If Aether successfully coordinates a multi-gigawatt fleet while embedding Nebius deeper into enterprise workflows, margin durability strengthens materially beyond what infrastructure-only models typically achieve.
Next we move into Section 7: Physical AI and Embodied Intelligence, where we examine how Nebius’s infrastructure base intersects with robotics, autonomy, and real-world AI deployment.
7. Physical AI Opportunity
The infrastructure thesis explains how Nebius can scale compute. The physical AI thesis explains why that compute may become even more valuable over time.
Large language models and foundation models operate in digital environments. Embodied systems operate in the physical world. Robotics, autonomous vehicles, warehouse automation, industrial AI, and edge inference require continuous training, simulation, and real-time inference loops.
Physical AI expands the demand surface beyond cloud-native software companies into logistics, manufacturing, transportation, defense, and consumer robotics.
Nebius’s infrastructure footprint intersects with this shift at the power layer.
7.1 What Physical AI Means in the NBIS Context
Physical AI refers to AI systems that interact with the real world through sensors, actuators, and autonomous decision-making.
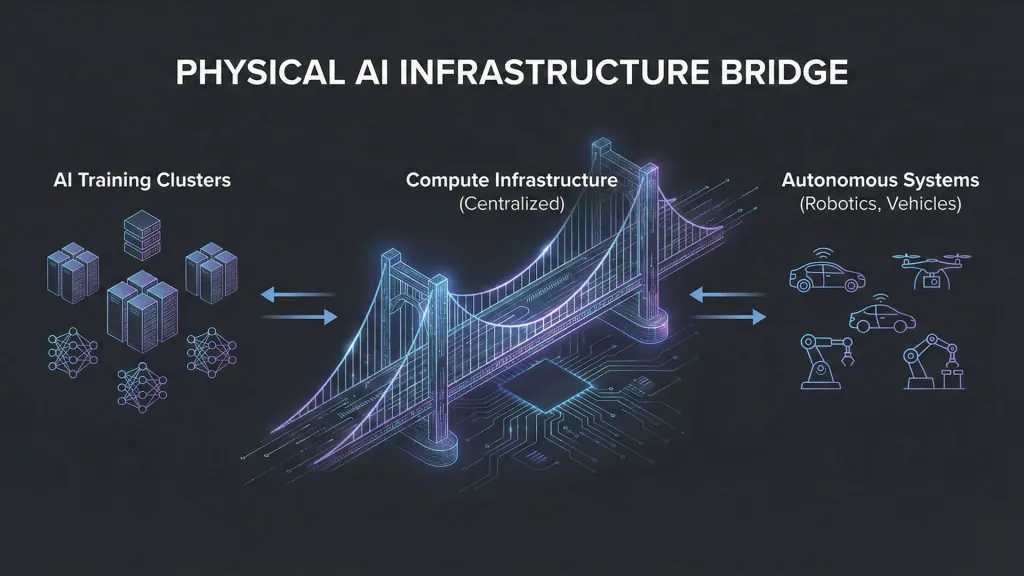
In the Nebius context, this includes:
- Robotics training and simulation
- Autonomous vehicle perception models
- Edge-to-cloud inference pipelines
- Real-time reinforcement learning systems
- Industrial automation AI
These systems require massive simulation training before real-world deployment. Simulation workloads often demand high-performance GPU clusters. As embodied systems scale, training and retraining cycles intensify.
Physical AI therefore drives both centralized training demand and distributed inference demand.
For Nebius, this represents an expansion of compute intensity per customer rather than simply an expansion of customer count.
7.2 Infrastructure as the Foundation for Embodied Intelligence
Embodied AI increases sensitivity to latency, reliability, and throughput.
Training large perception models requires dense GPU clusters. Simulation environments replicate real-world conditions at scale. Reinforcement learning loops require repeated iteration cycles.
The multi-gigawatt ramp described earlier creates the throughput base required to support these workloads.
Physical AI systems resemble aircraft flight simulators running continuously at scale. They demand sustained high-density compute environments rather than sporadic cloud bursts.
The distributed campus model also supports geographic redundancy. Autonomous systems operating globally benefit from multi-region compute availability and coordinated orchestration.
Infrastructure therefore becomes a strategic enabler of embodied intelligence.
7.3 Avride and Autonomous Systems
Avride provides Nebius with direct exposure to autonomous mobility and robotics ecosystems.
Autonomous vehicle systems require:
- Large-scale simulation environments
- Perception model training
- Continuous retraining based on real-world data
- High-throughput data ingestion and processing
The infrastructure layer supports these compute requirements. The platform layer enables orchestration. The strategic relationship between infrastructure and autonomous systems reduces customer acquisition friction and strengthens ecosystem integration.
While Avride operates independently in many respects, its existence aligns Nebius with physical AI demand cycles.
This alignment matters in two ways.
First, it increases exposure to long-duration training workloads tied to autonomy. Second, it broadens the company’s narrative beyond cloud infrastructure into real-world AI deployment.
The combination strengthens strategic positioning within AI’s next phase.
7.4 Optionality and Long-Duration Upside
Physical AI introduces long-duration optionality.
Robotics, autonomous vehicles, warehouse automation, and industrial AI remain early in adoption curves. As deployment scales, compute demand may compound.
This creates a scenario where infrastructure built for current cloud training demand also supports emerging embodied intelligence applications.
Optionality emerges through:
- Expanded workload intensity per enterprise client
- Long-term retraining cycles
- Edge-to-cloud integration models
- Hardware-software feedback loops
Infrastructure deployed today may serve markets that mature later.
The physical AI opportunity does not need to materialize immediately to influence valuation. It extends the duration of demand for high-density compute and increases the potential economic life of the infrastructure base.
The next section examines Nebius’s strategic investments more broadly and how they alter both valuation framing and capital flexibility.
8. Competitive Landscape and Strategic Positioning
Nebius operates inside one of the most capital-intensive and strategically contested segments of the technology stack. Its competitive positioning spans three overlapping arenas:
- Global hyperscalers building internal AI capacity
- Neo-cloud GPU infrastructure providers
- Emerging AI platform-layer companies
The strategic outcome depends on how Nebius navigates all three simultaneously.
8.1 Hyperscaler Relationship Dynamics
Hyperscalers such as Microsoft, Amazon, Google, and Meta represent both collaborators and competitive reference points.
Microsoft and Amazon control vast capital bases and global data center networks. Google operates one of the most sophisticated internal AI infrastructures in the world. Meta continues to expand internal training clusters aggressively.
These companies possess the balance sheet capacity to deploy hundreds of billions annually. They can vertically integrate hardware procurement, networking, software tooling, and customer distribution.
Nebius does not compete with them at the ecosystem level.
Instead, it competes at the margin where time-to-capacity matters.
In an environment where GPU supply remains constrained and deployment velocity determines strategic advantage, hyperscalers benefit from incremental external capacity. Nebius provides high-density AI infrastructure without requiring hyperscalers to fully internalize every megawatt.
This creates a dynamic where hyperscalers can be:
- Anchor customers
- Contract counterparties
- Strategic collaborators
Over longer horizons, bargaining power depends on differentiation beyond raw capacity. If Nebius remains purely a capacity provider, pricing pressure increases as hyperscalers expand internal builds. If Nebius deepens orchestration and enterprise integration, it occupies a less commoditized layer.
The revenue mix transition from 85% hyperscaler in 2026 toward 65% by 2029 under the modeled assumptions reflects this strategic balancing act. Diversification reduces single-category dependency while preserving large-scale contracted anchors.
8.2 AI Cloud Peer Comparison: The Neo-Cloud Cohort
Within the neo-cloud segment, Nebius competes most directly with companies such as:
- CoreWeave (CRWV)
- Cipher Mining (CIFR)
- Iris Energy (IREN)
CoreWeave has positioned itself as a high-growth AI compute provider with significant hyperscaler exposure and rapid cluster deployment. Its model relies heavily on GPU acquisition, equity issuances, debt, long-term contracts, and equity markets access.
Cipher Mining and Iris Energy began in crypto mining infrastructure and pivoted toward AI data center capacity. Their expertise lies in power procurement and high-density infrastructure operations.
These companies share common characteristics:
- High capital intensity
- Rapid hardware scaling
- Significant reliance on external financing
- Revenue sensitivity to utilization and pricing
Nebius differs in two structural respects.
First, it is attempting deeper platform integration through Nebius Aether. That control layer aims to coordinate distributed GPU fleets rather than merely lease them.
Second, Nebius maintains strategic subsidiaries and investments that introduce optionality and financing flexibility not typically present in pure infrastructure operators.
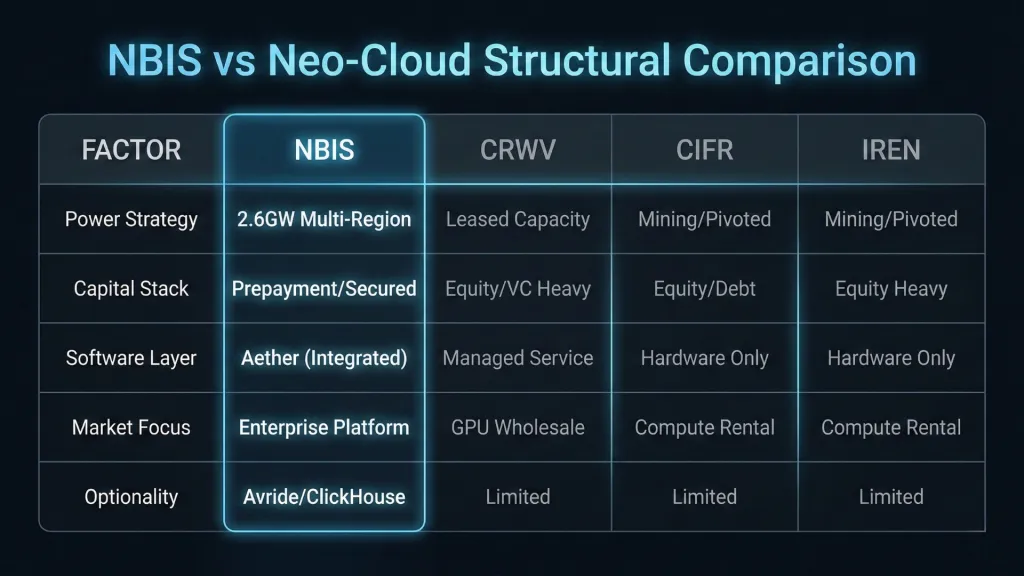
The competitive variable here is cost of capital and execution discipline. In capital-heavy environments, even small differences in funding costs influence expansion speed and resilience.
8.3 Platform Ambition vs Rental Compute Models
Rental compute models scale through hardware velocity and utilization optimization. Their economics are tightly linked to refresh cycles and hardware pricing spreads.
Platform ambition introduces an additional layer.
Nebius is pursuing:
- Control over physical AI throughput
- Vertical orchestration through Aether
- Gradual shift toward enterprise and inference workloads
- Integration into long-duration AI deployment pipelines
The distinction becomes visible as enterprise mix rises from 15% in 2026 toward 35% by 2029 in the modeled framework.
Enterprise workloads often involve integration support, workflow coordination, and inference deployment. These layers generate higher monetization intensity per megawatt compared to wholesale training contracts alone.
In this sense, the competitive divide is less about rack density and more about stack depth.
Infrastructure scale grants entry. Platform depth determines durability.
8.4 Strategic Optionality and Long-Term Differentiation
Nebius’s differentiation also stems from its broader asset base.
Strategic holdings such as Avride, ClickHouse, and TripleTen extend exposure into autonomous systems, analytics infrastructure, and talent ecosystems. These assets influence both revenue opportunity and capital flexibility.
Compared with neo-cloud peers whose balance sheets are largely tied to data center assets alone, Nebius carries:
- Collateralizable strategic assets
- Potential monetization pathways
- Broader ecosystem integration
This optionality reduces fragility during high-CapEx years and expands long-term narrative surface area.
The competitive landscape is therefore multi-dimensional.
Against hyperscalers, Nebius competes on deployment speed and contracted flexibility.
Against neo-cloud operators such as CRWV, CIFR, and IREN, it competes on capital discipline, orchestration depth, and stack integration.
Against platform-layer AI providers, it competes on embedding compute into enterprise workflows.
The company sits between infrastructure and platform. If it executes on the vertical integration pathway while maintaining funding resilience, it occupies a differentiated middle ground rather than a commoditized edge.
The next section examines strategic investments and subsidiary value in greater detail, focusing on how they influence valuation framing and long-duration capital resilience.
9. Execution Risks and Model Limitations
The thesis rests on synchronized execution across power acquisition, hardware deployment, capital structuring, and platform integration. The model provides structure. It does not remove uncertainty.
This section addresses the primary risks embedded within the framework and clarifies the conditions under which the thesis would weaken materially.
9.1 Monetization Lag Risk
The energization roadmap assumes minimal lag between connected power and revenue contribution. That assumption is directionally supported by contracted demand visibility and management commentary around pipeline strength.
However, infrastructure businesses rarely convert physical capacity into full economic throughput immediately. Commissioning delays, customer onboarding cycles, hardware integration testing, and utilization ramp can introduce timing gaps.
If monetization lags extend meaningfully, ARR capture shifts to the right. The long-term opportunity may remain intact, though discounted present value declines. Capital structure decisions could also shift if cash inflows arrive later than anticipated.
The model reflects execution risk through scenario factors. It does not explicitly model prolonged multi-quarter monetization gaps at scale.
9.2 ARR per MW Sensitivity
Revenue per megawatt is the single most influential economic variable in the model.
The locked assumptions progress from:
- $9M per MW in 2026
- $11M per MW in 2027
- $13M per MW in 2028
- $15M per MW in 2029
Small deviations compound rapidly when applied across multi-gigawatt capacity.
ARR per megawatt depends on:
- Hardware density and chip improvements
- Pricing discipline
- Enterprise mix expansion
- Utilization stability
If pricing compresses or density gains underperform expectations, monetization intensity declines. Because the model scales toward approximately 2.65 gigawatts by 2029, even a $1M variance in ARR per MW materially impacts total ARR.
This sensitivity amplifies both upside and downside outcomes.
9.3 Capital Intensity and Refresh Burden
The capital baseline reflects heavy deployment:
- 2026 CapEx: $18B
- 2027 CapEx: ~$16.4B
- 2028 CapEx: ~$15.0B
- 2029 CapEx: ~$19.6B
These figures incorporate incremental megawatt build and refresh cycles.
Refresh burden increases as installed base expands. Higher-density hardware requires periodic upgrades to remain competitive. As clusters scale into the gigawatt range, refresh CapEx becomes a structural feature rather than a cyclical event.
Capital discipline becomes critical. Excessive leverage or mistimed equity issuance increases fragility. Insufficient refresh spending reduces performance competitiveness.
The balance between expansion and refresh determines capital efficiency over time.
9.4 Supply Chain and Hardware Timing Risk
The ramp assumes coordinated hardware availability and deployment.
GPU supply, networking equipment, liquid cooling components, and power infrastructure represent long-lead inputs. Global semiconductor supply constraints, export controls, or vendor delays can disrupt timelines.
Management has indicated that major long-lead items are contracted and diversified across sites. Even so, scale increases operational complexity.
A single delayed campus may not derail the entire ramp. Multiple concurrent delays could meaningfully compress ARR capture timelines and increase funding pressure.
Execution risk intensifies as the buildout accelerates into 2028 and 2029.
9.5 Multiple Compression Risk
The valuation framework applies scenario-dependent multiples reflecting perceived execution quality and growth durability.
Multiple compression can occur for several reasons:
- Broader market repricing of capital-intensive growth assets
- AI demand normalization
- Increased competitive supply
- Reclassification of the company as infrastructure-heavy rather than platform-oriented
Even if ARR targets are achieved, market perception of growth durability influences valuation.
The thesis assumes that execution discipline and revenue mix evolution support sustained valuation credibility. If the market assigns lower multiples to AI infrastructure platforms at scale, upside compresses regardless of operational performance.
9.6 What Would Invalidate the Thesis
The thesis weakens materially under the following conditions:
- Sustained demand contraction in AI training and inference markets
- Inability to secure or energize contracted power at projected cadence
- Structural decline in ARR per megawatt due to pricing pressure
- Capital market inaccessibility that forces distressed equity issuance
- Failure to expand enterprise mix beyond hyperscaler concentration
The model assumes AI demand remains structurally strong, throughput remains the primary constraint, and Nebius continues to access diversified capital sources.
If demand deteriorates while supply expands, pricing compresses and utilization falls. Under those circumstances, the infrastructure build becomes a burden rather than a flywheel.
Execution discipline, capital flexibility, and monetization intensity are therefore the core pillars of the thesis.
The next section transitions into strategic investments and valuation framing.
10. Financial Model and Capital Bridge
The infrastructure roadmap implies sustained, elevated capital deployment. This section bridges the physical ramp to funding mechanics.
The model incorporates disclosed guidance, management commentary, and structured assumptions where data is not explicitly provided.
Where estimates are introduced, they are labeled as such.
10.1 CapEx Baseline (2026–2029)
Management stated:
“We plan to invest in CapEx in the range of $16 billion to $20 billion in 2026. We already have about 60% of the capital needed for this range from our balance sheet, existing operations and commitments.”
The model anchors 2026 at the midpoint of that range.
2026 CapEx: $18B
For 2027–2029, no formal guidance exists. We estimate forward CapEx based on:
- Incremental megawatt additions
- $24M per incremental MW build cost
- Rising refresh burden as installed base expands
Year | Incremental MW | Build @ $24M/MW | Refresh | Total CapEx |
|---|---|---|---|---|
2026 | Ramp year | — | — | $18B |
2027 | +600 MW | $14.4B | $2.0B | $16.4B |
2028 | +500 MW | $12.0B | $3.0B | $15.0B |
2029 | +650 MW | $15.6B | $4.0B | $19.6B |
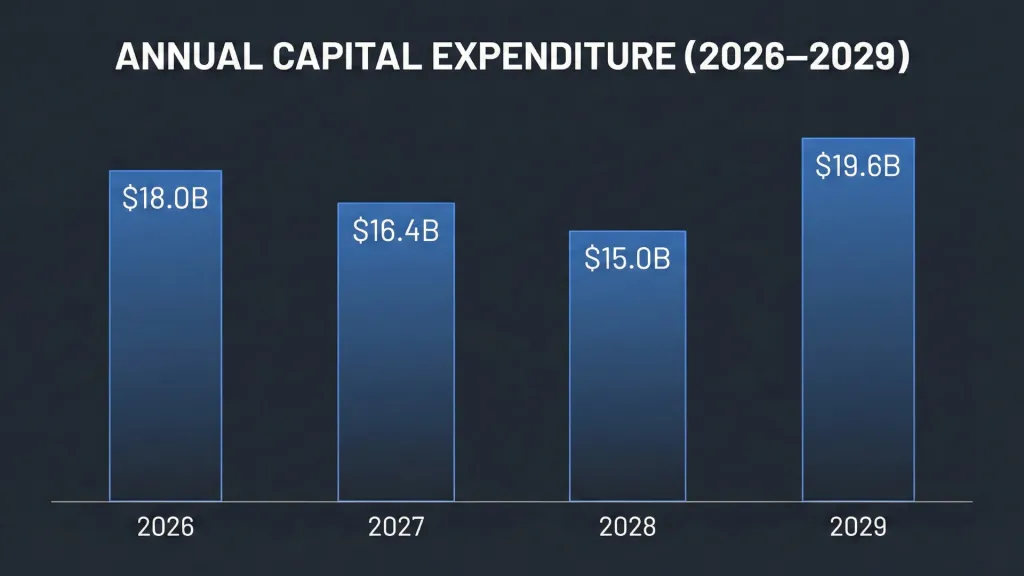
Important:
- The $24M/MW figure is a modeling assumption.
- Refresh amounts are estimated based on installed base growth.
- Post-2026 CapEx figures are projections, not company guidance.
The framework is internally consistent with the megawatt ramp in Section 4.
10.2 Funding and Financing Sources and Uses Framework
Management outlined a capital hierarchy:
- Balance sheet cash
- Operating cash flow
- Commitments and prepayments
- Secured / asset-backed financing
- Corporate debt
Equity issuance was not positioned as primary funding.
The statement that approximately 60% of 2026 CapEx is already covered is critical.
If 2026 CapEx midpoint is $18B, 60% implies:
~$10.8B covered via:
- Existing cash
- Operating cash flow
- Commitments and structured financing
The model estimates how the remaining gap is bridged.
Where specific figures are not disclosed, we use conservative assumptions consistent with current ARR trajectory and operating leverage.
10.3 2026 Funding Reconciliation
Known inputs:
- Beginning cash: $3.7B
- 2026 CapEx baseline: $18B
Modeled estimates:
- Operating cash flow: ~$2.5B
- Prepayments and commitments: ~$6B
- Asset Backed financing: ~$7.7B
Total modeled sources: ~$18.2B
Modeled ending cash: ~$1.9B
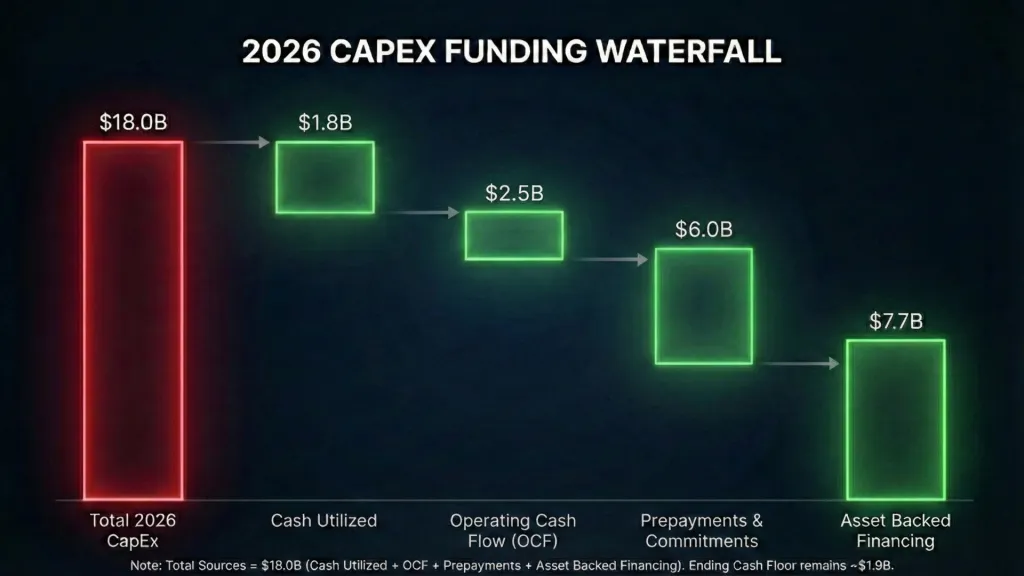
Key clarification:
The $6B prepayment and $7.7B secured financing figures are estimates constructed to reconcile to management’s 60% coverage statement and funding hierarchy. The company has not disclosed exact allocations.
Under these assumptions:
- No equity is required in 2026
- Cash floor remains above ~$1.5B
- Funding aligns with stated capital hierarchy
If operating cash flow exceeds estimates or prepayments are larger, cushion improves. If either underperforms, equity becomes more likely.
10.4 2027 Strategic Decision Point
2027 CapEx baseline: ~$16.4B (modeled)
Estimated funding components:
- Beginning cash: ~$1.9B
- Operating cash flow: ~$4B (modeled growth assumption)
- Prepayments: ~$4B (estimated)
- Secured financing: ~$6B (estimated continuation)
Modeled sources: ~$15.9B
Shortfall before cash usage: ~$0.5B
Ending cash trends toward ~$1.3–$1.5B absent equity.
Important:
- 2027 CapEx is fully modeled, not guided.
- OCF growth assumes ARR scaling per Section 5.
- Prepayments and debt remain estimates.
This is the first structural inflection point.
If execution is strong and valuation supportive, issuing $2B–$3B of equity:
- Rebuilds liquidity
- Reduces debt reliance
- Improves credit profile
- Potentially supports multiple expansion
If execution lags or valuation compresses, dilution could occur under less favorable pricing.
This is where execution risk feeds directly into capital structure risk.
10.5 2028–2029 Capital Discipline
2028 modeled inputs:
- CapEx: ~$15.0B
- Operating cash flow: ~$6B (modeled)
- Prepayments: ~$3B (estimated decline)
- Secured financing: ~$5B
Coverage improves if prior equity replenished liquidity.
2029 reintroduces intensity:
- CapEx: ~$19.6B
- Operating cash flow: ~$8–9B (modeled based on ARR ramp)
- Prepayments: ~$2B
- Debt capacity remains, though leverage discipline tightens
Again, these figures are projections derived from the megawatt ramp and ARR assumptions. They are not guided figures.
The model assumes capital markets remain functional and asset-backed facilities remain accessible.
If that assumption fails, funding strategy changes materially.
10.6 Equity Strategy and Dilution Framework
Starting shares: 253,016,971
Modeled dilution outcomes reflect execution variance:
Bear Case
- Equity raised: ~$5B
- ~40M new shares
- ~293M total shares
Base Case
- Equity raised: ~$3B
- ~20M new shares
- ~273M total shares
Bull Case
- Equity raised: ~$2B
- ~12M new shares
- ~265M total shares
These dilution estimates are derived from:
- Modeled funding gaps
- Assumed market valuation at issuance
- Execution timing risk
They are scenario-driven, not predetermined.
The capital bridge rests on several assumptions:
- ARR scales per Section 5
- Operating cash flow expands materially
- Prepayments remain robust
- Secured financing remains available
- Capital markets remain open
If these conditions hold, equity remains optional and strategic. If they weaken simultaneously, dilution increases and valuation multiple likely compresses.
The next section moves into the fully modeled valuation outcomes, translating:
- 2,650 connected MW by 2029
- $15M ARR per MW midpoint
- Revenue mix shift to 65/35
- Scenario-based dilution
into enterprise value and per-share price targets.
This is where operational assumptions convert into explicit upside and downside ranges.
11. Scenario Architecture and Fair Value Outcomes
The megawatt ramp, ARR per MW framework, capital bridge, and dilution structure converge in this section.
All three scenarios assume structural AI demand remains durable. The variable is execution quality and capital efficiency.
The terminal year is 2029. This year was specifically chosen as the farthest out energization scheduling remains publicly visible. Beyond this, too much speculation on sites, energy availability, and strategy are required to infer valuation.
Locked inputs entering the scenarios:
- YE 2029 connected MW: ~2,650
- 2029 ARR per MW range: $14M–$16M
- Starting shares: 253,016,971
- Dilution modeled per execution risk
- Multiples reflect perceived execution quality
This is where the physical ramp converts into equity value.
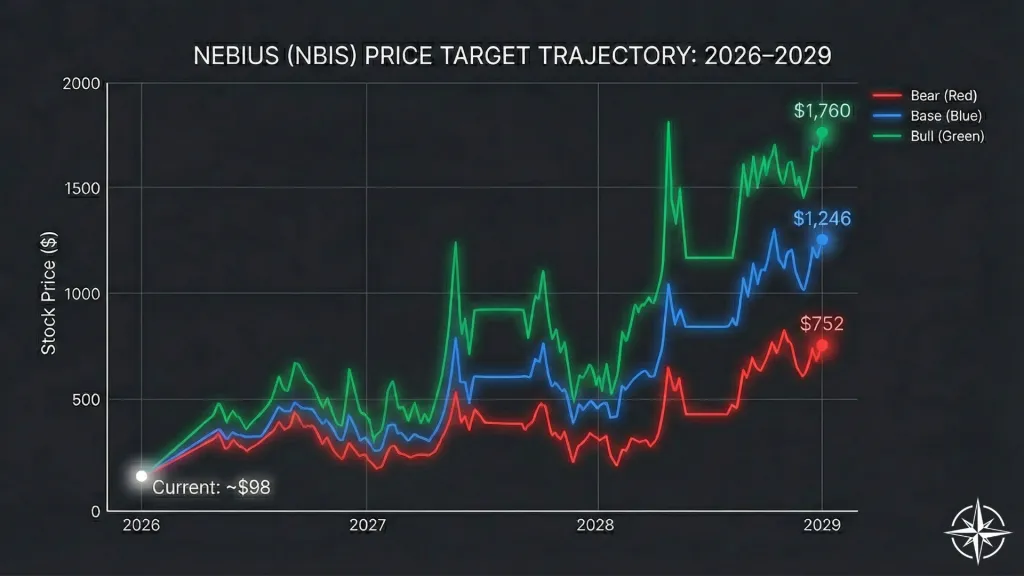
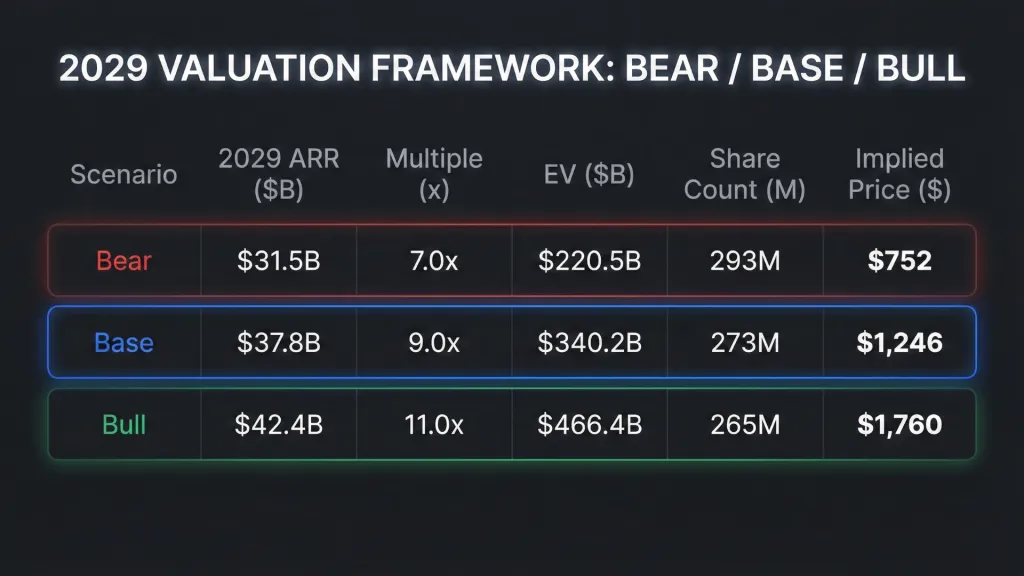
11.1 Bear Case (Execution Slippage)
Assumptions:
- Execution factor: 0.85
- Realized MW capture reflects slippage and timing delays
- ARR per MW: $14M
- Equity raised: ~$5B
- New shares: ~40M
- Annual Recurring Revenue multiple: 7×
Realized ARR:
~$31.5B
Market Cap:
$31.5B × 7 = ~$220.5B
Share count:
~293M
Implied Price:
~$752 per share
This scenario assumes:
- Monetization lag emerges
- Prepayments arrive slower
- Debt usage increases
- Market assigns lower multiple due to perceived execution risk
Even under stressed execution, the scale of installed capacity still generates meaningful equity value.
11.2 Base Case (Disciplined Ramp)
Assumptions:
- Execution factor: 0.95
- ARR per MW: $15M
- Equity raised: ~$3B
- New shares: ~20M
- Annual Recurring Revenue Run Rate: 9×
Realized ARR:
~$37.8B
Market Cap:
$37.8B × 9 = ~$340.2B
Share count:
~273M
Implied Price:
~$1,246 per share
This case assumes:
- Minor ramp friction
- Controlled capital structure
- Revenue mix evolves toward 65% hyperscaler / 35% enterprise by 2029
- Market recognizes infrastructure-to-platform transition
This reflects disciplined execution rather than perfection.
11.3 Bull Case (On-Time Deployment and Margin Expansion)
Assumptions:
- Execution factor: 1.00
- ARR per MW: $16M
- Equity raised: ~$2B
- New shares: ~12M
- Annual Recurring Revenue Multiple: 11×
Realized ARR:
~$42.4B
Market Cap:
$42.4B × 11 = ~$466.4B
Share count:
~265M
Implied Price:
~$1,760 per share
This scenario assumes:
- On-time energization
- High monetization intensity
- Strong enterprise mix capture
- Capital raises occur at favorable valuation
- Market assigns premium multiple to vertically integrated AI cloud platform
The upside is driven by both scale and margin quality.
11.4 Share Count and Dilution Impact
Starting shares: 253,016,971
Scenario outcomes:
- Bear: ~293M shares
- Base: ~273M shares
- Bull: ~265M shares
Dilution ranges from ~5% to ~16% cumulative.
The share count impact is material but not thesis-destroying. The megawatt and ARR ramp dominate value creation. Dilution influences magnitude, not direction.
The capital strategy shifts equity from existential funding to optimization tool.
11.5 Probability Weighting
Assigned probabilities:
- Bear: 25%
- Base: 50%
- Bull: 25%
These weights reflect:
- Infrastructure execution complexity
- Capital market variability
- Strong but not infinite AI demand confidence
The base case carries the highest probability under current visibility.
11.6 Weighted 2029 Price Target
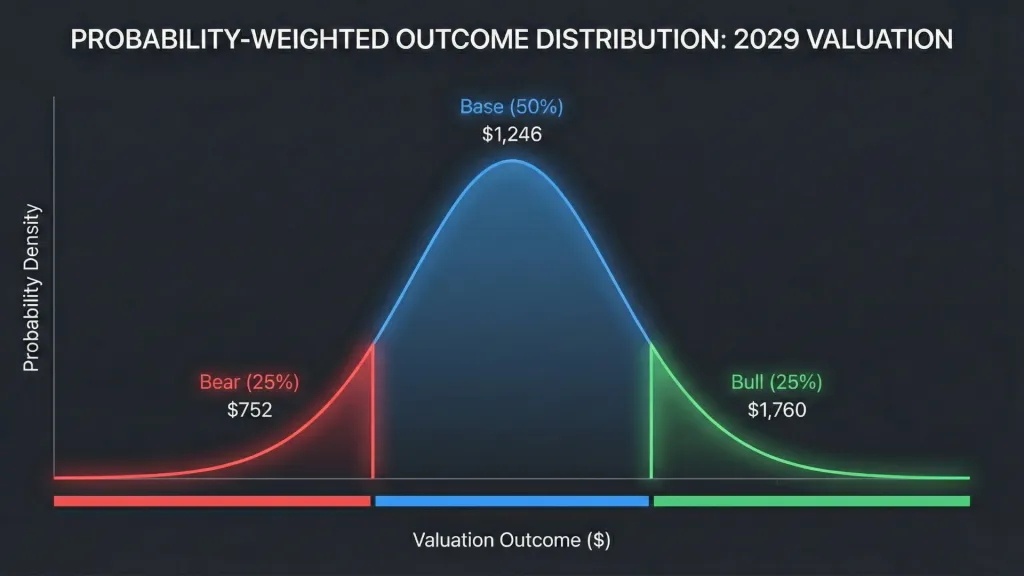
Weighted Price Target:
≈ $1,250 per share
Current price:
~$98
Implied multiple on current price to weighted 2029 outcome:
~12.75×
This is the central modeled outcome, not the optimistic ceiling.
11.7 Discounted Present Value Analysis
We discount the weighted 2029 outcome over 4 years.
At 12% discount rate:
Present Value ≈ $794
At 15% discount rate:
Present Value ≈ $715
At 18% discount rate:
Present Value ≈ $644
Even at 18%, present value remains substantially above the current ~$98 price.
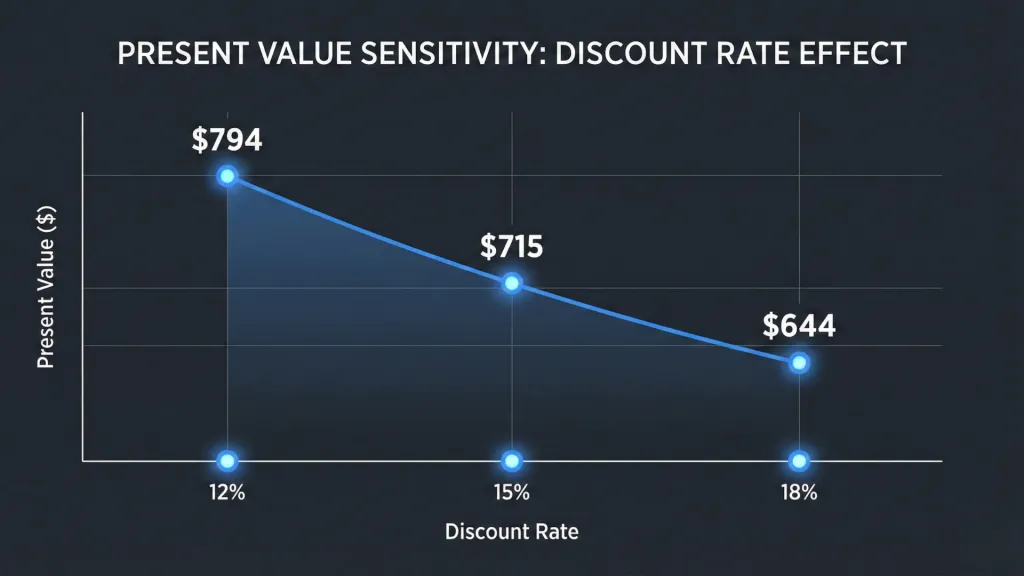
Discounting incorporates execution uncertainty and capital risk.
11.8 Interpretation of Asymmetry and Valuation Disconnection from Reality
A weighted 2029 outcome of approximately $1,250 per share versus a current price near $98 implies an extraordinary disconnect.
Even discounting the weighted scenario at 15%, the present value framework yields roughly $715. At 18%, roughly $644.
The gap between ~$98 and a $644–$794 discounted range requires explanation.
This divergence stems from classification error and macro compression.
Macro AI Pressure
The broader AI infrastructure sector has experienced volatility driven by:
- Cyclicality concerns in GPU procurement
- Hyperscaler capex normalization fears
- Inventory digestion narratives
- Financing stress among capital-intensive operators
Public markets are pricing AI infrastructure as cyclical hardware exposure rather than structural throughput scarcity.
When NVIDIA corrects, the sector compresses.
When hyperscaler commentary softens, GPU demand narratives wobble.
When capital markets tighten, high CapEx names re-rate lower.
NBIS trades within this gravity field.
The market is applying a blended discount to:
- Capital intensity
- Execution complexity
- AI enthusiasm normalization
That discount compresses multiples before scale economics are fully visible.
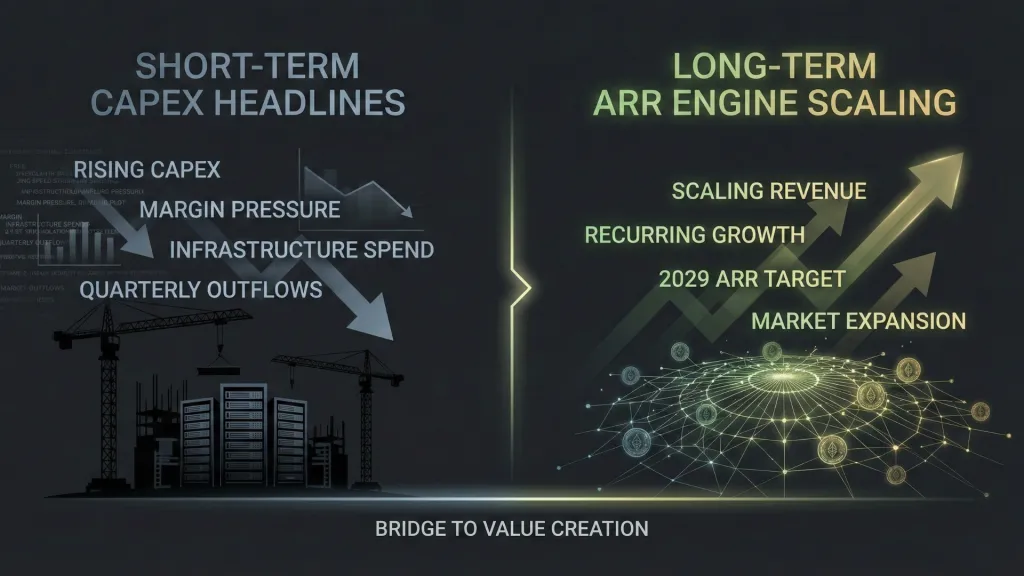
Categorization Error: Neo-Cloud vs Infrastructure Platform
NBIS is often grouped with neo-cloud operators such as:
- CoreWeave (CRWV)
- Cipher Mining (CIFR)
- Iris Energy (IREN)
These businesses differ materially in model architecture.
Most neo-cloud operators:
- Rent GPUs
- Operate on shorter duration contracts
- Depend heavily on hardware cycles
- Compete primarily on availability and pricing
- Lack vertically integrated software layers
Their risk is utilization and pricing compression.
NBIS is constructing something structurally different:
- Multi-gigawatt owned infrastructure
- Long-duration contracted power base
- Prepayment-backed expansion
- Vertical software stack via Aether
- Enterprise implementation ambition
The capital intensity is visible.
The throughput leverage is underappreciated.
When the market groups NBIS with rent-a-GPU operators, it implicitly assumes demand fragility and pricing vulnerability.
Our model assumes throughput scarcity persists and execution quality becomes the binding variable.
Demand Is Not the Binding Constraint
Most businesses face demand elasticity risk.
In the AI infrastructure market, the constraint has been physical:
- Power availability
- Data center build speed
- Hardware deployment cadence
NBIS exited 2025 with:
- $1.2B annualized ARR
- 547% Q4 revenue growth
- 830% YoY growth in core AI cloud
- >2GW contracted power
- Path to >3GW by YE 2026
Pipeline commentary suggests continued expansion.
The constraint in this system is energization speed and hardware deployment timing.
That difference matters.
If demand were the fragile variable, valuation should compress toward downside terminal outcomes.
If throughput and execution are the variables, valuation asymmetry expands when market classification is wrong.
Why the Disconnect Persists
Three forces maintain the gap:
- Scale is forward-loaded
The ARR ramp to ~$37.8B base case ARR in 2029 sits several years forward. Markets discount heavily when CapEx precedes earnings visibility. - Capital intensity obscures margin trajectory
Heavy CapEx compresses reported earnings near term. The market often underweights operating leverage that emerges once infrastructure stabilizes. - AI macro volatility suppresses multiples
When AI sentiment oscillates, all infrastructure names reprice together.
NBIS is trading as though:
- Demand could fade
- Contracts could evaporate
- Infrastructure could become stranded
Our model suggests a different risk profile:
- Contracted power anchors demand
- Prepayments support deployment
- Mix shift improves margin quality
- Scale compounds revenue intensity
Asymmetry Framed Through Throughput
The asymmetry is not narrative-driven.
It is mechanical.
By 2029:
- ~2,650 connected MW
- $15M ARR per MW midpoint
- 65% hyperscaler / 35% enterprise mix
- Dilution constrained to 5–16% cumulative
Under those assumptions, value scales nonlinearly.
If execution holds, value compounds faster than dilution expands.
If execution slips, valuation compresses and dilution increases, though scale still supports material ARR.
The market is discounting NBIS as a cyclical GPU renter.
The model frames NBIS as a throughput platform evolving into an enterprise AI cloud operator.
That distinction drives the present value divergence.
As energization milestones are met and ARR scales toward guidance bands, probability weight shifts.
The gap narrows not through narrative persuasion, but through cumulative execution evidence.
This is where asymmetry lives:
Between infrastructure visibility and infrastructure misunderstanding.
12. Portfolio Allocation and Positioning
The modeling framework is one layer of the thesis. Position sizing is another.
Northwise currently maintains an approximate 40% allocation to NBIS within its public equity portfolio.
That allocation reflects conviction, not comfort.
It also reflects risk tolerance calibrated to long-duration compounding rather than short-term volatility management.
12.1 Current Allocation and Sizing Logic
A 40% position is not casual.
It implies three underlying judgments:
- The probability-weighted outcome materially exceeds current price
- The downside case remains tolerable within portfolio construction
- The opportunity cost of underexposure is higher than the discomfort of volatility
This allocation aligns with the modeled asymmetry.
At a current price near ~$98, with a weighted 2029 outcome near ~$1,250 and discounted present value between ~$644–$794 depending on discount rate, the gap is not incremental. It is structural.
The sizing reflects that scale of divergence.
This position is not constructed around quarterly earnings beats or sentiment swings. It is constructed around:
- Multi-gigawatt infrastructure ramp
- Rising ARR per MW
- Capital bridge viability
- Revenue mix evolution
- Platform verticalization
Northwise was built to identify situations where math and market price meaningfully diverge.
NBIS represents that type of situation.
This does not eliminate risk.
It concentrates it.
12.2 Risk Management Framework
A 40% allocation demands clarity on volatility tolerance.
We are comfortable with a 50% drawdown.
That statement is deliberate.
The company operates in:
- A capital-intensive sector
- A volatile macro AI environment
- A financing-dependent expansion cycle
Price swings of 30–50% within a year are plausible.
Risk management in this framework is thesis-based, not price-based.
We monitor:
- Energization milestones
- ARR growth trajectory
- Contracted power expansion
- Capital discipline and funding structure
- Evidence of revenue mix transition
If those variables remain intact, volatility does not alter conviction.
If those variables deteriorate, position size becomes reassessed.
We are not financial advisors.
We do not recommend concentration without independent analysis and risk tolerance assessment.
This allocation reflects our own mandate and horizon.
12.3 What Would Increase Allocation
Allocation would increase under evidence of execution clarity without equivalent price adjustment.
Examples include:
- Confirmed acceleration toward 3GW+ contracted power
- Sustained ARR per MW tracking toward $15M+ trajectory
- Strong enterprise mix expansion toward 35% by 2029 path
- Opportunistic equity issuance at high valuation strengthening balance sheet
If infrastructure ramp credibility rises while market classification remains compressed, the asymmetry expands.
In that case, increased exposure would reflect improved probability weighting rather than emotional conviction.
12.4 What Would Reduce or Exit Allocation
Reduction would occur under structural deterioration of the thesis drivers.
Triggers include:
- Sustained monetization lag beyond modeled tolerances
- ARR per MW compression below modeled floor assumptions
- Capital markets tightening that forces distressed dilution
- Failure to expand beyond hyperscaler concentration
- Evidence that demand elasticity is emerging as primary constraint
Exit would be considered if the fundamental premise changes:
If throughput ceases to be the binding constraint and demand becomes fragile, the core architecture of the thesis changes.
Position sizing follows structure, not loyalty.
This allocation is neither a gamble nor a reflexive bet on AI enthusiasm.
It is a calculated exposure to a multi-year infrastructure build where:
- Physical throughput scales
- Monetization intensity rises
- Capital discipline preserves equity value
- Market classification lags operational reality
Northwise seeks long-horizon outperformance.
That objective requires periods of discomfort and concentration when asymmetry appears largest.
NBIS currently represents that asymmetry within our framework.
13. Volatility Playbook and Capital Roadmap
The modeled framework implies a potential 6–7× to discounted fair value and ~12× to weighted 2029 outcome from ~$98.
That magnitude creates a different psychological environment.
If NBIS triples in 2026, it will still sit far below our modeled fair value.
If it 5×’s by 2027, investors will feel wealthy long before fundamentals are fully realized.
The challenge becomes behavioral, not analytical.
This section translates the model into a real-world response framework.
13.1 If the Stock Triples in 2026
Example: $98 → ~$300
At ~$300, the company would still trade below half of our lowest discounted present value estimate (~$644 at 18%).
A 3× move in 12 months does not invalidate the thesis.
It likely reflects:
- Recognition of ARR ramp
- Validation of 3GW contracted power
- Macro AI optimism returning
The key question becomes:
Has the execution thesis materially changed?
If:
- Energization is on track
- ARR per MW trajectory remains intact
- Capital bridge remains viable
Then trimming solely due to a 3× move may be premature.
Under this scenario, Northwise would likely:
- Hold core allocation
- Consider trimming only if position size expands beyond portfolio risk tolerance
- Avoid reacting to percentage gain alone
The decision anchor remains fundamentals, not optics.
13.2 If the Stock 5×’s Before 2028
Example: $98 → ~$500
At ~$500:
- Price approaches the lower end of discounted present value
- Execution credibility is likely materially improved
- Market classification may be shifting
Here the decision framework becomes more nuanced.
Questions to ask:
- Is ARR per MW tracking toward $15M+?
- Is enterprise mix visibly expanding?
- Has equity been issued opportunistically?
- Has multiple expansion outpaced execution?
If price appreciation is driven primarily by multiple expansion rather than ARR realization, trimming 10–20% of the position to rebalance concentration becomes rational.
If appreciation is accompanied by accelerated execution, holding remains justified.
This is where discipline replaces emotion.
13.3 If the Stock Approaches $1,000 Before 2029
At ~$1,000:
- Price approaches weighted 2029 target
- Execution assumptions are being priced as near-certain
- Market confidence is likely high
In this environment:
- Probability-weighted asymmetry narrows
- Future returns compress
- Capital redeployment becomes logical
Northwise would likely:
- Gradually reduce exposure
- Lock in gains
- Preserve upside participation with a smaller core position
The goal is to harvest probability compression, not attempt to capture the final dollar.
13.4 If the Stock Overshoots the Bull Case
Example: $1,600–$1,800+ before 2029
At this level:
- Market would be pricing near-perfect deployment
- ARR per MW likely assumed at upper bound
- Multiple expansion embedded
If fundamentals exceed projections, the model would be revised.
If price runs materially ahead of execution evidence, capital preservation becomes priority.
Full or near-full exit becomes rational if:
- Valuation exceeds modeled range without incremental proof
- Narrative momentum outpaces infrastructure reality
The decision is valuation-driven, not celebratory.
13.5 Handling a 40–50% Drawdown
The other side of asymmetry is volatility.
If NBIS falls 40–50% from a given level:
- We reassess fundamentals first
- We do not anchor to prior highs
- We examine whether execution has broken
If:
- Power ramp continues
- ARR continues scaling
- Capital bridge remains viable
Then drawdown represents volatility, not thesis failure.
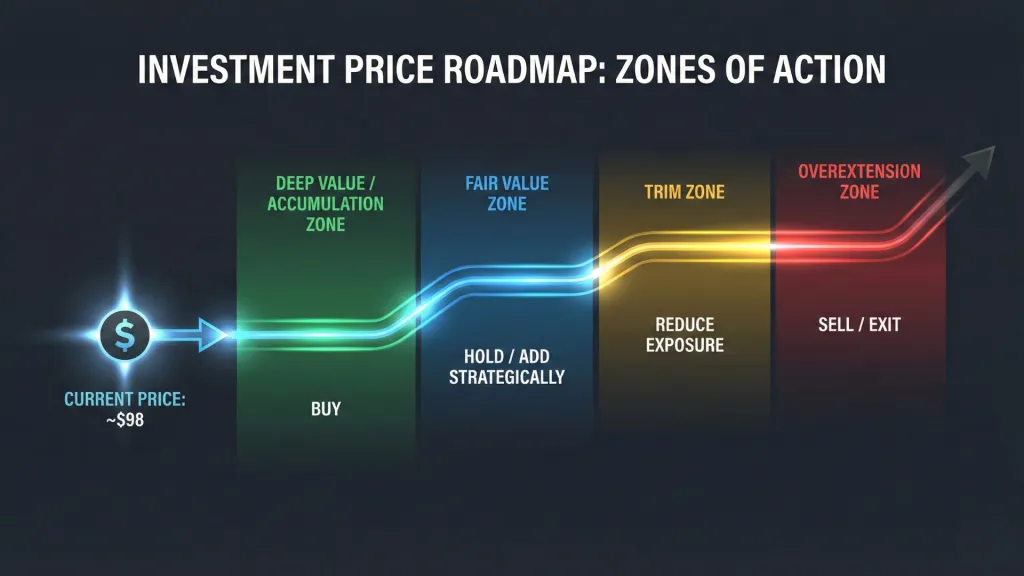
If capital stress or demand fragility emerges, position size adjusts.
The tolerance for drawdown exists only within thesis integrity.
13.6 The Unique Nature of 10× Setups
Most equities do not present 6–12× modeled asymmetry.
In these setups:
- Early trimming can permanently impair long-term compounding
- Late trimming can sacrifice gains to overextension
The balancing act becomes:
- Hold through early recognition
- Trim through probability compression
- Exit through overvaluation
This requires patience in the first half of the move and discipline in the second half.
13.7 The Framework in One Sentence
Add when execution is intact and price reflects fear.
Hold when execution compounds and price reflects recognition.
Trim when price reflects certainty.
That is the roadmap for a volatile, capital-intensive, high-beta compounder
13.8 Portfolio Reality and Concentration Drift
Position sizing changes when price moves.
Consider an investor who allocates 10% of their portfolio to NBIS at ~$98.
If the stock increases 5× over two years:
- That 10% becomes ~40–50% of the portfolio
- Portfolio volatility profile changes dramatically
- A 50% drawdown in NBIS now equates to a 20–25% portfolio drawdown
Investors must reevaluate:
- Am I structurally comfortable with this level of concentration?
- Can I withstand a 50% drawdown from this new level?
- Will partial profit-taking improve my ability to hold the remainder confidently?
Concentration drift is not failure. It is math.
In a high-beta, infrastructure-driven compounder, 40–60% drawdowns are plausible multiple times across the lifecycle. Historical analogs such as Palantir demonstrate that even structurally strong AI platforms can experience repeated volatility cycles on the path to scale.
Trimming in this context is not lack of conviction.
It can serve three purposes:
- Risk normalization
- Psychological reinforcement
- Capital recycling into diversified opportunities
An investor who trims from 50% portfolio exposure back to 25% after a 5× move may:
- Lock in life-changing gains
- Improve sleep quality
- Retain meaningful upside participation
The goal is not to perfectly optimize return.
The goal is to remain in the position long enough to realize structural compounding.
If trimming 10–20% of the position allows an investor to hold the remaining 80–90% through inevitable volatility, that may be a rational trade.
Every portfolio has different constraints:
- Income needs
- Time horizon
- Volatility tolerance
- Psychological resilience
The framework we present is math-driven.
Position sizing must also be human-driven.
NBIS, if our thesis is directionally correct, will not move in a straight line.
Investors should expect:
- Violent upside
- Sharp corrections
- Narrative swings
- Capital intensity headlines
Managing concentration drift is part of long-horizon success.
Holding through volatility is easier when exposure matches temperament.
This is not about maximizing theoretical IRR.
It is about maximizing the probability that an investor remains rational throughout the lifecycle of a high-variance compounder.
14. Final Northwise Synthesis
14.1 What the Model Ultimately Proves
The framework answers a narrow but powerful question: what occurs if throughput scales as projected and monetization intensity rises alongside it?
By 2029 the model converges around three anchored inputs:
- ~2,650 connected MW
- ~$15M ARR per MW midpoint
- Revenue mix evolving toward 65% hyperscaler and 35% enterprise
Under the base case this supports approximately ~$37.8B of ARR. Under the bull case ARR approaches ~$42.4B. The bear case, incorporating execution friction and heavier dilution, still produces material scale relative to today’s valuation.
The conclusion is mechanical. If power connects, hardware deploys, contracts convert, and capital remains structured within modeled boundaries, equity value compounds at a rate that far exceeds the current ~$98 price context.
The model demonstrates sensitivity to ARR per MW. It demonstrates dilution impact. It demonstrates capital intensity. Above all, it demonstrates that scale dominates the long-term outcome.
14.2 Why This Opportunity Exists
The disconnect exists at the intersection of timing and categorization.
Capital expenditure is immediate and visible. Earnings power is forward and conditional. Markets compress valuation when investment precedes monetization.
Simultaneously, AI infrastructure equities trade as a cluster. When macro AI sentiment softens, GPU cycle concerns emerge, or capital intensity headlines circulate, the entire group reprices. NBIS trades inside that gravity field.
Surface narrative emphasizes volatility and CapEx. Beneath that surface sits contracted gigawatts, long-duration commitments, prepayments supporting deployment, and a vertically integrated software stack designed to move higher in the value chain.
A useful metaphor is underground infrastructure in a growing city.
During excavation, observers see disruption, cost, and unfinished structures. The network’s utility remains abstract. Once tunnels connect and traffic begins to flow, the system’s value becomes self-evident.
NBIS remains in the excavation phase.
Markets are pricing visible cost.
The model prices connected infrastructure.
Friction between those perspectives explains the divergence between present price and discounted intrinsic value.
14.3 The Discipline Behind the Conviction
Conviction here is structured.
This report has:
- Modeled CapEx from 2026 through 2029
- Reconciled funding using disclosed guidance and layered assumptions
- Incorporated dilution ranges tied to execution scenarios
- Weighted bear, base, and bull outcomes
- Discounted terminal values at 12%, 15%, and 18%
We have defined conditions that would reduce allocation. We have established valuation zones for trimming. We have acknowledged monetization lag risk, ARR sensitivity, and capital intensity.
A 40% allocation reflects asymmetric math under current pricing. It also reflects acceptance of volatility. A 50% drawdown during a multi-year build cycle remains plausible. Position sizing and trimming frameworks exist to manage that reality.
Discipline centers on monitoring:
- Energization cadence
- ARR per MW trajectory
- Revenue mix progression
- Capital bridge integrity
If those variables remain intact, volatility becomes an input rather than a thesis breaker. If they weaken materially, probability weights shift and allocation adjusts.
14.4 Nebius Stock Forecast Closing Perspective
The market presently values NBIS as a capital-intensive AI infrastructure operator navigating volatility. The model values it as a throughput platform evolving toward higher-margin enterprise cloud capture.
That distinction explains the gap.
By 2029, if ~2.65 GW is connected and monetized at rising intensity, the earnings base will differ materially from current optics. If execution deteriorates, dilution increases and valuation compresses. Both paths are incorporated into the scenario architecture.
This thesis operates on a multi-year horizon. Price will overshoot and undershoot intrinsic value repeatedly.
Northwise seeks long-duration outperformance derived from structural mispricing. NBIS represents a situation where infrastructure scale, capital structure, and market classification remain misaligned.
From this point forward, evidence governs.
Power will connect or it will not.
ARR will scale or it will not.
Capital discipline will persist or it will not.
The gap closes through execution.
That is the thesis.
This is not financial advice. We are not financial advisors. Always conduct your own due diligence before investing.
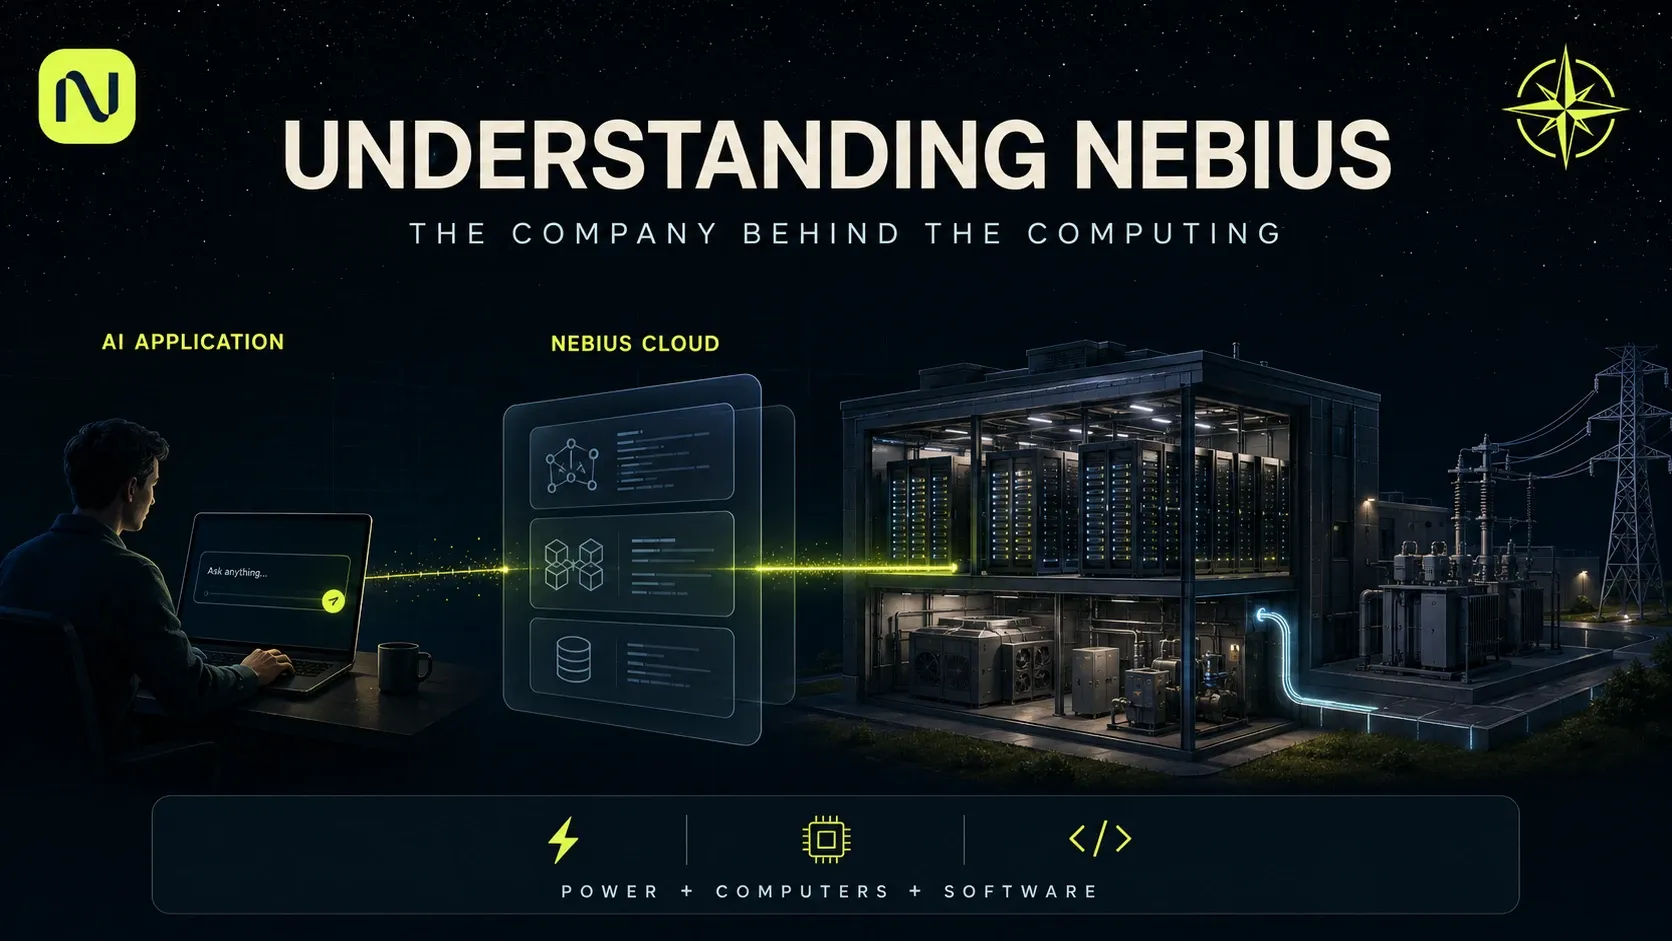
Understanding Nebius: A Complete Guide to the Company
Understand Nebius from the ground up: its AI cloud, competitors, subsidiaries, funding, and growth opportunities. A complete NBIS guide with 14 illustrations.
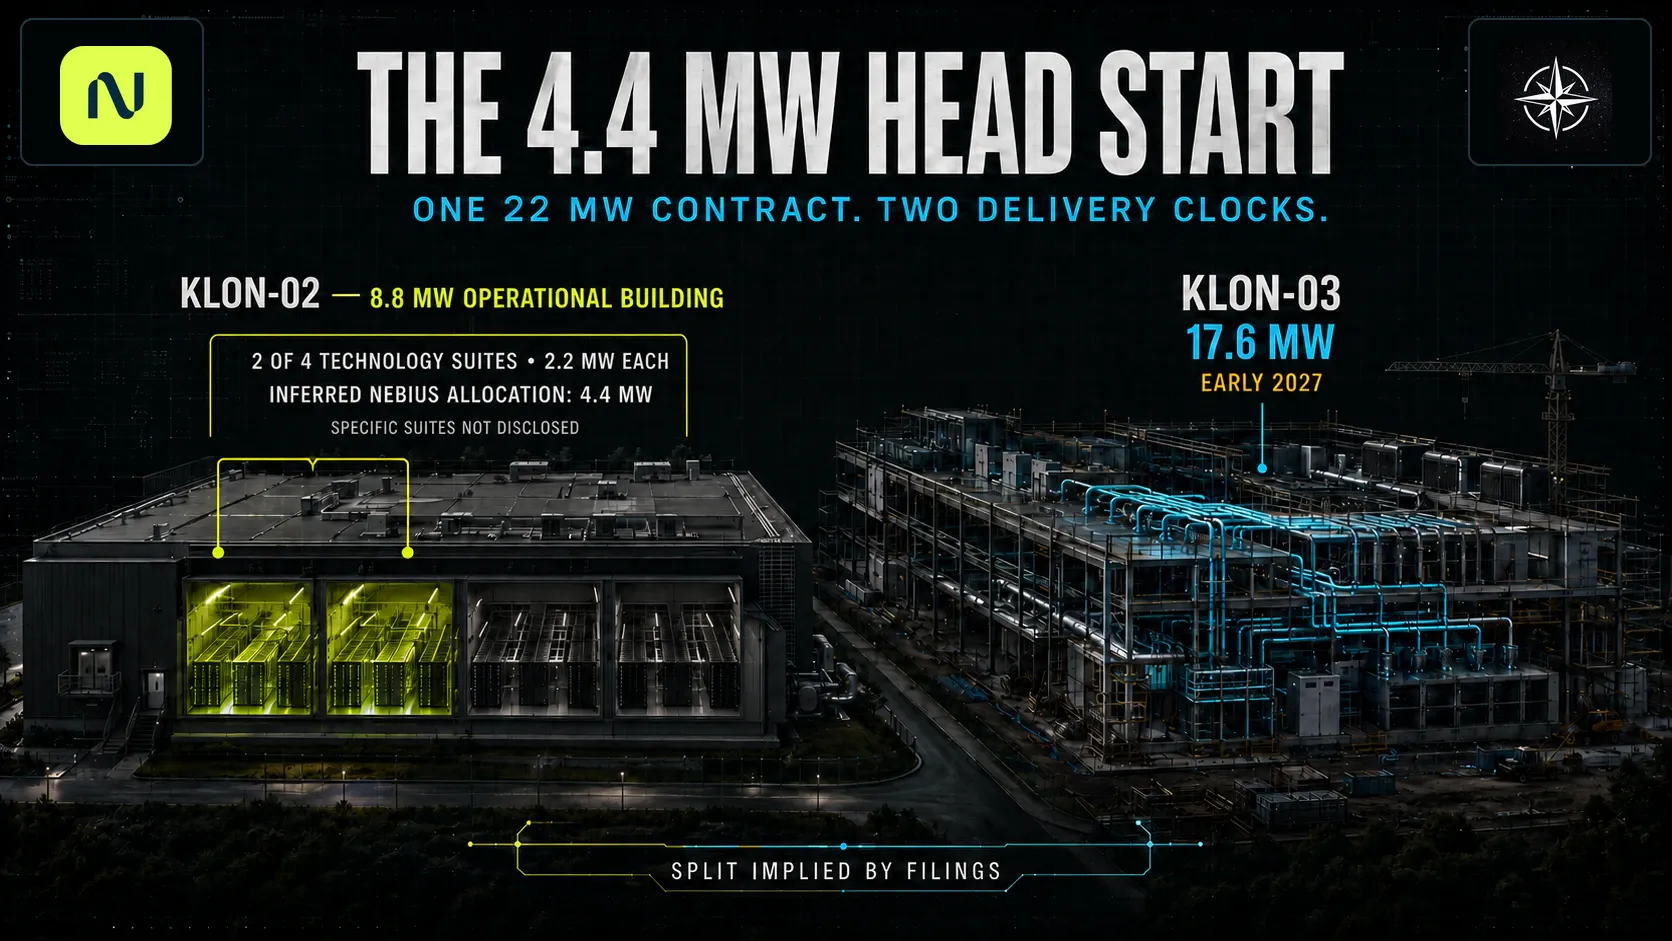
Nebius in Europe: Sovereign AI, UK Expansion and Harlow
How European AI sovereignty supports Nebius’s UK expansion, where Harlow fits, and what its potential 4.4 MW deployment could add to Q3 revenue and 2026 ARR.

NBIS Stock Forecast 2030: The Conversion Problem
A ground-up Nebius model rebuild after Q2 2026, covering AI factory economics, capital structure, valuation scenarios, and the NBIS stock forecast to 2030.
Northwise Portfolios
See how the research becomes real decisions
Reader discussion
Discuss the research
Create a Free account to join the discussion with a display name.
Create a Free Account
No comments yet. Start a thoughtful discussion.