NBIS Stock Forecast 2030
NBIS Stock Forecast 2030: A complete Nebius analysis covering AI capacity, Nvidia, contracts, CapEx, prepayments, revenue, margins, funding, & valuation.
In this article
Nebius is building one of the most ambitious independent AI cloud platforms in the world, with Nvidia-backed infrastructure, hyperscaler contracts, multi-gigawatt capacity growth, rising revenue per megawatt, and a business model that could look very different by the end of the decade.
NBIS Stock Forecast 2030: The Model Broke When the Company Outran It
In February, we published a forecast that carried what was, as far as we can find, the highest serious price target on Nebius in existence at a time when the stock traded under $100. Our probability-weighted 2029 outcome landed near $1,250 per share, with a present value around $644 even after discounting at 18%. The market was pricing the company near $98. Readers who acted on that work have watched the stock move toward $300.
We are proud of that call. We are also using this refresh to make a more useful admission. We were directionally right and not aggressive enough. The thesis held. The pace did not. Nebius compressed years of expected progress into a few quarters, and several of the inputs we treated as forward assumptions in February have already been overtaken by disclosed facts.
The prior model framed Nebius as a power-anchored AI cloud platform scaling toward roughly 2.65 gigawatts of connected capacity by 2029. That framing was correct in shape. It was too small in magnitude.
Since February, Nvidia invested $2 billion and entered a multi-generation partnership pointed at more than 5 gigawatts by the end of 2030. Meta signed an agreement worth up to $27 billion. Pennsylvania emerged as an owned site of up to 1.2 gigawatts. Finland added an owned 310 megawatt factory. Contracted power passed 3.5 gigawatts before the year reached its midpoint, and management guided above 4 gigawatts by year-end, with more than 75% of that base now owned.
The result is a different modeling problem. A larger capacity base, a higher revenue-per-megawatt ceiling, a heavier capital plan, and a real depreciation and interest load mean we can no longer value Nebius with a clean run-rate multiple and a single terminal year. This report rebuilds the model from the physical layer up. It carries capacity by site, capital expenditure per megawatt, revenue per megawatt, recognized revenue separated from exit run-rate, adjusted EBITDA, depreciation, interest, dilution, funding sources, and a sum-of-the-parts layer, and it ties all of that together with a probability framework built on evidence.
The debate is no longer whether demand exists. The harder question is conversion. Can Nebius turn contracted power into connected power, connected power into active power, active power into recognized revenue, revenue into durable EBITDA, and EBITDA into equity value after depreciation, interest, dilution, and the next round of capital expenditure? The scale increases the upside. It also increases the number of things that have to work at once.
The free portion of this report builds the entire operating model in the open. It covers what Nebius is, why the old model needed rebuilding, the Q1 2026 evidence, the site-level energization ramp, the capital and funding bridge, the margin and depreciation structure, the sum-of-the-parts assets, the risks, and the probability methodology with our exact scenario weights. The premium portion holds the valuation framework itself: the multiples, the per-method outputs, the present values, the price target, and the action framework that tells a reader what to do with all of it.
What Nebius Is, and Why the Market Keeps Misreading It
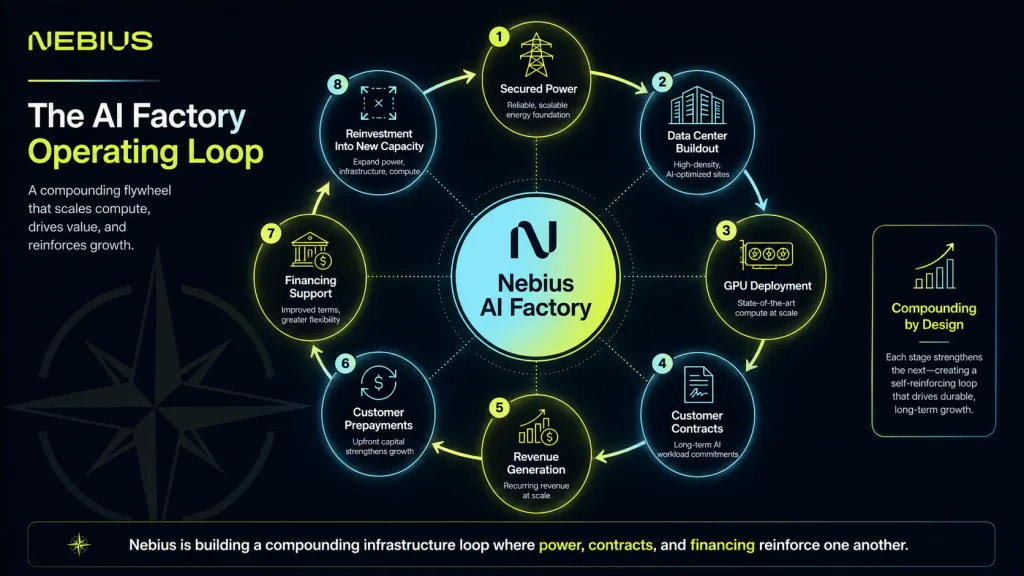
Nebius is an AI infrastructure company assembled from the international assets of the former Yandex. Its core business is AI cloud infrastructure sold to hyperscalers, AI-native companies, enterprises, research labs, and model builders. Describing it as a company that rents GPUs captures the smallest and least interesting part of what it does.
The company operates across the full chain that converts electricity into intelligence. It contracts power. It develops and increasingly owns data centers. It deploys GPU clusters, networking, and storage. It runs an orchestration and cloud layer. It builds developer tooling, managed inference, and the governance and control features enterprises require. It is acquiring its way into the agentic and inference-optimization layers that sit closest to customer applications.
That places Nebius in an awkward spot for anyone who needs a tidy category. It is not a hyperscaler. It is not a pure data center landlord. It is not only a GPU rental business. It is not yet a software company. It is more vertically integrated than a neocloud peer. The most accurate description is an AI factory operator, a business that takes power, chips, networking, software, and customer workloads as inputs and produces training, inference, and agentic execution as output.
The useful mental image is a power plant rather than a warehouse. A conventional data center stores servers. A Nebius factory converts a scarce input, energy, into a sellable output, intelligence. The plant is necessary, and so is everything around it: the turbine that converts the fuel, the control system that dispatches load, the contracts that guarantee offtake, and the software that decides what runs where. The market tends to price the building. The opportunity lives in the conversion.
Where Our Last Report Was Right, and Where It Was Too Conservative
Continuity is part of trust, so we are precise about what the February model got right and where it fell short.
The prior report got the architecture right. It focused on power and throughput instead of quarterly revenue. It treated Nebius as an infrastructure buildout. It identified the loop in which hyperscaler contracts double as financing instruments. It separated contracted power from connected capacity from monetized run-rate, which turned out to be the single most important distinction in the whole model. It put site-level energization at the center. It flagged Aether, managed inference, and the strategic assets as optionality. It argued that Nebius was more resilient than a financed GPU lessor.
Each of those calls held. What the model underestimated was speed and ceiling.
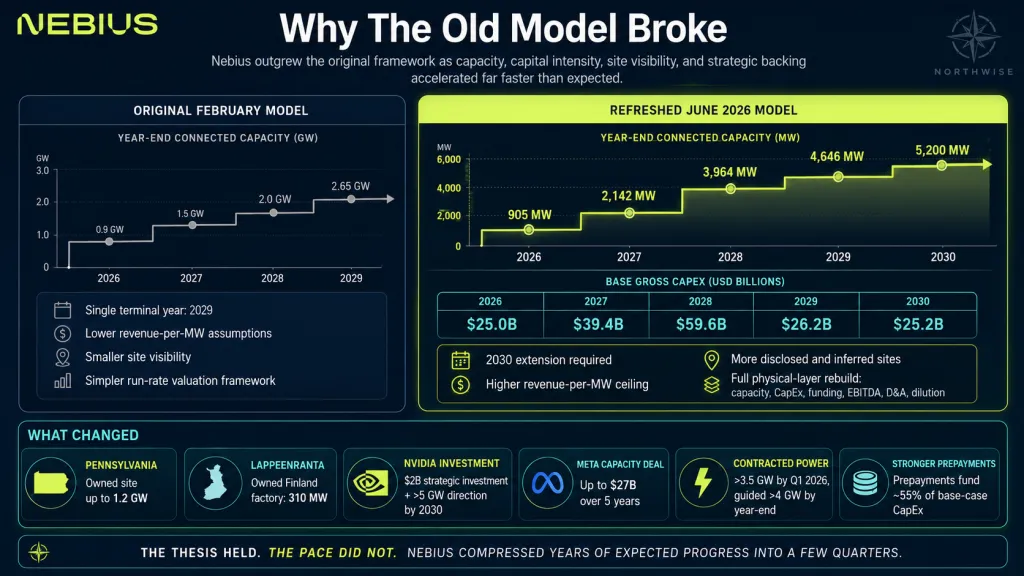
We modeled one major United States anchor and a generic block of future additions. The company is now building at least two gigawatt-scale United States anchors, in Missouri and Pennsylvania, alongside an expanding owned European base. We assumed contracted power would approach 3 gigawatts by the end of 2026.
It passed 3.5 gigawatts by the first quarter. We treated the Nvidia relationship as supportive. It became a $2 billion strategic investment and a multi-generation hardware and software partnership. We had no Meta agreement of consequence in the model. There is now one worth up to $27 billion. We capped revenue per megawatt too low, underplayed the software stack as a slow-burn margin lever during an active acquisition program, and set a single terminal year of 2029, since that was as far as site visibility extended at the time.
None of that reflects a broken thesis. It reflects a company that executed faster than a disciplined model was willing to assume in February. The correct response is not to apologize for conservatism. It is to update the model now that the facts have changed, and to be honest that the new base case is built on a larger and more capital-intensive company than the one we described four months ago.
Q1 2026: The Evidence That Forced the Rebuild
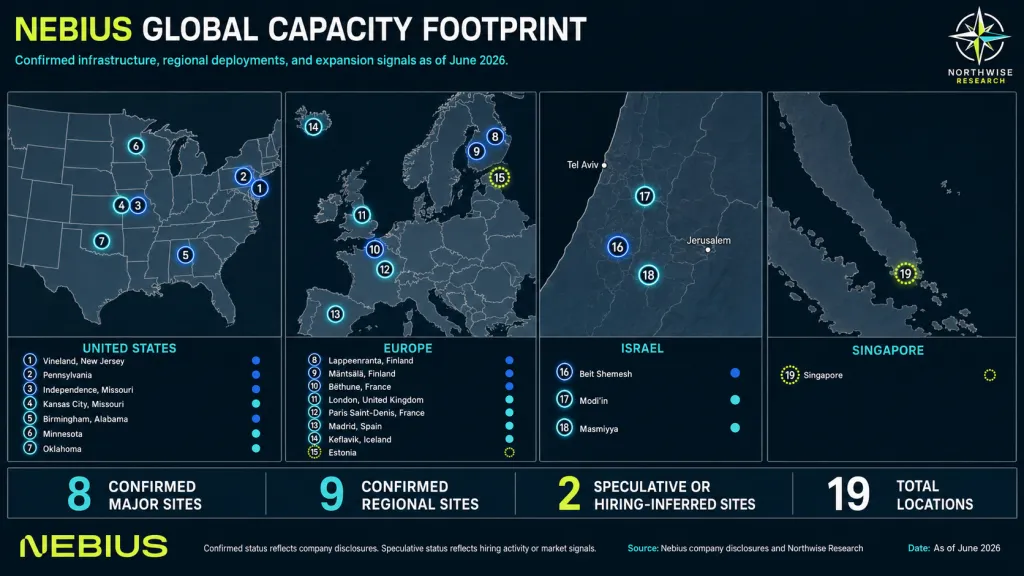
The first quarter of 2026 did not simply beat estimates. It reset the power base, the capital base, and the margin base at the same time, which is why a numbers refresh was not enough.
Group revenue reached roughly $399 million, with AI Cloud revenue near $390 million, up more than 800% year over year and more than 80% sequentially. AI now represents almost the entire revenue base. The company exited the quarter with about $9.3 billion in cash, generated roughly $2.3 billion of operating cash flow, and raised approximately $6.3 billion, including Nvidia equity and a convertible offering that priced at a 2.63% coupon with a conversion price near 90% above the prior close. Strong terms on convertible debt are themselves evidence: the market is willing to fund this buildout at a low cash cost.
The margin picture changed character. AI Cloud adjusted EBITDA margin reached 45%, with group adjusted EBITDA margin at 32%. Guidance for the full year calls for $3.0 billion to $3.4 billion of revenue, $7 billion to $9 billion of exit ARR, and adjusted EBITDA margin around 40%. A 45% AI Cloud margin matters less as a single data point and more as a signal of what the business looks like as the AI mix becomes the whole business.
The capacity and capital figures are the ones that broke the old model. Contracted power moved above 3.5 gigawatts, with guidance above 4 gigawatts by year-end and more than 75% of that base owned. Connected power guidance for year-end 2026 sits at 800 megawatts to 1 gigawatt. The company named Pennsylvania as an owned site of up to 1.2 gigawatts and added an owned 310 megawatt factory in Finland.
The current site map spans Finland, Israel, Iceland, the United Kingdom, France, New Jersey, Missouri, Oklahoma, Alabama, Minnesota, Kansas City, Pennsylvania, and Spain. Pipeline generation rose roughly 3.5 times quarter over quarter, pricing rose for new-generation systems and held for older ones, and average deal sizes grew.
The cleanest way to read the quarter is through the gap between two numbers. A company guiding to $3.0 billion to $3.4 billion of 2026 revenue while preparing to spend $20 billion to $25 billion of capital expenditure is not managing for near-term accounting optics. It is racing to secure physical AI throughput while the supply of that throughput is short.
The Nvidia-Aligned AI Factory Frame
The Nvidia relationship is the change that most alters how we frame the company, so we treat it as thesis-central.
In March, Nvidia invested $2 billion in Nebius through pre-funded warrants for 21,065,936 Class A shares, a stake of roughly 8%, structured as a private placement with a six-month lockup.
The capital came paired with a partnership across four areas: AI factory design and support, including early access to hardware samples and design review; inference and agentic stack development using Nvidia software and optimized models; multi-generation infrastructure access, including early access to the Rubin platform, Vera CPUs, and BlueField storage; and fleet management using Nvidia health-monitoring tools at cluster scale. The stated direction is more than 5 gigawatts of Nvidia systems deployed by the end of 2030.
The technical validation followed. Nebius achieved Nvidia Exemplar Cloud status on GB300 NVL72 for training, powered by Blackwell Ultra, and holds that status across multiple GPU generations from H200 forward.
It expects to deploy Vera Rubin NVL72 across United States and European sites beginning in the second half of 2026, with that platform serving as a compute layer inside Token Factory. Exemplar status is a statement that the infrastructure performs against real training and inference workloads at scale, not only against peak specifications.
What this changes is the probability that Nebius is a disciplined, prioritized builder of Nvidia-based capacity rather than a marginal buyer of whatever chips it can find. Early hardware access, design collaboration, and validated performance compress the time between a new Nvidia generation and revenue-producing deployment. That speed is the scarce resource in this market.
We are careful not to overstate it. The investment does not guarantee supply priority beyond what has been disclosed. It does not make the equity riskless. It also introduces a circularity concern that thoughtful investors should hold in view: Nvidia has invested $2 billion in both Nebius and CoreWeave, and capital that flows from a chip vendor into the customers buying its chips deserves scrutiny. Our read is measured. The relationship does not remove risk. It makes Nebius strategically relevant, improves deployment velocity, and supports the credibility of the capacity ramp. That is enough to matter without pretending it is a guarantee.
Demand: Why This Is Not a Normal Infrastructure Cycle
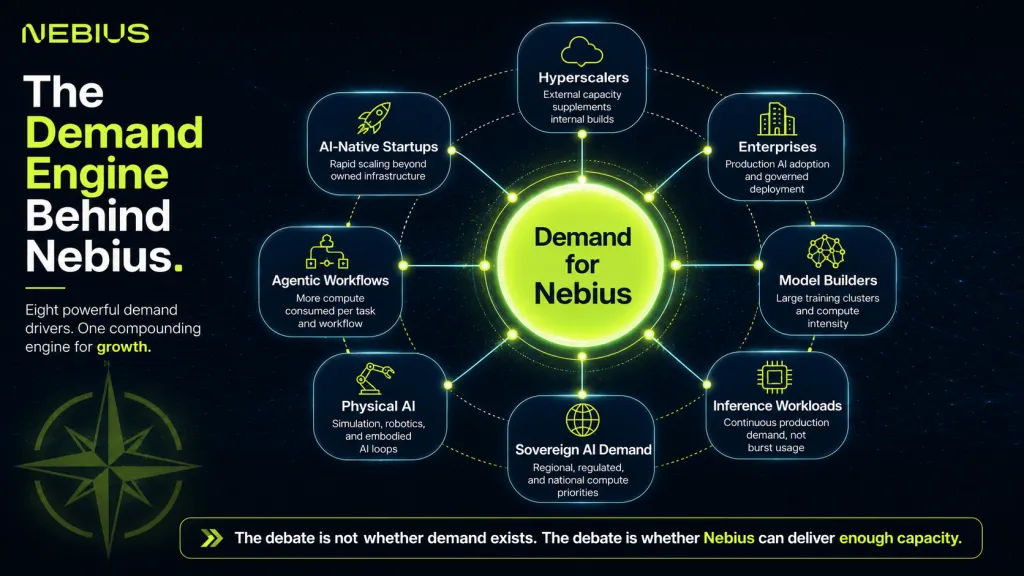
Aggressive capacity assumptions only make sense if demand is structurally short of supply rather than cyclically strong. The evidence points that way.
Demand is arriving from several directions at once. Hyperscalers are securing external capacity to supplement internal builds. AI-native companies are scaling faster than their own infrastructure can absorb. Enterprises are moving from experimentation into production, where inference runs continuously instead of in bursts. Model builders need large training clusters. Agentic workflows raise compute intensity per task. Physical AI and robotics add simulation, training, and inference loops. Sovereign and regional requirements create demand that is geographic in nature.
A consumption dynamic reinforces this. As intelligence gets cheaper per unit, more workloads become economically viable, so total consumption tends to rise instead of fall. Nebius co-founder Roman Chernin has framed AI adoption as still in the first percent of use cases at many companies, with cheaper intelligence expanding the addressable base. Co-founder Tom Blackwell, in a recent podcast interview with Daniel Koss, has described demand running well ahead of available capacity, with indications of several times more demand than the GPU supply coming online.
We do not take management commentary at face value, and we model execution risk heavily for that reason. The point of citing it is narrower. The constraint in this system has been physical, not commercial. Power availability, construction cadence, hardware delivery, and integration set the pace. The harder question for Nebius is not whether enough customers want AI compute. It is whether the company can deliver capacity fast enough without straining the balance sheet past its tolerance.
Customer Contracts as Financing Instruments
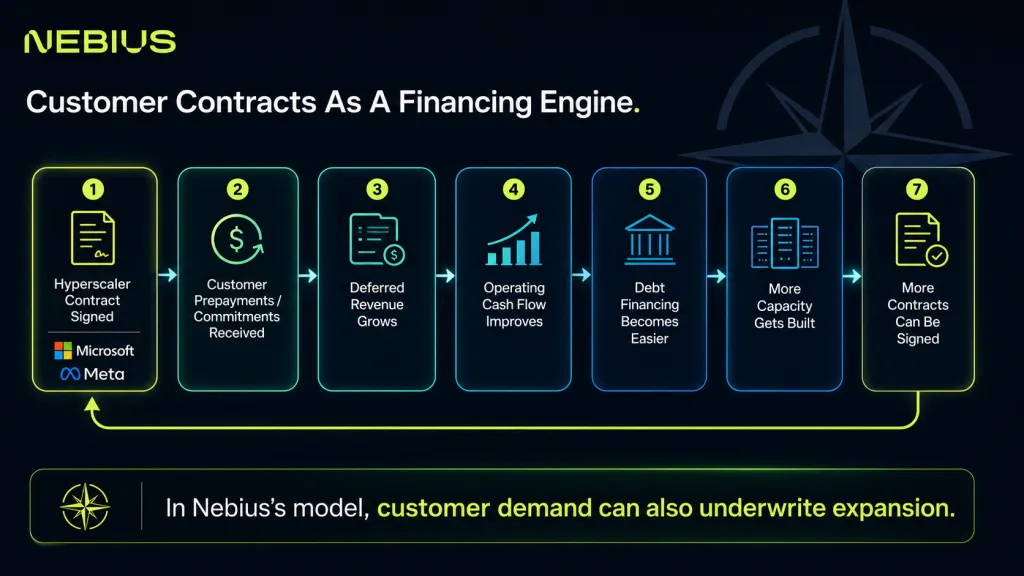
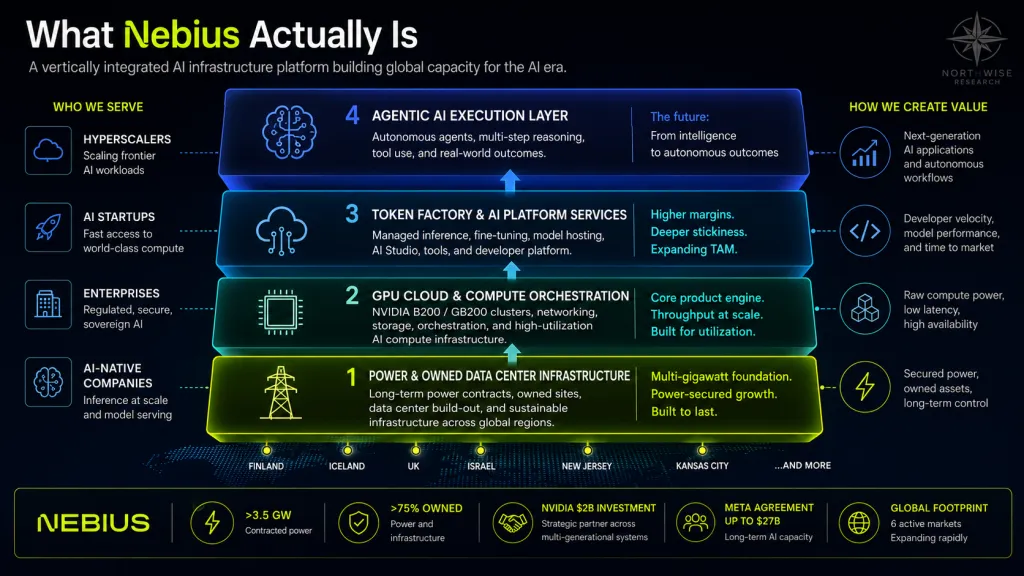
The contracts at the center of this business are not only revenue. They are funding mechanisms, and that dual role is what allows the capital plan to function.
The Microsoft relationship, estimated in the range of $17 billion to $19 billion, created early hyperscaler validation and serves as foundational backlog and proof of counterparty confidence. The Meta agreement is the larger structural change. It runs up to $27 billion over five years, includes roughly $12 billion of dedicated AI computing capacity by 2027, and adds up to $15 billion more if that capacity is not sold to other customers. That structure reduces utilization risk on a slice of planned capacity, since a portion of it is effectively underwritten whether or not other buyers appear.
The financing loop runs as follows. A long-term contract is signed. Customer prepayments and commitments arrive, lifting deferred revenue and operating cash flow. Those contracted cash flows make secured and asset-backed financing more bankable. The financing funds more capacity. More capacity supports more contracts, and scale improves credibility with suppliers, lenders, and customers. The loop repeats, and each turn lowers the marginal cost of the next dollar of capital.
Customer concentration normally reads as a risk, and here it cuts both ways. The same Microsoft and Meta commitments that de-risk the buildout and lower funding costs also expose Nebius to a concentration discount if the market begins to worry that its fortunes depend too heavily on two counterparties. We carry both effects. The contracts are a genuine financing advantage today and a genuine concentration risk if diversification stalls.
From Megawatts to Tokens: The Product Stack and Software Layer
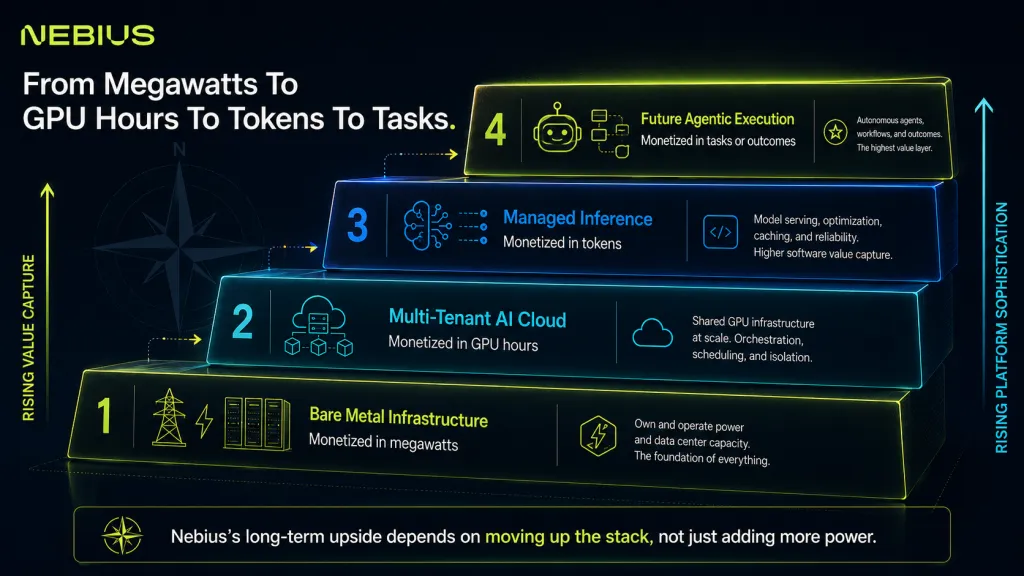
The reason revenue per megawatt can rise over time, rather than holding flat like a landlord's rent, is that Nebius sells the same underlying power at different heights in a stack, and value capture increases as it climbs.
Roman Chernin's framework describes four layers. The base is bare-metal infrastructure, sold in megawatts to hyperscalers, frontier labs, and the largest customers, with the strongest visibility and the lowest value capture. Above that is multi-tenant cloud, sold in GPU hours to startups, research teams, and AI-native companies, with higher capture.
Above that is managed inference, sold in tokens through Token Factory, where customers outsource model selection, optimization, reliability, and deployment, and where platform value rises. At the top sits an agentic execution layer, sold in tasks or outcomes, still speculative today but directionally important.
A megawatt sold under a hyperscaler bare-metal contract is not the same economic unit as a megawatt monetized through managed inference. The higher layers bring better utilization, more pricing flexibility, more attached services, stronger retention, and higher gross margins. The February model treated megawatts too uniformly. This refresh treats a megawatt as physical input capacity whose revenue value depends on how high in the stack Nebius monetizes it.
The software layer is what allows the climb, and Nebius has been buying and building it deliberately.
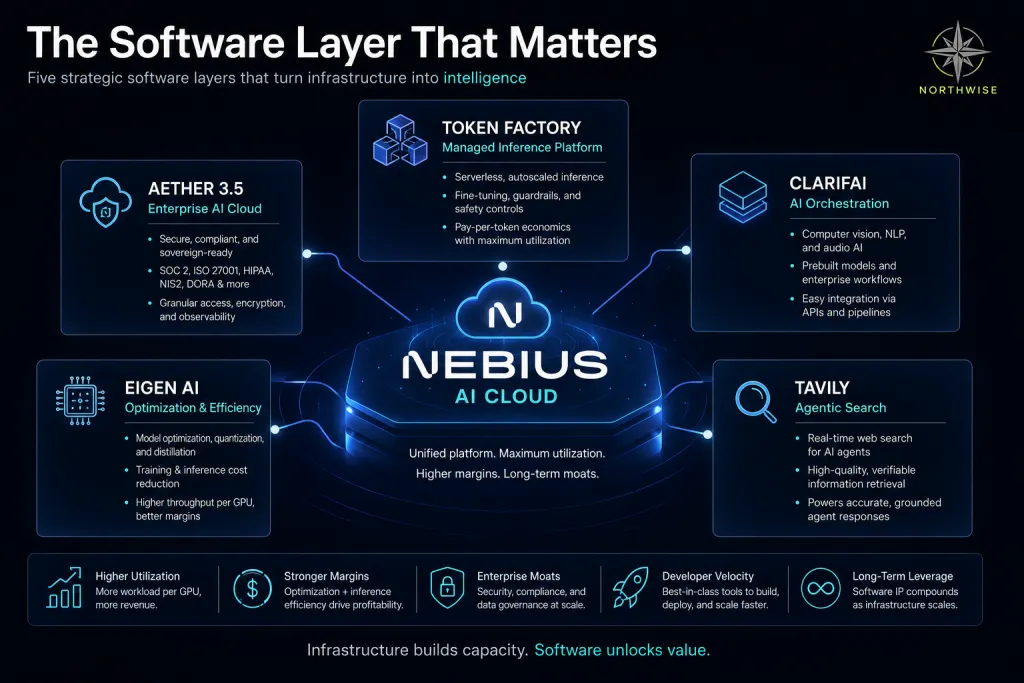
Aether is the AI Cloud platform and control layer across the GPU fleet. Its more recent releases add serverless inference, petabyte-scale data transfer across clouds, and stronger governance, security, billing, and audit features. Enterprises need controls, not only raw GPUs, and Aether is where that requirement is met. At gigawatt scale, the orchestration layer also governs utilization, and small differences in utilization translate into large economic variance, so Aether functions as the dispatch center that determines how effectively power converts into billable throughput.
Token Factory is the managed inference platform, charging per token generated and promising lower total cost through a stack that optimizes both the hardware and the model. It is the product that carries Nebius above bare metal, and the company has assembled it through acquisition.
Eigen AI, acquired for roughly $643 million, optimizes at the model level. Clarifai contributed its core engineering team, its patent portfolio, and a perpetual license to its inference and orchestration technology, optimizing at the system level, with founder Matthew Zeiler joining to lead research. Tavily added agentic web search and real-time retrieval so that agents can reason over live information. Eigen optimizes the model, Clarifai orchestrates the system, and Tavily grounds the agent, which together turn Token Factory into a vertically integrated inference platform.
We hold one caution firmly. The software stack is strategically important and still underdisclosed financially. We do not model Nebius as a software company, and we do not assign software economics to the whole business. The software layer improves revenue per megawatt, supports margin durability, and strengthens the case for a higher multiple. The business underneath it remains capital intensive, and we model it that way.
The Capacity Model: Contracted, Connected, Active, and Monetized Power
Most confusion about Nebius comes from collapsing four different things into one word. The model keeps them separate.
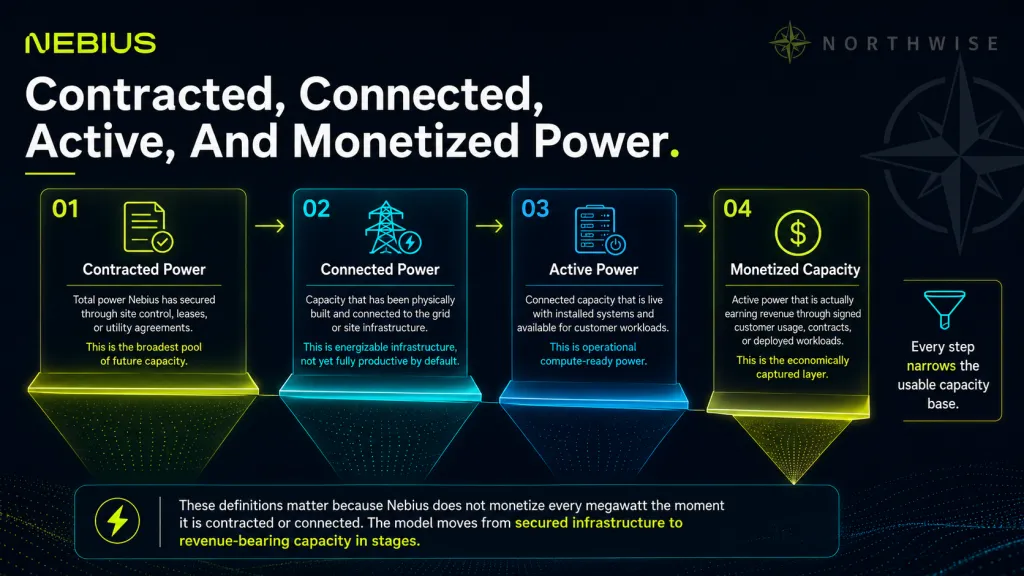
Contracted power is land and power secured under commitment. It supports future capacity and financing, and it may not yet be built. Connected power is power brought into built or ready infrastructure. It is more tangible, and it still may not be producing revenue. Active power is consumed by installed, operational IT equipment, which moves it close to revenue. Monetized power is active capacity generating customer revenue, which is the layer closest to recognized revenue and exit ARR.
Our model runs on connected and monetizable megawatts, and it assumes minimal lag between power going live, hardware deploying, and revenue contributing. That assumption is aggressive, and we defend it on specific grounds. Demand is already visible, major capacity is contracted, the company has shown fast deployment, and customers need the capacity badly enough that onboarding friction should be shorter than in a normal enterprise infrastructure sale.
The assumption can still be wrong. Connected power does not always mean installed GPUs, installed GPUs need commissioning, customer onboarding can lag, hardware supply can slip, interconnections can be delayed, and permitting can interrupt timing. The model is built on connected, revenue-relevant capacity, then adjusted through scenarios.
The change in scale from the prior model is large. The February forecast modeled roughly 900 megawatts connected by 2026, 1.5 gigawatts by 2027, 2.0 gigawatts by 2028, and 2.65 gigawatts by 2029, with the model ending in 2029 once site visibility effectively stopped there. This refresh extends through the fourth quarter of 2030 for reasons that have nothing to do with optimism and everything to do with evidence.
The forecast is a 2030 forecast. The Nvidia partnership references more than 5 gigawatts by the end of 2030. Several large sites carry natural 2030 tails, and forcing them into a 2029 endpoint would understate the build curve. Asia and other unannounced sites are likely to enter the model by 2030.
NBIS Stock Forecast 2030 Site-by-Site Capacity Rebuild
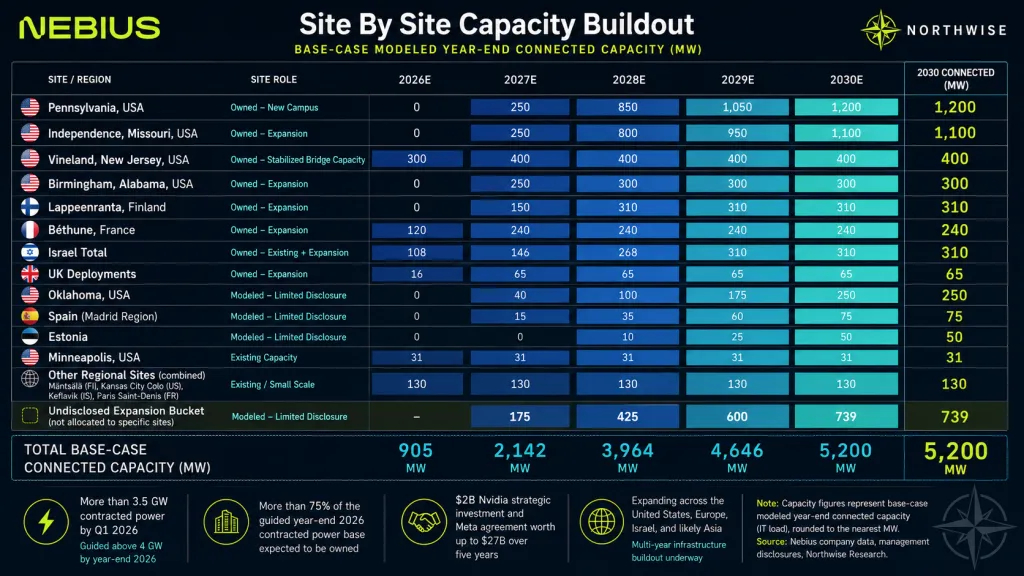
The operational spine of this model is the site-level ramp, expressed in year-end connected megawatts. Where the underlying facts are not disclosed, we state the assumption and preserve the uncertainty instead of inventing detail.
This section is a result of hundreds of hours of compilation of our Nebius data center research over 2026.
Vineland, New Jersey is early stabilized United States capacity that carries near-term revenue while the giga-scale anchors ramp.
Vineland, NJ | 2026 | 2027 | 2028 | 2029 | 2030 |
|---|---|---|---|---|---|
Connected MW | 300 | 400 | 400 | 400 | 400 |
We do not know how much of Vineland is dedicated to Microsoft versus general AI cloud, whether 400 megawatts is a hard cap, or how its margin compares to future owned sites. Our working view is that it functions as a bridge during 2026 and reaches design limits by late 2027.
Independence, Missouri is the long-duration United States anchor, back-end weighted into 2028 through 2030.
Independence, MO | 2026 | 2027 | 2028 | 2029 | 2030 |
|---|---|---|---|---|---|
Connected MW | 0 | 250 | 800 | 950 | 1,100 |
The company broke ground in Missouri, and Missouri and Alabama are expected to be operational in 2027. We allow a 2030 tail, since giga-scale campuses do not need to be forced into a 2029 endpoint. Local execution, interconnection, substation work, and construction timing are the binding risks.
Pennsylvania is the second United States giga-scale anchor and the single largest change from the prior model. It is a named owned site of up to 1.2 gigawatts, delivered in phases beginning in 2027, and it no longer belongs inside a generic additions block.
Pennsylvania | 2026 | 2027 | 2028 | 2029 | 2030 |
|---|---|---|---|---|---|
Connected MW | 0 | 250 | 850 | 1,050 | 1,200 |
Pennsylvania is central to the 5 gigawatt base case, its 2030 tail is material, and it may carry Meta, broader AI cloud, or future Nvidia-linked capacity. Its existence reduces the need for a large generic future plug.
Birmingham, Alabama is an owned United States site that the prior model likely pulled too far forward. We treat it as a 2027 ramp rather than a 2026 revenue engine.
Birmingham, AL | 2026 | 2027 | 2028 | 2029 | 2030 |
|---|---|---|---|---|---|
Connected MW | 0 | 250 | 300 | 300 | 300 |
Europe anchors on two sites. Béthune, France provides regional capacity and sovereignty exposure and stabilizes after 2027. Lappeenranta, Finland is a new owned 310 megawatt factory and should not be confused with the legacy Finnish capacity at Mäntsälä.
European anchors | 2026 | 2027 | 2028 | 2029 | 2030 |
|---|---|---|---|---|---|
Béthune, France | 120 | 240 | 240 | 240 | 240 |
Lappeenranta, Finland | 0 | 150 | 310 | 310 | 310 |
Mäntsälä, Finland | 75 | 75 | 75 | 75 | 75 |
The Israel sites remain meaningful and are now a smaller share of the total base. We hold the prior model's Israel total steady, while flagging Beit Shemesh as the line with the highest timing uncertainty, since full energization could push into the early 2030s.
Israel | 2026 | 2027 | 2028 | 2029 | 2030 |
|---|---|---|---|---|---|
Beit Shemesh | 40 | 58 | 180 | 222 | 222 |
Masmiyya | 44 | 64 | 64 | 64 | 64 |
Modi'in | 24 | 24 | 24 | 24 | 24 |
Israel total | 108 | 146 | 268 | 310 | 310 |
A set of smaller regional and colocation sites round out the disclosed footprint. We hold Minnesota at 31 megawatts and resist expanding it, since the location reads as downtown colocation rather than a greenfield factory, and hiring evidence supports local operations.
Regional and colocation | 2026 | 2027 | 2028 | 2029 | 2030 |
|---|---|---|---|---|---|
Minneapolis | 31 | 31 | 31 | 31 | 31 |
Kansas City colo | 40 | 40 | 40 | 40 | 40 |
United Kingdom | 16 | 65 | 65 | 65 | 65 |
Keflavik, Iceland | 10 | 10 | 10 | 10 | 10 |
Paris Saint-Denis | 5 | 5 | 5 | 5 | 5 |
The United Kingdom deployments are worth a higher revenue-per-megawatt assumption due to regulated enterprise, fintech, and sovereign workloads, with Revolut a possible flagship proof point. Kansas City functions as bridge capacity before Independence ramps. The smallest European colocations are not model-driving and serve latency and geographic diversity.
Three further sites enter as hiring-inferred or leak-inferred capacity, named explicitly so they are not buried inside a generic plug. Oklahoma carries the most support from hiring signals. Spain appears in the Q1 site map and in hiring activity. Estonia is the lowest-confidence line and is marked as such.
Inferred expansion | 2026 | 2027 | 2028 | 2029 | 2030 |
|---|---|---|---|---|---|
Oklahoma | 0 | 40 | 100 | 175 | 250 |
Spain / Madrid | 0 | 15 | 35 | 60 | 75 |
Estonia | 0 | 0 | 10 | 25 | 50 |
We do not have site-level confirmation for these three, and we treat them as named speculative capacity rather than disclosed fact. Estonia in particular should be read as optional, and it carries little weight in the bear case.
The Undisclosed Expansion Bucket
The most important modeling change in this refresh is how we treat capacity that has not been formally announced yet. We account for it deliberately, since the evidence that more is coming is strong and specific.
Nebius is expanding across four regions at once: the United States, Europe, the Middle East, and Asia. Leadership commentary points consistently to continued site growth, and hiring activity reinforces it, including in locations like Singapore and Australia that have not yet been confirmed as data center sites. The named footprint today is a snapshot of a portfolio still being built out. Holding it fixed would freeze the model in the middle of an active expansion and understate the company.
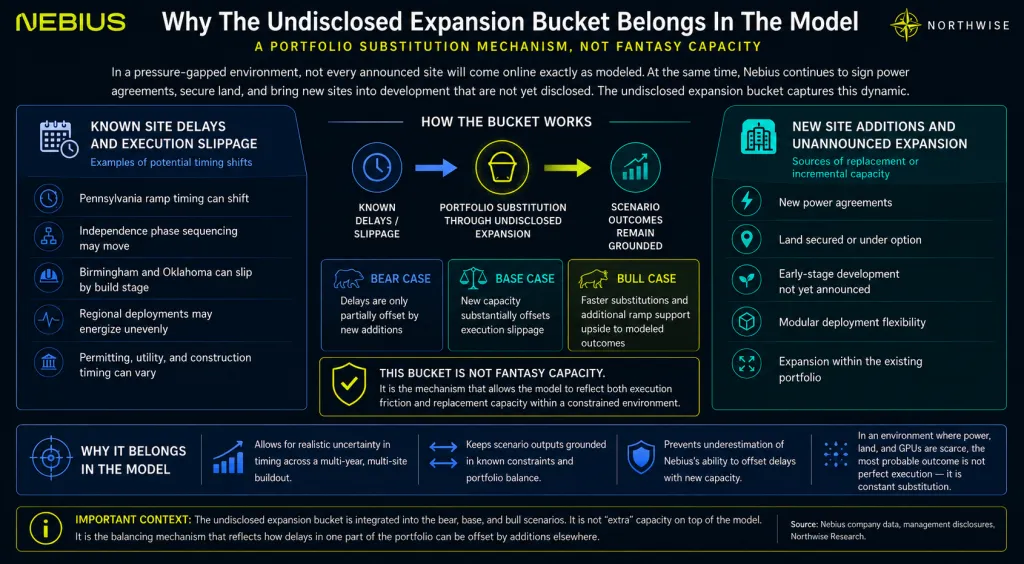
The reasoning is portfolio logic. Nebius has already outpaced its prior modeled additions. It is still adding sites. Asia capacity is likely by 2030, and new regional deployments will continue to surface. A known site can slip while an unannounced site offsets part of the delay, and the company is building a portfolio of capacity projects and is not dependent on a single campus. Diversification across that portfolio is exactly what lets new capacity absorb the timing risk of any one project.
We therefore carry an undisclosed expansion bucket in every scenario, sized to conviction rather than fantasy. It represents future announced capacity and portfolio substitution across these regions, supported by leadership commentary and regional hiring signals, not invented gigawatts.
Undisclosed bucket (connected MW) | 2027 | 2028 | 2029 | 2030 |
|---|---|---|---|---|
Bear | 100 | 200 | 250 | 300 |
Base | 175 | 425 | 600 | 739 |
Bull | 300 | 700 | 1,100 | 1,600 |
The bucket is not a lazy plug. It is how the model accounts for an expanding site portfolio in which new capacity offsets known delays, and it is why even the bear case continues to grow instead of stalling at today's named footprint.
2030 Connected MW Scenarios
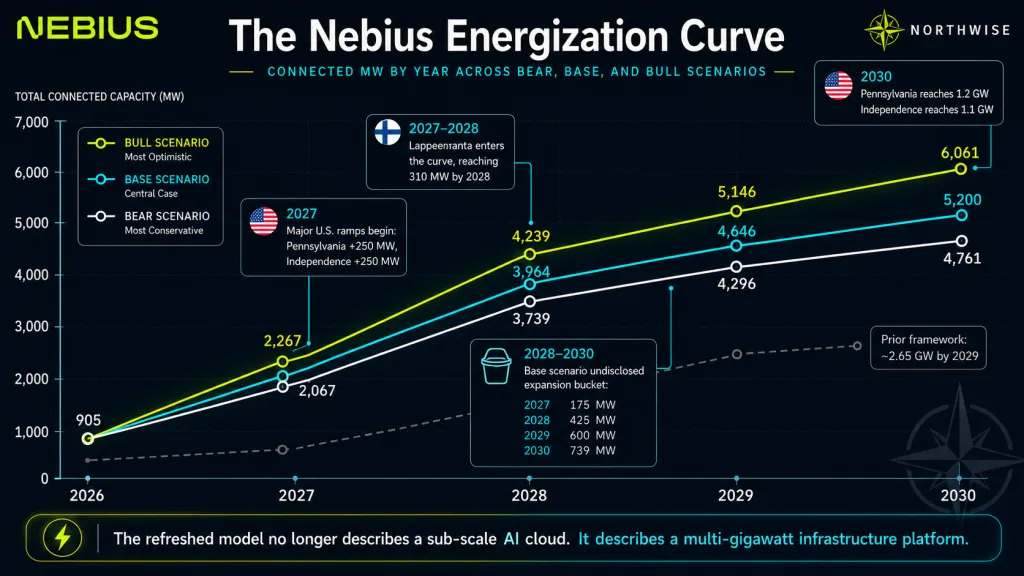
Summed across named sites, inferred sites, and the undisclosed bucket, the capacity model produces the following year-end connected megawatt totals.
As you may notice, 2026 totals are around 200MW than what we can visibly see from our energization schedule. We are electing to believe management on this; the 200 will likely come from pull forward from early than anticipated site developments, or from the undisclosed bucket.
Connected MW | 2026 | 2027 | 2028 | 2029 | 2030 |
|---|---|---|---|---|---|
Bear | 905 | 2,067 | 3,739 | 4,296 | 4,761 |
Base | 905 | 2,142 | 3,964 | 4,646 | 5,200 |
Bull | 905 | 2,267 | 4,239 | 5,146 | 6,061 |
Three features stand out. The bear case is not static, since it assumes Nebius keeps expanding at a slower and less efficiently monetized pace. The base case lands near the Nvidia-linked direction of more than 5 gigawatts. The bull case assumes faster expansion, Asia entry, additional sites, and stronger execution. The prior model's 2.65 gigawatt endpoint by 2029 is now too low against the disclosed evidence, with the base case reaching roughly 4.65 gigawatts in that same year.
Revenue Architecture: ARR per MW, and Exit ARR Versus Recognized Revenue
Megawatts set physical throughput. Revenue per megawatt sets economic throughput, and the gap between the two is where most of the modeling judgment lives.
The prior model used a revenue-per-megawatt path that began near $7.8 million in 2026 and climbed toward $10.2 million by 2029. The Q1 evidence shows that path was too low. If 2026 exit ARR reaches the high end of guidance, then $9 billion across roughly 905 connected megawatts implies close to $9.9 million per megawatt exiting 2026. The old base assumption now reads as a low-end case.
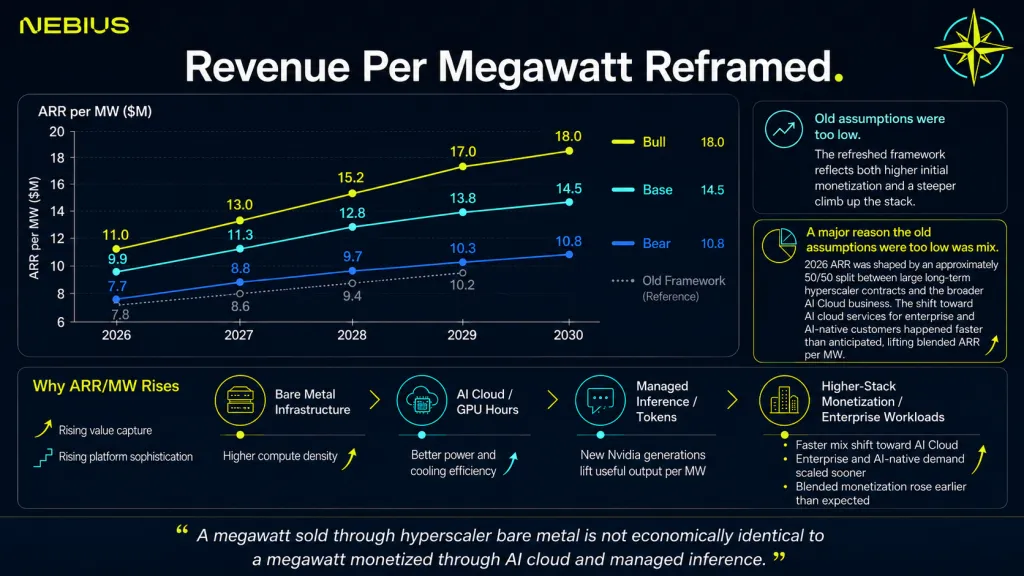
The refreshed revenue-per-megawatt path carries a wider range across scenarios.
ARR per MW ($M) | 2026 | 2027 | 2028 | 2029 | 2030 |
|---|---|---|---|---|---|
Bear | 7.7 | 8.8 | 9.7 | 10.3 | 10.8 |
Base | 9.9 | 11.3 | 12.8 | 13.8 | 14.5 |
Bull | 11.0 | 13.0 | 15.2 | 17.0 | 18.0 |
The rise is driven by higher compute density per rack, improving power and cooling efficiency, new Nvidia generations that lift useful output per megawatt, and a mix shift toward managed inference and enterprise workloads that monetize a megawatt more intensely than wholesale bare metal. Aether and Token Factory support that climb by capturing value above the hardware. We hold a deliberate ceiling here. Selected workloads may exceed $20 million per megawatt, and we do not yet carry that as a blended fleet assumption, since blending peak economics across the whole base would turn the model into mania math.
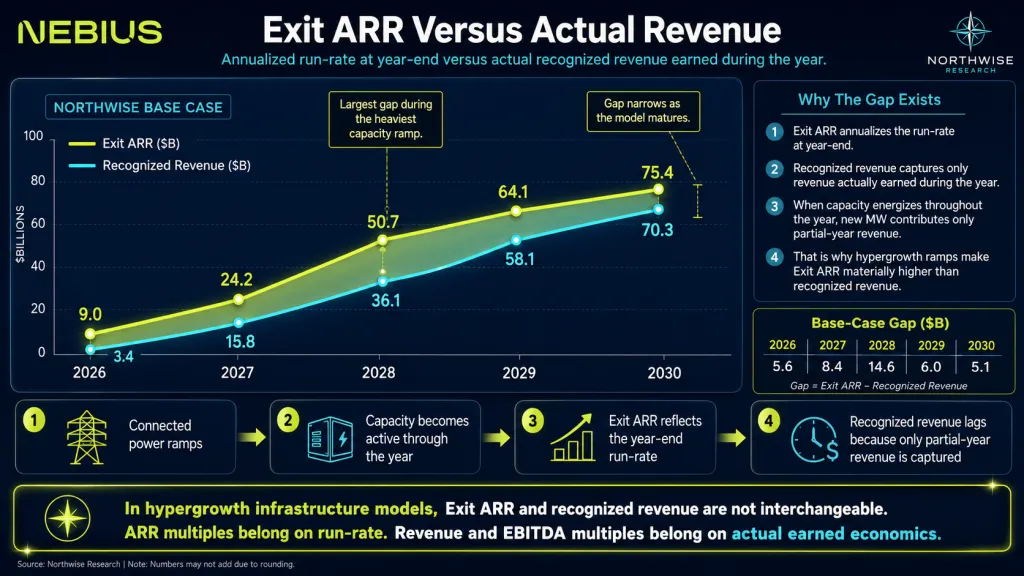
The second distinction is the one that prevents a serious modeling error. Exit ARR is the annualized run-rate at year-end. Recognized revenue is the revenue actually earned during the year. In hypergrowth, with capacity ramping throughout the year, exit ARR runs well above recognized revenue, and conflating the two would overstate near-term economics badly. EBITDA and revenue multiples should be applied to recognized revenue. ARR multiples should be applied to exit ARR.
Exit ARR ($B) | 2026 | 2027 | 2028 | 2029 | 2030 |
|---|---|---|---|---|---|
Bear | 7.0 | 18.2 | 36.3 | 44.2 | 51.4 |
Base | 9.0 | 24.2 | 50.7 | 64.1 | 75.4 |
Bull | 10.0 | 29.5 | 64.4 | 87.5 | 109.1 |
Recognized revenue ($B) | 2026 | 2027 | 2028 | 2029 | 2030 |
|---|---|---|---|---|---|
Bear | 3.0 | 12.0 | 26.3 | 40.6 | 48.2 |
Base | 3.4 | 15.8 | 36.1 | 58.1 | 70.3 |
Bull | 3.8 | 18.8 | 45.2 | 77.1 | 99.4 |
The conversion logic anchors 2026 recognized revenue to guidance, applies lower capture rates on incremental ARR in 2027 and 2028 when capacity ramps hardest through the year, and applies higher capture rates in 2029 and 2030 as the model matures and recognized revenue approaches exit ARR. The base case of roughly $75 billion in 2030 is exit ARR, not recognized revenue. Recognized 2030 revenue is closer to $70 billion, and the gap narrows by then due to the calmer ramp relative to 2027 and 2028.
CapEx and the Funding Bridge
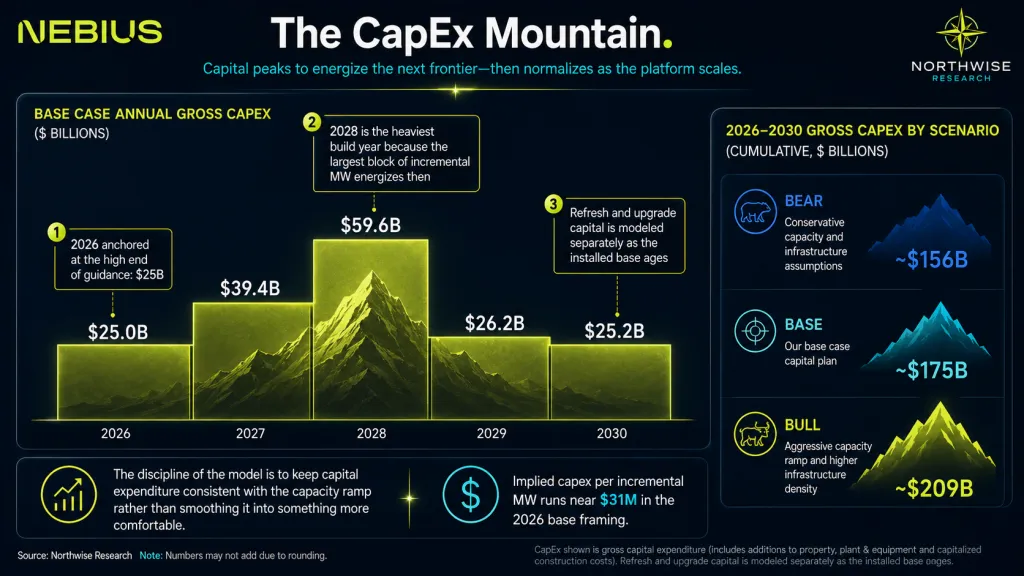
A 5 gigawatt-plus AI factory platform is not cheap to build, and the model refuses to pretend otherwise. The discipline here is to keep capital expenditure consistent with the capacity ramp rather than smoothing it into something more comfortable.
We anchor 2026 capital expenditure at the high end of guidance, $25 billion, since the company is choosing speed, demand is ahead of supply, contracts support the spend, and guidance was raised. Implied capital expenditure per incremental megawatt runs near $31 million, with refresh and upgrade spending modeled separately as the installed base ages.
Base annual CapEx ($B) | 2026 | 2027 | 2028 | 2029 | 2030 |
|---|---|---|---|---|---|
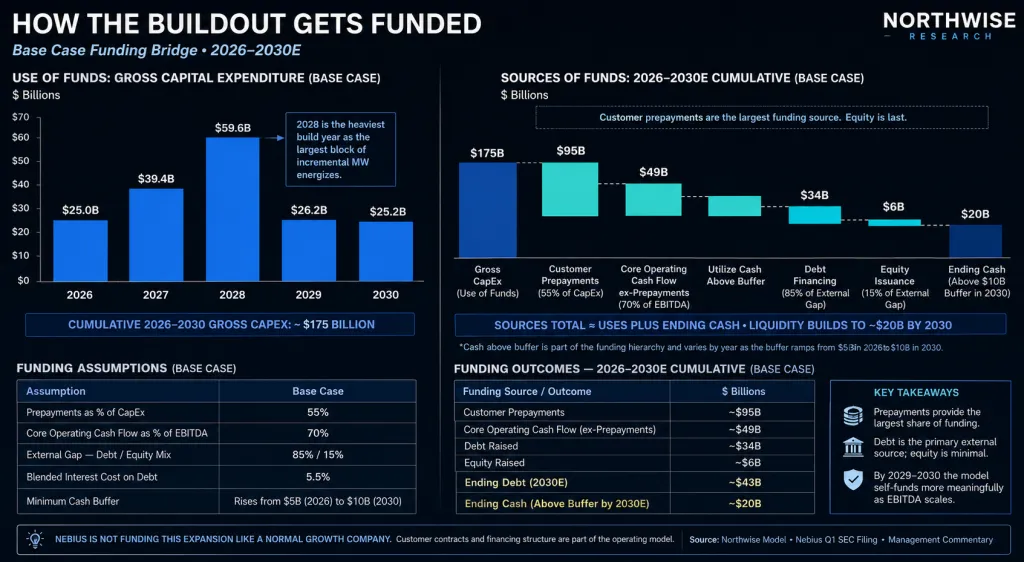
Gross CapEx | 25.0 | 39.4 | 59.6 | 26.2 | 25.2 |
Across 2026 through 2030, gross capital expenditure totals roughly $156 billion in the bear case, $175 billion in the base case, and $209 billion in the bull case. The 2028 figure is the heaviest year due to the largest block of incremental megawatts energizing, and we leave that spike intact rather than averaging it away.
The funding question is how a company guiding to $70 billion of 2030 revenue pays for $175 billion of cumulative capital expenditure along the way. The answer is a hierarchy that places equity last. The Q1 balance sheet provides the starting anchors: roughly $9.3 billion in cash, $8.45 billion in debt, $4.8 billion in deferred revenue, $7.1 billion in property and equipment, $1.6 billion in non-marketable equity investments, $2.3 billion of quarterly operating cash flow, $2.5 billion of quarterly capital expenditure, and $6.3 billion of quarterly fundraising.
The hierarchy runs from customer prepayments, to operating cash generation, to cash above a minimum buffer, to secured and asset-backed debt, to corporate debt and convertibles, to strategic asset collateral, and finally to common equity. We model prepayments as the first real funding source and take care not to double count, since deferred-revenue-driven operating cash flow should not also be counted as ordinary recurring cash generation.
The scenario funding assumptions follow.
Funding assumption | Bear | Base | Bull |
|---|---|---|---|
Prepayments, % of CapEx | 45% | 55% | 60% |
Core OCF, % of EBITDA | 60% | 70% | 75% |
External gap, debt/equity | 70/30 | 85/15 | 90/10 |
Blended interest cost | 7.0% | 5.5% | 4.5% |
The minimum cash buffer rises from $5 billion in 2026 to $10 billion by 2030. Running the hierarchy through the model produces the following cumulative 2026 through 2030 funding outcomes.
Funding outcome ($B) | Bear | Base | Bull |
|---|---|---|---|
Prepayments | ~69 | ~95 | ~124 |
Core OCF ex-prepayments | ~18 | ~49 | ~79 |
Debt raised | ~47 | ~34 | ~27 |
Equity raised | ~20 | ~6 | ~3 |
Ending debt | ~56 | ~43 | ~36 |
Ending cash | ~10 | ~20 | ~36 |
The base case is fundable. The heaviest external capital need falls in 2026 through 2028, and by 2029 and 2030 the model begins to self-fund more meaningfully as recognized revenue and EBITDA scale. The bear case is where financing turns punishing, with prepayments covering less, debt costs rising to 7%, and equity issuance climbing to roughly $20 billion. The bull case nearly removes equity from the picture, since stronger prepayments and operating cash flow carry the build.
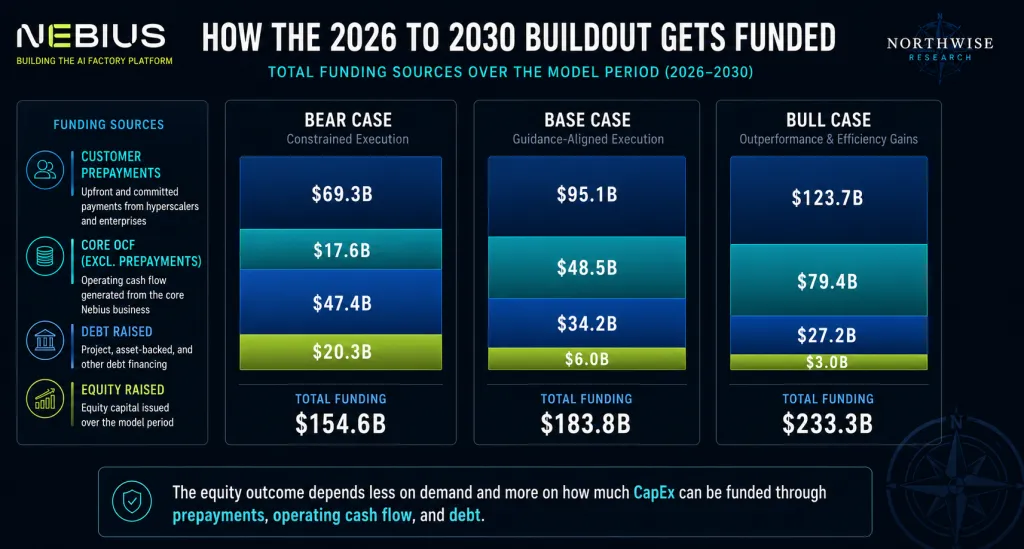
Debt over equity is the right default here on the evidence. The recent convertible priced at a low coupon with a high conversion premium, contract-backed capacity supports secured financing, and GPU clusters, data centers, customer contracts, and power commitments can serve as collateral. The strategic assets, covered below, add collateral value and monetization optionality, though we do not count them as cash unless monetized. In this model, the capital structure is not an auxiliary detail. It is part of the competitive position.
Margins, Depreciation, and the Accounting Wall
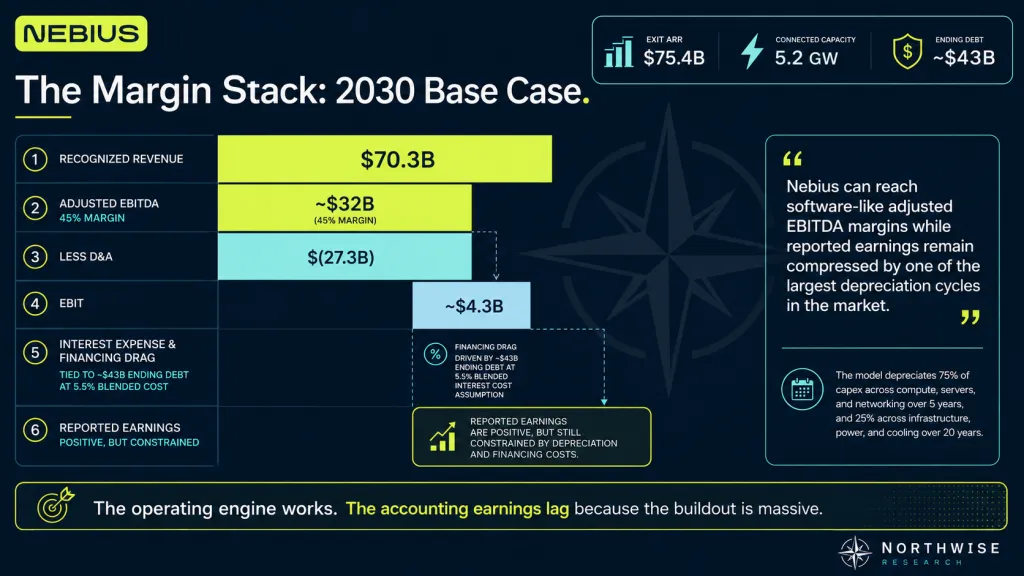
The margin story has two halves. The operating engine works. The engine is expensive to build, and the depreciation from building it sits between EBITDA and reported earnings for years.
The Q1 evidence sets the starting point. AI Cloud adjusted EBITDA margin reached 45%, group adjusted EBITDA margin reached 32%, and 2026 guidance points to roughly 40%. The base case does not assume margin expands beyond the current AI Cloud level. It assumes the current AI Cloud margin becomes more representative of the whole business as scale and mix improve.
Adj. EBITDA margin | 2026 | 2027 | 2028 | 2029 | 2030 |
|---|---|---|---|---|---|
Bear | 36% | 38% | 39% | 38.5% | 37% |
Base | 40% | 42% | 44% | 45% | 45% |
Bull | 43% | 46% | 48% | 50% | 50% |
By 2030 that produces roughly $18 billion of adjusted EBITDA in the bear case, $32 billion in the base case, and $50 billion in the bull case. The drivers are scale absorption across fixed infrastructure, improving hardware efficiency, and the mix shift toward enterprise and inference workloads.
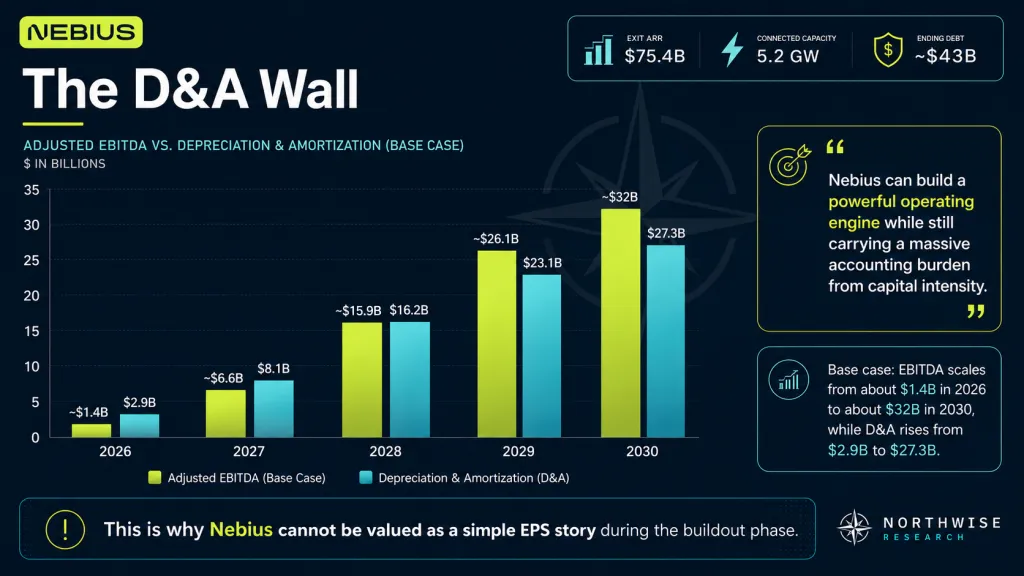
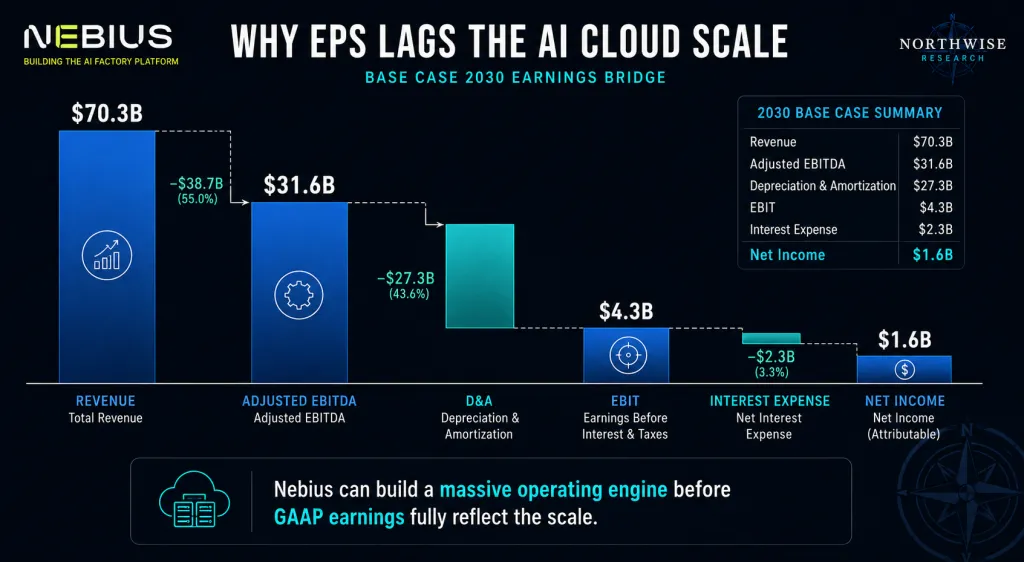
Adjusted EBITDA is not earnings, and for AI infrastructure the difference is not cosmetic. Depreciation is the cost of the build showing up on the income statement.
We split capital expenditure into 75% compute, server, and network, depreciated over five years, and 25% infrastructure, power, and cooling, depreciated over twenty years, with a half-year convention on new spend and the starting run-rate reconciled to Q1 2026.
The five-year server life reflects Nebius revising its useful-life assumption from four years to five years beginning in Q1 2026, a change that flatters near-term earnings, since AI hardware generations move quickly and economic life may not always match accounting life.
D&A ($B) | 2026 | 2027 | 2028 | 2029 | 2030 |
|---|---|---|---|---|---|
Bear | 2.9 | 7.9 | 15.3 | 21.3 | 24.6 |
Base | 2.9 | 8.1 | 16.2 | 23.1 | 27.3 |
Bull | 2.9 | 8.5 | 17.3 | 25.5 | 31.5 |
Interest expense grows with debt, at a blended 5.5% in the base case, higher in the bear case under heavier borrowing, and lower in the bull case as prepayments and stronger credit reduce net debt. The net effect on reported earnings is scenario-dependent. The bear case stays loss-making in 2030.
The base case turns positive, though earnings per share is not the headline. The bull case produces meaningful reported earnings. The base case is not yet an earnings-per-share story. It is a capacity, revenue, EBITDA, and funding story in which reported earnings lag while the company absorbs one of the largest depreciation cycles in the market.
Dilution and Share Count
We do not treat dilution as an afterthought, since it determines how much of the equity value created actually reaches existing shareholders. We model from a Q1 diluted weighted share count of roughly 309 million, noting that issued and outstanding shares differ from the diluted figure.
Share count | Bear | Base | Bull |
|---|---|---|---|
Ending diluted shares | ~442M | ~339M | ~320M |
The spread follows directly from funding. The bear case dilutes heavily as financing conditions deteriorate and equity issuance climbs. The base case dilutes modestly relative to growth, since debt and prepayments fund most of the build. The bull case barely dilutes, since the company self-funds faster and prepayments are stronger. Dilution is scenario-dependent, not ignored, and it scales inversely with execution quality.
The Sum-of-the-Parts Layer
Nebius carries strategic assets that sit outside the core AI cloud business, and we include them as a supplemental layer rather than as the reason to own the stock. These are real assets with existing value, so the range is relatively tight. We expect these assets to continue on their high growth trajectories and for some to experience liquidity events, such as a clickhouse IPO likely before 2030.
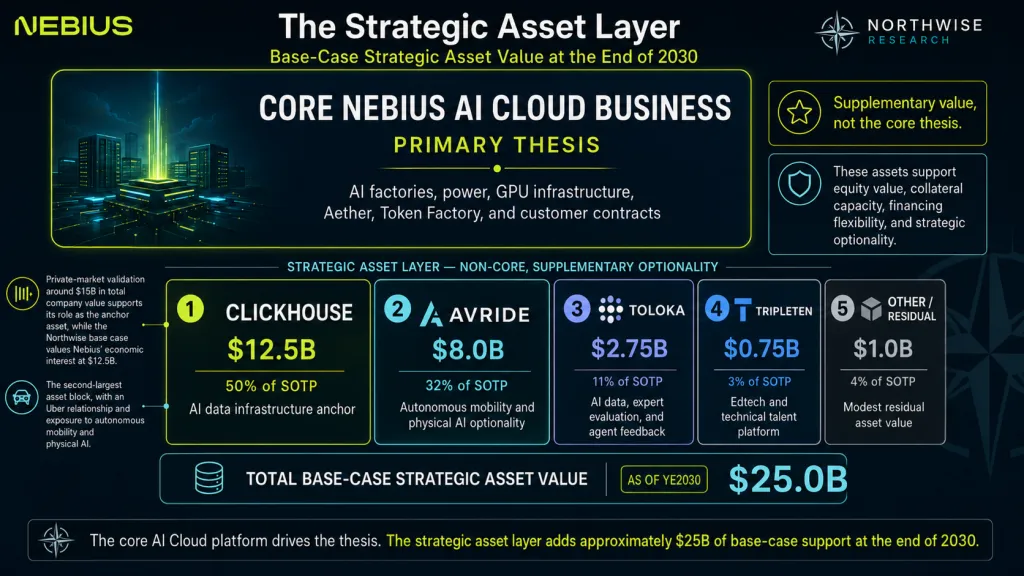
SOTP asset ($B) | Bear | Base | Bull |
|---|---|---|---|
ClickHouse | 11.0 | 12.5 | 15.0 |
Avride | 6.5 | 8.0 | 10.0 |
Toloka | 2.0 | 2.75 | 3.5 |
TripleTen | 0.5 | 0.75 | 1.0 |
Other / residual | 0.75 | 1.0 | 1.25 |
Total | ~21 | ~25 | ~31 |
ClickHouse is the sum of the parts anchor, an AI data infrastructure asset with private-market validation around $15 billion in company value, in which Nebius holds a roughly 25% stake.
Avride is the second-largest contributor, providing autonomous mobility and physical AI optionality with an Uber relationship, carrying higher variance than ClickHouse and real strategic relevance. We believe Avride will continue to become more and more important over time and could see significant tailwinds into the back half of the 2020s as digital twins, autonomous driving, and compute all coincide.
Toloka is an AI data, expert evaluation, and agent feedback business with Bezos-linked investment validation, where Nebius retained a majority economic stake while giving up voting control, and we are careful not to overvalue it.
TripleTen is a useful edtech and talent asset that we keep small. The residual line is a modest catch-all.
The sum-of-the-parts layer is not the thesis. It supports equity value, provides collateral and financing flexibility, and adds strategic optionality, and we publish it in the open as added value to readers even though it feeds the final outcomes.
Key Risks and What Would Break the Model
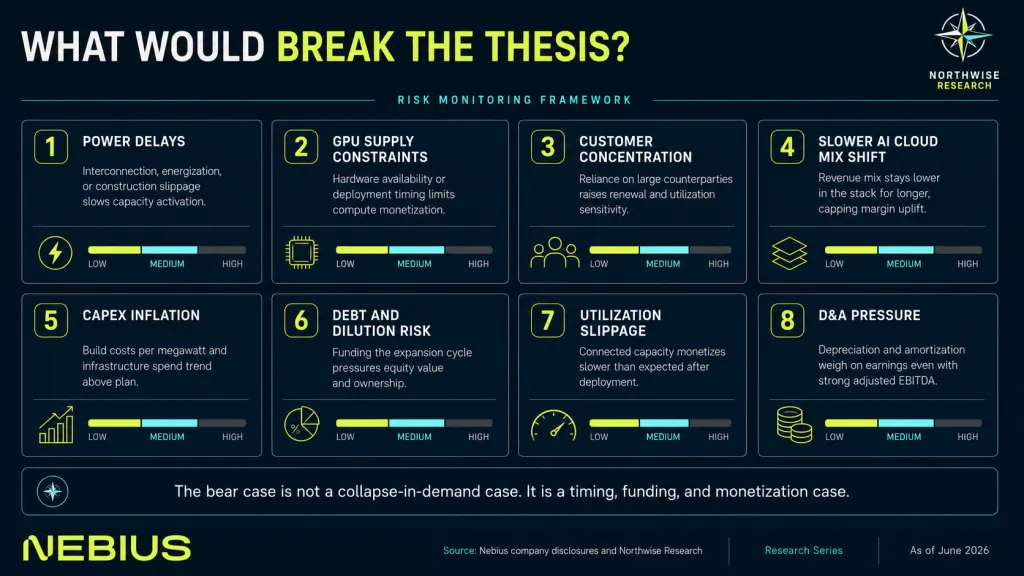
The thesis depends on many things synchronizing, so the risk section belongs before the valuation rather than after it. The most useful framing is that the bear case here is not a demand-collapse case. It is a funding, timing, mix, and accounting-pressure case.
The conversion chain can break at every link. Power can be contracted and not connected, connected and not active, active and not monetized quickly. GPU supply can slip, Vera Rubin or future Nvidia systems can arrive late, on-site power deployment can bottleneck, utility interconnections can be delayed, and permitting or local opposition can interrupt timing.
The commercial and financing risks are equally real. Customer prepayments can slow. Meta or Microsoft terms can prove less favorable than assumed, and the concentration discount can widen if dependence on two counterparties grows. The AI cloud mix may fail to improve, leaving too much low-margin hyperscaler bare metal in the base.
Token Factory may not scale, enterprise onboarding may take longer than modeled, and managed inference pricing may compress. New chips can cut price per unit faster than usage expands. Capital expenditure per megawatt can exceed assumptions, depreciation can become more punitive, debt cost can rise, capital markets can tighten ahead of the heavy 2027 and 2028 funding, the at-the-market facility can be used heavily, dilution can exceed the model, and interest expense can overwhelm EBITDA.
The external and perception risks round it out. Export controls or geopolitics can affect Nvidia systems, Israel site risk can rise, Asia expansion can fail to materialize, and the undisclosed bucket can prove too aggressive. The market can continue to value Nebius as a financed GPU landlord despite software progress, Nvidia circularity concerns can pressure the multiple, and Oracle-style skepticism about AI capital expenditure can become the dominant investor frame.
The thesis weakens materially if demand contracts while supply expands, if power cannot be energized at the projected cadence, if revenue per megawatt declines structurally on pricing pressure, if capital markets close and force distressed equity issuance, or if the enterprise mix never expands beyond hyperscaler concentration. Under those conditions the infrastructure build becomes a burden rather than a flywheel. Execution discipline, capital flexibility, and monetization intensity are the pillars that hold the thesis up.
Probability as an Underwriting Layer
We do not weight the three scenarios equally, and we do not pick round numbers. We score the probabilities against evidence, so that the weights reflect underwriting rather than mood. This is the layer that lets the model show why the base case deserves the highest weight and why the conservative case is no longer the default.
The framework scores seven evidence buckets, each carrying a fixed weight in the probability model, and reads each scenario against them.
Evidence bucket | Weight | Bear read | Base read | Bull read |
|---|---|---|---|---|
Capacity visibility | 20% | Delays across major sites | 5GW+ direction broadly achieved | 6GW+ via Asia and new sites |
Demand visibility | 18% | Demand slows or pricing compresses | Strong demand sustains utilization | Demand stays structurally short |
Financing visibility | 17% | Debt and equity costs rise materially | Prepayments and debt fund most growth | Collateralized debt sharply cuts dilution |
Monetization mix | 17% | Hyperscaler bare metal dominates | AI cloud and inference mix rises | Higher-stack workloads lift ARR/MW |
Execution record | 12% | Site timing slips broadly | Delays and new sites offset | Continues outpacing modeled additions |
Margin durability | 10% | EBITDA margin compresses | AI Cloud margin becomes group margin | Software attach expands margins |
External risk | 6% | Regulation, supply, or geopolitics disrupt | Risks manageable | Sovereignty and Nvidia alignment help |
Scored against that evidence, the model lands on the following posture.
Scenario | Probability |
|---|---|
Conservative / Bear | 18% |
Base | 55% |
Bull | 27% |
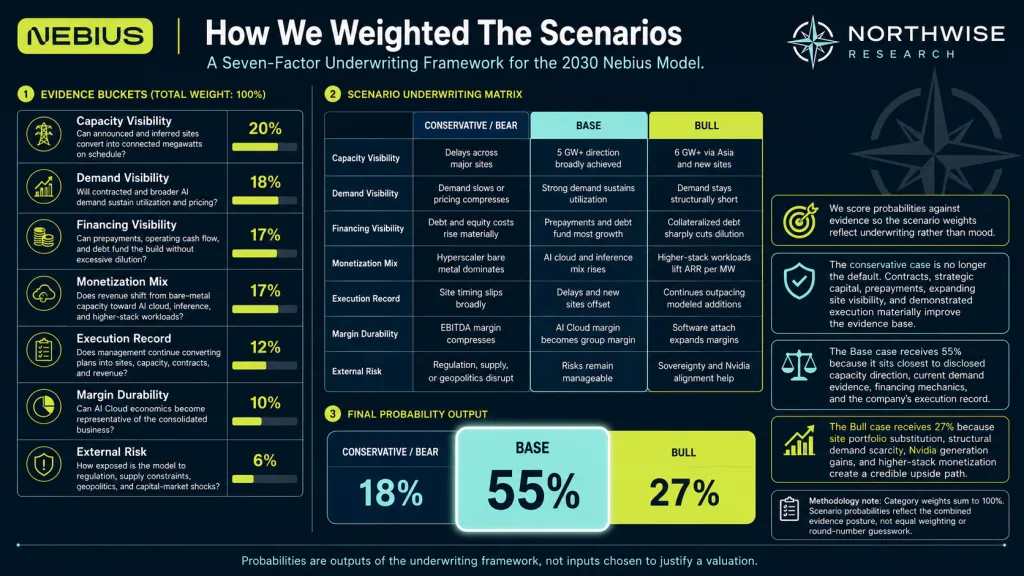
The bear weight comes down for a concrete reason. The conservative case used to mean nothing else happens, and that is no longer realistic. Nebius now holds major long-term contracts, customer prepayments, Nvidia strategic capital, Meta and Microsoft validation, a disclosed direction toward more than 5 gigawatts by the end of 2030, and a financing model management says leans heavily on prepayments.
The convertible offering was upsized at a low coupon with a high conversion premium, which is direct evidence of capital access. None of that removes downside. It does mean the downside case should not carry the weight it would have before Meta, Nvidia, the funding round, the raised capital expenditure guidance, and the new site evidence.
The base case keeps the highest weight as the most evidence-aligned scenario. It assumes roughly 5.2 gigawatts of connected capacity, about $75 billion of exit ARR, near $70 billion of recognized revenue, and roughly $32 billion of adjusted EBITDA at a 45% margin by 2030, funded mostly by prepayments and debt with limited dilution.
That is aggressive, and it is not detached from the disclosed targets. It sits close to the Nvidia-linked direction, incorporates 2026 ARR guidance, and fits Tom Blackwell's description of 2026 ARR as roughly split between large long-term contracts and the rest of the AI cloud business, alongside Roman Chernin's stack framework in which value capture rises as the business climbs from megawatts to GPU hours to tokens.
The bull weight rises above a normal bull allocation, on portfolio logic rather than optimism. Nebius is building a portfolio of sites across the United States, Europe, Israel, and likely Asia. More sites raise complexity, and they also raise substitution value, since a slip at one site can be offset by an unannounced or newer site.
The bull case also benefits from three real forces: demand running well ahead of supply, new Nvidia generations lifting monetizable output per megawatt, and more capacity sold through AI cloud, managed inference, and enterprise workloads rather than only long-term bare metal. A 27% bull weight is defensible on that basis.
The resulting posture is deliberate. The conservative case is no longer the default, since Nebius has moved past customer demand alone into hyperscaler contracts, Nvidia capital, prepayment mechanics, expanding power visibility, and a management team that has already outpaced our prior modeled additions.
The base case carries the highest weight as the closest fit to current evidence. The bull case carries a larger-than-usual weight, since this is a pressure-gapped market in which demand, financing, and site proliferation can reinforce one another. The bear case stays real, since the execution burden is enormous, and in this model even the conservative case assumes continued expansion at a slower and less efficiently monetized pace.
What the Model Proves Before We Price It
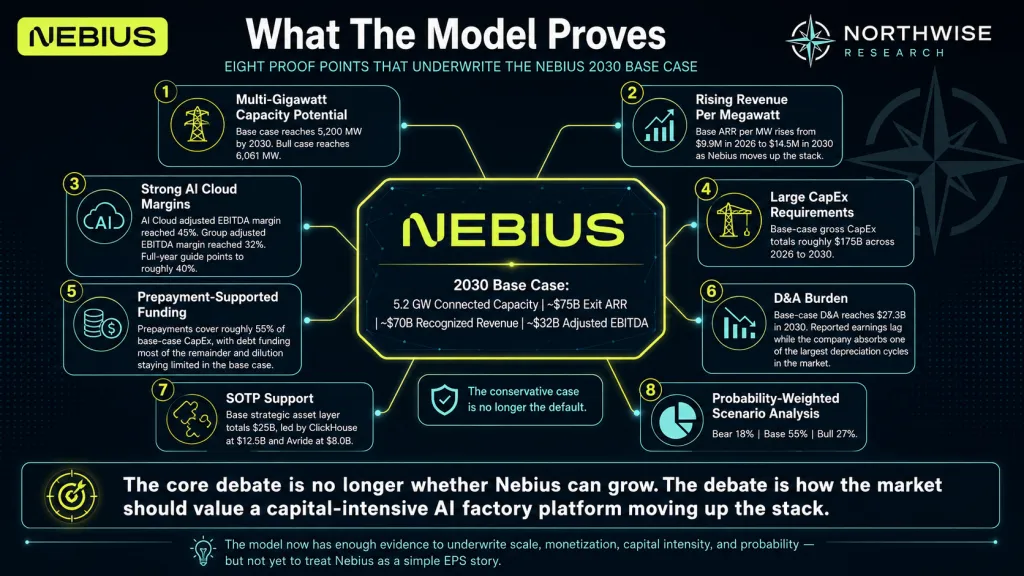
Pulling the free model together, the picture is of a multi-variable compounding machine rather than a single bet. Connected capacity scales toward roughly 5 gigawatts in the base case. Revenue per megawatt rises as the business climbs the stack.
Recognized revenue ramps behind exit ARR and closes the gap over time. EBITDA scales to roughly $32 billion. Capital expenditure is enormous, depreciation creates a long earnings lag, prepayments and debt hold dilution down in the base and bull cases, and the sum-of-the-parts layer adds meaningful support.
The debate has shifted. The question is no longer whether Nebius can grow. The question is what valuation framework fits a company growing recognized revenue at roughly a 113% compound rate while carrying tens of billions in debt and one of the largest depreciation cycles in the market. That question does not have a one-line answer, which is the whole reason the next section exists.
Why a Single Multiple Cannot Value This Business
Before we reveal any numbers, it is worth explaining how we value Nebius, since the method is as important as the output and a reader deserves to understand the machinery even on the free side of the gate.
No single multiple fits. Nebius is too early for a clean earnings multiple, since reported earnings lag behind EBITDA for years. It is too physical for a pure software multiple, since it carries data centers, power, and depreciation that no software company carries. It is too high-growth for a standard infrastructure multiple, since recognized revenue compounds far faster than a normal infrastructure asset. And it is too asset-heavy to ignore the value of the physical base itself. Any one method, used alone, distorts the answer in a predictable direction.
We therefore use a blended method that triangulates across several lenses. An exit ARR multiple captures run-rate scale at year-end. A recognized revenue multiple captures actual earned economics. An adjusted EBITDA multiple captures operating leverage, while remaining sensitive to how the market treats depreciation.
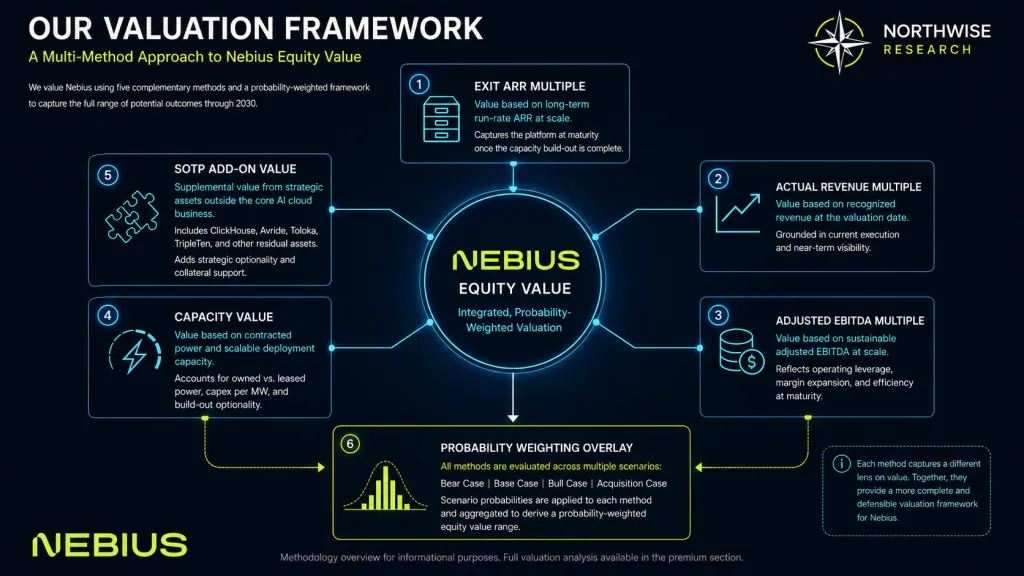
A capacity value per megawatt method captures the physical asset base as a floor. We treat an earnings multiple as a sanity check rather than a driver, given the depreciation lag. We then add the sum-of-the-parts layer, adjust for net debt, divide by scenario-specific diluted shares, and weight the scenarios by the probabilities above.
Each method carries a fixed weight, with the run-rate, revenue, and EBITDA lenses carrying more than the capacity floor, since the floor captures the asset base but not the full monetization layer on top of it.
The discount-rate choice matters as much as the multiples. We discount the probability-weighted 2030 outcome back to the present across a range of rates, since reasonable investors will disagree on the right required return for a capital-intensive, high-beta compounder. We lean toward a high required return, since the appropriate discount for this risk profile should be demanding, and we show the present value across a span of rates so a reader can apply their own.
There is one guardrail we hold throughout, and Oracle is the reason. Oracle has enormous AI infrastructure demand and a large backlog, and investors have still punished the stock when its capital expenditure and financing needs rose faster than recognized revenue.
Oracle's AI capital expenditure plans and its debt and equity financing needs triggered a sharp selloff despite strong demand and major contracts. The lesson transfers directly. The market will not value Nebius like a pure software company while it carries tens of billions in debt, a massive capital plan, and a depreciation wall.
We value it as a growth-adjusted AI infrastructure platform, with multiples that respect the growth and the margin while refusing to pretend the capital intensity is not there. That is the discipline that keeps the model from drifting into mania.
The free portion of this report ends here. We have built the entire operating model in the open: the capacity ramp, the revenue architecture, the funding bridge, the margin and depreciation structure, the sum-of-the-parts layer, the risks, and the probability weights. What remains is the part that converts all of it into a number and a plan.
The Premium Work: Valuation, Price Targets, and the Action Framework
What follows is the part of this report that takes the most labor and the most judgment, and it is the part we reserve for the members who make the work possible.
Everything above stands on its own. A reader who stops here has the full operating model, the scenario architecture, and the reasoning behind the probabilities, which is more than most research will ever show. The premium section answers the question that model was built to answer.
It holds the exact multiples by method and scenario, the per-share valuation outputs, the probability-weighted fair value, the present value across discount rates, the price target, and the Northwise action framework that translates all of it into buy, accumulate, hold, trim, and sell zones with position-sizing and monitoring guidance.
Nebius is the largest piece of research we produce, our most-followed holding, and the work we most want to keep doing well. Premium membership is what funds the next quarter of site-by-site rebuilds, the next earnings teardown, and the continuation of this Nebius coverage at the depth it requires. If the free model has earned your interest, the premium section is where we put a number to it and tell you what we are doing with our own capital.
The valuation work, scenario price targets, present value framework, position sizing, and the buy, hold, trim, and sell zones that follow are where the model becomes a decision rather than an analysis.
The Valuation Framework: Multiples by Method and Scenario
The prior model anchored too heavily to capital-intensive infrastructure multiples and gave too little credit to triple-digit revenue growth with EBITDA inflecting behind it. We are raising the multiples in this refresh. We are raising them as growth-adjusted AI infrastructure platform multiples, not pure software multiples, and the Oracle caution above is the reason the base case stops short of the levels the bull case is allowed to reach.
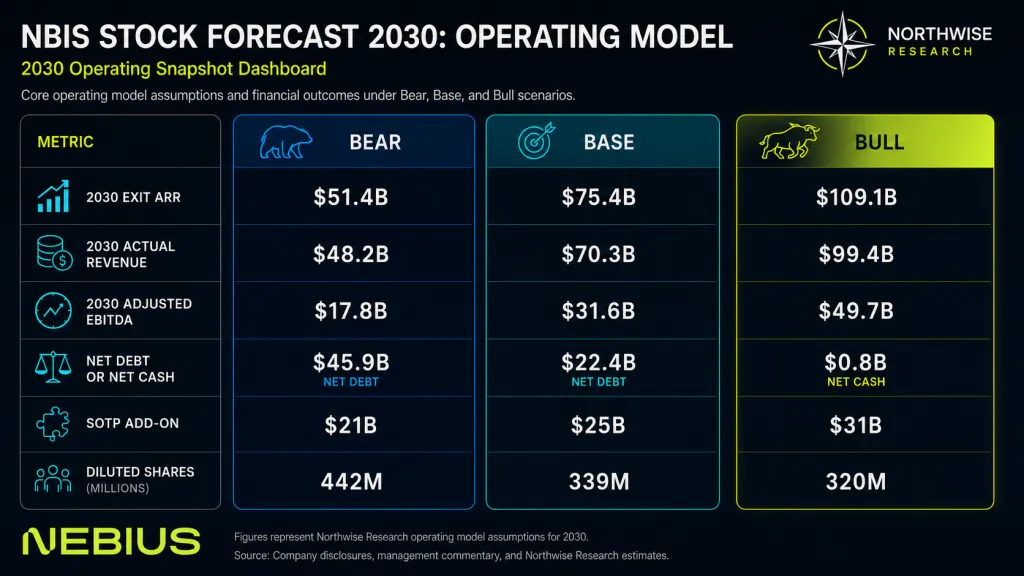
The base 2030 model describes a company at meaningful scale: roughly $75 billion of exit ARR, near $70 billion of recognized revenue, about $32 billion of adjusted EBITDA at a 45% margin, and 5.2 gigawatts of connected capacity. Recognized revenue compounds at roughly 113% from 2026 to 2030, adjusted EBITDA at roughly 118%, and exit ARR at roughly 70%. A company on that trajectory does not deserve a moderate-growth infrastructure multiple, and the revised set reflects that.
Method | Bear | Base | Bull |
|---|---|---|---|
Exit ARR multiple | 5.0x | 8.0x | 10.0x |
Recognized revenue multiple | 4.0x | 6.5x | 8.0x |
Adjusted EBITDA multiple | 14.0x | 22.0x | 30.0x |
Capacity value per MW | $30M | $45M | $60M |
We deliberately keep the base case below what the bull case allows. Exit ARR above 10x, revenue above 8x, and EBITDA above 30x are bull-case levels, not base-case levels. The reason is financing risk. With $40 billion or more of debt and heavy capital expenditure still supporting growth, the market will not treat every dollar of EBITDA the way it treats software EBITDA, and Oracle's repricing is the live warning that capital intensity caps the multiple even when demand and backlog are strong.
Scenario Valuation Results
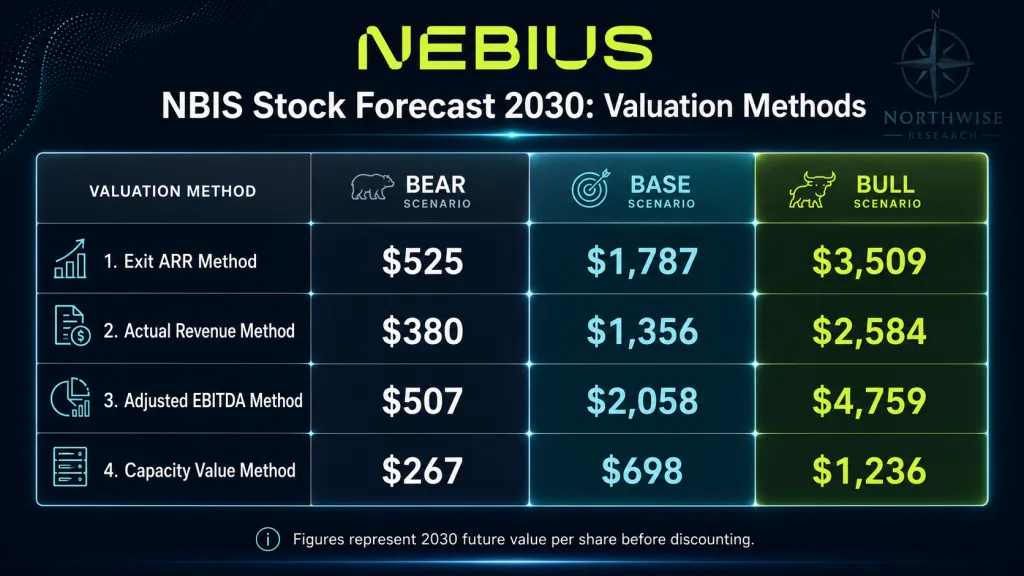
Each method is applied to the 2030 operating model, adjusted for scenario net debt and the sum-of-the-parts layer, and divided by scenario-specific diluted shares. Net debt by 2030 runs to roughly $46 billion in the bear case, $23 billion in the base case, and near zero in the bull case, against the sum-of-the-parts layer of $21 billion, $25 billion, and $31 billion respectively and ending diluted share counts of 442 million, 339 million, and 320 million.
The per-share outputs by method follow.
Method (2030 value/share) | Bear | Base | Bull |
|---|---|---|---|
Exit ARR | $525 | $1,787 | $3,509 |
Recognized revenue | $380 | $1,356 | $2,584 |
Adjusted EBITDA | $507 | $2,058 | $4,759 |
Capacity value | $267 | $698 | $1,236 |
Each lens tells a slightly different story. The exit ARR method captures run-rate market value. The recognized revenue method is the cleaner read on actual earned economics. The EBITDA method captures operating leverage and is the most sensitive to depreciation skepticism, which is exactly where the Oracle caution bites. The capacity value method is the asset floor, and it sits well below the others in every scenario, which is the point of a floor.
We blend the methods on fixed weights that lean into run-rate, revenue, and operating leverage and treat the asset base as support rather than driver.
Method | Weight |
|---|---|
Exit ARR | 35% |
Recognized revenue | 25% |
Adjusted EBITDA | 30% |
Capacity value | 10% |
Earnings multiple | 0% |
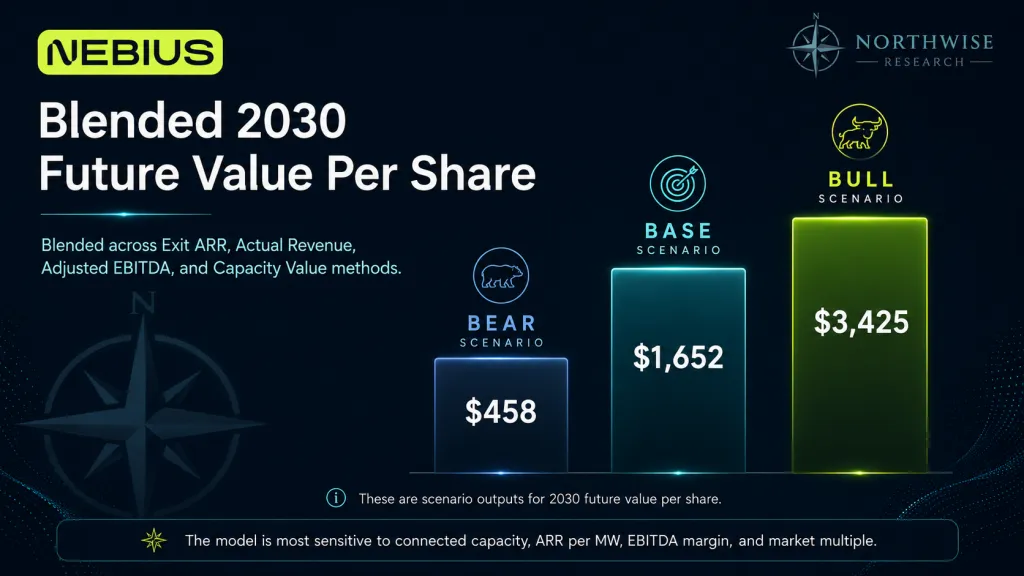
The blended 2030 fair value per share, by scenario, is roughly:
Scenario | Blended 2030 FV / share |
|---|---|
Bear | ~$458 |
Base | ~$1,652 |
Bull | ~$3,425 |
Even the bear case, carrying execution slippage, heavier dilution, and a punishing cost of capital, produces a blended value well above the current price near $300. The downside scenario clears today's price, and the base and bull cases sit well above it.
Probability-Weighted Value and Present Value
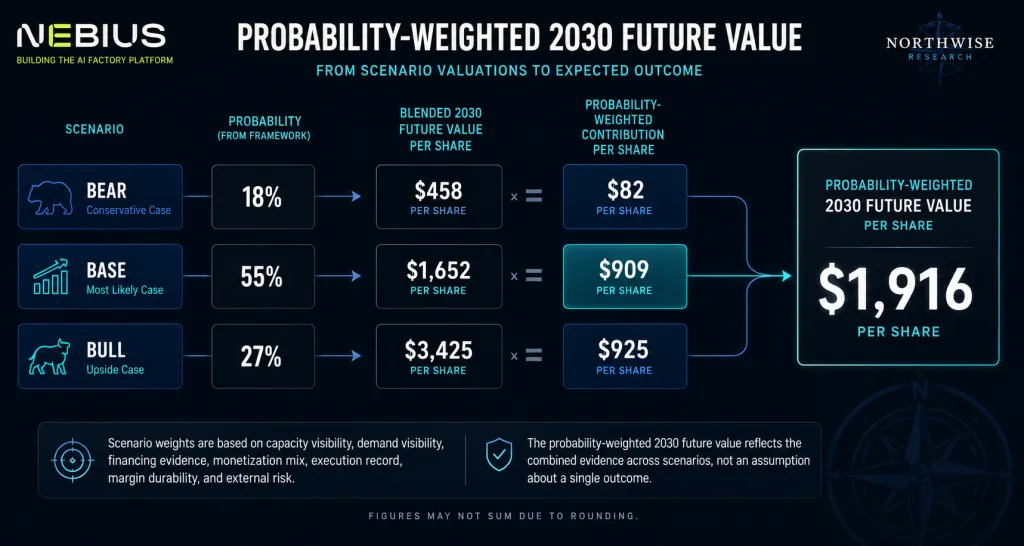
Applying the evidence-based weights of 18% bear, 55% base, and 27% bull to the blended scenario values produces the probability-weighted 2030 fair value.
Scenario | Blended 2030 FV | Probability | Contribution |
|---|---|---|---|
Bear | $458 | 18% | $82 |
Base | $1,652 | 55% | $909 |
Bull | $3,425 | 27% | $925 |
Weighted 2030 FV | ~$1,916 |
The base and bull cases contribute almost equally to the weighted outcome. The base case contributes the most certainty, while the bull case, on a 27% weight against a much higher value, pulls the expected outcome up nearly as much. That balance is the mathematical signature of a pressure-gapped market.
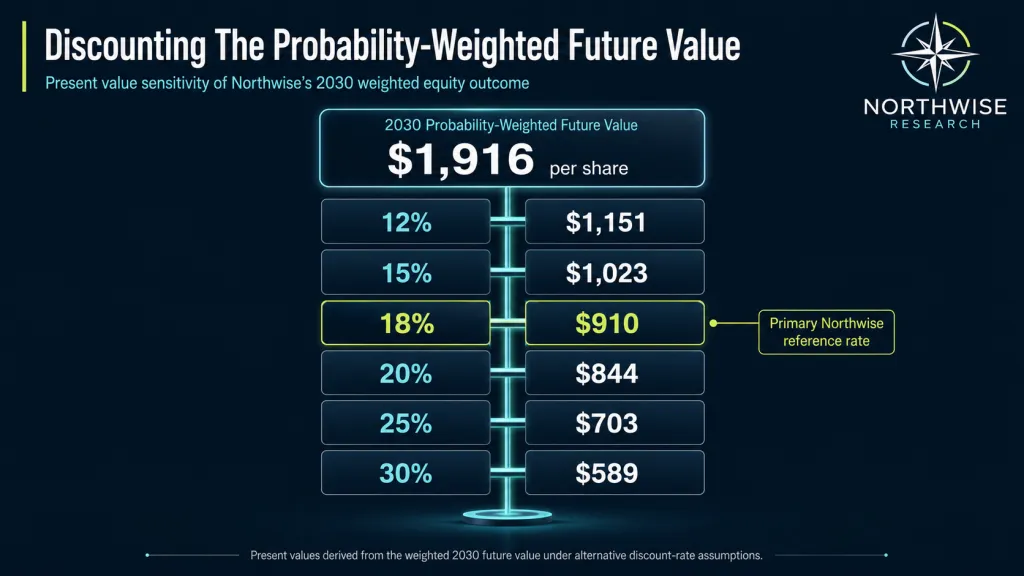
We discount the weighted 2030 fair value back across 4.5 years to year-end 2030, using a range of required returns.
Discount rate | Probability-weighted PV |
|---|---|
12% | ~$1,151 |
15% | ~$1,023 |
18% | ~$910 |
20% | ~$844 |
25% | ~$703 |
30% | ~$589 |
We headline the 18% rate, consistent with our prior report and appropriate for a capital-intensive, high-beta compounder, which places probability-weighted present value near $910 per share against a current price near $300. The prior report's probability-weighted present value at 18% was roughly $554 under its more conservative multiple set, so the combination of a faster company and revised multiples roughly lifts the discounted figure by two-thirds.
The same discounting applied to each scenario, at the headline 18% rate, frames the range cleanly.
Scenario | 2030 FV / share | PV at 18% |
|---|---|---|
Bear | $458 | ~$217 |
Base | $1,652 | ~$784 |
Bull | $3,425 | ~$1,626 |
This is a probability-weighted underwriting framework, not a point forecast. The output is a distribution. At today's price, the market is paying close to the discounted bear-case outcome and receiving the base and bull cases at little additional cost, which is precisely the kind of mispricing the model was built to surface.
The Northwise Action Framework
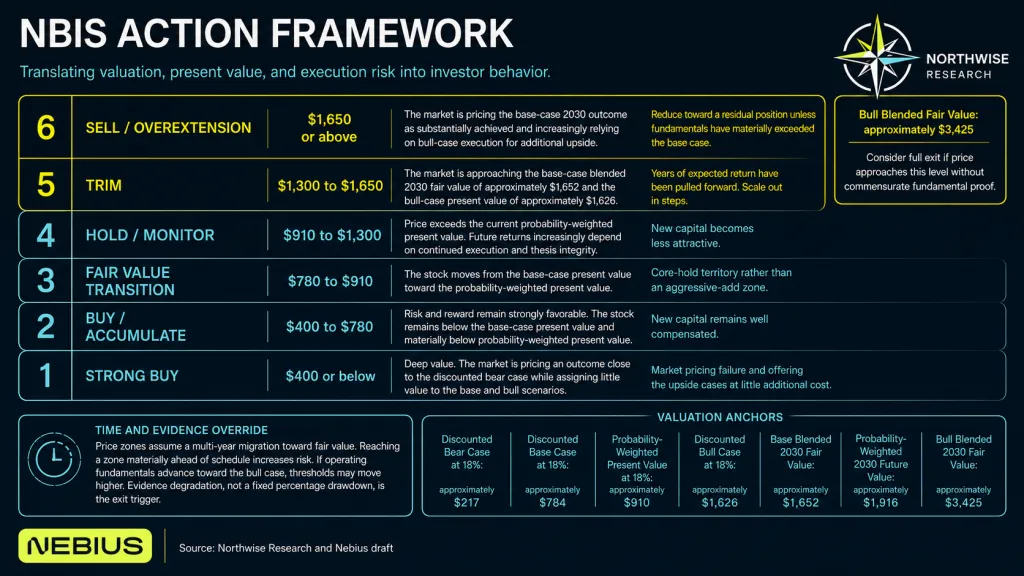
This framework translates the present values and the weighted target into zones, calibrated mostly off the weighted price targets, with the risk premium rising as price climbs above the bear line. The zones are expressed in price terms against the current level near $300.
The deep value and strong buy zone sits at or below roughly $400. Here the market is paying close to the discounted bear-case outcome plus a thin margin, which means it is pricing failure and handing a reader the base and bull cases for free. The current price near $300 sits squarely inside this zone, below the discounted bear value of $217 only on the most punishing assumptions and far below the $910 probability-weighted present value.
The buy and accumulate zone runs from roughly $400 to roughly $780, up toward the base-case present value. Risk and reward remain strongly favorable, since price still sits below today's probability-weighted present value, and new capital is well compensated.
The fair value transition zone runs from roughly $780 to roughly $910, from the base-case present value to the probability-weighted present value. A reader is now paying close to today's risk-adjusted fair value, so this is a core-hold region rather than an aggressive-add region.
The hold and monitor zone runs from roughly $910 to roughly $1,300. Price now exceeds today's probability-weighted present value, and forward returns depend on continued execution. New capital is less attractive, and the existing position is held on thesis integrity.
The trim zone runs from roughly $1,300 to roughly $1,650, approaching the base-case blended fair value near $1,652 and the bull-case present value near $1,626. Reaching this region pulls forward years of expected return, so we scale out in steps. This honors our standing principle that trimming begins well before full probability-weighted fair value is reached, so a reader is never asked to ride through most of the bull-case upside before getting an exit signal.
The overextension and sell zone sits at or above roughly $1,650. At that level the market is pricing the base-case 2030 outcome as close to achieved and leaning on bull-case perfection for further upside. Unless fundamentals have materially exceeded the base case, with capacity, revenue per megawatt, margin, and mix all tracking the bull path, we reduce toward a residual position, and we consider a full exit if price runs toward the bull blended fair value near $3,425 without commensurate fundamental proof.
One rule overrides the static price bands, and it follows directly from the calendar. These zones assume a multi-year migration of price toward fair value. If price reaches a given zone far earlier than the model expects, the risk profile changes even though the price has not.
If the stock overtakes the base-case 2030 fair value in, say, 2026 or 2027 without fundamentals having improved toward the bull path or the thesis having strengthened, that is closer to a sell than a hold, since the entire expected return has been pulled forward and what remains is bull-case-dependent. The reverse also holds.
If fundamentals move up the bull path ahead of schedule, the trim and sell thresholds shift higher with them. The framework is anchored to evidence and time, not to price alone, and stop-losses are not part of it. Evidence degradation is the exit trigger, not a percentage drawdown.
Position Sizing, Concentration Drift, and Monitoring
Sizing follows conviction, volatility tolerance, and concentration limits rather than a fixed rule. Our prior report carried an approximately 40% allocation to Nebius within the public equity portfolio and a stated tolerance for a 50% drawdown, and that posture reflected conviction calibrated to long-duration compounding rather than comfort.
Since the over 200% rise, Northwise has taken significant profits to help build out the initial positions in the rest of the premium portfolio. We still hold a 10% position and have no plans to sell shares for the foreseeable future. We will look to continue to add shares on any weakness that is not thesis altering.
Concentration drift is the practical risk most readers will actually face, and it is arithmetic rather than failure. A 10% position entered near $300 becomes a far larger share of a portfolio after a multiple-bagger, and a 50% drawdown from that elevated weight translates into a portfolio-level shock that temperament may not withstand.
Nebius is a high-beta, capital-intensive compounder, and 40% to 60% drawdowns are plausible more than once across the lifecycle, much as structurally strong AI platforms like Palantir have experienced repeated volatility on the way to scale. Trimming to manage drift is not a loss of conviction. It can serve risk normalization, psychological durability, and capital recycling at once, and a reader who trims from an outsized weight back to a tolerable one may hold the remainder through the volatility that full exposure would have made unbearable.
The objective is not to maximize theoretical return. It is to maximize the probability that a reader stays rational across the full lifecycle of a high-variance holding.
The variables we monitor map directly to the model's load-bearing assumptions: connected power against the ramp, active power against connected power, revenue per megawatt, AI Cloud margin and group margin, prepayments and deferred revenue, capital expenditure per megawatt, debt cost, equity issuance, depreciation against revenue, customer concentration, new site announcements, Asia capacity, Nvidia system access, Token Factory traction, enterprise proof points, and Meta and Microsoft expansion.
We watch three pricing tells with particular care: any sign that new-generation GPU pricing is weakening, any sign that older-generation pricing is losing support, and any sign that capacity is coming online unsold. Those three would signal that the demand-ahead-of-supply condition is breaking, which is the assumption the entire model rests on.
Final Synthesis
Nebius is one of the cleanest public expressions of the new AI infrastructure cycle, and the reason is that it is not only buying GPUs. It is attempting to control the flow of intelligence production through power, owned AI factories, Nvidia systems, hyperscaler contracts, customer prepayments, managed inference, and agentic software. If the model is even directionally right, the market is still using the wrong frame.
We said that in February, and the four months since have validated the direction while exposing our caution on speed. The company outran the model, and so did the stock, from roughly $98 to roughly $300. This refresh is our attempt to avoid making the same mistake twice, by building a larger, more capital-aware model that respects both the scale of the opportunity and the scale of the execution burden.
The opportunity is large due to the pressure-gapped market Nebius is scaling into. The risk is large due to the requirement that power, chips, construction, financing, depreciation, and customer mix all synchronize. The valuation reflects both, which is why even the bear case clears today's price and the weighted present value sits far above it.
The thesis reduces to one question. Can Nebius turn contracted power into connected power, connected power into recognized revenue, revenue into durable EBITDA, EBITDA into self-funding capacity, and self-funding capacity into a durable platform before depreciation, interest, and capital markets pressure catch up?
Power will connect or it will not. Revenue per megawatt will hold or it will not. Capital discipline will persist or it will not. The gap closes through execution, and we will track it quarter by quarter.
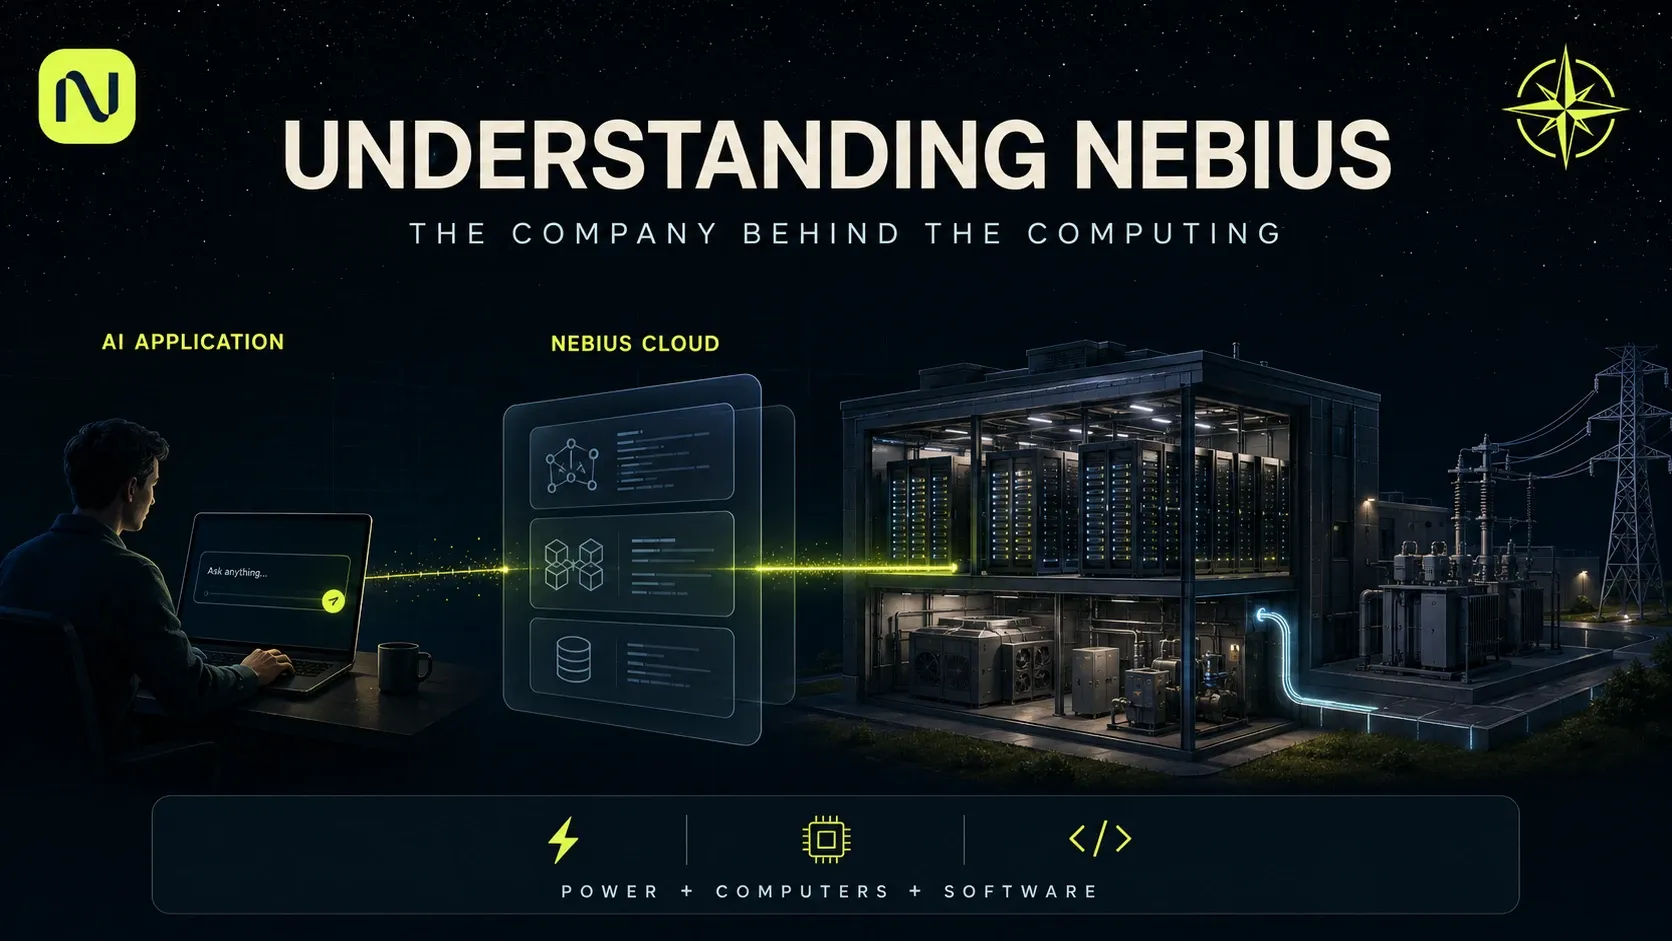
Understanding Nebius: A Complete Guide to the Company
Understand Nebius from the ground up: its AI cloud, competitors, subsidiaries, funding, and growth opportunities. A complete NBIS guide with 14 illustrations.
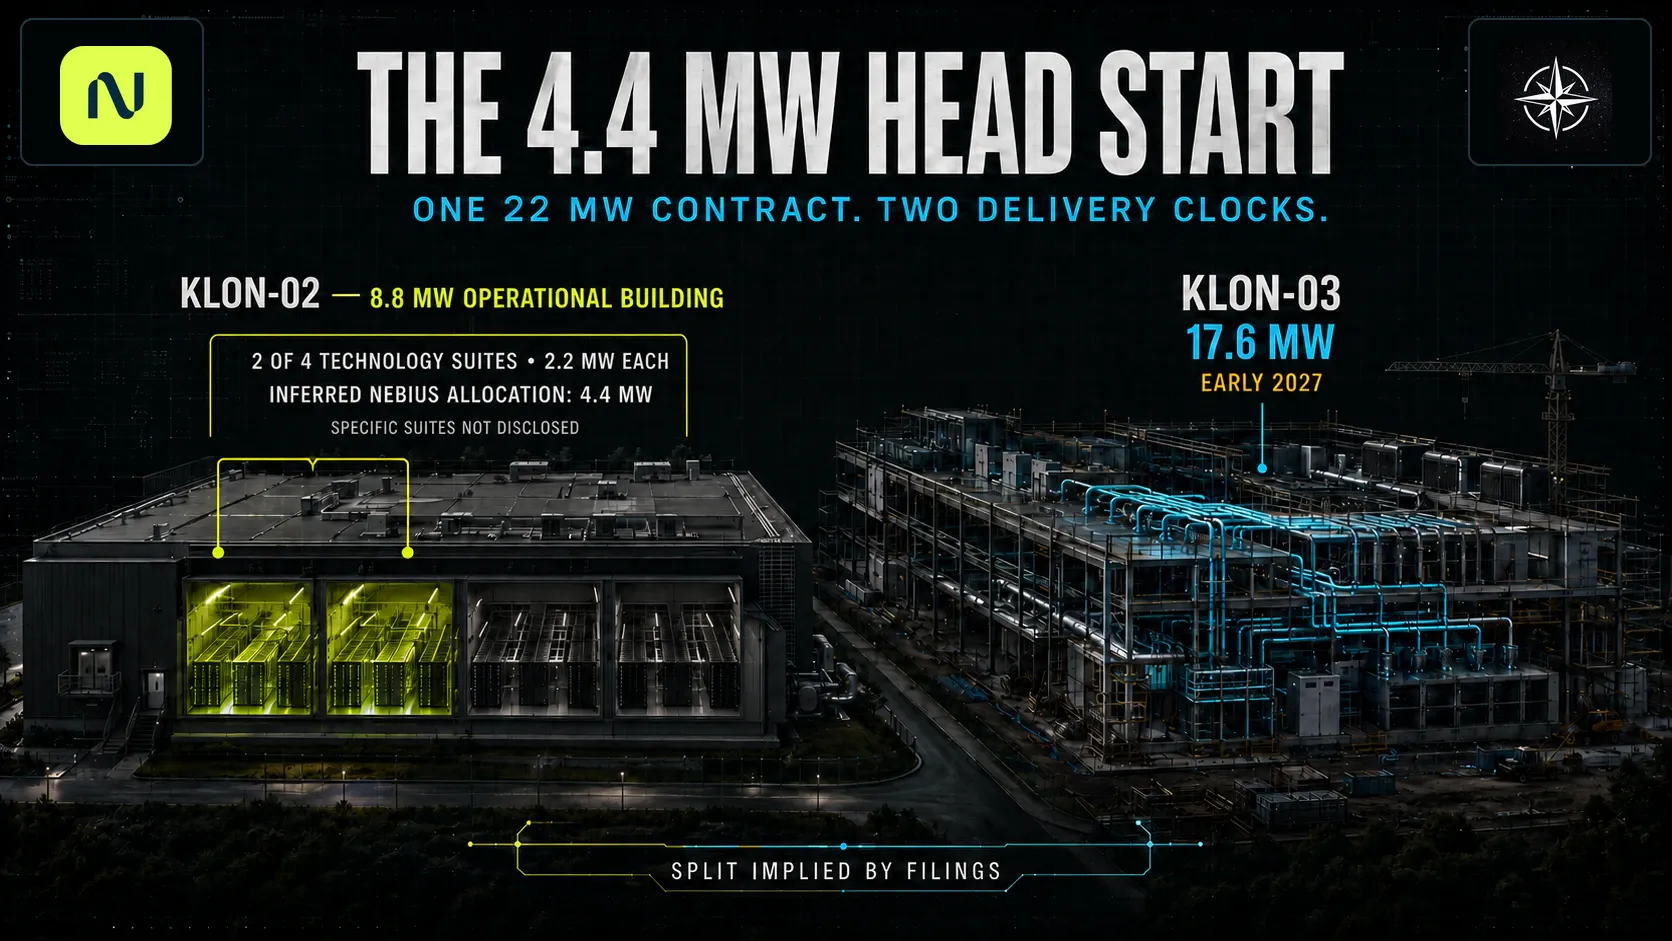
Nebius in Europe: Sovereign AI, UK Expansion and Harlow
How European AI sovereignty supports Nebius’s UK expansion, where Harlow fits, and what its potential 4.4 MW deployment could add to Q3 revenue and 2026 ARR.
NBIS Stock Forecast 2030: The Conversion Problem
A ground-up Nebius model rebuild after Q2 2026, covering AI factory economics, capital structure, valuation scenarios, and the NBIS stock forecast to 2030.
Northwise Portfolios
See how the research becomes real decisions
Reader discussion
Discuss the research
Create a Free account to join the discussion with a display name.
Create a Free Account
No comments yet. Start a thoughtful discussion.