
NBIS Minneapolis Minnesota

Minnesota: Nebius documents Woodbury, while the Minneapolis property and 31 MW allocation in the earlier study remain unconfirmed.
In this article
Nebius's current documentation identifies its Minnesota service region as Woodbury. That is the clearest location statement available in the reviewed company material. It does not confirm the downtown Minneapolis property at 1001 3rd Avenue South used as the basis of the earlier article.
This is a correction to the physical identification, not merely a new capacity estimate. The earlier building history, 21-to-31 MW expansion and technical specifications should not be treated as facts about Nebius without a verified connection between that property and its deployment.
The original article address remains available for readers and existing links. The Nebius infrastructure overview and Nebius Data Center Tracker provide the wider directory and evidence context.
What the company actually identifies
Nebius lists us-north1 as Woodbury, Minnesota, and classifies it as a private region available to customers with existing deployments. That describes a service location and its access category. It does not provide a landlord, street address or tenant power allocation. Nebius region documentation.
The company's Q2 footprint map also includes Minnesota. A state-level map and a named service city support a Minnesota presence, but neither licenses a jump to a particular downtown Minneapolis building. Nebius Q2 shareholder letter.
Why the old property match was insufficient
A data center can have an attractive location, available capacity and recent ownership changes without being the site used by a particular cloud provider. Those characteristics make it a possible research lead. Establishing the connection requires a tenant announcement, lease reference, direct company disclosure or equivalent evidence.
The earlier article relied too heavily on the apparent fit between an asset and a regional expansion. Its resulting detail gave the inference more certainty than the source supported. Building size, structural history, rack density and carrier count all depend on getting the property identity right first.
What can still be analysed
The documented private region belongs in Nebius's service footprint. It may support existing customer deployments even though it is not generally available for new selection. The service classification does not imply ownership of the property or reveal the scale of its commercial activity.
Further useful evidence would connect us-north1 to a named host and define the contracted allocation. Current equipment availability, tenant expansion and customer acceptance would then allow a more detailed operating assessment. Until that connection is made, a precise MW figure would add uncertainty disguised as precision.
The historical calculations remain examples
The earlier study included a PUE energy calculation and a rack-count illustration based on assumed power. Those calculations are preserved below without revision. They explain what the assumptions would imply, but they do not establish either the identity or the configuration of Nebius's Minnesota deployment.
The important improvement is to make the evidence boundary visible. Woodbury is the company's documented service location; the previously described Minneapolis property remains unconfirmed. The Nebius company page links to the broader business research and separately dated models. Reviewed through September 17, 2026.
Historical calculations retained from the original study
The following limited examples are preserved from the original publication. Their assumptions and outputs have not been revised. They are not current operating measurements, a new Northwise forecast or a statement of current contracted prices. The factual discussion above uses the latest reviewed evidence.
Neither the assumed 21 MW IT load nor the rack-count example establishes Nebius's allocation in Woodbury or validates the previously inferred Minneapolis property.
To contextualize scale, consider a simplified illustration:
Assumption | Value |
|---|---|
IT Load | 21 MW |
Annual Hours | 8,760 |
Baseline PUE (Warm Climate) | 1.40 |
Improved PUE (Cool Climate) | 1.30 |
Annual Energy Difference | ~18,396 MWh |
A 0.10 PUE improvement at 21 MW equates to approximately 18,000+ megawatt-hours of energy annually. At commercial electricity pricing levels, that variance compounds meaningfully over multi-year GPU depreciation cycles. At 31 MW, the efficiency delta expands proportionally.
Average Rack Density | Approximate Rack Count (IT Load Only) |
|---|---|
40 kW per rack | ~775 racks |
60 kW per rack | ~516 racks |
80 kW per rack | ~387 racks |
100 kW per rack | ~310 racks |
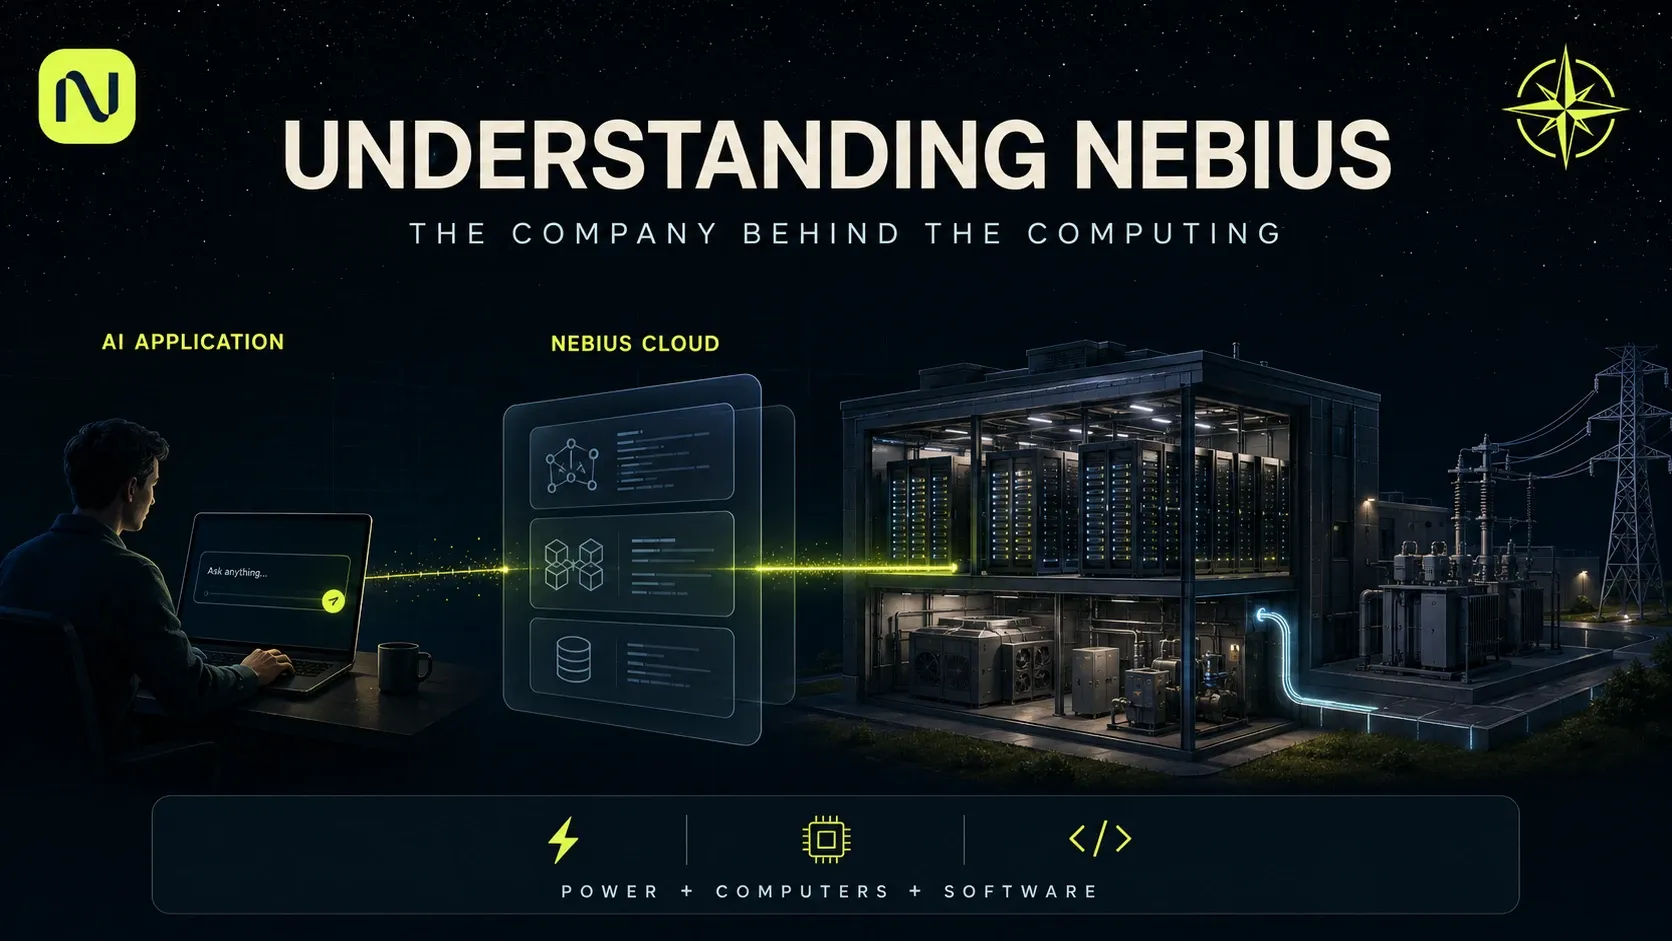
Understanding Nebius: A Complete Guide to the Company
Understand Nebius from the ground up: its AI cloud, competitors, subsidiaries, funding, and growth opportunities. A complete NBIS guide with 14 illustrations.
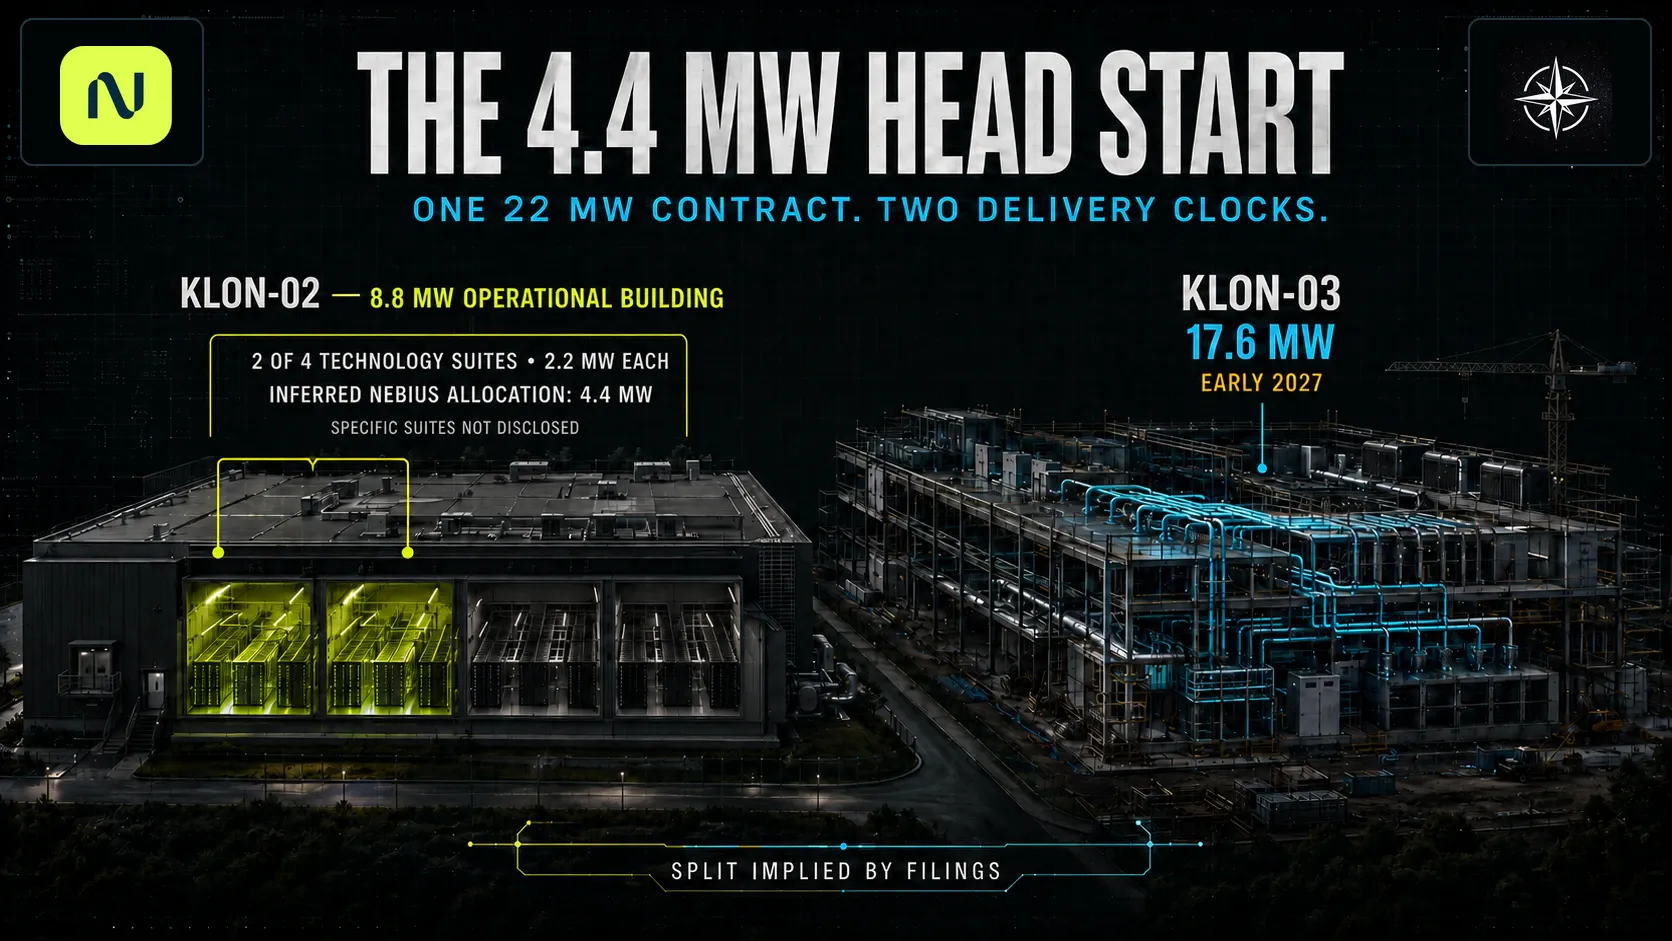
Nebius in Europe: Sovereign AI, UK Expansion and Harlow
How European AI sovereignty supports Nebius’s UK expansion, where Harlow fits, and what its potential 4.4 MW deployment could add to Q3 revenue and 2026 ARR.

NBIS Stock Forecast 2030: The Conversion Problem
A ground-up Nebius model rebuild after Q2 2026, covering AI factory economics, capital structure, valuation scenarios, and the NBIS stock forecast to 2030.
Northwise Portfolios
See how the research becomes real decisions
Reader discussion
Discuss the research
Create a Free account to join the discussion with a display name.
Create a Free Account
No comments yet. Start a thoughtful discussion.