
Keel Stock Forecast 2030

KEEL Stock Forecast 2030 models KEEL’s site ramp, dilution, capex, AI hosting revenue, and weighted target valuation through 2030.
In this article
KEEL Stock Forecast 2030: A site-by-site model of KEEL Infrastructure's AI transition, the capital burden behind it, and a probability-weighted valuation framework that explains why the equity remains highly conditional despite real underlying asset value.
1. Executive Summary
KEEL Infrastructure sits in an awkward place in the public market. The company is no longer a pure bitcoin miner, but it is also not yet a proven AI infrastructure operator. The transition is underway, the sites are real, and the power positions are genuinely scarce. The execution behind that transition has barely begun.
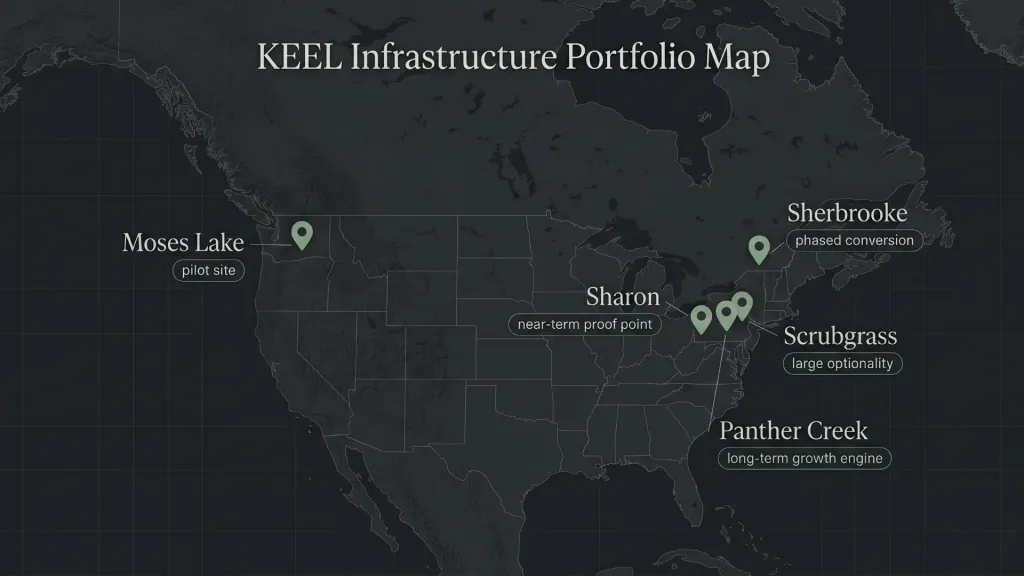
Our framework treats KEEL as a portfolio of power-linked AI infrastructure options rather than a finished operating platform. Value concentrates in five sites: Sharon, Panther Creek, Moses Lake, Scrubgrass, and a phased Sherbrooke conversion. Each site has a different role, a different proof timeline, and a different sensitivity to financing outcomes.
The central judgment is conditional. KEEL has assets that may be worth more than the market currently implies, but realizing that value requires the company to energize on schedule, lease into capacity-strained demand, secure project-level and tenant-backed financing, and avoid crushing dilution. Each of those conditions is plausible. None is certain.
This is a real opportunity, but it is an early-stage one. The model is wide because the uncertainty is wide. Readers should size positions accordingly.
Table of Contents
- Executive Summary
- What KEEL Actually Is Today
- Where the Market May Be Underweighting the Story
- The Business Model: Hosting, Colocation, and Powered Shells
- Site-by-Site Asset Review
- The Energization and Monetization Framework
- Revenue Economics by Site
- Capex, Feasibility, and the Capital Stack
- Funding Waterfall and Dilution Pathways
- Profitability Profile: EBITDA, EPS, and What the Business Really Earns
- Scenario Valuation: Bear, Base, Bull, and Acquisition
- Present Value, Margin of Safety, and Actionable Price Levels
- Risk Assessment
- Final Northwise View
2. What KEEL Actually Is Today
KEEL today is a transition story carried by a portfolio of legacy mining operations, secured power positions, and partially developed AI infrastructure sites. The company still earns cash from bitcoin mining at Sharon, Scrubgrass, and the Sherbrooke campus, and that residual activity provides a useful internal funding bridge through 2028. The mining business is shrinking in importance, and the future of the equity depends on what gets built behind it.
The strategic posture is shifting toward AI infrastructure ownership. Some of that capacity is energized. Some is secured but not yet built. Some is optionality dependent on load studies, financing, and anchor tenant negotiations. Lumping these together overstates near-term value and understates the structural quality of the underlying portfolio.
A more useful way to look at KEEL is as a bundle of four asset types. The first is operating mining capacity that throws off cash and supports early development. The second is energized AI-ready capacity at Sharon and parts of Sherbrooke that can be monetized in the near term if hosting agreements close. The third is secured but undeveloped capacity at Panther Creek and Moses Lake, where buildout is on a defined schedule. The fourth is large-scale optionality at Scrubgrass, where the upside is real but the path is still being negotiated.
Looking at the equity through current operating earnings alone misses most of what the company actually owns. That mismatch between what the income statement shows and what the asset base implies is the structural reason this stock can be interesting at the right price.
3. Where the Market May Be Underweighting the Story
The public market tends to reward operating companies and discount development companies. KEEL sits closer to the second category. The legacy mining label still dominates how some investors frame the equity, and the company has not yet produced enough commercial validation to fully shift that perception.
That framing creates a gap. Power and site control in PJM and similar grids has become genuinely scarce. Hyperscaler and large enterprise AI demand has continued to outrun new energized capacity. Operators that hold real time-to-power and shovel-ready megawatts have negotiating leverage that did not exist in the 2020 to 2022 cycle.
KEEL's portfolio includes meaningful positions of exactly that kind. Sharon offers near-term energized capacity in PJM. Panther Creek represents a large secured base with a credible path to substantially higher load. Scrubgrass holds a load study that, if even partially realized, materially expands the company's footprint. Sherbrooke provides phased conversion of already-energized infrastructure at lower marginal capex than greenfield development.
The market may be underweighting these positions because management is still unproven, financing remains a question, and the company has not yet demonstrated that it can convert energized capacity into stabilized hosting revenue at scale. That skepticism is reasonable. It is also why the opportunity exists. If KEEL produces clean execution at Sharon and Panther over the next eighteen months, the framing changes, and the multiple that the market is willing to assign moves with it.
The case here is not that the market is wrong. The case is that the market is appropriately discounting risk that has not yet been resolved, and that the resolution path is identifiable.
4. The Business Model: Hosting, Colocation, and Powered Shells
A clean read of KEEL requires distinguishing what the company is actually building from what the AI infrastructure label tends to imply. HPC describes the type of compute environment a site can support. It does not describe who owns the GPUs or who captures the compute economics. A site can support HPC workloads under several different commercial models, each with very different capex, financing, and margin profiles.
Powered shell is the most asset-light model. The operator delivers a building with power, cooling, and network capability. The tenant brings the racks, hardware, and operating responsibility. Capex per megawatt is lower, revenue per megawatt is lower, and tenant credit and lease length carry most of the risk.
Colocation sits one layer up. The operator provides the building, power, cooling, and physical hosting environment, and may provide additional services such as remote hands, network, and security. Capex is higher than powered shell, revenue per megawatt is higher, and operational sophistication starts to matter.
Managed hosting moves further up the stack. The operator takes responsibility for more of the day-to-day environment surrounding the tenant's hardware. This is where neocloud-adjacent positioning starts to appear, but it remains an infrastructure business, not a compute business.
Owned compute is the highest-touch model. The operator buys, deploys, and operates the GPUs themselves and sells compute capacity to end customers. Capex is substantially higher, hardware obsolescence risk becomes material, and the business begins to look like a cloud provider rather than an infrastructure landlord.
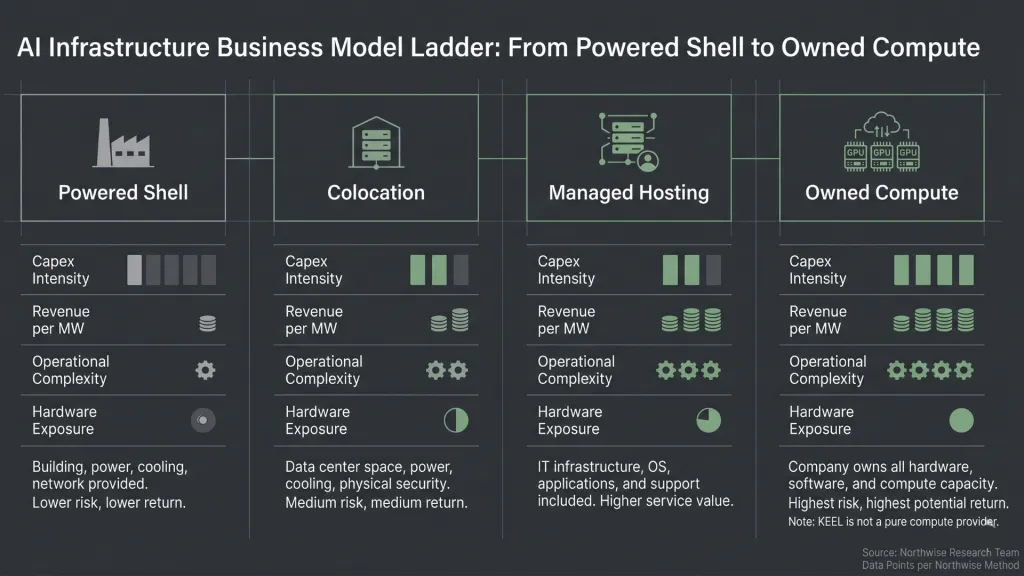
Management's recent commentary, contract structures, and capital plans point primarily toward the first three models. Moses Lake has been discussed in higher-touch terms in the past, and we treat it as the most likely site for any owned-compute optionality, but we have not modeled a broad commitment to that path. Our base assumption is that KEEL is being built primarily as an infrastructure owner serving AI and HPC demand through colocation and powered shell hosting, with managed hosting as a possible upside layer at select sites.
That choice matters because it shapes everything downstream. Capex is lower than a full neocloud build. Revenue per megawatt is lower than a full neocloud sells. Margins reflect infrastructure economics rather than compute economics. The valuation framework follows the same logic. KEEL should not be granted a higher-stack cloud multiple because AI is in the story. It should be valued as the infrastructure platform it is actually building.
5. Site-by-Site Asset Review
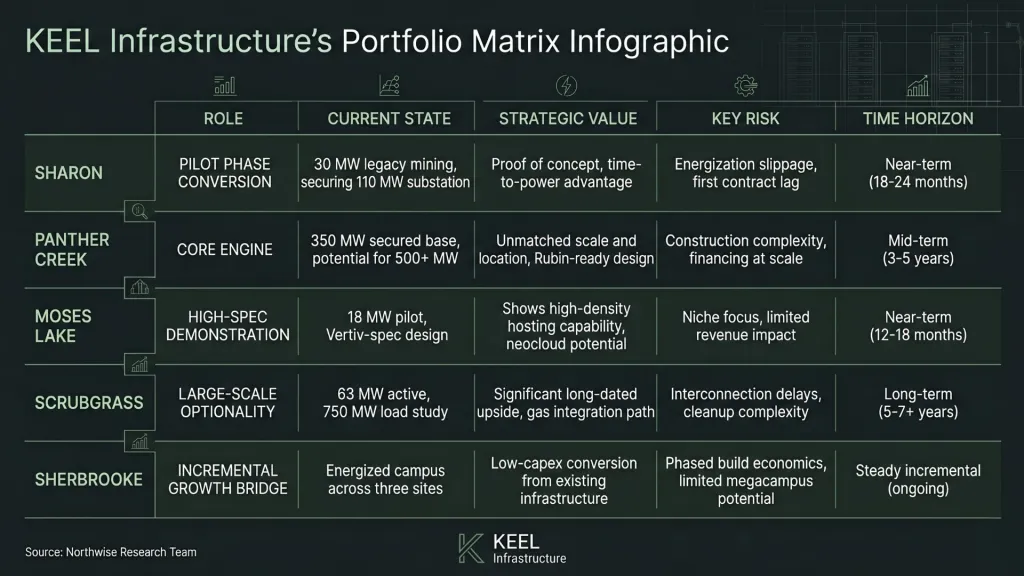
The portfolio is the thesis. Each site has a distinct role, and grouping them under a single corporate-level narrative loses most of what makes the equity interesting.
Sharon
Sharon is the cleanest near-term proof point in the portfolio. The site currently runs roughly 30 MW of legacy mining and has secured a path to 110 MW once substations complete. It sits in PJM, which gives it access to AI and HPC demand that is structurally short on capacity. The footprint is smaller than Panther, but the conversion path is more direct.
Sharon's strategic value is disproportionate to its size. It is the site most likely to deliver the first commercial validation that KEEL can energize on schedule, lease the capacity at hosting economics that justify the build, and convert a legacy mining position into contracted infrastructure revenue. A clean Sharon outcome reframes how the rest of the portfolio is priced. A delayed or compromised Sharon outcome has the opposite effect.
Sharon Site Analysis Report Link
Panther Creek
Panther Creek is the long-term engine of the portfolio. The secured base sits at 350 MW with positive indications toward 410 MW and a longer-term pathway above 500 MW. It is a large-scale PJM site with a Rubin-oriented design posture, which positions it for the next generation of accelerated compute deployments rather than the current one.
If KEEL becomes a real AI infrastructure platform rather than a portfolio of transition assets, Panther is where that becomes visible. The combination of scale, timing, and strategic location is the strongest in the company's pipeline. Panther also carries the most concentrated execution risk. A site of this size demands financing structures, anchor tenant arrangements, and construction discipline that KEEL has not yet demonstrated at this magnitude.
Panther Creek Site Analysis Report Link
Moses Lake
Moses Lake is the pilot site. At 18 MW, it is too small to carry the equity on its own, and the report should not pretend otherwise. The site is structurally interesting because of its high-spec build and its role as a demonstration of conversion capability. It is also the one site where management has discussed higher-touch hosting and GPU-as-a-service possibilities more openly.
We treat Moses Lake primarily as a hosting and colocation asset with optionality on a more integrated model. The strategic value is in what it proves rather than what it earns. A successful Moses ramp gives management a credible reference for similar conversions elsewhere, but the site itself is not a major contributor to the 2030 valuation.
Moses Lake Site Analysis Report Link
Scrubgrass
Scrubgrass is the largest source of optionality in the portfolio and the largest source of dispersion in the model. The site has 63 MW of real existing capacity, a 750 MW load study, and roughly 550 MW of natural gas optionality. Cleanup, anchor tenant negotiation, and financing are still unresolved.
The way to think about Scrubgrass is as a long-dated call option on a much larger AI infrastructure footprint. The intrinsic value of the existing 63 MW is modest. The optionality value of the load study and gas position is significant if anchor tenancy and financing come together, and close to zero if they do not. We model partial conversion in the Base case, more aggressive conversion in the Bull case, and very limited conversion in the Bear case. The dispersion is appropriate given how much of the site's value depends on milestones that have not yet been met.
Sherbrooke
Sherbrooke is already energized across three legacy mining sites. The question at Sherbrooke is conversion economics rather than energization. Garlock is the most logical first conversion site. Capex per megawatt is lower than at greenfield builds because the underlying infrastructure is in place. Revenue per megawatt is also lower because the buildout is phased and the workload mix is less optimized for the highest-touch hosting tiers.
Sherbrooke contributes meaningful, steady incremental value across the model horizon. It does not dominate the central thesis. Investors who frame Sherbrooke as a potential megacampus are likely overstating it. Investors who ignore it are likely understating the contribution that phased conversion makes to the funding stack.
6. The Energization and Monetization Framework
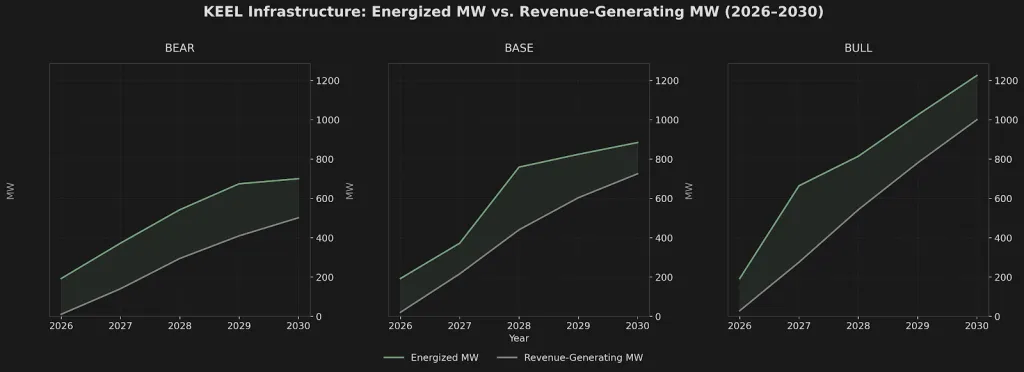
The single most important methodological choice in this model is the separation of energized megawatts from revenue-generating megawatts. A site can have power and still generate no hosting revenue. A site can be announced and still not be physically real. A site can be energized and still face lease-up lag before contracted revenue begins to flow.
Collapsing these into a single MW number turns every announced megawatt into implied near-term revenue. That overstates the model in obvious ways and produces price targets that depend on a smoother conversion path than infrastructure businesses actually deliver.
We separated three layers explicitly. Physical energized capacity reflects what the grid and substations can deliver to the site. Hosting-ready capacity reflects what is built out and operationally available for tenants. Monetized capacity reflects what is actually under contract and generating revenue. The gap between these layers is where most modeling errors occur.
We initially assumed slower conversion from energized MW to revenue-generating MW. That assumption was revised. The current AI infrastructure environment is supply-constrained, hyperscaler and enterprise demand has continued to outrun deliverable capacity, and powered shell and colocation contracts close faster than owned-compute deployments. A modest delay between energization and monetization is appropriate. A multi-year dead period is not.
The final scenario tables below reflect that revision. Sharon and Panther drive the early and mid-stage path. Scrubgrass and Sherbrooke drive dispersion later in the model. Moses contributes steadily but never dominates.
Bear case
Energized MW by site
Year | Sharon | Panther | Moses | Scrub. | Sherb. | Total |
|---|---|---|---|---|---|---|
2026 | 110 | 50 | 0 | 63 | 96 | 319 |
2027 | 110 | 350 | 18 | 63 | 96 | 637 |
2028 | 110 | 350 | 18 | 80 | 96 | 654 |
2029 | 110 | 350 | 18 | 100 | 96 | 674 |
2030 | 110 | 350 | 18 | 125 | 96 | 699 |
Revenue-generating MW by site
Year | Sharon | Panther | Moses | Scrub. | Sherb. | Total |
|---|---|---|---|---|---|---|
2026 | 10 | 0 | 0 | 0 | 0 | 10 |
2027 | 50 | 70 | 8 | 0 | 12 | 140 |
2028 | 75 | 170 | 15 | 10 | 24 | 294 |
2029 | 90 | 235 | 18 | 30 | 36 | 409 |
2030 | 100 | 280 | 18 | 55 | 48 | 501 |
Base case
Energized MW by site
Year | Sharon | Panther | Moses | Scrub. | Sherb. | Total |
|---|---|---|---|---|---|---|
2026 | 110 | 50 | 0 | 63 | 96 | 319 |
2027 | 110 | 350 | 18 | 63 | 96 | 637 |
2028 | 110 | 410 | 18 | 125 | 96 | 759 |
2029 | 110 | 410 | 18 | 190 | 96 | 824 |
2030 | 110 | 410 | 18 | 250 | 96 | 884 |
Revenue-generating MW by site
Year | Sharon | Panther | Moses | Scrub. | Sherb. | Total |
|---|---|---|---|---|---|---|
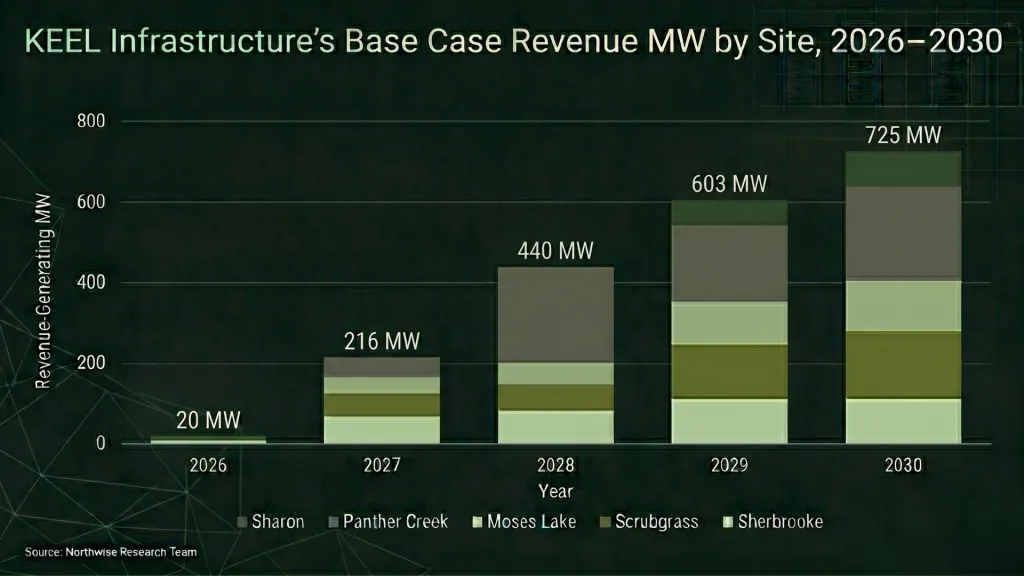
2026 | 15 | 0 | 0 | 0 | 5 | 20 |
2027 | 70 | 100 | 12 | 10 | 24 | 216 |
2028 | 95 | 240 | 18 | 45 | 42 | 440 |
2029 | 105 | 310 | 18 | 110 | 60 | 603 |
2030 | 110 | 350 | 18 | 175 | 72 | 725 |
Bull case
Energized MW by site
Year | Sharon | Panther | Moses | Scrub. | Sherb. | Total |
|---|---|---|---|---|---|---|
2026 | 110 | 50 | 0 | 63 | 96 | 319 |
2027 | 110 | 350 | 18 | 90 | 96 | 664 |
2028 | 110 | 410 | 18 | 180 | 96 | 814 |
2029 | 110 | 500 | 18 | 300 | 96 | 1,024 |
2030 | 110 | 550 | 18 | 450 | 96 | 1,224 |
Revenue-generating MW by site
Year | Sharon | Panther | Moses | Scrub. | Sherb. | Total |
|---|---|---|---|---|---|---|
2026 | 20 | 0 | 0 | 0 | 8 | 28 |
2027 | 85 | 130 | 15 | 15 | 30 | 275 |
2028 | 105 | 290 | 18 | 75 | 54 | 542 |
2029 | 110 | 400 | 18 | 180 | 72 | 780 |
2030 | 110 | 475 | 18 | 300 | 84 | 987 |
The differences between scenarios are not small. The Base case roughly doubles the monetized capacity of the Bear case by 2030. The Bull case roughly doubles the Base. The cumulative effect on hosting revenue, EBITDA, and equity value is non-linear once project financing assumptions are layered in.
7. Revenue Economics by Site
Hosting revenue per megawatt is not a single company-wide number. Different sites support different tenant types, different contract structures, and different service tiers. We anchored the framework on AI and HPC hosting economics observed at comparable platforms, with a meaningful haircut applied to KEEL because the company is earlier in its execution arc, has less commercial proof, and faces tenant quality and financing uncertainty that more established operators have already worked through.
The benchmark anchor was the Barber Lake / Fluidstack-style hosting structure that CIFR has used to reference its own AI hosting economics. We did not apply those numbers directly. We discounted them site by site based on KEEL's stage, financing risk, and likely tenant quality.
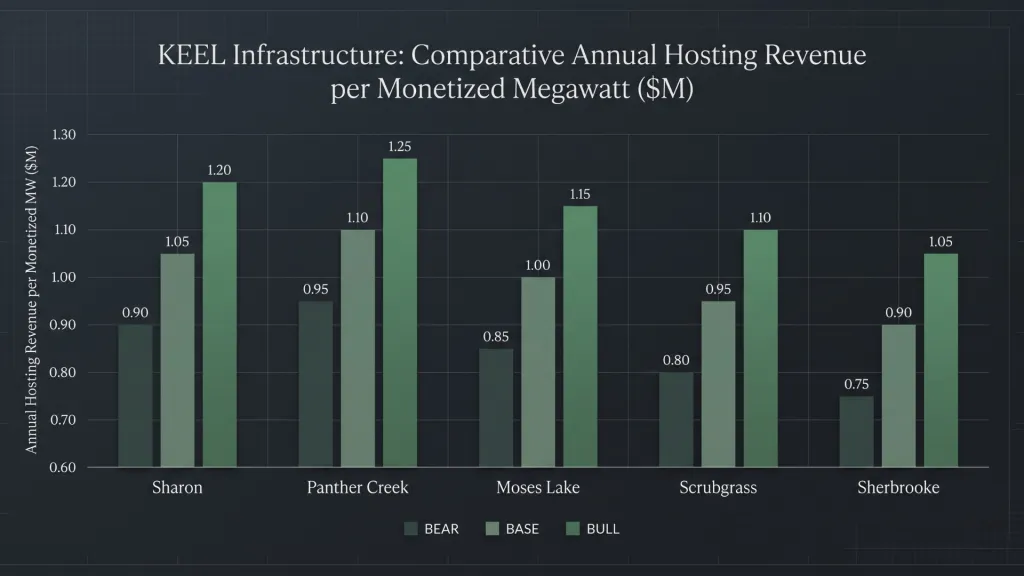
Hosting revenue per monetized MW per year ($M)
Site | Bear | Base | Bull |
|---|---|---|---|
Sharon | 0.90 | 1.05 | 1.20 |
Panther Creek | 0.95 | 1.10 | 1.25 |
Moses Lake | 0.85 | 1.00 | 1.15 |
Scrubgrass | 0.80 | 0.95 | 1.10 |
Sherbrooke | 0.75 | 0.90 | 1.05 |
Panther carries the highest revenue per megawatt across scenarios because of its scale, location, and design posture. Sharon sits just below it. Moses, Scrubgrass, and Sherbrooke step down based on stage, workload mix, and conversion economics.
Total hosting revenue ($M)
Year | Bear | Base | Bull |
|---|---|---|---|
2026 | 9.0 | 20.3 | 32.4 |
2027 | 127.3 | 226.6 | 329.7 |
2028 | 267.8 | 462.4 | 648.4 |
2029 | 370.5 | 627.7 | 926.3 |
2030 | 451.3 | 749.5 | 1,164.7 |
Panther is the largest revenue contributor across all three scenarios. Sharon contributes the earliest, with most of its potential reached by 2028. Scrubgrass becomes meaningful only in the Base and Bull cases, and only as load study milestones convert into contracted capacity. Sherbrooke is incremental rather than dominant. Moses contributes steadily but never moves the company-level number by much.
The shape of these revenue curves matters as much as the levels. The Base case shows roughly 35x revenue growth from 2026 to 2030, with the steepest acceleration between 2026 and 2028. That period is when most of the capex and financing pressure also lands.
8. Capex, Feasibility, and the Capital Stack
The site portfolio is interesting. The capital plan to build it out is the constraint. KEEL's path to the revenue numbers above depends on financing structures that the company has not yet fully demonstrated.
We modeled site-specific capex per megawatt rather than a single blended number, because the build economics differ significantly across the portfolio.
Capex per MW by site
Site | Capex / MW |
|---|---|
Sharon | $6.8M |
Panther Creek | $6.0M |
Moses Lake | $7.1M |
Scrubgrass | $5.0M |
Sherbrooke conversion | $3.0M |
Moses Lake is the highest because it is anchored to the disclosed Vertiv project specifications and reflects a higher-spec build. Sharon and Panther are expensive but slightly below Moses on a per-megawatt basis. Scrubgrass is lower because phased optionality assumptions reduce the marginal cost of the next megawatt. Sherbrooke is the cheapest because conversion from existing energized infrastructure is materially less capital-intensive than greenfield development.
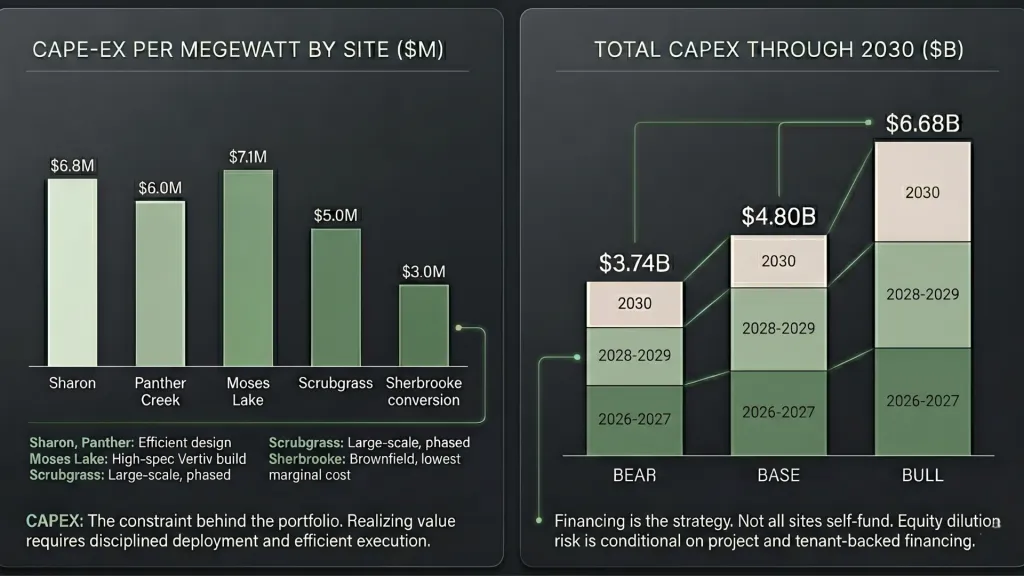
Total capex through 2030
Scenario | Total Capex |
|---|---|
Bear | $3.74B |
Base | $4.80B |
Bull | $6.68B |
Earlier versions of the model understated capex in the Base and Bull cases because they did not fully scale Panther and Scrubgrass expansions with the corresponding capex. That was corrected. The Bull case requires more capital than the Base case because it builds more, not because it pays more per megawatt.
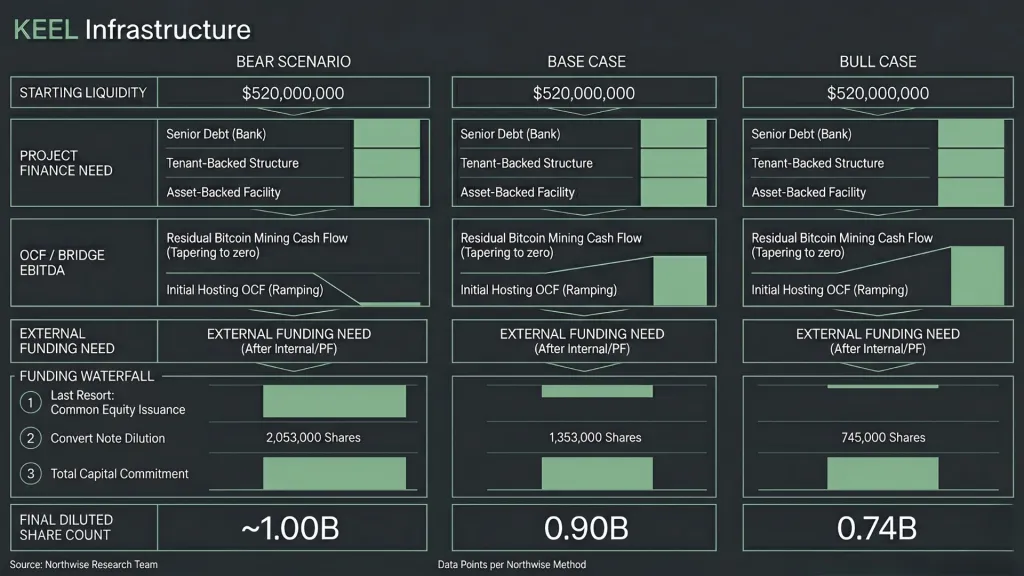
KEEL enters this period with roughly $520M of liquidity, comprised of approximately $359M in cash and $161M in unencumbered bitcoin. After reserving a corporate liquidity floor, the company has meaningful capacity to fund early development at Sharon and the initial Panther phases, but cannot self-fund the full buildout. The model assumes the rest is financed through some combination of project finance, tenant-backed structures, asset-backed facilities, and as a last resort, common equity.
The financing assumptions vary by scenario based on execution quality. In the Bear case, project finance covers 60% of buildout capex, reflecting a world in which tenant credit and contract terms do not support more efficient structures. In the Base case, project finance reaches 70%. In the Bull case, project finance covers 80%, reflecting a world in which Sharon and Panther produce clean lease validation that supports more aggressive tenant-backed and asset-backed financing across the rest of the portfolio.
The case for KEEL is not that the company funds everything internally. The case is that early sites de-risk the financing stack enough that later sites do not require equity dilution as the primary funding source. Whether that condition is met is the central financing question for the equity.
9. Funding Waterfall and Dilution Pathways
Annual capex schedules are uneven across the model horizon. Most of the funding pressure lands in 2026 and 2027, when Sharon, Panther, and the early Scrubgrass phases all draw capital simultaneously. By 2029 and 2030, the build moderates and operating cash flow begins to cover a larger share of incremental investment.
Annual capex by scenario ($M)
Year | Bear | Base | Bull |
|---|---|---|---|
2026 | 1,108.9 | 1,163.6 | 1,336.0 |
2027 | 1,218.9 | 1,359.4 | 1,620.8 |
2028 | 731.9 | 999.7 | 1,332.8 |
2029 | 433.5 | 724.2 | 1,233.0 |
2030 | 251.6 | 555.0 | 1,155.3 |
Two adjustments materially improved the funding picture relative to earlier model iterations.
The first was residual mining bridge cash flow. KEEL still operates legacy mining capacity at Sharon, Scrubgrass, and Sherbrooke that the model originally underweighted. The bridge contribution fades as conversion accelerates, but it provides a useful internal source of funding through 2028.
Bridge EBITDA by scenario ($M)
Year | Bear | Base | Bull |
|---|---|---|---|
2026 | 35 | 40 | 45 |
2027 | 25 | 30 | 36 |
2028 | 15 | 20 | 24 |
2029 | 7 | 10 | 12 |
2030 | 0 | 0 | 0 |
The mining bridge helps. It does not drive the thesis. It modestly improves the transition economics and reduces the early-year external funding need. It does not save the model in a scenario where hosting ramp underperforms.
The second adjustment was operating cash flow available for growth capex. Earlier versions of the model assumed near-zero operational contribution. Once hosting revenue begins to scale at Sharon and Panther, the business generates real cash that can offset a portion of incremental investment.
Operating cash flow used for growth capex ($M)
Year | Bear | Base | Bull |
|---|---|---|---|
2026 | 30 | 37 | 48 |
2027 | 51 | 71 | 115 |
2028 | 57 | 111 | 187 |
2029 | 67 | 138 | 244 |
2030 | 73 | 155 | 296 |
Combining bridge EBITDA with operating cash flow produces the revised external funding need across scenarios.
External funding need after OCF
Scenario | Net External Need |
|---|---|
Bear | $850.0M |
Base | $566.6M |
Bull | $150.5M |
The Bear case still requires real outside capital. The Base case becomes manageable but meaningful. The Bull case becomes far cleaner if operations and project financing both work as modeled.
That external funding need translates into share issuance through a waterfall that prioritizes project finance, tenant-backed structures, and asset-backed facilities, with common equity used only when those sources are exhausted.
Final waterfall issuance and diluted share counts
Scenario | Waterfall Issuance | Convert Note Dilution | Fully Diluted Shares |
|---|---|---|---|
Bear | 310.2M | 85.7M | 998.8M |
Base | 206.8M | 85.7M | 895.4M |
Bull | 54.9M | 85.7M | 743.5M |
For working purposes, the diluted share counts round to roughly 1.00B in the Bear case, 0.90B in the Base case, and 0.74B in the Bull case.
Dilution matters. It does not destroy the Base or Bull cases as long as project financing and operational cash generation work together. In the Bear case, dilution becomes a significant drag on equity value because external funding need is high and the per-share economics of the business are weaker.
The remainder of this report covers the profitability profile, full scenario valuation, probability-weighted price targets, present-value framework, actionable buy and hold ranges, and the risk assessment that sits behind them. These sections are available to Northwise premium members.
Northwise Premium
Choose how to continue with Northwise
Join Northwise Premium
Unlock the rest of this report, its complete valuation, the downloadable model, portfolios, and action framework.
Join Northwise PremiumCreate a Free Account
Continue across Free Northwise research, follow companies, save reports, and receive updates.
Create a Free Account
KEEL Stock Forecast 2030: The Price of Patience
KEEL’s 2030 forecast follows five AI infrastructure sites through construction, tenant acceptance, debt, dilution and the cash left for shareholders.
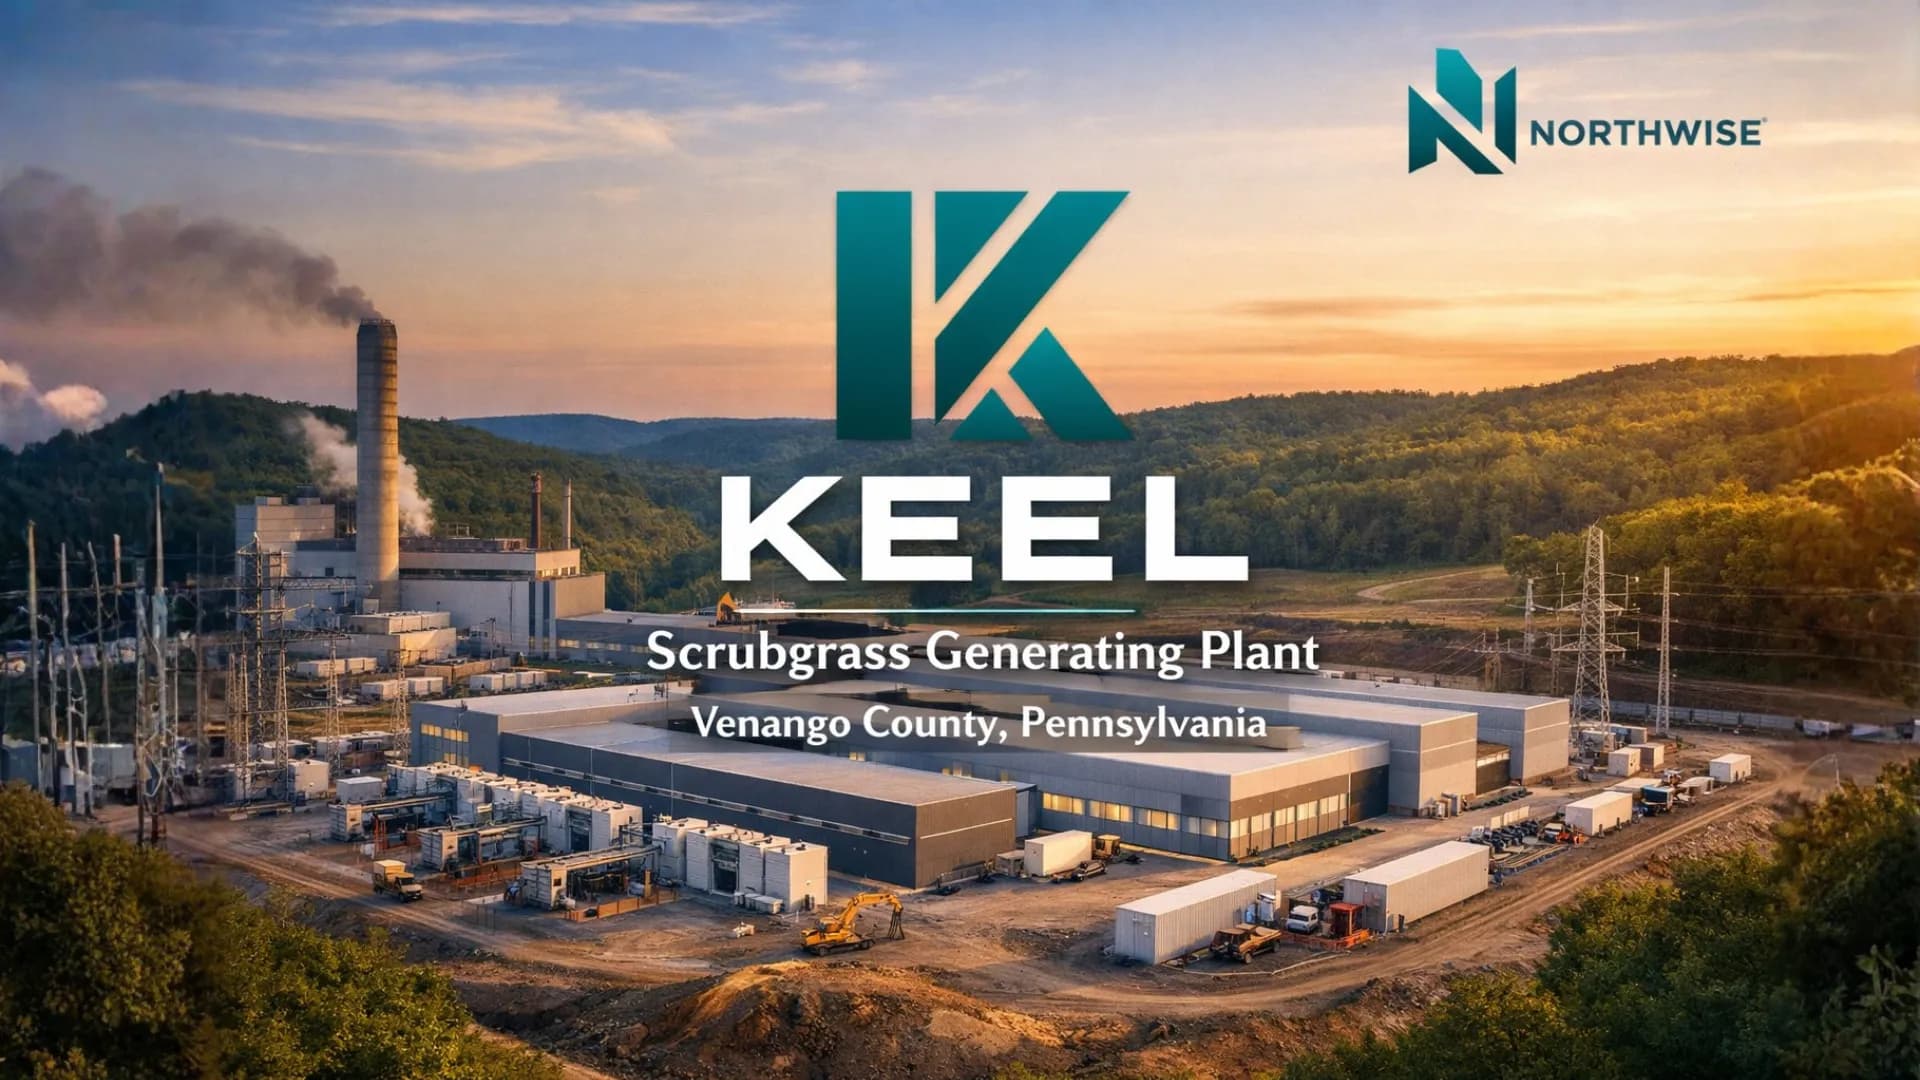
KEEL Scrubgrass Site Analysis
Scrubgrass: legacy generation, the potential 1.3 GW campus and the power, environmental and commercial work still required.
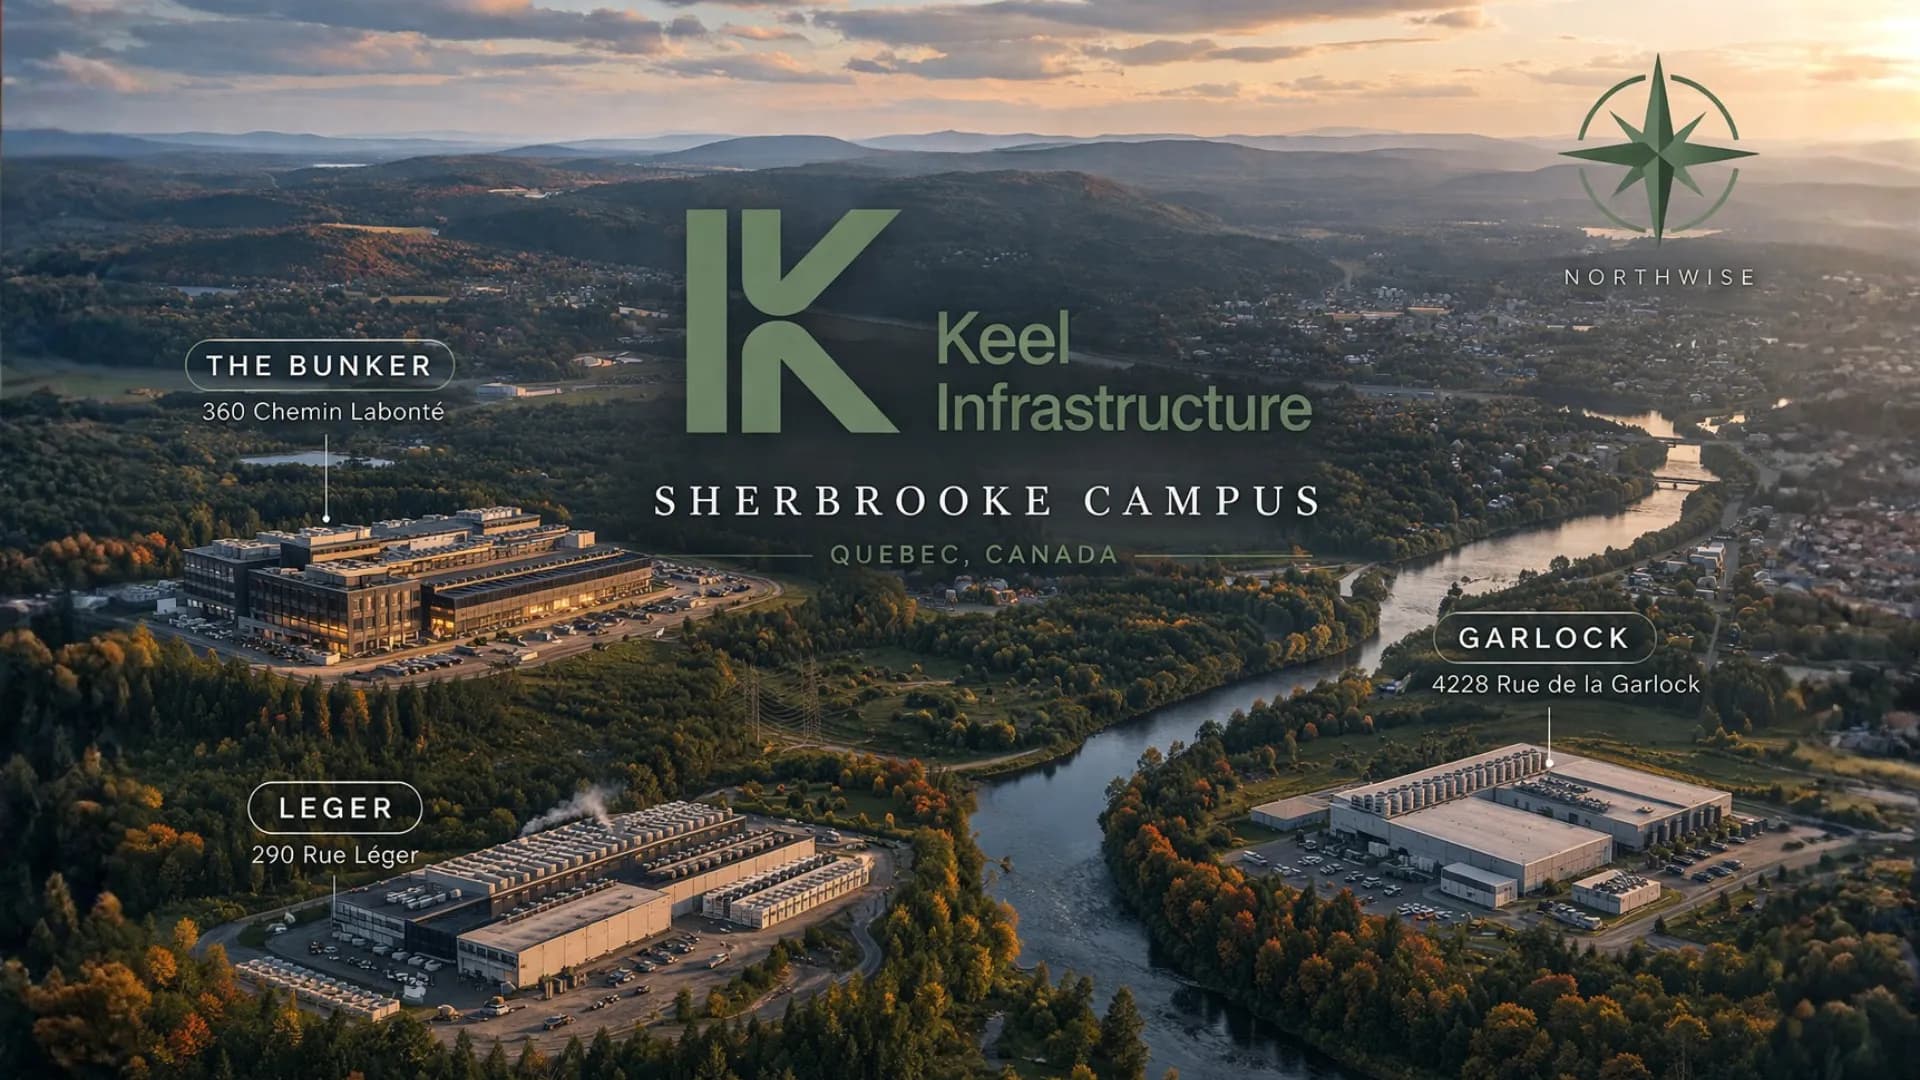
KEEL Sherbrooke Data Center
Sherbrooke: the conditional consolidation of existing 96 MW into one planned AI campus, land conditions and 2028 service target.
Northwise Portfolios
See how the research becomes real decisions
Reader discussion
Discuss the research
Premium access is required to join this report's discussion.
Join Northwise Premium
No comments yet. Start a thoughtful discussion.