KEEL Stock Forecast 2030: The Price of Patience
KEEL’s 2030 forecast follows five AI infrastructure sites through construction, tenant acceptance, debt, dilution and the cash left for shareholders.
In this article
A former Bitcoin miner has power positions that AI customers want and a construction program it cannot fund alone. KEEL’s opportunity lies in securing long-term tenants before the cost of waiting begins to weaken its negotiating position.
By August, the Bitcoin mine at Moses Lake, Washington, had been removed. Its owner, Keel Infrastructure, was preparing the site for prefabricated data-center modules, the first of which had already arrived from Vertiv. Management expected the replacement facility to open in 2027. Mining revenue had stopped months earlier, while the employees, equipment suppliers, and construction work still needed to be paid.
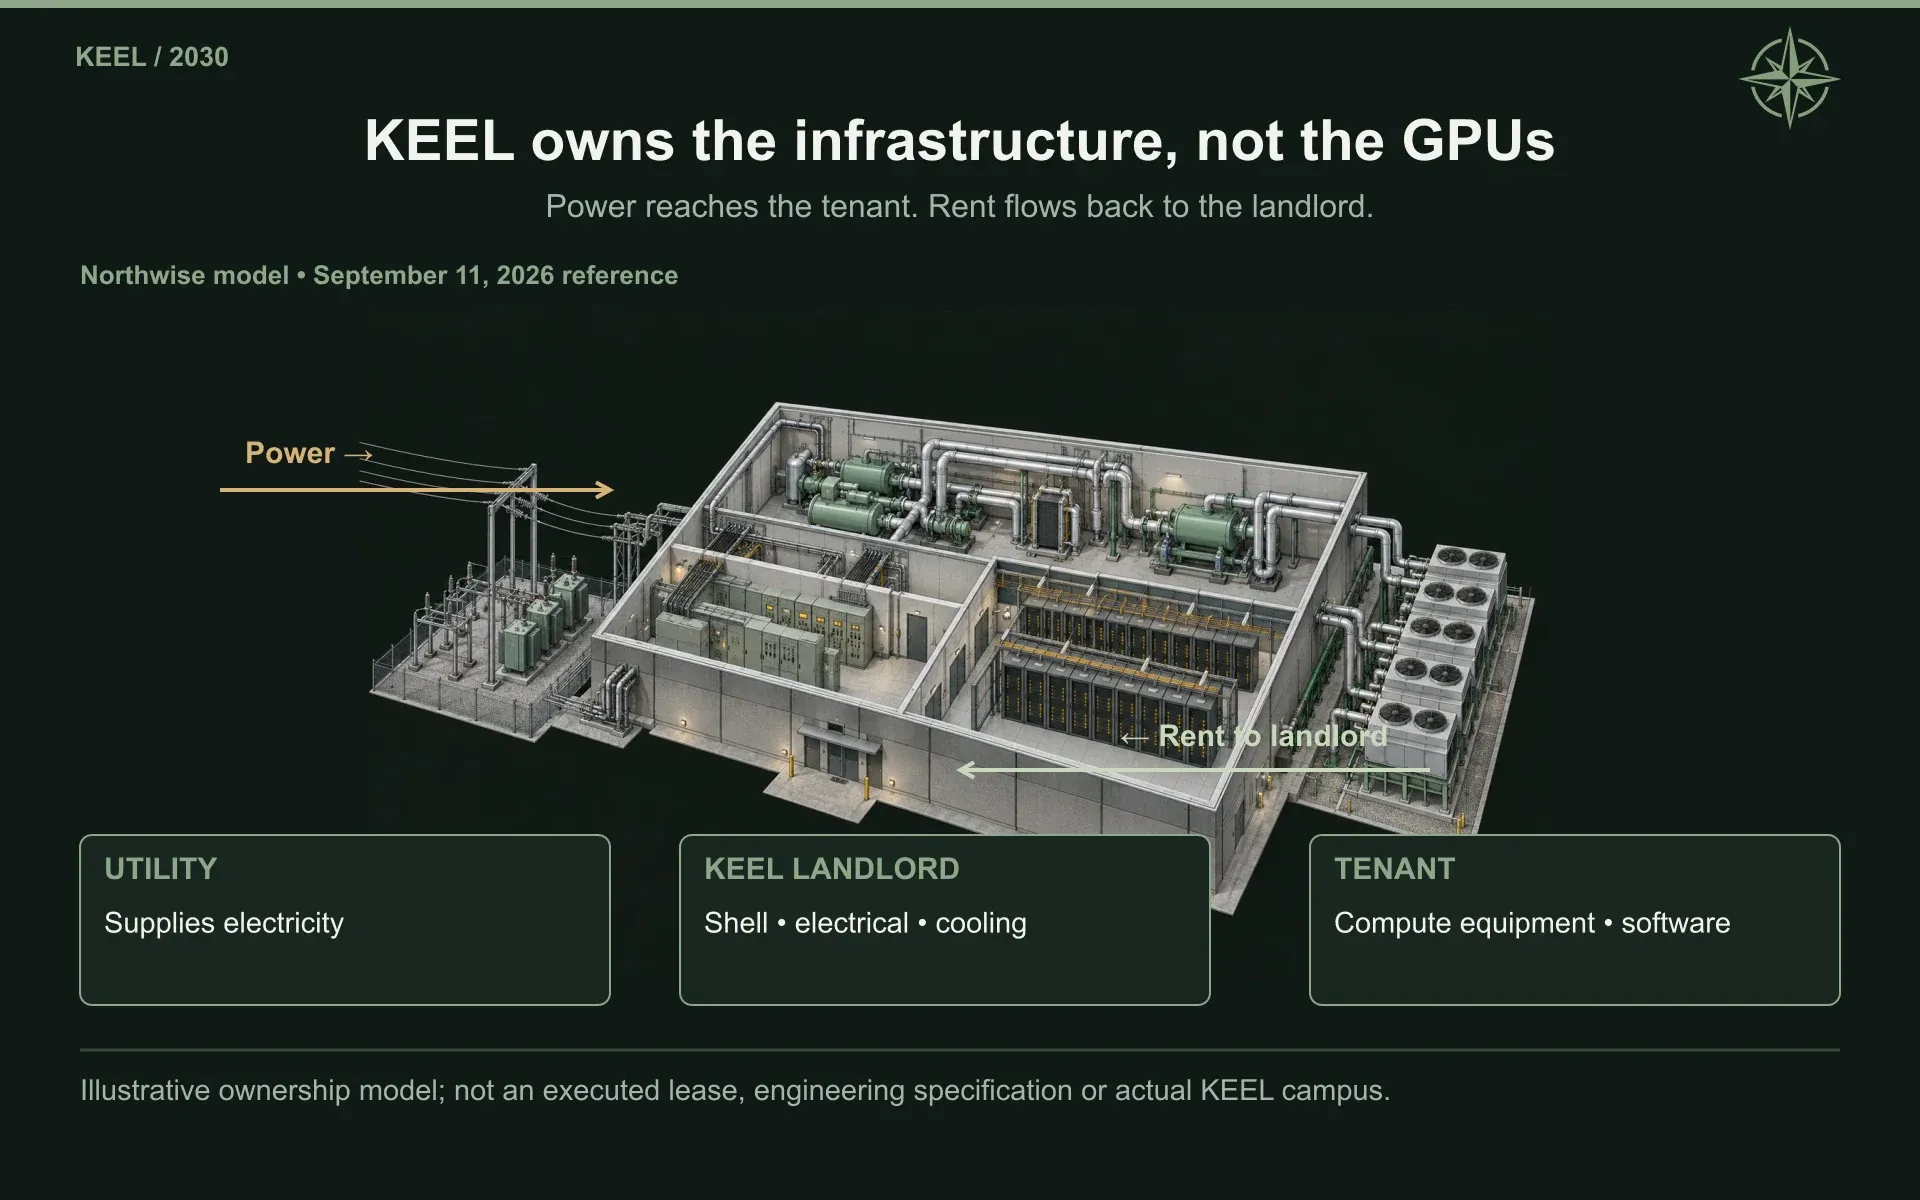
KEEL is the company investors previously knew as Bitfarms. It is leaving Bitcoin mining behind to develop and own the buildings, electrical systems, and cooling infrastructure that support artificial intelligence. The proposed customers would bring their computing equipment and pay KEEL rent under long-term agreements. The company would exchange a business exposed to Bitcoin prices and mining competition for one built around property ownership and contractual payments.
The appeal is understandable. A good data-center lease can turn an expensive development into a durable income-producing asset. Before that happens, the developer must choose a customer, agree on the building’s specifications, arrange financing, and deliver something that passes the tenant’s acceptance tests. KEEL is spending money across that interval today.
On its August earnings call, chief executive Ben Gagnon defended the decision to wait for the right agreement.
“A lease is not a trophy for a press release,” he said. Management was negotiating a commitment that could last fifteen years, and Gagnon argued that the difference between acceptable and excellent terms could amount to hundreds of millions of dollars over its life.
We agree with the principle. A developer can do considerable damage by celebrating a contract before examining what it has promised to deliver and how much capital the agreement will require. A recognizable tenant name does not compensate for a poor allocation of construction risk or years of unattractive economics.
The difficulty is that patience has its own cost. KEEL has removed its U.S. mining operations, assembled a more expensive development organization, and committed money to equipment before collecting its first infrastructure rent. Its balance sheet gives management time to negotiate, but that time is being purchased with shareholder capital.
Our view is more constructive than a glance at the current losses would suggest. Several sites have advanced beyond speculative land holdings, and the proposed rental economics justify serious interest. We expect the company’s power positions to remain commercially relevant as customers compete for facilities they can actually use within their deployment schedules. The public evidence supporting this report, however, still describes prospective tenants rather than an executed anchor lease. As of August 7, KEEL had not begun HPC operations or recognized related revenue at its U.S. sites.
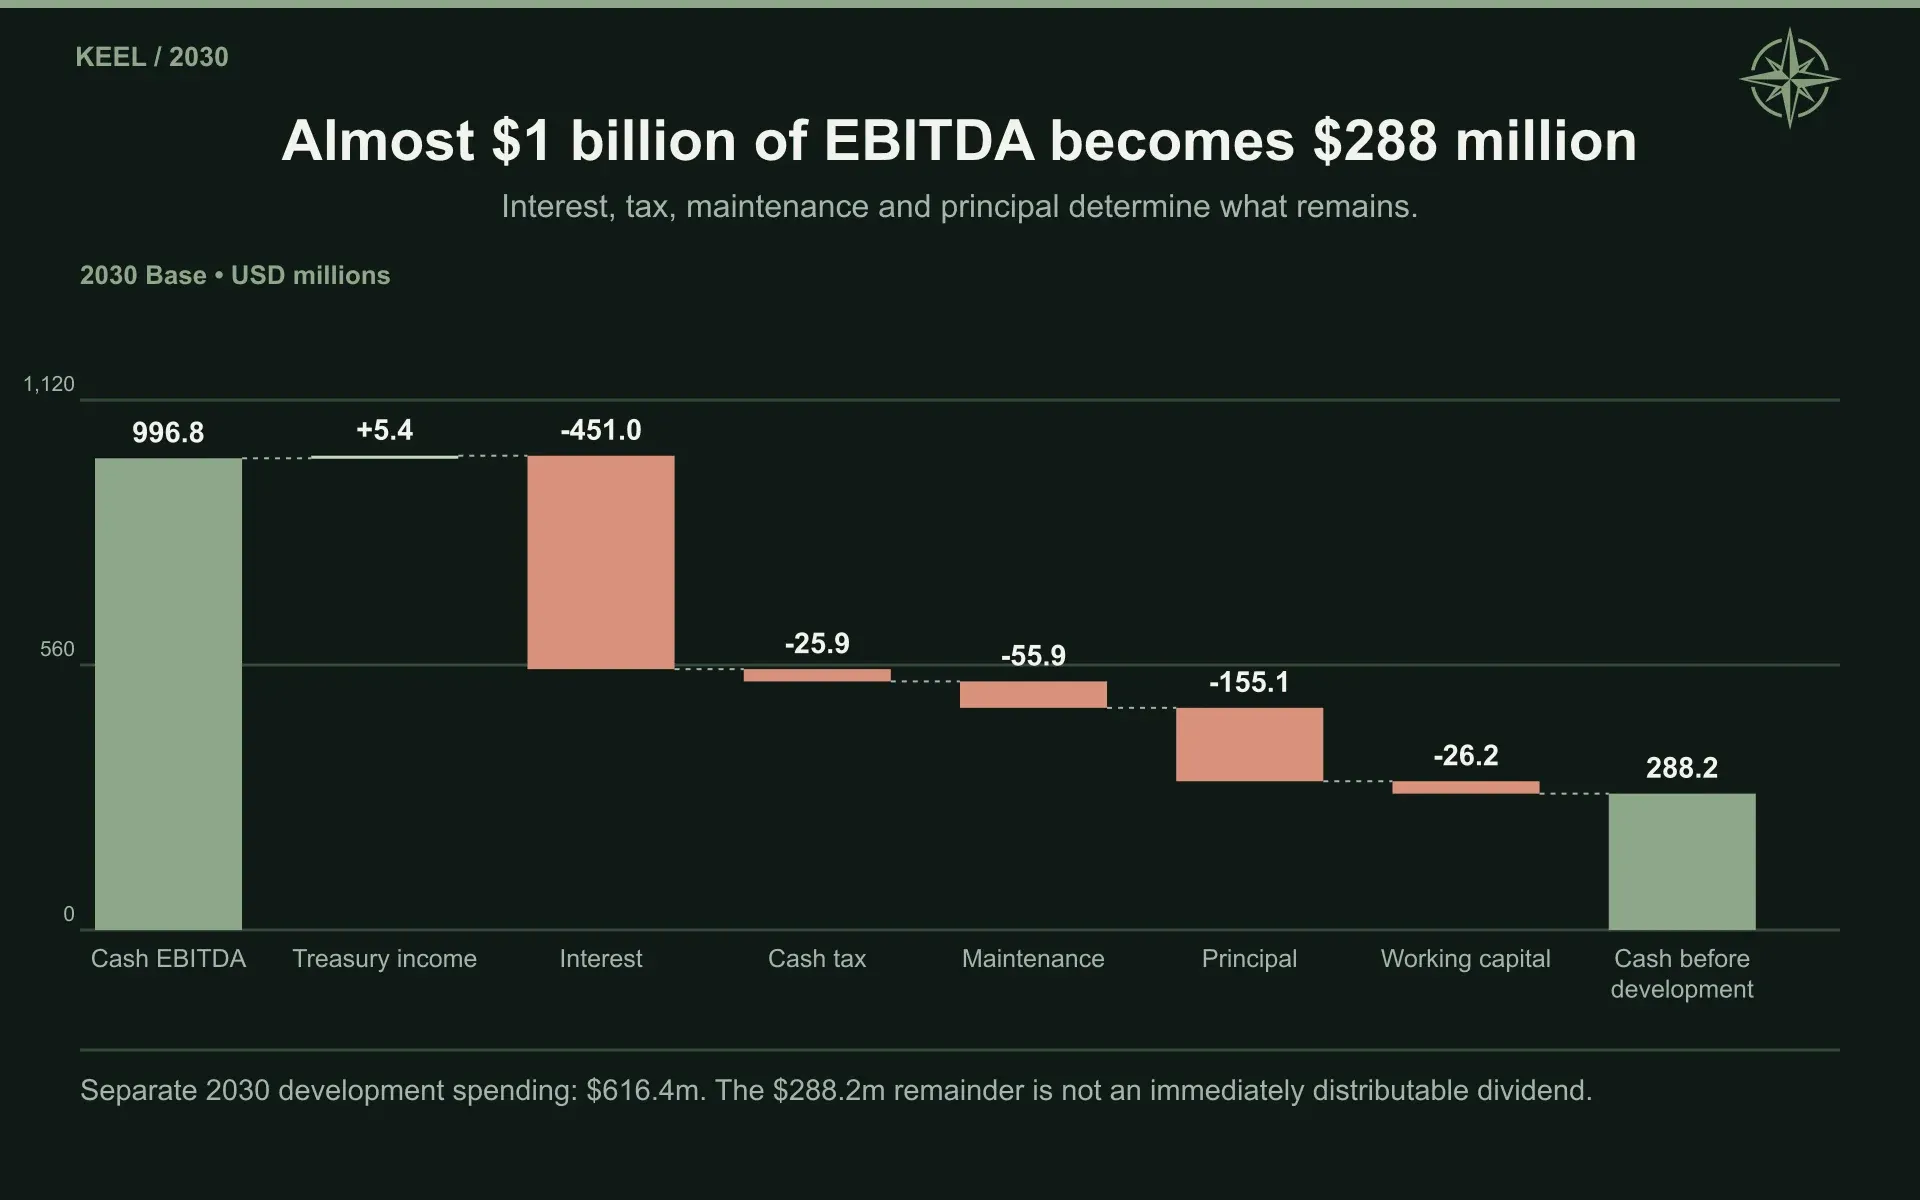
We therefore forecast the properties individually and follow their construction costs through to the shares required to finance them. Our Base case reaches 974 gross megawatts of completed infrastructure by the end of 2030, generating approximately $1.18 billion of annual rent. After operating expenses, maintenance, interest, taxes, working capital, and scheduled debt repayment, about $288 million remains before further development.
Getting there consumes approximately $8.45 billion of development expenditure during 2026–2030 and requires $1.74 billion of additional gross common equity. Those figures describe the same investment. The rental opportunity becomes much less useful when separated from the cost of reaching it.
The research and complete operating forecast follow below. The premium section then considers what each outcome is worth and the purchase price that adequately compensates investors for the remaining work.
Research and valuation reference: September 11, 2026. Forecasts cover calendar years 2026–2030 and are Northwise estimates. Dollar figures are in U.S. dollars unless otherwise stated.
1. Why an AI Company Would Rent From a Former Miner
Consider the decisions facing a cloud company preparing a large AI deployment. It needs computing equipment, engineers, customers, and somewhere to run the machines. The last requirement can be the one that holds everything else up.
A suitable building needs far more than enough floor space. Electricity has to reach it in the required quantity, the electrical equipment must distribute that power safely, and the cooling system must remove the heat produced inside. The customer also needs confidence that the facility will remain available after it moves expensive hardware and important workloads into it.
A company can have enough money to pay for those requirements without being able to obtain them on its preferred schedule. The International Energy Agency’s April 2026 review described tightening supply constraints across transformers, gas turbines, advanced chips, and other equipment, alongside pressure on permitting and grid connections. Its assessment was of several physical constraints interacting, rather than a single shortage that disappears when another factory increases output. (IEA)
KEEL is trying to sell a solution to part of that problem. It brings sites, power arrangements, infrastructure development, and eventual facility operations. The tenant supplies the compute hardware and decides what runs on it.
That allocation leaves KEEL with a smaller revenue opportunity per megawatt than a cloud company that also purchases GPUs, operates the software, and sells computing services. It also avoids the direct cost of buying those GPUs. A graphics processing unit, or GPU, is the specialized processor commonly used for demanding AI workloads; purchasing and financing thousands of them creates an entirely different capital requirement from owning the facility around them.
Our research on CoreWeave and Nebius follows those broader computing businesses. KEEL is closer to the landlord supplying their physical premises. Applying a cloud provider’s revenue per megawatt to KEEL while retaining only a landlord’s construction bill would produce an impressive forecast with very little economic meaning.
The macroeconomic case for more infrastructure remains substantial. The IEA’s central projection puts global data-center electricity consumption at approximately 950 terawatt-hours in 2030, up from 485 in 2025, with AI-focused consumption growing faster. Its analysis also recognizes rapid improvements in the electricity required for an individual AI task. Aggregate demand depends on how those efficiency gains interact with more users and more demanding applications. (IEA)
We would be wary of treating either side of that equation as settled. More efficient computing could broaden adoption and make previously uneconomic applications worthwhile. It could also allow some customers to do more within an existing power allocation. Neither possibility establishes the rental economics of a particular campus. A favorable global forecast supports the search for customers; an actual lease determines who pays KEEL.
The regional evidence is equally instructive. PJM, the grid organization serving Pennsylvania and much of the surrounding region, projected average annual summer peak-demand growth of 3.6% over the next decade in its January 2026 forecast. The comparable ten-year growth projection in its 2021 forecast was just 0.3%. Yet PJM also reduced its nearer-term expectations relative to the previous year after updating its economic assumptions and more closely examining proposed data-center and other large loads. It specifically assessed project likelihood and the risk of counting the same demand more than once. (PJM Inside Lines)
That combination fits our view of this market better than either an inevitable shortage or an inevitable bust. Electricity demand can grow much faster than utilities once expected while individual development proposals fail, shrink, or move. We want exposure to sites with credible delivery schedules and customers who can commit on financeable terms, rather than assume the entire announced pipeline will arrive.
KEEL’s mining history gives it a starting position in that search. It already has relationships with power providers and assets at locations where electricity has supported industrial computing. The transition still calls for a different standard of infrastructure. A mining operation that responds to power economics by reducing activity is not equivalent to a facility promising availability to a customer running critical workloads.
At Moses Lake, KEEL removed the old mine rather than simply replace one set of machines with another. That is a useful introduction to what the company is building.
2. The Portfolio Behind the Power Headline
KEEL’s legal transition was completed on April 1, 2026, when the Delaware parent replaced Bitfarms through a one-for-one share exchange. The assets and liabilities remained at their historical carrying amounts. The change gave the company a different corporate home and reporting structure; the more important economic decisions concerned which operations to close and what to build in their place.
By the end of the second quarter, U.S. mining had ceased. Canadian mining remained during the transition, but management’s liquidity planning assumed no cash contribution from the Bitcoin business. That is a significant change from our earlier forecast, which allowed mining to support development for longer and expected infrastructure rent sooner.
The development portfolio now needs to carry the investment on its own economics.
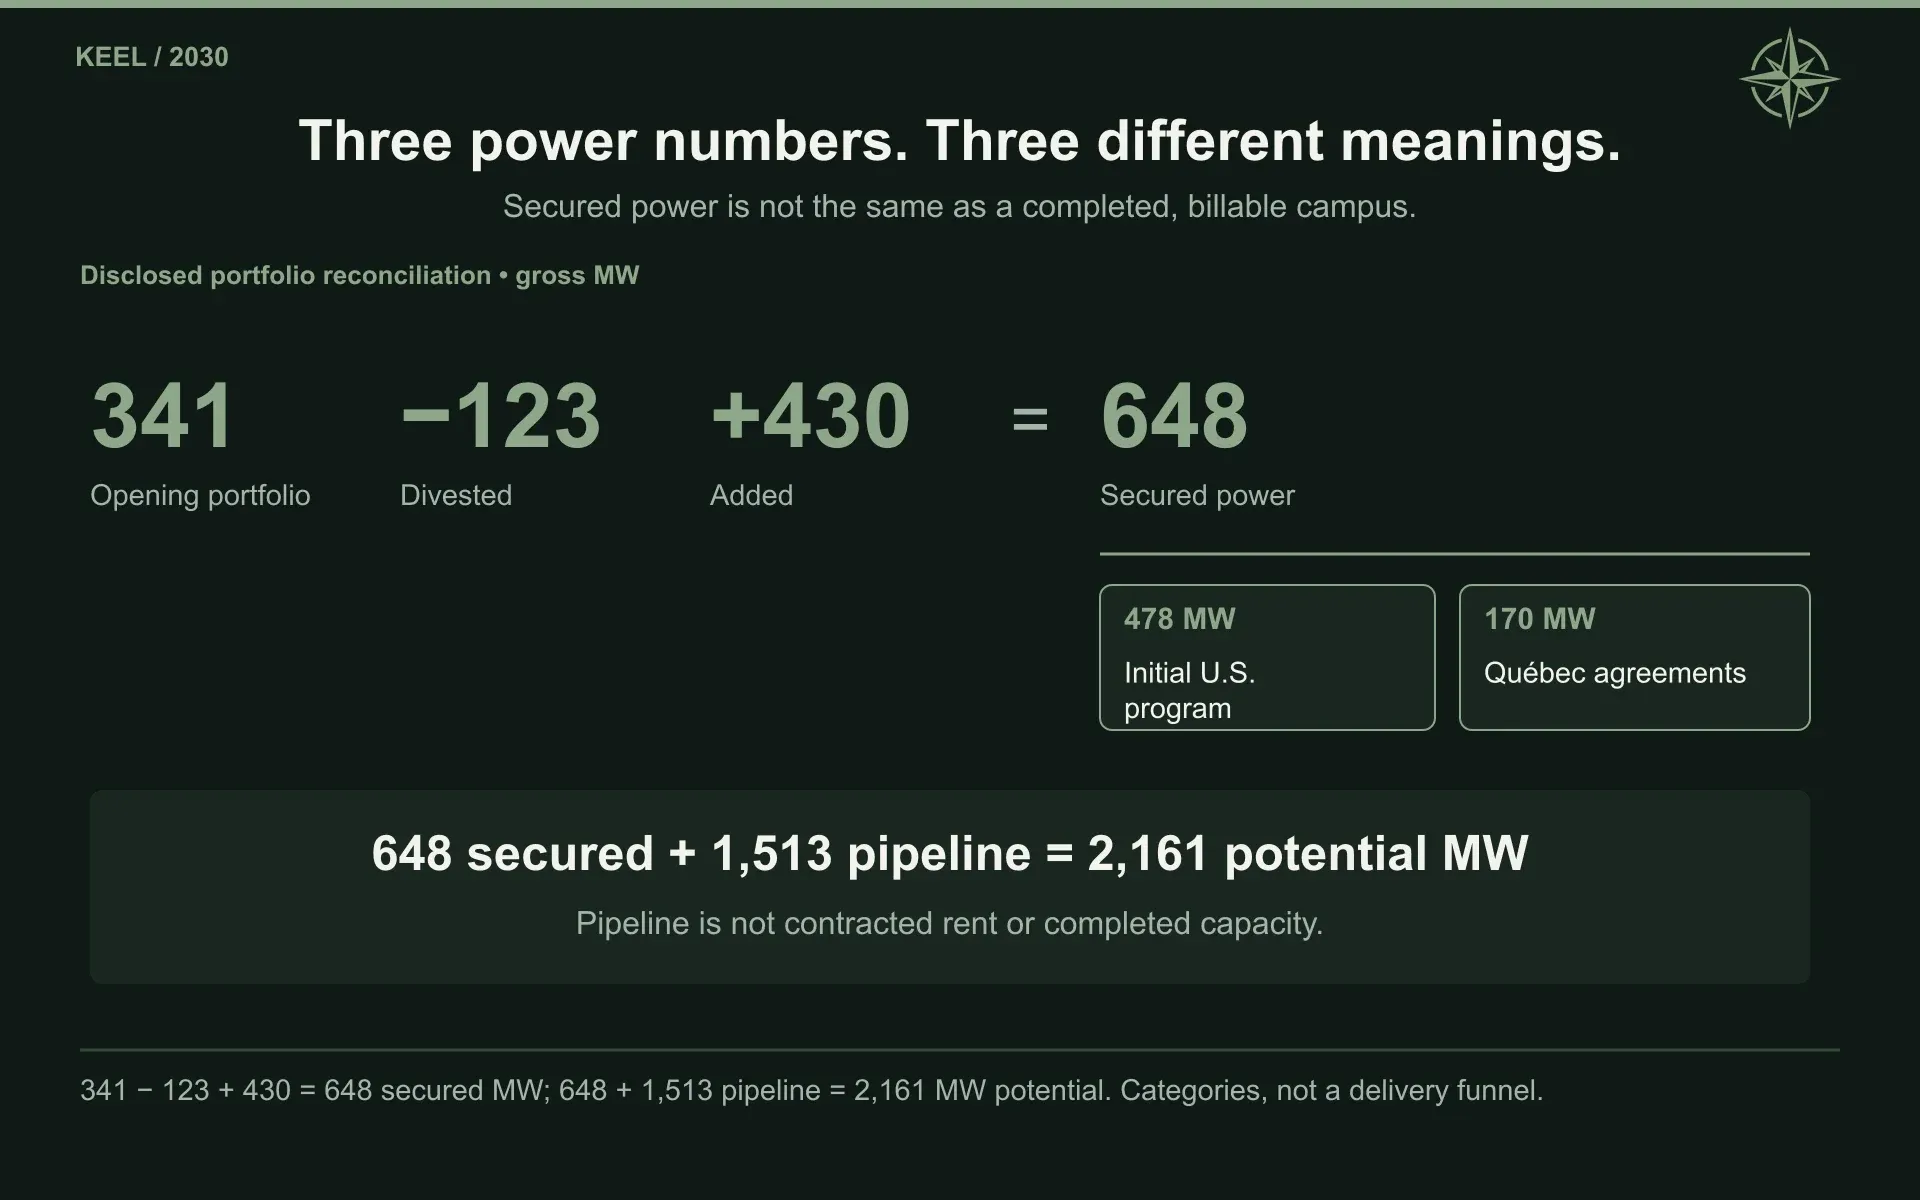
KEEL disclosed a 2,161 MW power pipeline in its June filing. A megawatt measures power capacity, and a gigawatt equals 1,000 megawatts. Across a data-center portfolio, however, the number needs a qualification: existing electrical capacity, contracted future power, proposed expansion, and a completed tenant-ready facility are different things.
The company’s reconciliation is:
Disclosed capacity category | Gross MW |
|---|---|
Energized capacity | 341 |
Less energized capacity without the relevant energy service agreements | (123) |
Secured growth capacity | 430 |
Secured gross capacity | 648 |
Additional identified expansion | 1,513 |
Total pipeline | 2,161 |
The excluded 123 MW consists of 60 MW at Panther Creek and 63 MW at Scrubgrass. These positions did not satisfy the electricity-agreement definition used for secured capacity, even though legacy assets at the locations had consumed or generated power.
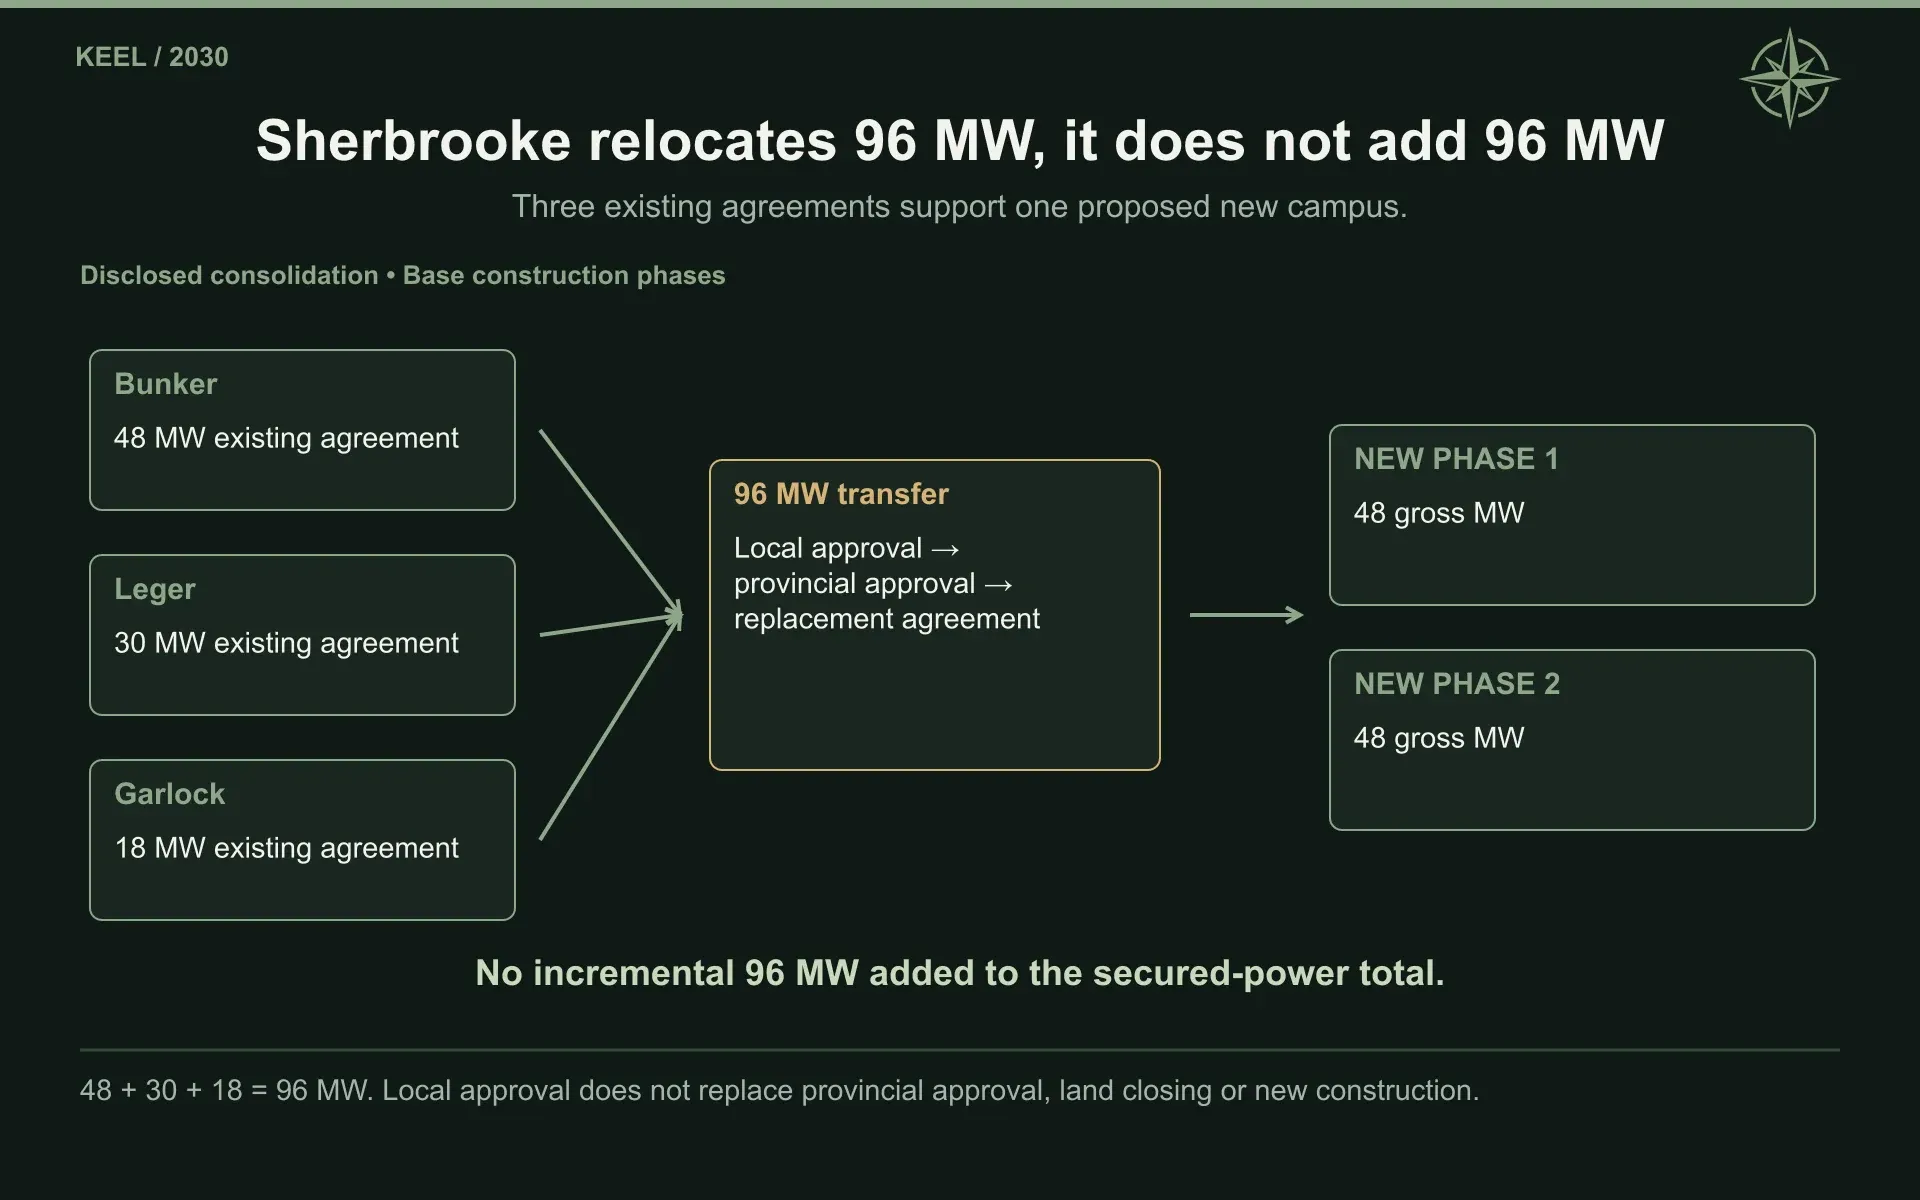
Within the 648 MW secured total, the initial U.S. program is 478 MW: Moses Lake’s 18, Sharon’s 110, and Panther Creek’s 350. The remaining 170 MW is in Québec. Sherbrooke’s proposed 96 MW campus consolidates existing Québec power arrangements, so it must not be counted again as wholly incremental capacity.
Our completed infrastructure forecasts are considerably smaller than the full disclosed pipeline:
Completed gross HPC capacity at year-end 2030 | Bear | Base | Bull |
|---|---|---|---|
Moses Lake | 18 MW | 18 MW | 18 MW |
Sharon | 110 | 110 | 110 |
Panther Creek | 350 | 500 | 550 |
Scrubgrass | 0 | 250 | 550 |
Sherbrooke | 0 | 96 | 96 |
Total | 478 MW | 974 MW | 1,324 MW |
HPC means high-performance computing, the broad category of intensive computing workloads that includes AI. In these forecasts, completed HPC capacity refers to the infrastructure KEEL provides, not tenant GPUs that KEEL owns.
Base includes 496 MW beyond the initial U.S. program. Just over half its completed footprint therefore depends on further Panther Creek development, Scrubgrass, and Sherbrooke. That expansion is central to our forecast and carries less certainty than the first projects.
The geography is concentrated too. The three Pennsylvania locations supply 860 of Base’s 974 MW. Their different site characteristics help, but the developments share exposure to the regional power system, Pennsylvania’s regulatory environment, and KEEL’s ability to raise corporate capital.
The portfolio is best understood through those individual locations. Moses Lake offers the earliest operating reference. Sharon could establish a larger financeable lease. Panther Creek provides the largest central contribution. Scrubgrass and Sherbrooke extend the opportunity into projects where more of the development work remains unresolved.
3. Moses Lake and the First Customer Handover
Moses Lake gives investors something tangible to watch over the next year: an old use of the property disappearing as the replacement is assembled.
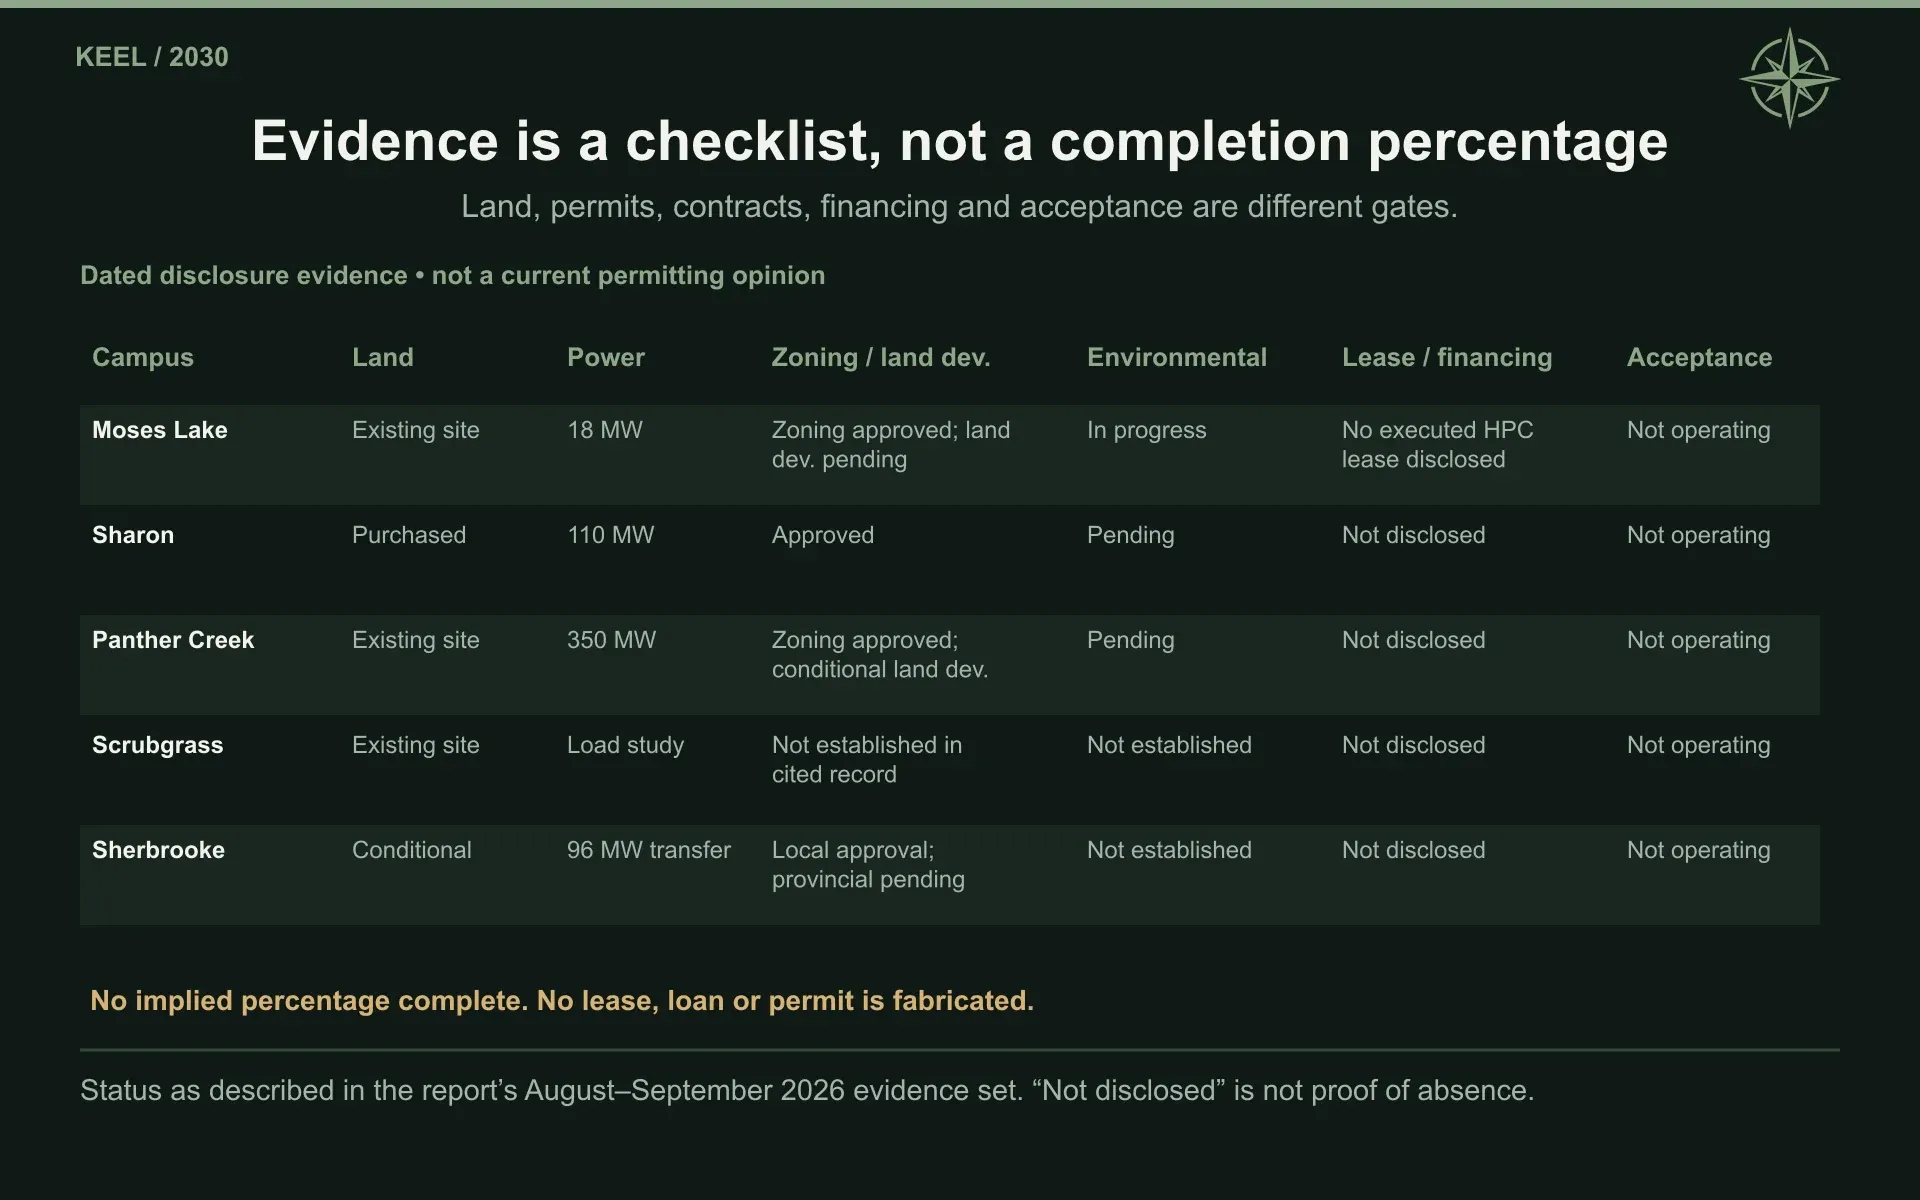
Management reported that the mining operation stopped on April 28 and that the old mine had been completely removed by the August update. The first Vertiv modules were arriving, and critical long-lead equipment was secured or being manufactured. Site preparation could proceed while the company completed the remaining permissions for vertical construction. Management expected the campus to become its first commissioned HPC facility in 2027.
The project is 18 gross MW. KEEL relinquished the additional 10 MW option and focused on the development already underway. Our forecast follows that smaller scope.
Management described prospective customers that value a fully operated facility and an earlier move-in date. That customer profile supports a modified-gross lease, an arrangement in which the landlord retains more of the operating responsibilities than under a conventional triple-net structure. The precise division will depend on the signed agreement, but it explains why we assign Moses Lake higher operating costs than the larger Pennsylvania developments.
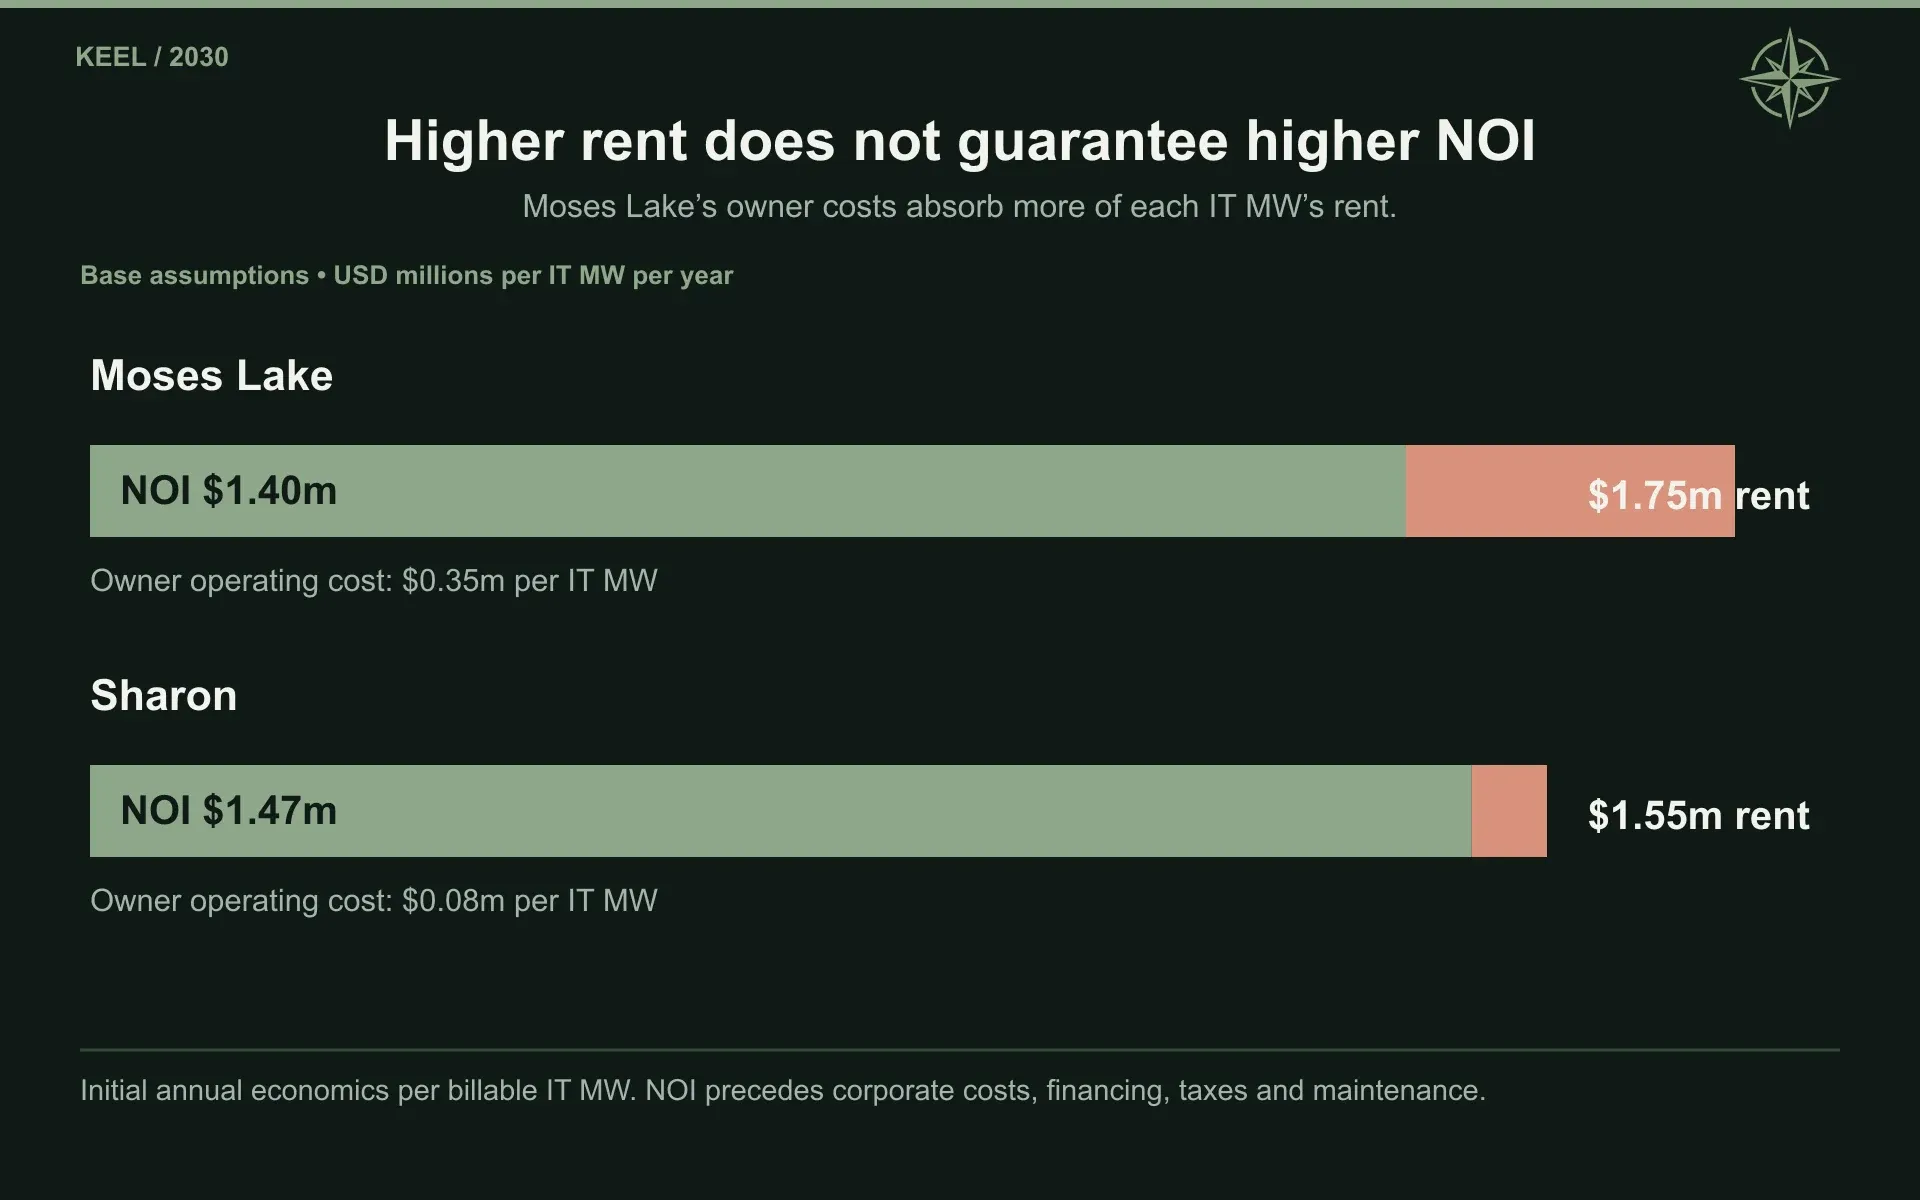
In Base, 18 gross MW supports 14.4 critical IT MW. Critical IT capacity is the portion available to tenant computing equipment after allowing for cooling and other facility needs. Initial annual rent is $1.75 million per IT MW, with $350,000 of retained owner operating expenses.
The resulting $1.40 million per IT MW of property net operating income, or NOI, is the rent left after those property expenses. Interest, maintenance investment, taxes, and corporate costs still have to be paid.
We allow $13 million of hard development expenditure per IT MW, producing a whole-project budget of $187.2 million before financing costs. Smaller campuses can be expensive on a unit basis, particularly when the owner is supplying a more extensively operated facility.
The forecast credits $80 million of previously invested capital to Moses Lake. That is our allocation of KEEL’s existing project assets, rather than a site-specific amount disclosed by management. First rent begins in September 2027 in Base, January 2028 in Bear, and July 2027 in Bull.
PowerSecure’s September 9 announcement provides additional evidence of supplier work. The company agreed to deliver a customized backup-power system for Moses Lake and said the relationship had begun earlier in the year. It adds detail about the infrastructure being procured, rather than establishing a tenant or another source of revenue. We keep that equipment within the existing project scope instead of adding a second construction budget simply because the supplier issued a press release. (PowerSecure)
Moses Lake accounts for less than 2% of our Base footprint, so its direct earnings contribution will be modest. Successful operation could nevertheless improve the next commercial conversation. A prospective tenant would have a facility to inspect, operating performance to examine, and a delivery record to assess. Those are useful advantages for a company asking customers to commit to much larger developments.
The first handover will not settle the rest of the portfolio. It would give KEEL something more persuasive than a projected completion date.
4. Sharon’s Larger Commercial Test
Sharon is large enough to make the financing terms visible at the corporate level.
The 110 MW Pennsylvania campus received full zoning in April and land-development approval during the second quarter. In August, management said a few environmental permits remained outstanding and reported delivery of long-lead equipment, including transformers. It also described simultaneous discussions with multiple prospective tenants.
Design decisions were still being made alongside those negotiations. Sharon had previously been discussed as an initial 30 MW phase followed by 80 MW. Gagnon said KEEL was evaluating whether to consolidate delivery into one 110 MW phase, which could simplify construction and improve the product offered to customers. Our Base forecast assumes a unified rental commencement in January 2028.
The proposed lease structures pair the scale of a large AI deployment with stronger financial backing. Management discussed triple-net agreements and the possibility of investment-grade credit support behind a faster-growing customer. Investment-grade support means a counterparty judged to have comparatively strong credit standing would stand behind specified contractual obligations. The identity and terms of that support remain to be established.
This is where the customer’s financial condition becomes part of KEEL’s construction budget. A lender may be comfortable advancing more money against a strongly supported payment stream. With weaker credit, it may demand more equity, a higher interest rate, or additional protections. Two tenants offering the same rent can therefore leave KEEL with different funding requirements.
Base assigns Sharon 88 critical IT MW, initial annual rent of $1.55 million per IT MW, and $80,000 of retained operating expenses. The $924 million hard development budget reflects $10.5 million per IT MW, with a $30 million credit for prior capital in our allocation.
Sharon’s initial property NOI is $1.47 million per IT MW, slightly higher than Moses Lake despite the lower rent. The owner keeps more because it retains fewer expenses.
We would view a well-structured Sharon agreement as an important commercial step. It would clarify more than demand for one campus: the lease would show what customers expect KEEL to deliver, what risks remain with the owner, and whether the resulting payment stream supports the borrowing assumed in our forecast.
5. Panther Creek and the Pennsylvania Opportunity
Panther Creek is where KEEL’s ambition becomes much larger.
Its secured utility position is 350 MW with PPL, and management has discussed expansion to 500 MW or more. A campus of that scale can serve a customer’s initial deployment and subsequent growth without forcing it to start another site search immediately. That potential continuity is part of what KEEL is offering in its negotiations.
The physical and regulatory work still needs to arrive in the right sequence. KEEL obtained zoning and conditional land-development approval during the second quarter, while final environmental permitting took longer than management originally expected. On the August call, Gagnon said the additional time did not change the power-delivery schedule under the energy service agreement. He continued to point to the end of 2027 for the earliest ready-for-service timing.
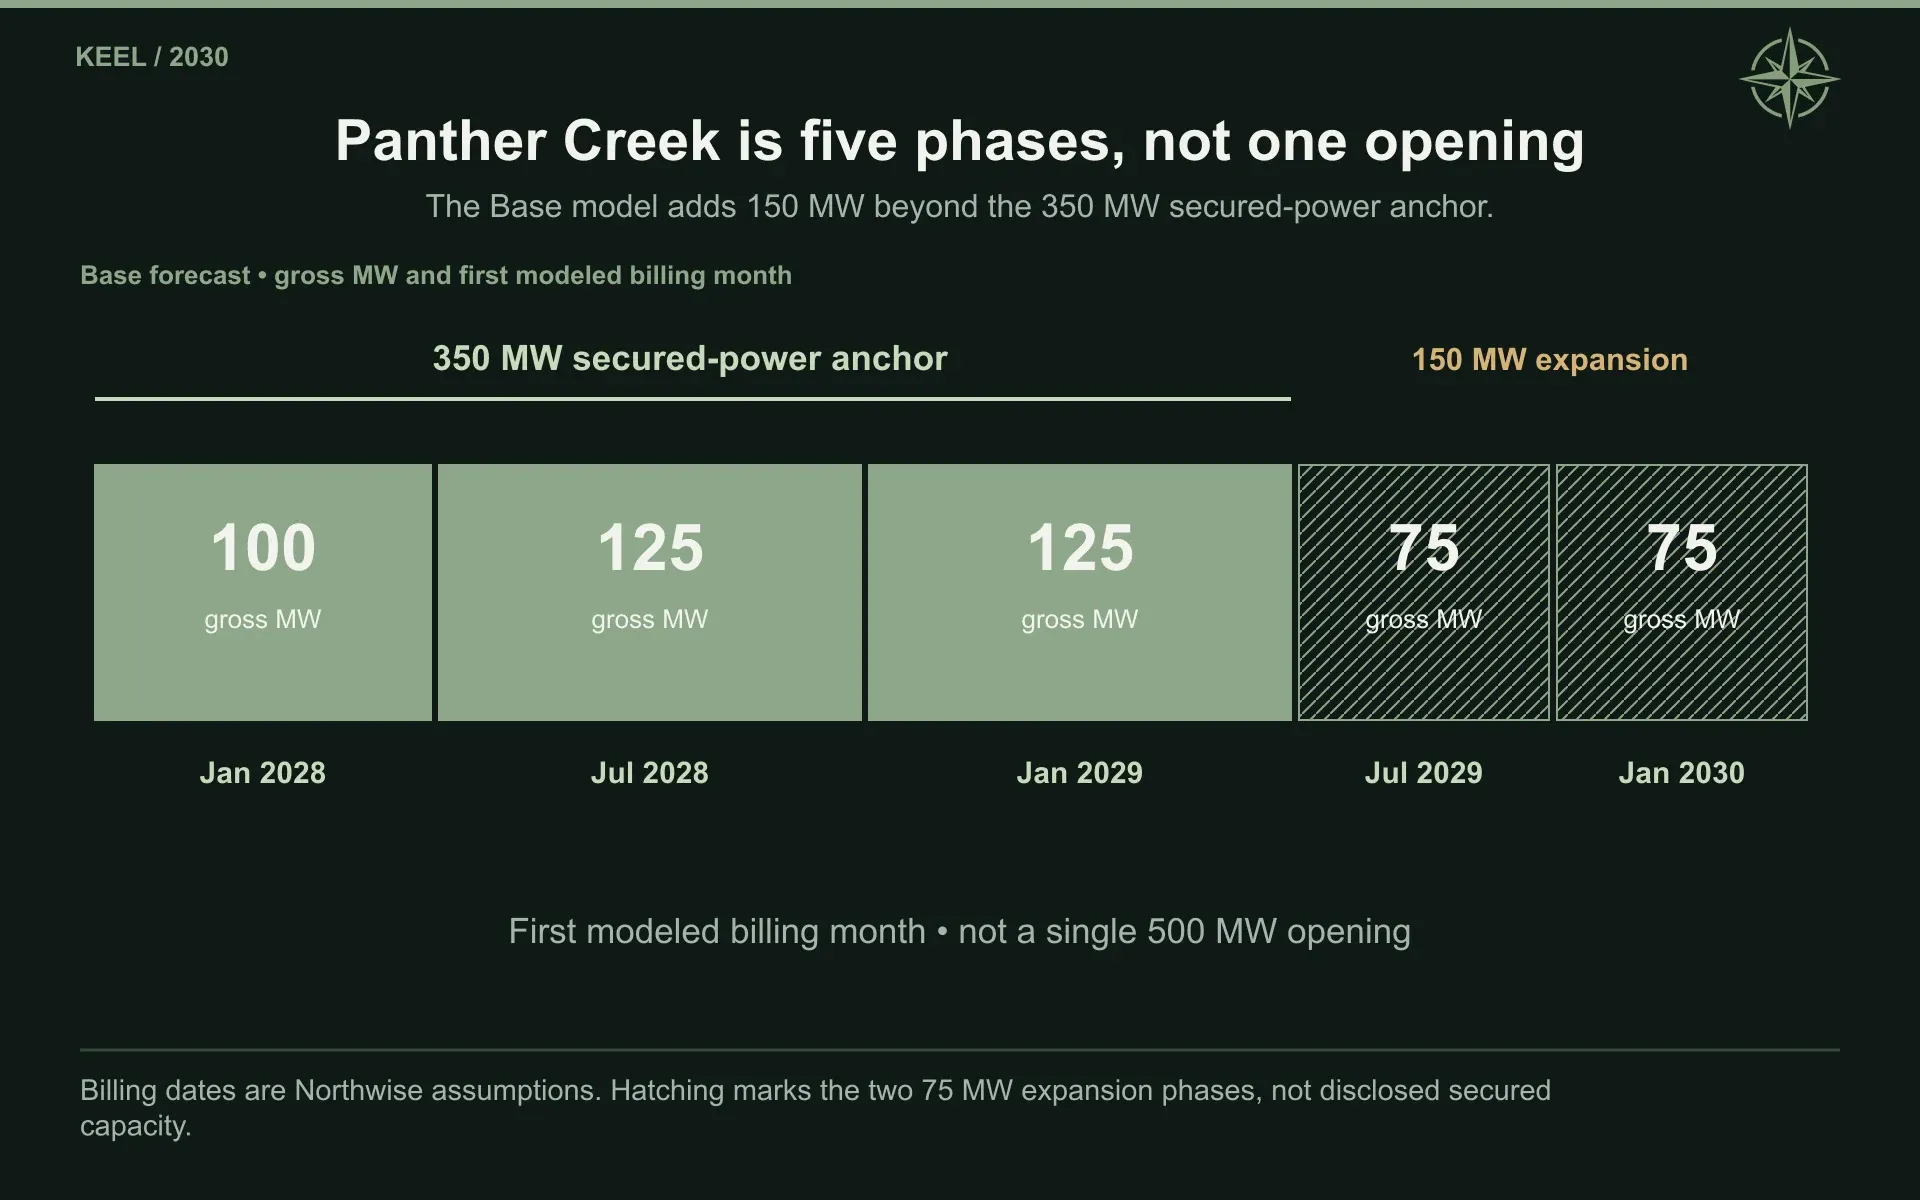
Our first Panther Creek rent begins in January 2028. The initial 350 MW is divided into 100 MW, 125 MW, and 125 MW phases. Two further 75 MW phases bring Base to 500 gross MW by 2030.
That schedule places $4 billion of hard development scope at one location. It is a major concentration of both opportunity and expenditure.
The Pennsylvania backdrop helps explain why prospective customers are interested, but it also deserves more respect than a simple pro-development label. Large new electricity users create questions about who pays for grid upgrades, how utilities plan for demand that might not arrive, and what nearby communities receive in exchange for construction and ongoing resource use. Pennsylvania’s August executive order addressed consumer protection and the impacts of data-center development. (Pennsylvania.gov)
We regard those questions as part of the economics, rather than an interruption to them. A household concerned about paying for infrastructure built for a private commercial customer has a legitimate financial concern. Developers that can demonstrate credible demand, fund attributable upgrades, and make practical commitments to host communities may be better placed to obtain approval than projects relying principally on promised investment totals.
KEEL’s August 20 response said the Sharon and Panther Creek permitting schedules were unaffected by the executive order. That statement supports management’s assessment of the existing development paths. It is not an independent determination that every future expansion is approved or will incur no additional cost. (Keel Infrastructure)
For Panther Creek, we assume $1.60 million of initial annual rent and $80,000 of retained owner costs per IT MW. Against $10 million of hard construction expenditure per IT MW, the resulting property economics are attractive enough to justify the capital program.
The larger question is how consistently they can be repeated. Early phases can begin earning while the later buildings remain under construction, helping support the program. Delayed acceptance or expensive first-phase terms would have the opposite effect, consuming resources intended for expansion.
We therefore give Panther Creek a substantial role in Base without treating the full campus as a single completed transaction. Each phase has its own financing and rental dates. The first agreement will influence later development, but additional capacity still needs its own commercial and funding support.
6. Scrubgrass Still Needs Its Power Solution
Scrubgrass is earlier in the process, and the size of the power concepts should not obscure that.
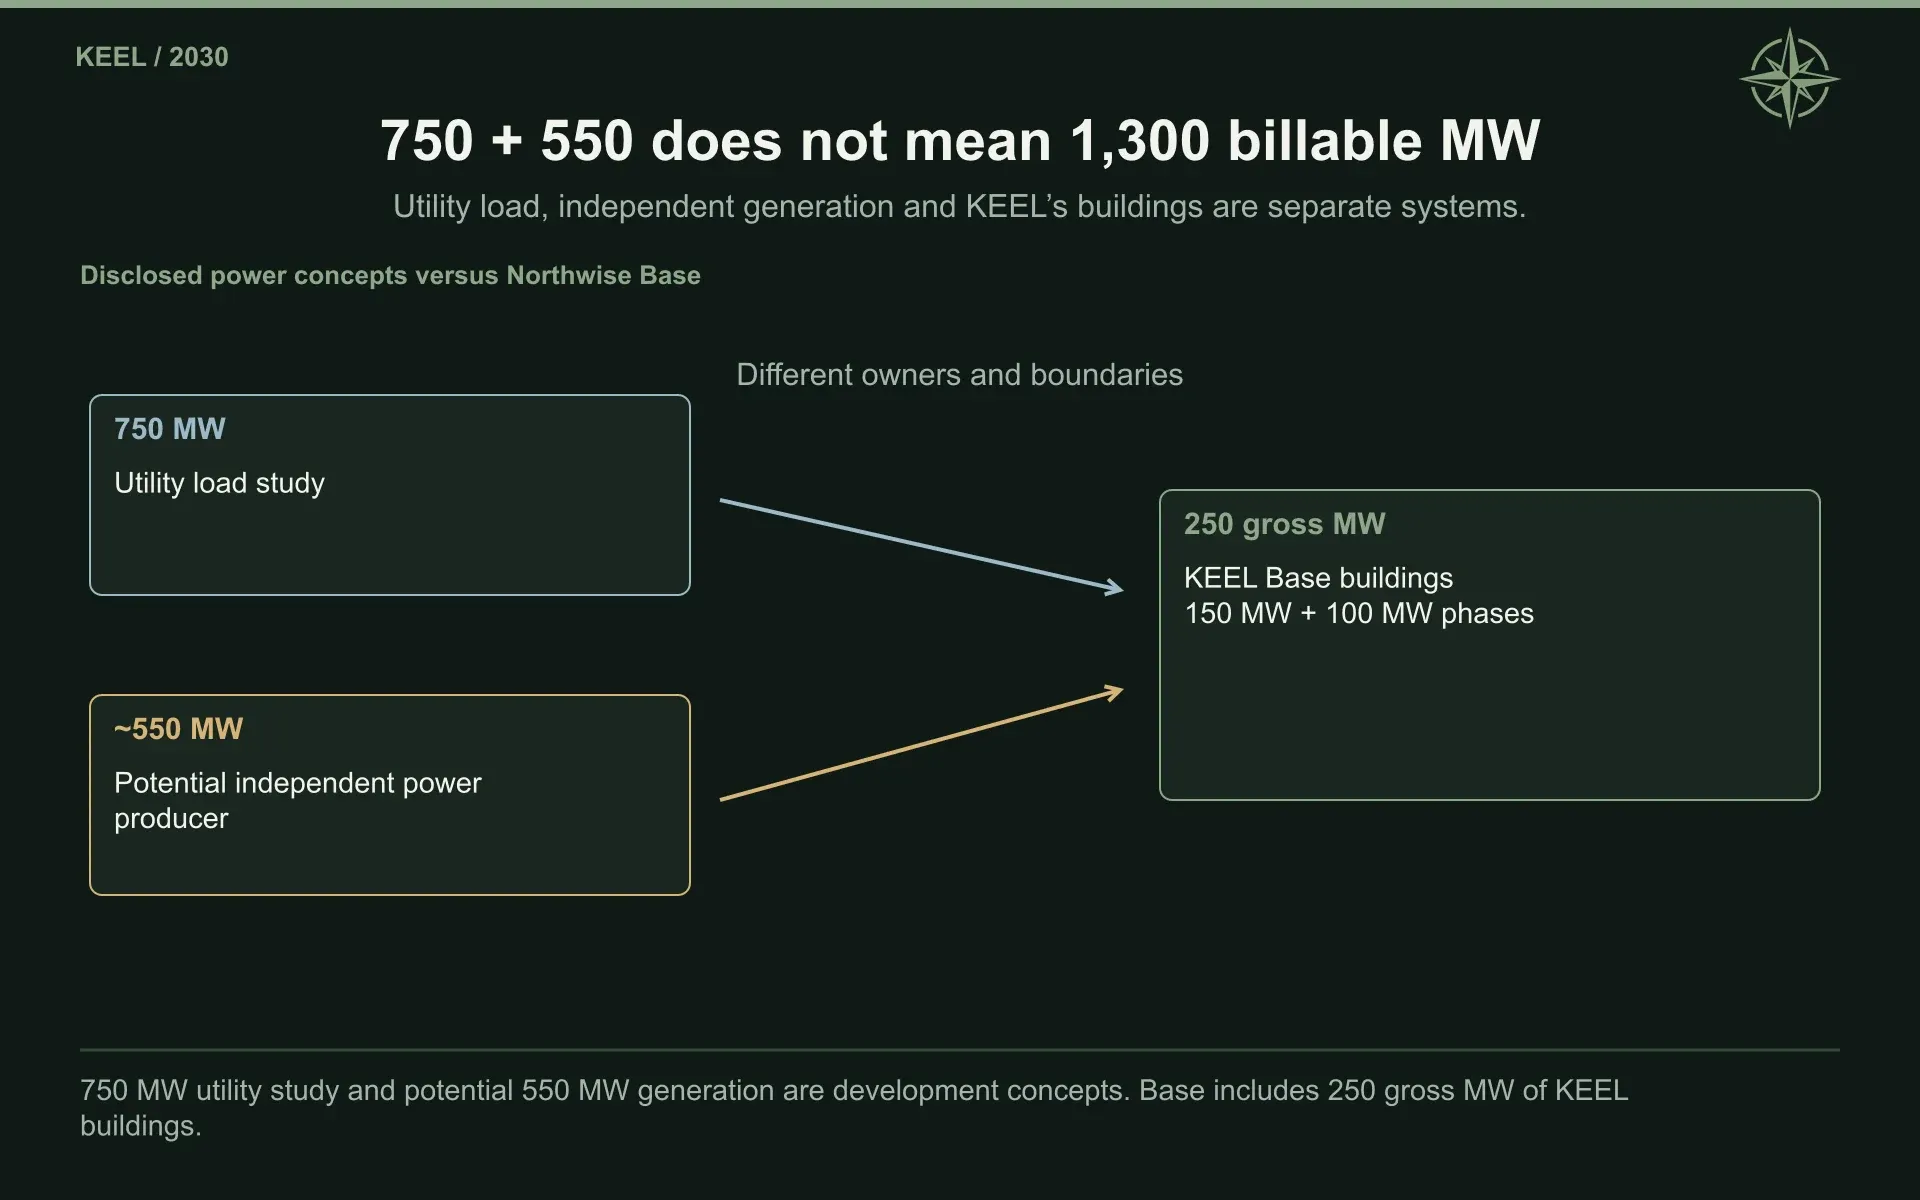
The site has a legacy 63 MW position, while management has discussed a 750 MW utility-load study and approximately 550 MW of potential gas generation. On the August call, the company remained in the power-application stage and had not yet reached final data-center engineering and permitting.
The generation concept would also involve a different owner. Management described an independent power producer financing, owning, and operating the plant, then selling electricity to the end customer. Our forecast consequently assigns neither the plant’s capital expenditure nor its earnings to KEEL.
A utility study examines whether and how electricity could be supplied. A generation proposal considers another possible source. Neither is equivalent to an accepted computing facility, and adding the two figures together does not establish 1,300 MW of billable KEEL capacity.
On-site generation can be commercially useful, especially where grid delivery is slow. It brings its own equipment, fuel, reliability, and financing requirements. The IEA’s 2026 assessment found many proposed on-site gas developments still at an early stage and highlighted the difficulty of reliably serving variable AI loads. (IEA)
For Scrubgrass, we need an executable power arrangement before a large campus becomes more than a development possibility. Our Base case assumes that progress arrives early enough to support 150 gross MW beginning rent in October 2029 and another 100 MW in July 2030.
That 250 MW program costs $2.2 billion before financing expenses. It supports 200 IT MW, initial annual rent of $1.55 million per IT MW, and retained owner expenses of $100,000.
Bull develops 550 gross MW. Bear completes no HPC capacity at Scrubgrass within the forecast horizon.
The Bear treatment leaves room for the site to remain useful later. It simply recognizes that a power solution, detailed design, approvals, a customer, and financing can take longer than the shareholder’s preferred schedule. Management could also pursue a partner or a smaller initial development. Either would require a different allocation of capital and ownership from the one in our central forecast.
Scrubgrass is an important source of upside precisely because it remains less developed. It also accounts for much of the distance between a successful initial U.S. program and the larger company represented by Base.
7. Sherbrooke’s New Campus
Sherbrooke begins with a different advantage: KEEL is trying to consolidate power agreements it already has.
In July, the company received local approval for arrangements that would transfer 96 MW from three existing mining sites into a new HPC campus. Provincial approval remained outstanding, and the proposed land purchase was subject to conditions, with closing expected in the first quarter of 2027. KEEL requested no additional power above the transferred capacity. (Keel Infrastructure)
The power arrangements may shorten one part of the development process. The physical campus still needs to be built.
Our earlier research treated Sherbrooke more like a lower-cost conversion of existing facilities. The newer plan calls for a separate development designed around HPC requirements. We now allow $10 million of hard expenditure per IT MW, producing a $768 million Base budget for 76.8 IT MW.
Initial rent is $1.70 million per IT MW, with $100,000 of owner operating costs. Base opens two 48 gross MW phases for billing in October 2029 and July 2030. Bull advances those dates to January and July 2029, while Bear does not complete Sherbrooke within the forecast.
Management sees potential in serving customers that need capacity in Canada and values the existing local relationships. That is a plausible commercial position, although our forecast does not assume a government tenant, subsidized construction, or a guaranteed rental premium.
We also reduce the remaining legacy contribution as the power moves to its new use. The same 96 MW cannot support a full mining business and a full HPC campus at the same time.
Sherbrooke broadens the portfolio outside Pennsylvania and creates another potential source of long-term rent. Its investment case now depends on the economics of a new building, not on the expectation that most of the required infrastructure is already sitting inside the old mining sites.
8. Choosing the Tenant Who Will Still Be Paying
The most revealing part of KEEL’s August call came when management was asked how its view of the AI market affected tenant selection.
Gagnon described a rapidly changing competitive environment and said the company wanted customers capable of paying predictable rent for one or two decades. KEEL’s own preferred enterprise AI product had changed over the preceding year, an observation he used to explain why the company intended to remain agnostic about individual model providers.
That is a sensible concern for a prospective landlord. The company that generates the most enthusiasm this year may not have the strongest balance sheet over a fifteen-year lease. An exciting application can grow rapidly while remaining dependent on outside funding.
Credit support can help bridge that gap. A stronger counterparty might guarantee specified lease payments or otherwise make the agreement more acceptable to lenders. The arrangement has to be evaluated through its actual coverage, duration, conditions, and cost. A guarantee limited to part of the obligation is different from an unconditional promise to meet all of it.
The economics are easier to understand through a financed comparison. Cipher’s Black Pearl disclosures describe a $9.5 million maximum development-cost allowance per critical IT MW, subject to contractual terms, an Amazon parent guarantee, and protection against qualifying construction overruns. Stingray provides a separate $10.5 million-per-IT-MW construction reference with its own credit support and financing structure. (SEC)
Those documents help establish the scale of expenditure associated with this kind of infrastructure. They also show why a cost number cannot be separated from the agreement around it. The party responsible for overruns can matter as much as the initial budget.
We use those projects as references for construction scope and financing logic. KEEL must still negotiate its own terms. Our central case assumes financeable tenant credit, but it includes no additional warrant package, standalone credit-support fee, outside project-equity partner, or tenant construction prepayment.
Each of those could appear in a future agreement. A customer funding construction would reduce KEEL’s immediate capital need, while a partner contributing equity would own part of the future income. A warrant package might improve credit support at the cost of more dilution. The appropriate forecast would depend on the full bargain.
The lease also needs to establish when the customer starts paying and what happens if delivery slips. A contracted rental stream can be highly valuable while remaining subject to acceptance conditions, availability requirements, and remedies for nonperformance.
We support management’s effort to choose well. We would be less supportive of waiting solely for the highest nominal rent while the balance sheet weakens or financing terms deteriorate. The best agreement is the one that produces the strongest retained economics across the life of the investment, including the capital needed before the customer moves in.
9. The Construction and Rental Calendar
For an early-stage developer, the year a building begins earning can matter as much as its stabilized rental rate.
A facility opening late in December might count toward year-end capacity while contributing almost nothing to that year’s revenue. Equipment can require payment well before installation. A lender may reimburse some eligible spending at financial close, but the parent needs cash to carry it until then.
Our forecasts follow those dates phase by phase.
Base development phase | Gross MW | Spending begins | Financing closes | First rent |
|---|---|---|---|---|
Moses Lake | 18 | July 2026 | April 2027 | September 2027 |
Sharon | 110 | July 2026 | April 2027 | January 2028 |
Panther Creek 1 | 100 | July 2026 | April 2027 | January 2028 |
Panther Creek 2 | 125 | January 2027 | July 2027 | July 2028 |
Panther Creek 3 | 125 | July 2027 | January 2028 | January 2029 |
Panther expansion 1 | 75 | January 2028 | July 2028 | July 2029 |
Panther expansion 2 | 75 | July 2028 | January 2029 | January 2030 |
Scrubgrass 1 | 150 | October 2027 | April 2028 | October 2029 |
Scrubgrass 2 | 100 | July 2028 | January 2029 | July 2030 |
Sherbrooke 1 | 48 | October 2027 | April 2028 | October 2029 |
Sherbrooke 2 | 48 | January 2029 | July 2029 | July 2030 |
Qualifying leases and necessary approvals are assumed to be available before each financing close. These are Northwise development dates, rather than a list of completed milestones or company commitments.
Base ends 2027 with 228 gross MW physically ready, but almost all of that capacity begins billing in January 2028. The year earns just $8.4 million of HPC rent, coming from Moses Lake.
The Bear case carries a later and smaller program:
Bear development phase | Gross MW | Spending begins | Financing closes | First rent |
|---|---|---|---|---|
Moses Lake | 18 | July 2026 | July 2027 | January 2028 |
Sharon | 110 | January 2028 | July 2028 | July 2029 |
Panther Creek 1 | 100 | July 2028 | January 2029 | January 2030 |
Panther Creek 2 | 125 | January 2029 | July 2029 | July 2030 |
Panther Creek 3 | 125 | January 2029 | July 2029 | July 2030 |
Early commitments remain even when the major construction program moves later. Bear includes $160 million of second-half 2026 construction spending rather than assuming a delayed lease cancels equipment orders already made.
Bull begins earning sooner and finances a larger series of phases:
Bull development phase | Gross MW | Spending begins | Financing closes | First rent |
|---|---|---|---|---|
Moses Lake | 18 | July 2026 | January 2027 | July 2027 |
Sharon | 110 | July 2026 | January 2027 | January 2028 |
Panther Creek 1 | 150 | July 2026 | January 2027 | January 2028 |
Panther Creek 2 | 200 | January 2027 | July 2027 | July 2028 |
Panther Creek 3 | 100 | July 2027 | January 2028 | January 2029 |
Panther Creek 4 | 100 | January 2028 | July 2028 | July 2029 |
Scrubgrass 1 | 150 | April 2027 | October 2027 | April 2029 |
Scrubgrass 2 | 200 | January 2028 | July 2028 | January 2030 |
Scrubgrass 3 | 200 | July 2028 | January 2029 | July 2030 |
Sherbrooke 1 | 48 | July 2027 | January 2028 | January 2029 |
Sherbrooke 2 | 48 | January 2028 | July 2028 | July 2029 |
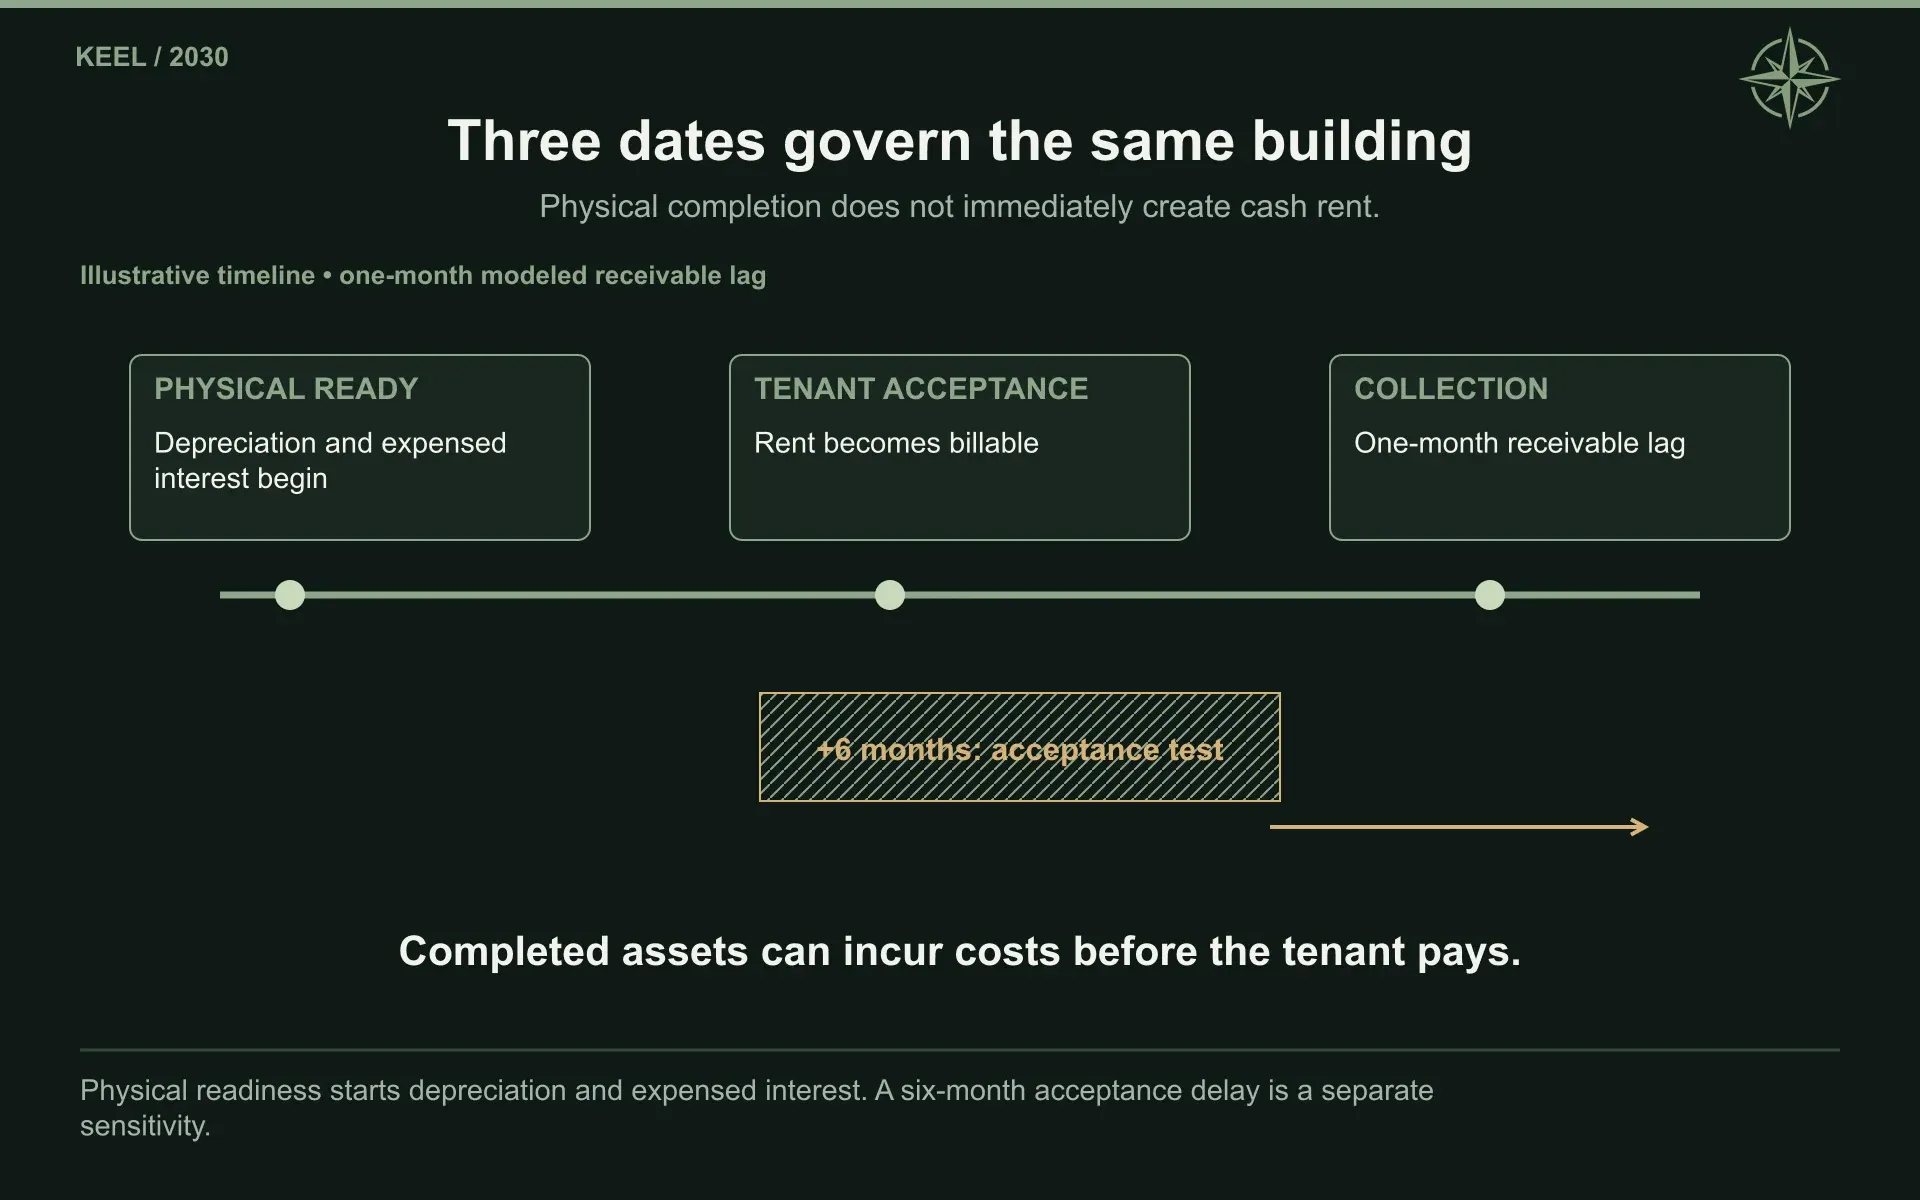
The central schedules place physical readiness one month before first billing and allow another month for rent receivables. Delays can affect those stages differently.
An unfinished building continues through construction. A finished building awaiting tenant acceptance can incur depreciation and expensed interest before it earns rent. KEEL’s accounting policy begins depreciation when assets are ready and available for their intended use, rather than when the first customer payment arrives.
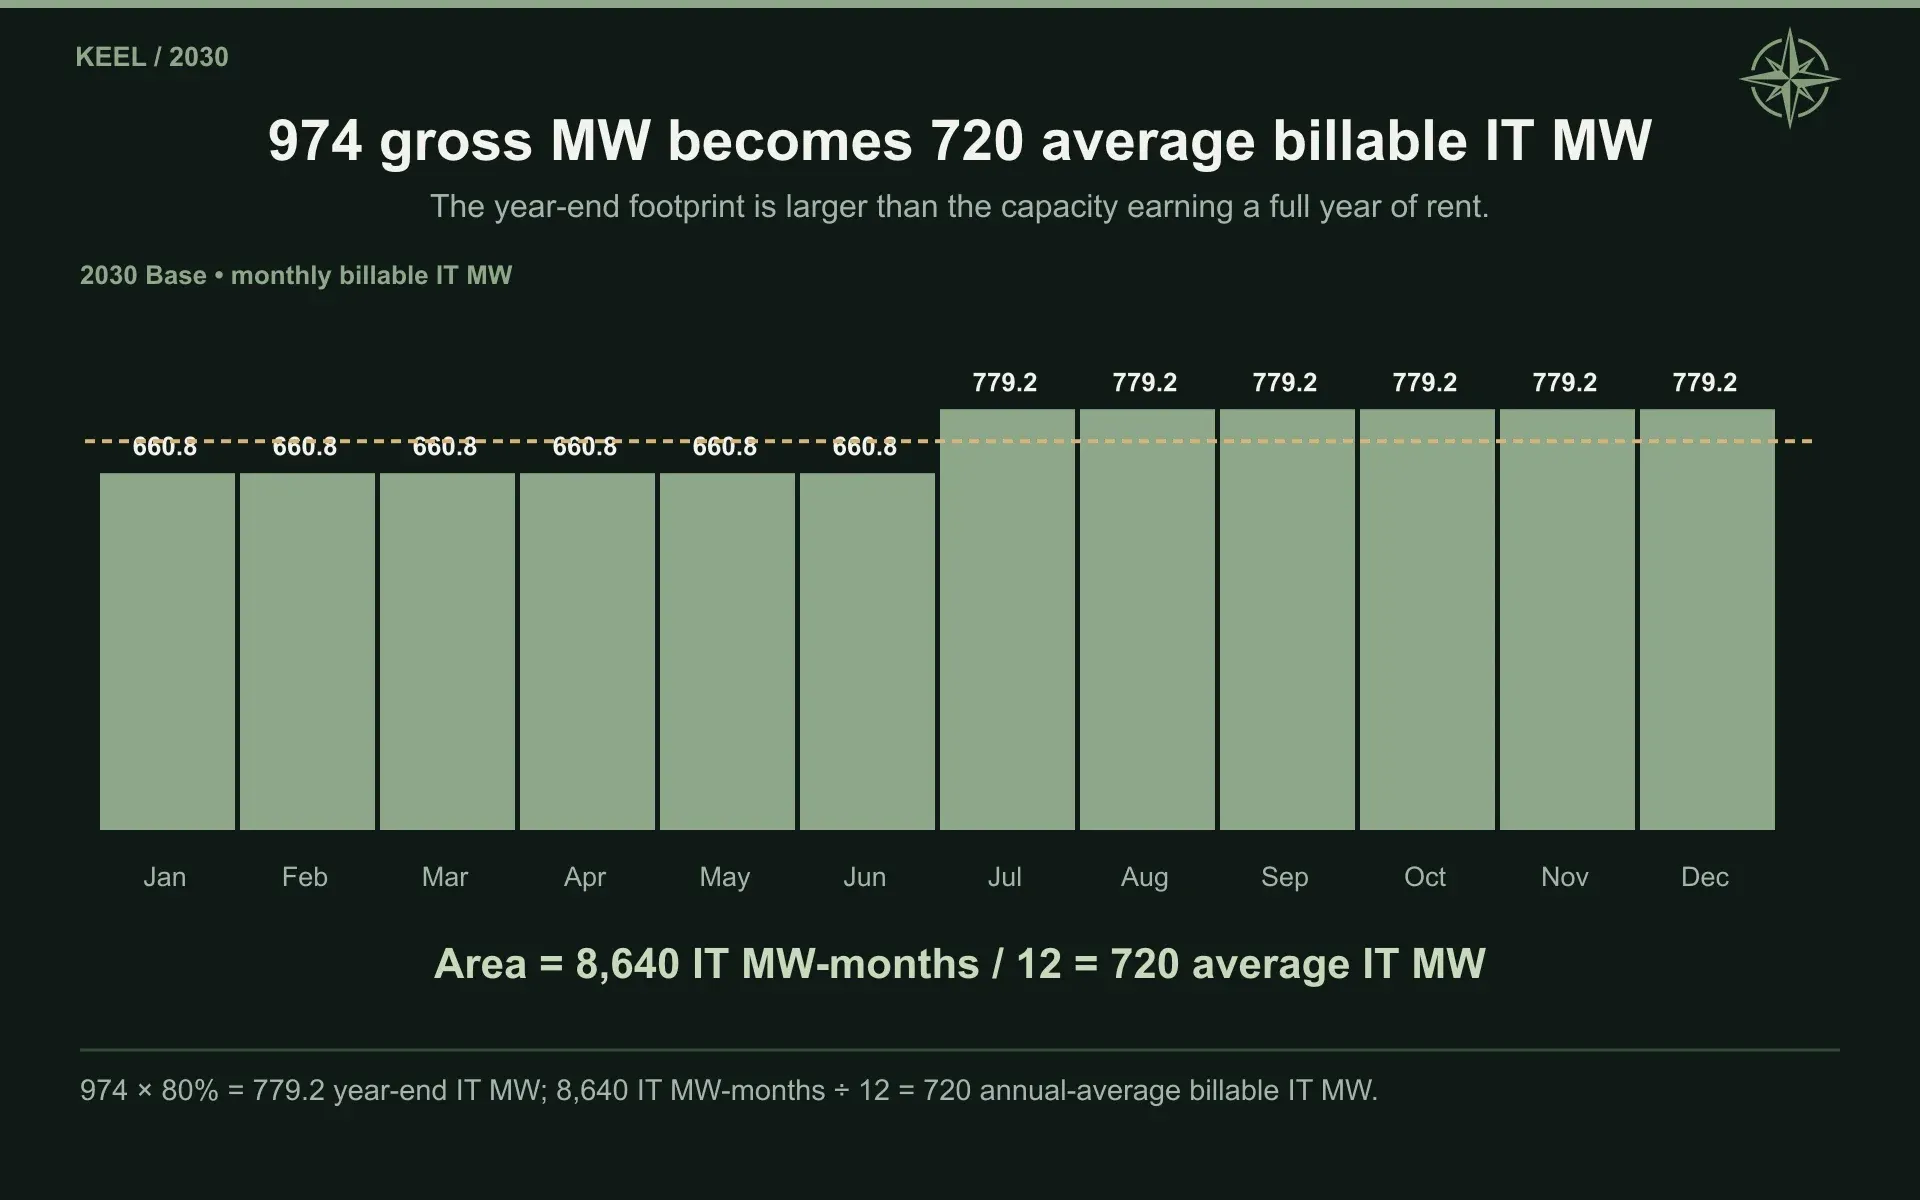
By 2030, the timing calculation remains important even in a much larger company. Base finishes with 779.2 critical IT MW but averages 720 billable IT MW across the year. That is 8,640 IT MW-months of service. Applying a full year of rent to the December footprint would recognize income that the company had not earned.
10. What the Buildings Earn and Cost
Our starting economics vary by site because the proposed services, retained expenses, scale, and construction requirements vary.
Base assumptions per critical IT MW | Initial annual rent | Initial annual owner costs | Hard development expenditure |
|---|---|---|---|
Moses Lake | $1.75m | $0.35m | $13.0m |
Sharon | 1.55 | 0.08 | 10.5 |
Panther Creek | 1.60 | 0.08 | 10.0 |
Scrubgrass | 1.55 | 0.10 | 11.0 |
Sherbrooke | 1.70 | 0.10 | 10.0 |
The scenario assumptions then change capacity conversion, pricing, expenses, and construction costs:
Operating assumption | Bear | Base | Bull |
|---|---|---|---|
Gross power converted to critical IT capacity | 76.923% | 80.000% | 83.333% |
Initial rent relative to the site assumptions | 95% | 100% | 110% |
Construction cost relative to the site assumptions | 105% | 100% | 95% |
Owner operating costs relative to the site assumptions | 110% | 100% | 95% |
Annual rent escalation | 2.0% | 3.0% | 3.0% |
Annual owner-cost escalation | 3.0% | 2.5% | 2.5% |
Annual maintenance investment as a share of commissioned hard cost | 0.90% | 0.75% | 0.65% |
These are estimates of commercial terms that KEEL could achieve, not rents from existing signed leases.
Each phase begins at its own rental level and receives its own anniversary increases. A later building does not reset the rent on an earlier contract. Electricity reimbursements are excluded from our cash-rent measure; reporting them gross could increase revenue and expense without improving the property’s profit.
Once capacity is accepted under the assumed fixed payment obligation, we do not reduce rent again because a tenant uses fewer GPU hours. The relevant risks become the tenant’s ability to pay and KEEL’s ability to satisfy the lease. The tenant’s computing utilization belongs to a different business.
The gross-to-IT conversion is also applied only once. Base’s 974 gross MW becomes 779.2 IT MW. The annual average then adjusts for the months each phase is billable, rather than applying a second physical efficiency reduction.
Base’s hard development budget is:
Site | Whole-project hard development budget |
|---|---|
Moses Lake | $187.2m |
Sharon | 924.0 |
Panther Creek | 4,000.0 |
Scrubgrass | 2,200.0 |
Sherbrooke | 768.0 |
Total | $8,079.2m |
The scope includes the buildings, civil works, electrical and cooling infrastructure, associated professional costs, and construction contingency. Tenant GPUs and third-party generation sit outside it.
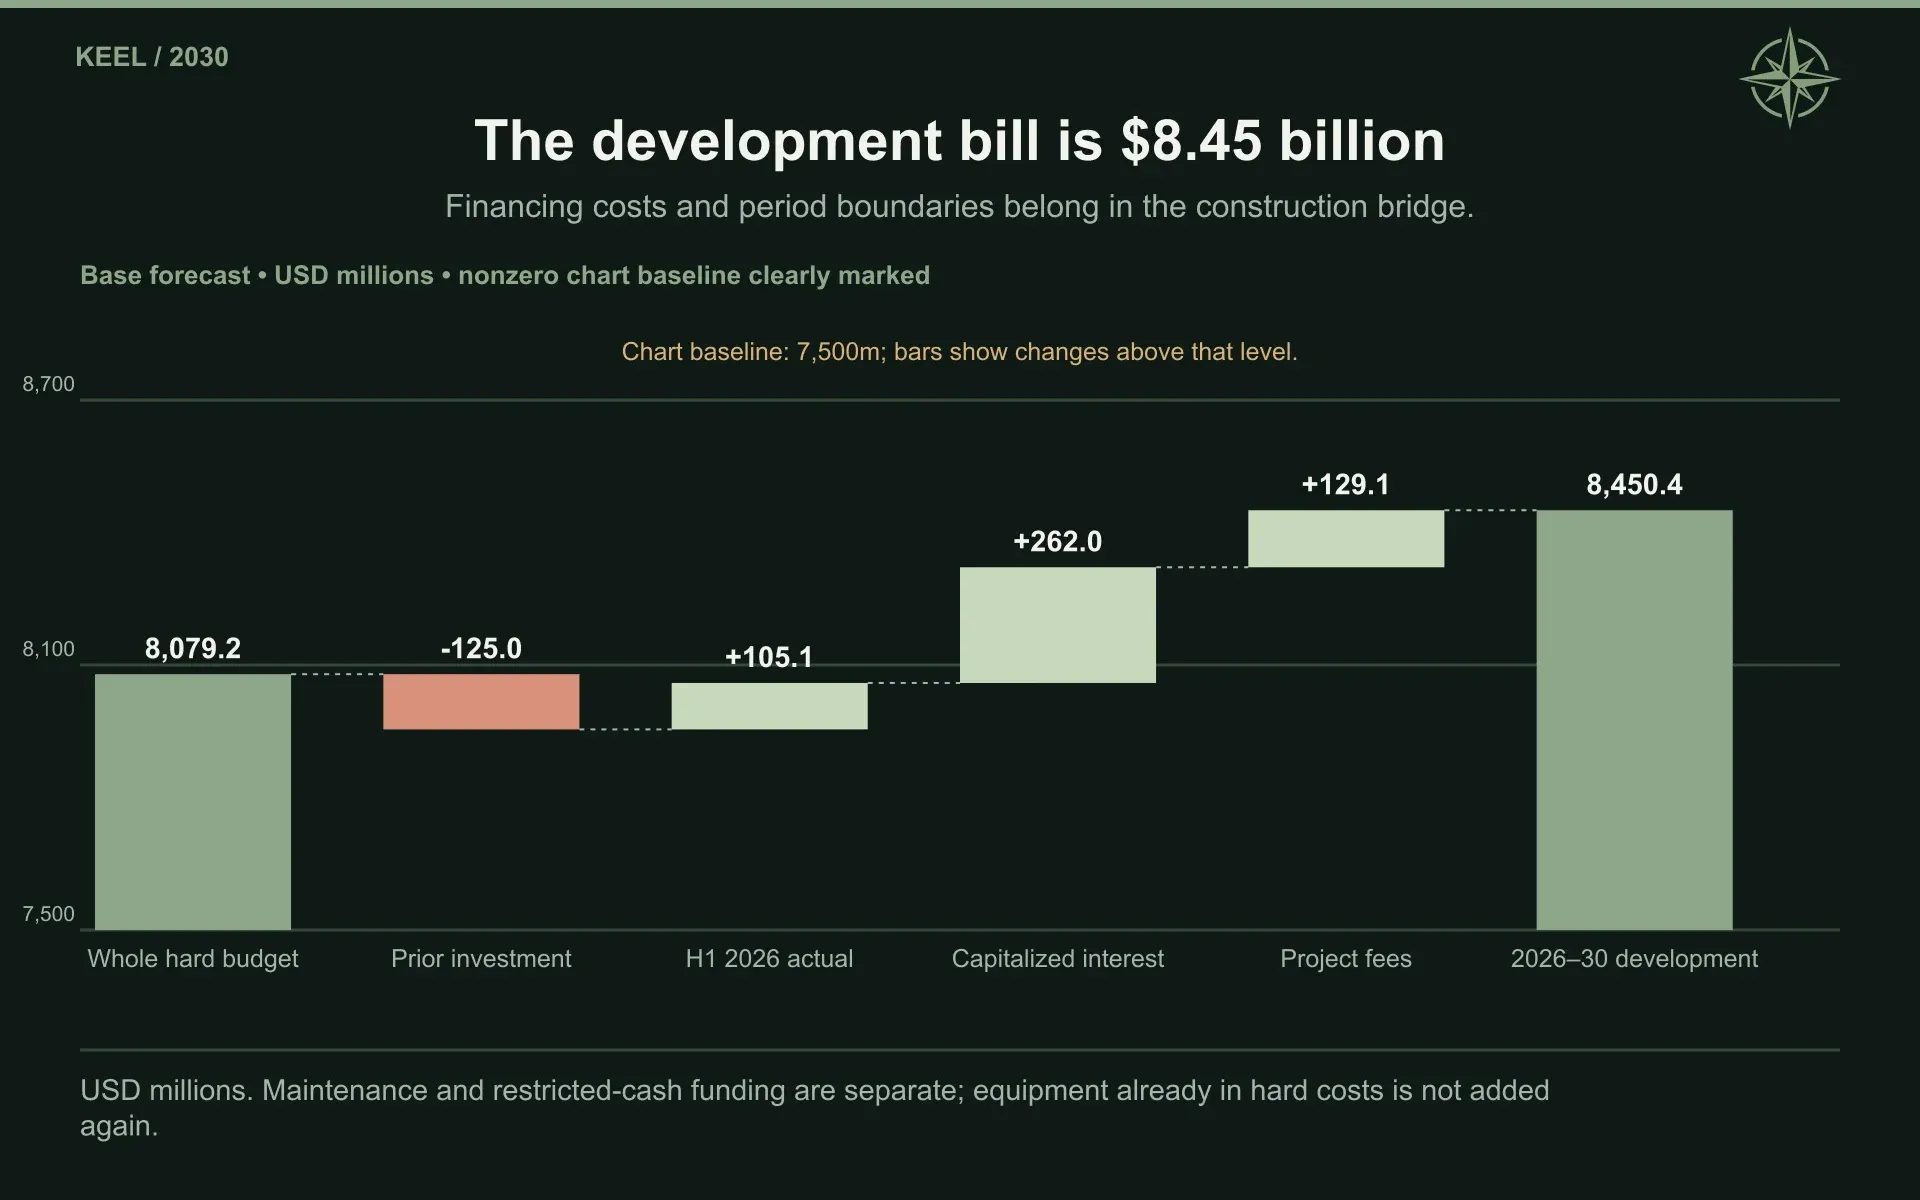
We credit $125 million of prior project capital once, allocated as $80 million to Moses Lake, $30 million to Sharon, and $15 million to Panther Creek’s first phase. This reduces remaining expenditure; it is not another source of cash.
Spending is back-loaded through each construction period, with more paid as the phase approaches completion. The schedule is a planning estimate rather than a contractor invoice register, but it reflects the need to finance equipment and work before the completed asset earns revenue.
Base expenditure, $m | 2026 | 2027 | 2028 | 2029 | 2030 |
|---|---|---|---|---|---|
Construction and equipment | 332.7 | 2,171.6 | 2,477.5 | 2,490.2 | 587.2 |
Capitalized construction interest | 0.0 | 57.4 | 73.1 | 102.3 | 29.2 |
Project financing fees | 0.0 | 46.4 | 52.9 | 29.8 | 0.0 |
Total development expenditure | 332.7 | 2,275.4 | 2,603.5 | 2,622.3 | 616.4 |
Maintenance investment | 0.0 | 0.5 | 18.1 | 34.8 | 55.9 |
Additional restricted cash and reserves | 0.0 | 138.4 | 107.9 | 131.8 | 74.3 |
Total development spending during 2026–2030 reaches approximately $8.45 billion, including construction interest and financing fees. Maintenance and cash reserved for utilities and lenders are separate.
The company’s disclosed remaining capital commitments of $146.9 million for 2026 and $72.7 million for 2027 are included within the spending program. Adding them to the project budgets again would charge twice for the same obligations.
There is room for attractive property economics within these assumptions. There is less room to disregard inflation or specification changes. The 3% Base rent escalator is a nominal contractual increase, not a guarantee that the owner’s purchasing power improves by 3% each year. An unexpected rise in maintenance, insurance, or upgrade costs could absorb much of it.
Likewise, a market shortage can help the rental negotiation while making electrical equipment and construction more expensive. We would judge the eventual lease by the income retained against the completed cost, rather than celebrate higher rent without looking at the investment required to earn it.
11. The Lender’s Version of the Opportunity
A prospective tenant may focus on the date it can move equipment into a building. The lender needs to know how much cash will be available after that happens and what protects it if the schedule slips.
Our project-financing assumptions are:
Financing term | Bear | Base | Bull |
|---|---|---|---|
Maximum loan-to-cost | 70% | 80% | 85% |
Borrowing rate | 8.50% | 7.25% | 6.25% |
Minimum debt-service coverage | 1.40× | 1.35× | 1.30× |
Scheduled amortization period | 20 years | 20 years | 20 years |
Assumed legal loan term | 7 years | 7 years | 7 years |
Financing fee | 2.50% | 2.00% | 1.50% |
Debt-service reserve | Six months | Six months | Six months |
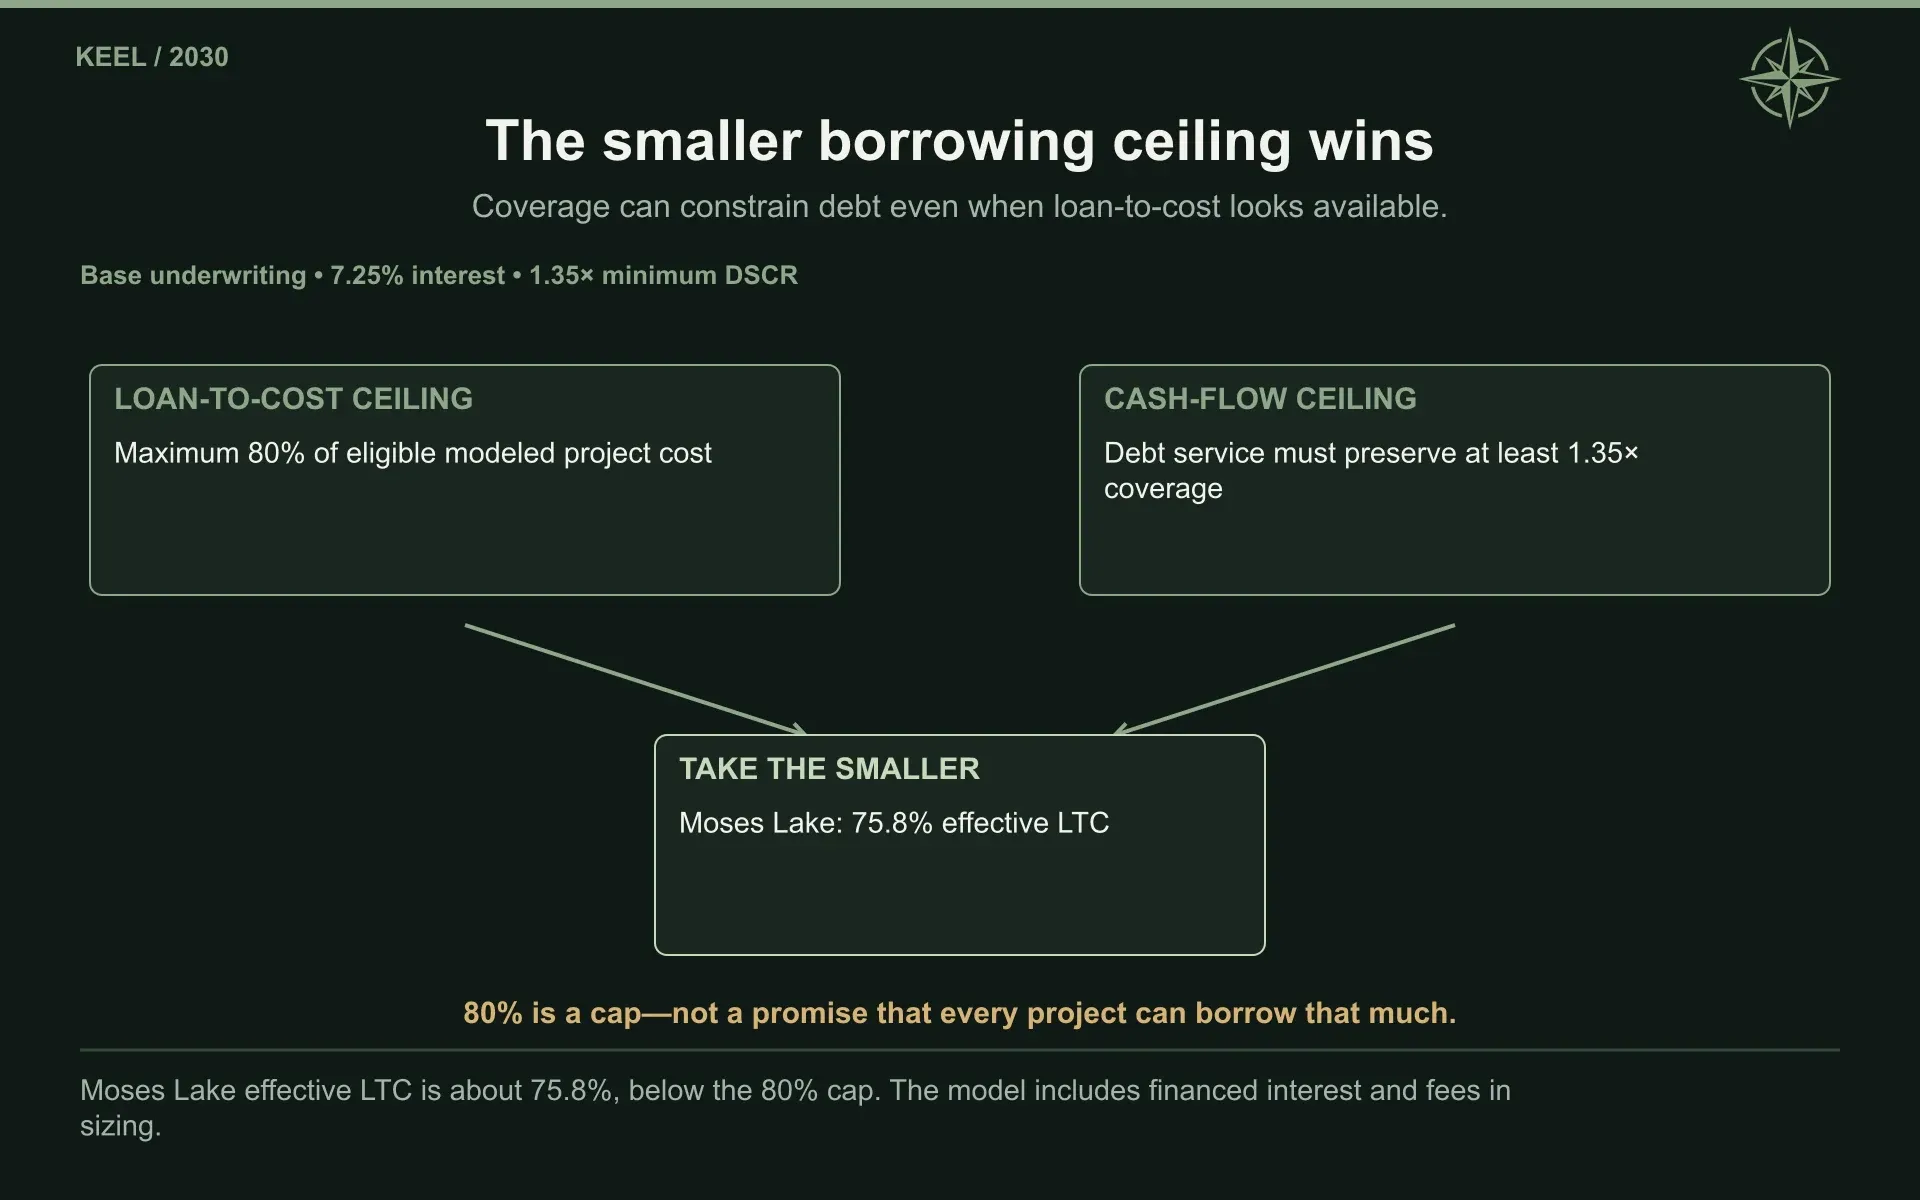
Loan-to-cost measures how much of the eligible development investment can be financed with debt. Debt-service coverage measures the cash available to meet scheduled interest and principal. Borrowing is limited by whichever test allows less debt.
A representative 100-IT-MW Panther Creek phase illustrates the calculation. At Base rents, it receives $160 million annually. Owner expenses of $8 million and maintenance investment of $7.5 million leave $144.5 million available for debt service. Approximately $79.3 million of scheduled annual debt service produces coverage of 1.82 times.
That cushion is useful. It is not the same as having $144.5 million available for the parent to spend elsewhere.
Moses Lake has less borrowing capacity relative to cost. Its higher unit construction expense and greater operating responsibility constrain the loan before it reaches the Base maximum of 80%. The representative coverage calculation supports approximately 75.8% instead.
This is one reason we resist treating debt financing as a fixed percentage automatically available across the portfolio. Tenant credit, operating obligations, project cost, and lender protections all affect the amount KEEL must supply itself.
The broader interest-rate environment will matter, although a forecast of central-bank policy would not settle the financing question. Project lenders price both general interest rates and the risk of the specific loan. Lower policy rates could coexist with more cautious lending if tenants weaken or investors demand greater compensation for development risk.
The finance terms in our forecast are therefore conditional on the commercial outcome. They are not an assumption that a favorable monetary cycle will rescue poor contracts.
Once a loan is outstanding, it remains outstanding if rent deteriorates. A weak period can restrict distributions or require sponsor support. Project reserves and utility collateral also sit outside ordinary parent cash, even though they remain assets of the company.
We assume no mandatory excess-cash sweep in the central forecast. Actual lenders could require one, along with additional recourse or completion guarantees. Those terms would need to be reflected when the financing is signed.
The seven-year legal term creates a further obligation beyond the 2030 forecast. Twenty-year amortization describes the pace of scheduled principal repayment, not the date the lender must be repaid in full. KEEL would still need to refinance substantial balances, sell assets, or repay them from another source when the loans mature.
A strong initial lease makes that task more plausible. Continued tenant performance and a useful, maintained property are what make it repeatable.
12. Running the Company While It Builds
The first-half financial statements show the cost of changing businesses before the new one has started earning.
KEEL reported $67.4 million of revenue and a $210.3 million net loss in the first half of 2026. Approximately $63 million of accelerated depreciation hit the second quarter as mining assets were retired. Derivative gains moved the accounting result in the other direction, but they were not recurring property income.
Our forecast retains those reported first-half results. It then estimates the remaining year and the development business that follows.
Cash operating EBITDA is used to examine earnings before interest, taxes, depreciation, amortization, and stock-based compensation, with our specified treatment of other noncash items. It differs from KEEL’s reported adjusted EBITDA because the adjustments are not identical. Neither measure should be mistaken for the cash ultimately available to shareholders.
Management’s approximately $100 million cash selling, general, and administrative expense outlook anchors the 2026 overhead estimate. The company is hiring the construction, engineering, power, commercial, and operating expertise required for the transition.
Corporate cash G&A, $m | 2026 | 2027 | 2028 | 2029 | 2030 |
|---|---|---|---|---|---|
Bear | 100 | 90 | 75 | 65 | 60 |
Base | 100 | 105 | 110 | 115 | 120 |
Bull | 100 | 110 | 125 | 140 | 150 |
Bear pares back the organization as expansion is deferred. Bull supports a larger company and carries more overhead. We also expense stock-based compensation separately, reaching $26 million, $55 million, and $75 million in the respective 2030 scenarios.
The legacy operations diminish rather than vanish from every revenue line immediately. Canadian mining, energy sales, electrical services, and other remaining activity continue contributing to the reported business. We assign only modest prospective cash generation to that aggregate and no mining windfall to fund construction.
Legacy operations, $m | 2026 | 2027 | 2028 | 2029 | 2030 |
|---|---|---|---|---|---|
Bear revenue | 109.4 | 62.0 | 48.0 | 28.0 | 8.0 |
Base revenue | 115.4 | 68.0 | 35.0 | 17.0 | 14.0 |
Bull revenue | 117.4 | 54.0 | 22.0 | 15.0 | 18.0 |
Bear cash contribution | (8.8) | 4.2 | 3.7 | 3.7 | 2.0 |
Base cash contribution | (8.8) | 4.5 | 4.0 | 3.5 | 3.5 |
Bull cash contribution | (8.8) | 4.6 | 5.1 | 3.5 | 4.5 |
The new infrastructure then creates a substantial depreciation expense. We use twenty years for the modeled development investment and ten years for maintenance assets. Those lives apply to KEEL’s infrastructure, not to GPUs owned by its customers.
The earnings forecast recognizes cash rent. Future financial statements may recognize some fixed rental increases on a straight-line basis, producing accounting revenue earlier than the corresponding collections. Construction still needs to be funded from actual cash.
Tax introduces another difference between accounting earnings and liquidity. In the United States, limits on business-interest deductions can prevent the full interest expense from reducing taxable income immediately. The availability of exceptions or elections depends on the particular facts. (IRS)
Our tax projections separate the U.S. and Canadian businesses, apply a 25% planning rate, track prospective losses and disallowed interest, and grant no unverified opening tax-loss asset. The simplified schedules use interest-deduction constraints and cap U.S. loss utilization at 80% of positive income. They are financial estimates, not a reconstruction of KEEL’s eventual tax returns.
Base can consequently report an analytical net loss of $33.3 million in 2029 while paying $7.3 million of cash tax. The 2030 cash-tax estimate rises to $25.9 million. An accumulated accounting deficit on the balance sheet is not enough reason to assume the tax bill will remain zero.
13. Following the Cash
KEEL’s ability to negotiate patiently comes from a much stronger treasury than it had earlier in the transition.
June 30, 2026 reported balance | $m |
|---|---|
Unrestricted cash | 715.5 |
Unrestricted Bitcoin | 132.4 |
Combined cash and Bitcoin | 847.9 |
Restricted cash, separate from the above | 53.4 |
Net property, plant and equipment | 287.1 |
Long-term deposits and equipment prepayments | 81.3 |
Total assets | 1,415.8 |
Total liabilities | 1,087.1 |
Book equity | 328.7 |
These are the opening financial balances in the forecast. The August 7 liquidity update, approximately $698 million of cash and $121 million of Bitcoin, is a later observation of the same treasury rather than an additional funding source.
The June convertible-note proceeds are already in cash, after the relevant issuance expenses and capped-call purchase. The former Macquarie facility was fully repaid in February and is not carried as available borrowing capacity.
We assume the opening Bitcoin position is monetized by year-end without appreciation and use a 3% prospective cash yield. That keeps the construction forecast separate from a speculative view on the price of Bitcoin.
Management described the liquidity as sufficient to advance the priority developments through lease signing and fund cash SG&A through 2028. It did not say the entire eventual portfolio was already financed. The filing explicitly anticipates additional capital requirements as HPC development expands.
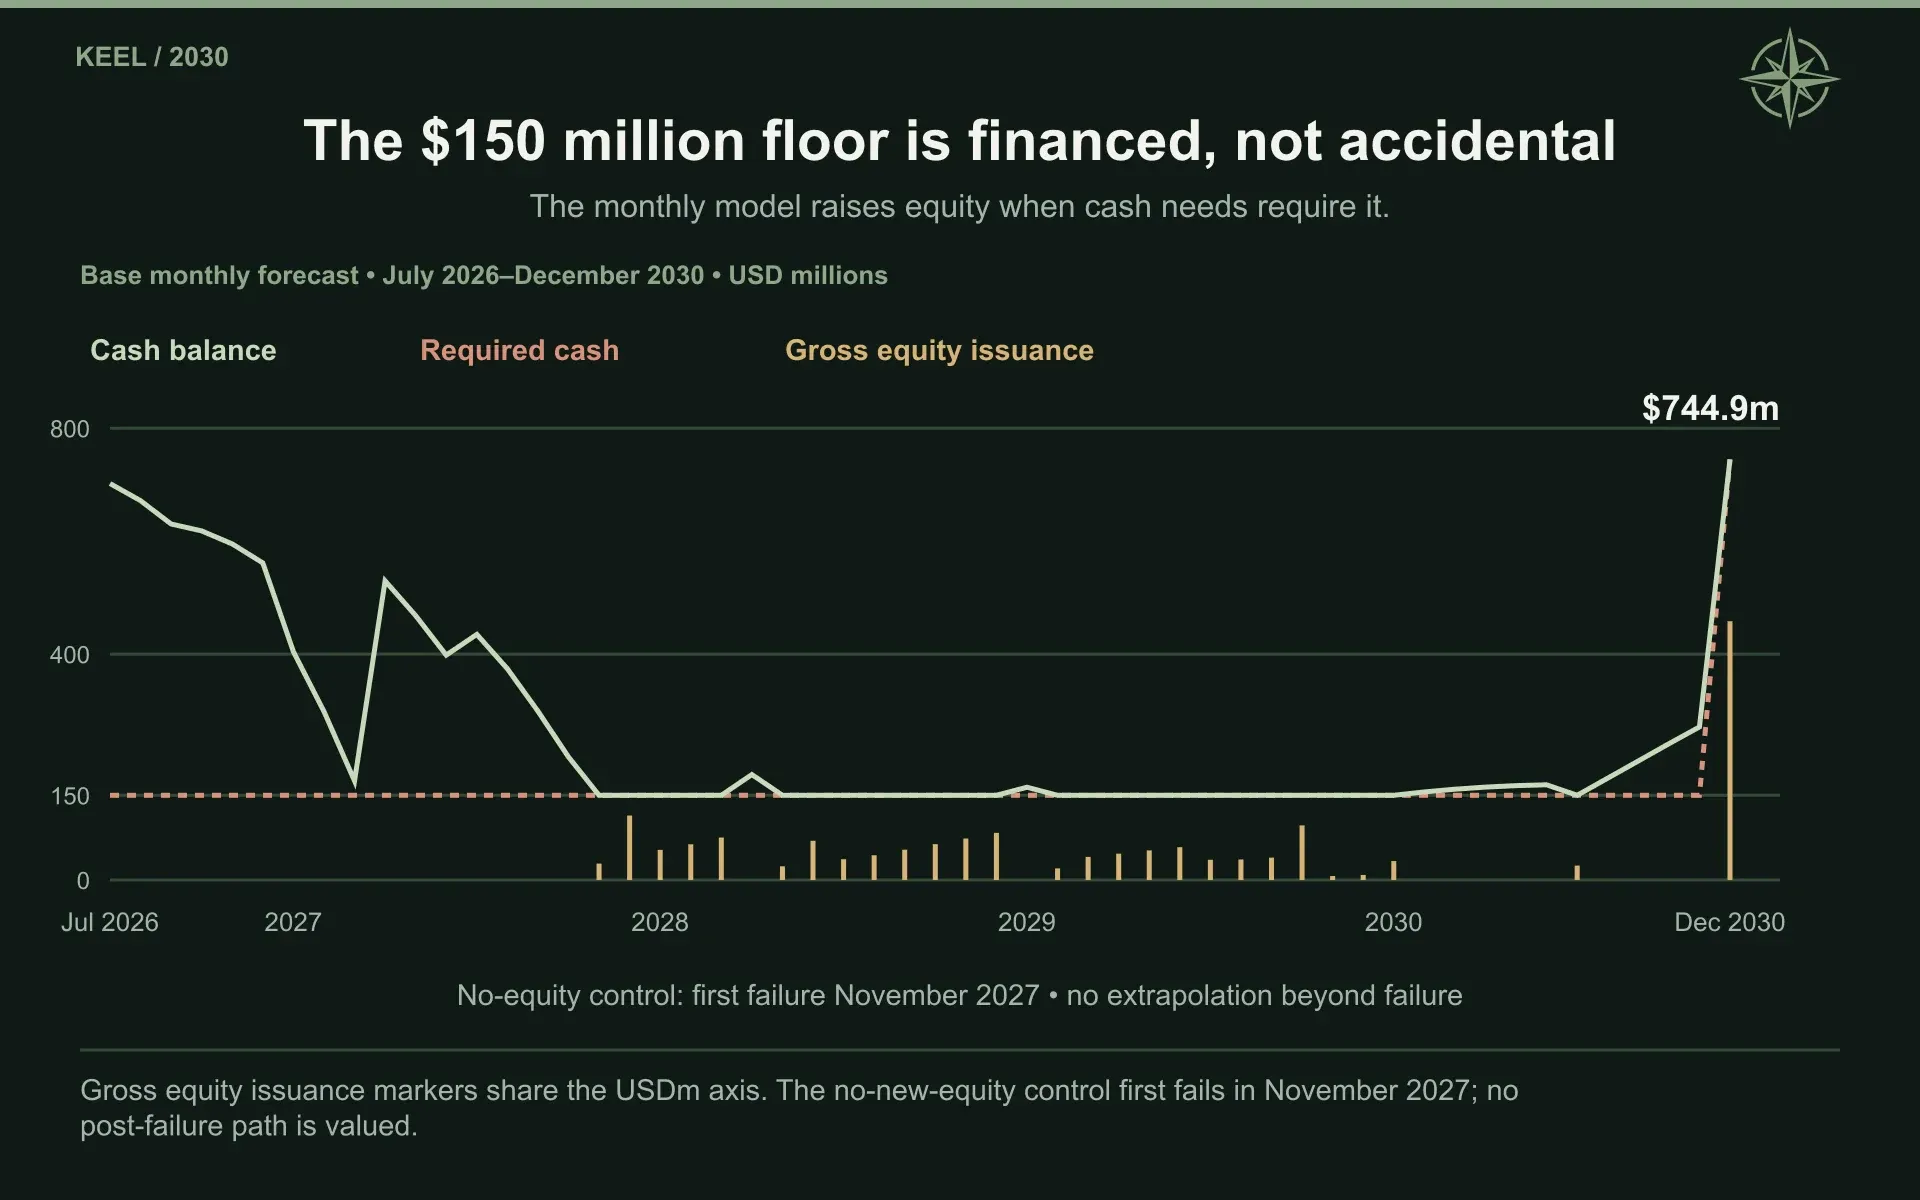
The monthly cash schedule shows where the new money is needed:
Base funding, $m | H2 2026 | 2027 | 2028 | 2029 | 2030 |
|---|---|---|---|---|---|
Beginning unrestricted cash | 715.5 | 561.4 | 150.0 | 150.0 | 150.0 |
Cash after operations and scheduled debt service, before development | (58.9) | (106.0) | (12.8) | 116.0 | 288.2 |
Development expenditure | (227.6) | (2,275.4) | (2,603.5) | (2,622.3) | (616.4) |
Additional restricted cash and reserves | 0.0 | (138.4) | (107.9) | (131.8) | (74.3) |
Project-debt proceeds | 0.0 | 1,968.7 | 2,100.0 | 2,206.1 | 493.2 |
Net common-equity proceeds | 0.0 | 139.7 | 624.1 | 432.0 | 504.4 |
Realization of opening Bitcoin | 132.4 | 0.0 | 0.0 | 0.0 | 0.0 |
Ending unrestricted cash | 561.4 | 150.0 | 150.0 | 150.0 | 744.9 |
The recurring $150 million balance is our minimum operating-cash requirement. Equity is raised as needed to preserve it, subject to the financing constraints described below. It is not the amount construction happens to leave behind each December.
The monthly calculation is important because an annual cash balance can hide a shortage earlier in the year. A phase beginning rent in October cannot pay a construction invoice due in June unless the company has another source of money.
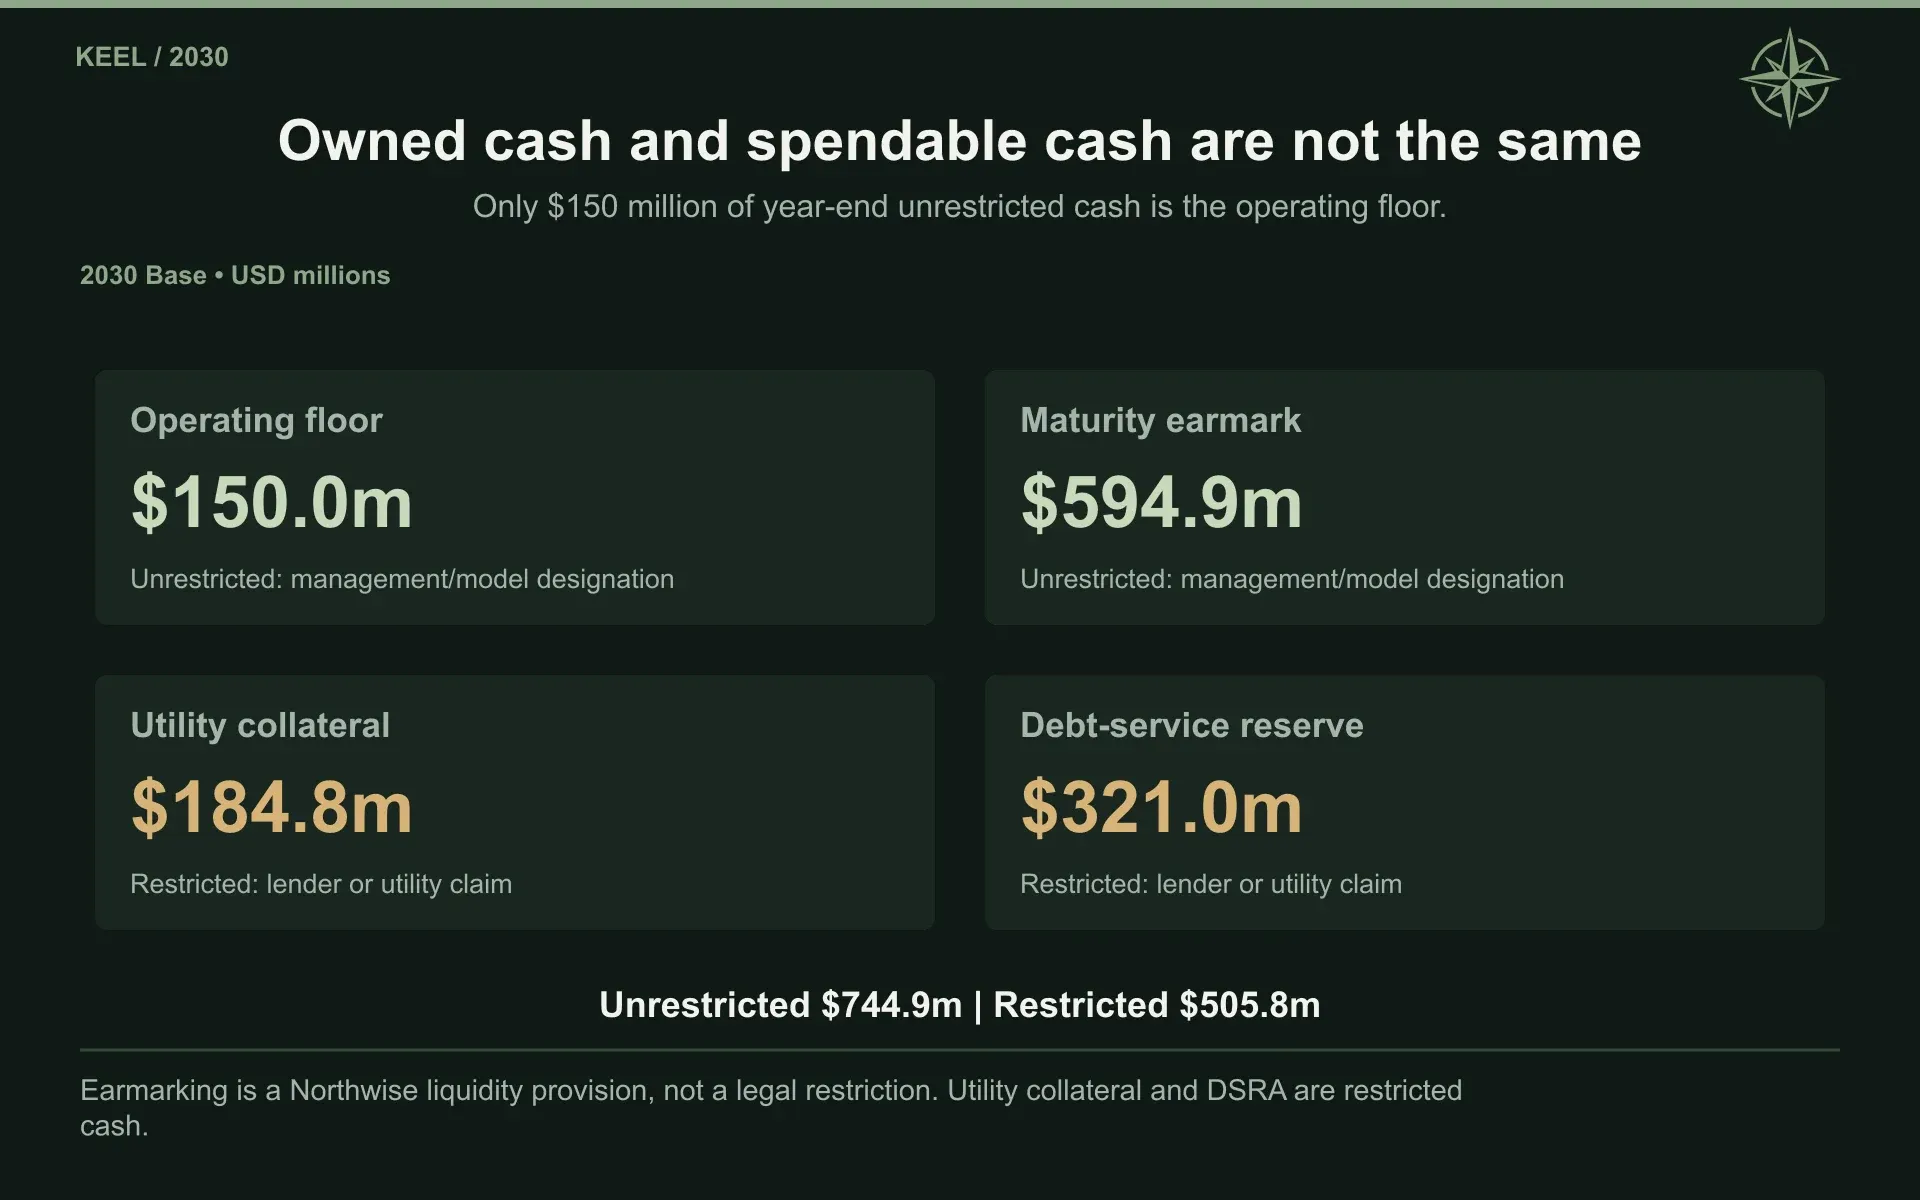
Restricted cash grows too. KEEL disclosed utility credit-support requirements, including a potential additional $60.8 million obligation and a separate arrangement estimated at $82.9 million in total, part of which was already funded. Our forecast assumes cash collateralization of the remaining requirements, without an early release or an unsupported replacement facility.
Base ends 2030 with approximately $184.8 million of utility collateral and $321.0 million of debt-service reserves. These balances remain owned assets, but lenders and utilities have claims on their availability.
The larger unrestricted cash balance at the end of 2030 also has a specific purpose. Approximately $594.9 million is earmarked for note principal and January coupons, leaving the $150 million operating floor. It would be misleading to describe the whole $744.9 million as surplus cash available for expansion or distributions.
14. New Shareholders and Old Debt
The most consequential cost of the development program may be the ownership KEEL sells to complete it.
The forecast calculates new shares from the cash required and the assumed price at which equity can be issued:
Assumed gross issuance price per share | 2026 | 2027 | 2028 | 2029 | 2030 |
|---|---|---|---|---|---|
Bear | $3.44 | $2.50 | $2.50 | $2.00 | $2.25 |
Base | 3.44 | 5.50 | 8.00 | 10.00 | 12.00 |
Bull | 3.44 | 7.00 | 11.00 | 16.00 | 20.00 |
These prices are financing assumptions, not our valuation targets. No new common equity is raised during 2026 in the forecast.
Base assumes commercial and operating progress improves the price at which KEEL can finance itself. That is reasonable to examine, but it remains a material source of risk. The company cannot choose the market price of its next offering.
Issuance expenses consume 3% of gross proceeds in Bear, 2.5% in Base, and 2% in Bull. We also impose a $2.5 billion gross common-equity financing envelope in each scenario. This is a Northwise planning limit, not evidence that investors have committed that amount.
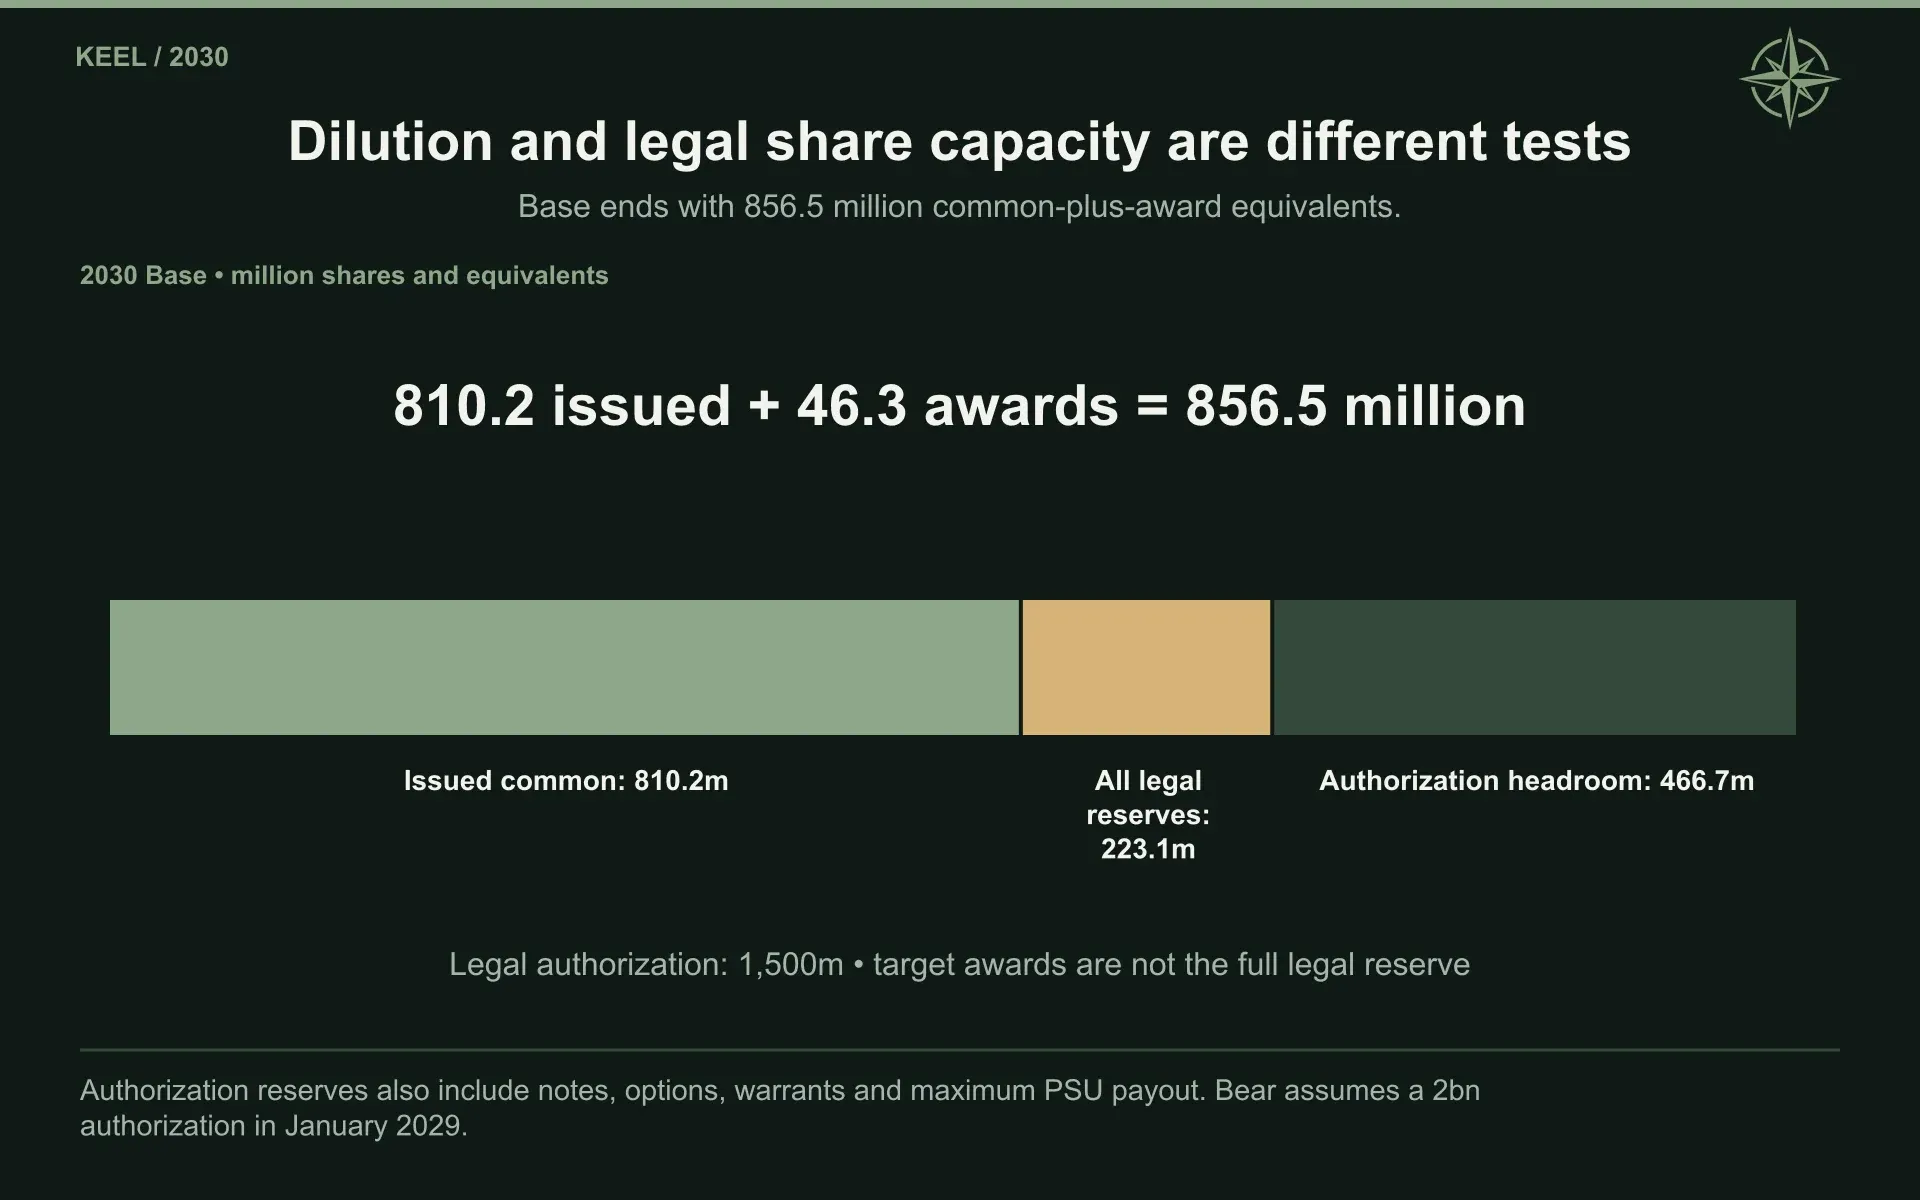
Authorized-share capacity is a separate constraint. KEEL had 616.7 million common shares outstanding at June 30, alongside approximately 10.4 million restricted stock units and 8.9 million performance stock units. The forecast includes awards at target performance for economic dilution and separately reserves for the higher potential payout when testing share authorization.
Future awards add 3 million equivalents during the second half of 2026, followed by annual allowances of 5 million in Bear, 6 million in Base, and 7 million in Bull.
By 2030, Base has 856.5 million common shares plus award equivalents. Bear reaches approximately 1.385 billion while completing less infrastructure, because its funding occurs at lower prices. Bull ends at approximately 778 million under stronger financing and operating conditions.
The surviving Bear case assumes an increase in authorized common shares from 1.5 billion to 2 billion in January 2029. Such approval has not been established by the company disclosures used here. Without it or another capital solution, the later Bear funding fails.
The existing convertible notes create another set of obligations:
Instrument | Principal | Annual coupon | Approximate conversion price | Maturity |
|---|---|---|---|---|
2025 notes | $588m | 1.375% | $6.86 | January 15, 2031 |
2026 notes | $458m | 1.250% | $7.4125 | January 15, 2032 |
Convertible notes combine a debt claim with the ability to participate in the stock under specified terms. Their comparatively low coupons do not eliminate the principal that must eventually be settled. Both maturities are contractual.
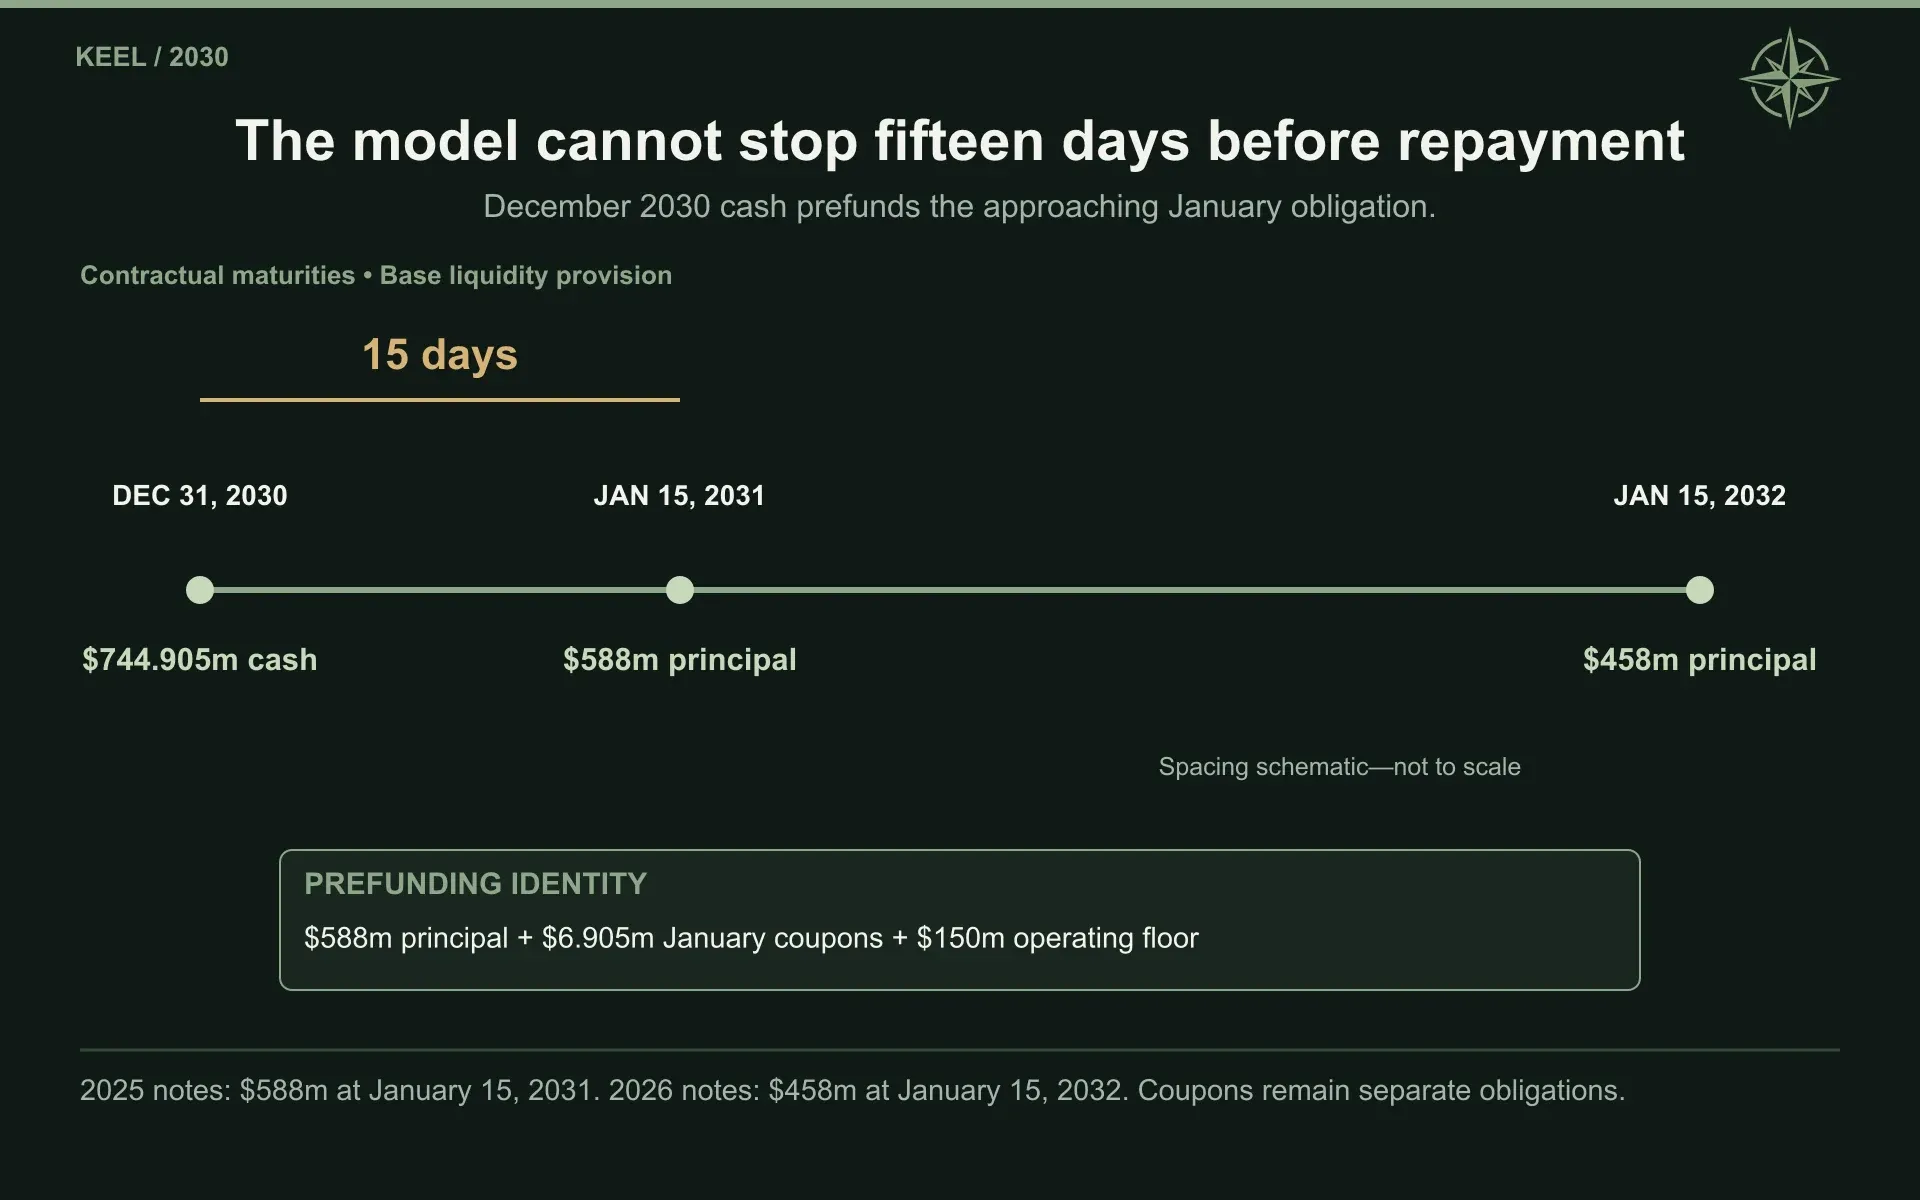
The first falls only fifteen days after the end of our principal forecast. We therefore prefund it rather than allow the analysis to stop just before the payment:
$588m principal +$6.905m January coupons +$150m operating floor =$744.905m
KEEL also purchased capped calls, separate derivative contracts intended to offset some conversion-related dilution or cash cost over a defined price range. The 2025 structure is cash-settled with an approximately $11.88 cap. The 2026 structure, capped at approximately $11.86, is modeled through a share offset. The protection ends at the applicable cap and does not cancel the underlying debt.
We extend the cash forecast through 2032 to examine settlement. The extension uses planning share prices of $2.25 in Bear, $12 in Base, and $20 in Bull, with principal paid in cash and the specified conversion value above principal settled in shares.
Maturity extension | Bear 2031 | Bear 2032 | Base 2031 | Base 2032 | Bull 2031 | Bull 2032 |
|---|---|---|---|---|---|---|
Cash before further development, $m | 126.7 | 143.5 | 347.5 | 384.9 | 715.1 | 780.6 |
Note principal paid, $m | 588.0 | 458.0 | 588.0 | 458.0 | 588.0 | 458.0 |
Hedge cash receipts, $m | 0.0 | 0.0 | 429.7 | 0.0 | 429.7 | 0.0 |
Gross new common equity, $m | 337.4 | 0.0 | 0.0 | 0.0 | 0.0 | 0.0 |
Settlement shares issued, millions | 0.0 | 0.0 | 36.7 | 0.7 | 56.3 | 25.1 |
Ending unrestricted cash, $m | 560.9 | 246.4 | 934.1 | 861.0 | 1,351.7 | 1,674.3 |
Under these assumptions, Base and Bull need no further common-equity raise in 2031. Bear requires approximately $337 million.
The hedge receipt is part of that result. We would not describe the second maturity as funded entirely from ordinary rental cash flow, nor assume the actual settlement price must match our forecast. The extension tests a defined financial path and makes its dependence on the stock and hedge visible.
15. The Full Annual Financial Forecast
The transition is financially awkward even when it succeeds.
Legacy revenue falls first. New infrastructure rent arrives later, while construction and corporate expenses precede it. By the time the property income becomes substantial, interest, depreciation, and scheduled principal repayment have become substantial too.
The three forecasts below carry those obligations through every year.
All dollar amounts are millions except earnings per share. Share counts are millions. The 2026 income and development figures combine reported first-half results with our second-half forecast; the 2026 cash-before-development row covers only the second half.
Analytical earnings and EPS use cash-rent recognition. They are not predictions of every future GAAP lease-accounting or fair-value adjustment.
The surviving Bear case completes the original 478 MW program late and with expensive equity financing. It produces a real rental business, but relatively little cash remains after debt service.
Bear forecast | 2026 | 2027 | 2028 | 2029 | 2030 |
|---|---|---|---|---|---|
Year-end ready gross MW | 0 | 18 | 18 | 228 | 478 |
Annual-average billable IT MW | 0.0 | 0.0 | 13.8 | 56.2 | 271.5 |
HPC cash rent | 0.0 | 0.0 | 23.0 | 85.8 | 412.9 |
Total revenue | 109.4 | 62.0 | 71.0 | 113.8 | 420.9 |
Cash operating EBITDA | (108.8) | (85.8) | (53.6) | 15.3 | 326.4 |
Stock-based compensation | 32.6 | 30.0 | 28.0 | 26.0 | 26.0 |
Depreciation and amortization | 131.8 | 20.0 | 19.7 | 39.1 | 155.4 |
Expensed interest | 12.8 | 14.2 | 23.3 | 52.1 | 192.8 |
Cash tax | 0.0 | 0.0 | 0.0 | 0.0 | 2.7 |
Analytical net earnings | (311.8) | (141.7) | (121.8) | (111.0) | (63.1) |
Analytical basic EPS | (0.511) | (0.230) | (0.198) | (0.152) | (0.060) |
Development expenditure | 265.1 | 94.1 | 493.7 | 2,125.4 | 1,143.0 |
Maintenance investment | 0.0 | 0.0 | 1.7 | 5.9 | 26.5 |
Gross new common equity | 0.0 | 0.0 | 0.0 | 520.1 | 1,047.9 |
Ending unrestricted cash | 629.0 | 426.2 | 209.2 | 100.0 | 694.9 |
Ending restricted cash | 53.4 | 184.8 | 190.5 | 226.3 | 334.4 |
Ending gross financial debt | 1,051.1 | 1,159.7 | 1,512.3 | 3,108.6 | 3,864.9 |
Common shares plus award equivalents | 639.0 | 644.0 | 649.0 | 914.1 | 1,384.8 |
Cash before further development | (58.9) | (87.0) | (73.3) | (58.9) | 29.4 |
Base brings the initial Pennsylvania phases into billing sooner and uses their operating contribution while later phases are developed. Scrubgrass, Sherbrooke, and the additional Panther Creek buildings make the company much larger by 2030.
Base forecast | 2026 | 2027 | 2028 | 2029 | 2030 |
|---|---|---|---|---|---|
Year-end ready gross MW | 0 | 228 | 478 | 826 | 974 |
Annual-average billable IT MW | 0.0 | 4.8 | 232.4 | 452.0 | 720.0 |
HPC cash rent | 0.0 | 8.4 | 369.9 | 731.8 | 1,180.8 |
Total revenue | 115.4 | 76.4 | 404.9 | 748.8 | 1,194.8 |
Cash operating EBITDA | (108.8) | (93.8) | 241.3 | 578.8 | 996.8 |
Stock-based compensation | 32.6 | 40.0 | 45.0 | 50.0 | 55.0 |
Depreciation and amortization | 131.8 | 23.2 | 134.6 | 246.9 | 394.0 |
Expensed interest | 12.8 | 17.7 | 157.9 | 288.4 | 451.0 |
Cash tax | 0.0 | 0.0 | 0.1 | 7.3 | 25.9 |
Analytical net earnings | (311.8) | (174.4) | (110.3) | (33.3) | 51.8 |
Analytical basic EPS | (0.511) | (0.282) | (0.161) | (0.045) | 0.067 |
Development expenditure | 332.7 | 2,275.4 | 2,603.5 | 2,622.3 | 616.4 |
Maintenance investment | 0.0 | 0.5 | 18.1 | 34.8 | 55.9 |
Gross new common equity | 0.0 | 143.3 | 640.1 | 443.1 | 517.3 |
Ending unrestricted cash | 561.4 | 150.0 | 150.0 | 150.0 | 744.9 |
Ending restricted cash | 53.4 | 191.8 | 299.7 | 431.5 | 505.8 |
Ending gross financial debt | 1,051.1 | 3,017.7 | 5,070.6 | 7,183.2 | 7,521.2 |
Common shares plus award equivalents | 639.0 | 671.0 | 757.1 | 807.4 | 856.5 |
Cash before further development | (58.9) | (106.0) | (12.8) | 116.0 | 288.2 |
Bull benefits from more than additional capacity. Better rental economics, lower construction costs, earlier cash generation, and more favorable financing prices reinforce one another.
Bull forecast | 2026 | 2027 | 2028 | 2029 | 2030 |
|---|---|---|---|---|---|
Year-end ready gross MW | 0 | 278 | 626 | 1,124 | 1,324 |
Annual-average billable IT MW | 0.0 | 7.5 | 315.0 | 677.1 | 1,020.0 |
HPC cash rent | 0.0 | 14.4 | 552.3 | 1,207.5 | 1,834.0 |
Total revenue | 117.4 | 68.4 | 574.3 | 1,222.5 | 1,852.0 |
Cash operating EBITDA | (108.8) | (93.5) | 404.5 | 1,012.1 | 1,596.3 |
Stock-based compensation | 32.6 | 45.0 | 55.0 | 65.0 | 75.0 |
Depreciation and amortization | 131.8 | 24.7 | 168.9 | 348.7 | 533.5 |
Expensed interest | 12.8 | 19.2 | 182.3 | 371.0 | 554.8 |
Cash tax | 0.0 | 0.0 | 3.8 | 27.6 | 132.8 |
Analytical net earnings | (312.0) | (181.5) | (19.3) | 179.9 | 283.6 |
Analytical basic EPS | (0.511) | (0.293) | (0.029) | 0.253 | 0.395 |
Development expenditure | 386.0 | 3,084.3 | 3,969.7 | 3,243.3 | 786.6 |
Maintenance investment | 0.0 | 0.6 | 20.0 | 42.9 | 65.9 |
Gross new common equity | 0.0 | 180.4 | 655.2 | 203.9 | 262.9 |
Ending unrestricted cash | 507.9 | 200.0 | 200.0 | 238.5 | 794.9 |
Ending restricted cash | 53.4 | 192.0 | 334.8 | 476.8 | 613.1 |
Ending gross financial debt | 1,051.1 | 3,892.4 | 7,213.9 | 9,917.4 | 10,337.6 |
Common shares plus award equivalents | 639.0 | 671.8 | 738.3 | 758.1 | 778.2 |
Cash before further development | (59.1) | (106.2) | 77.6 | 363.5 | 553.2 |
The earnings rows include treasury income and smaller financing and other items not separately displayed. Basic EPS uses weighted-average issued common shares, rather than the year-end common-plus-award figures.
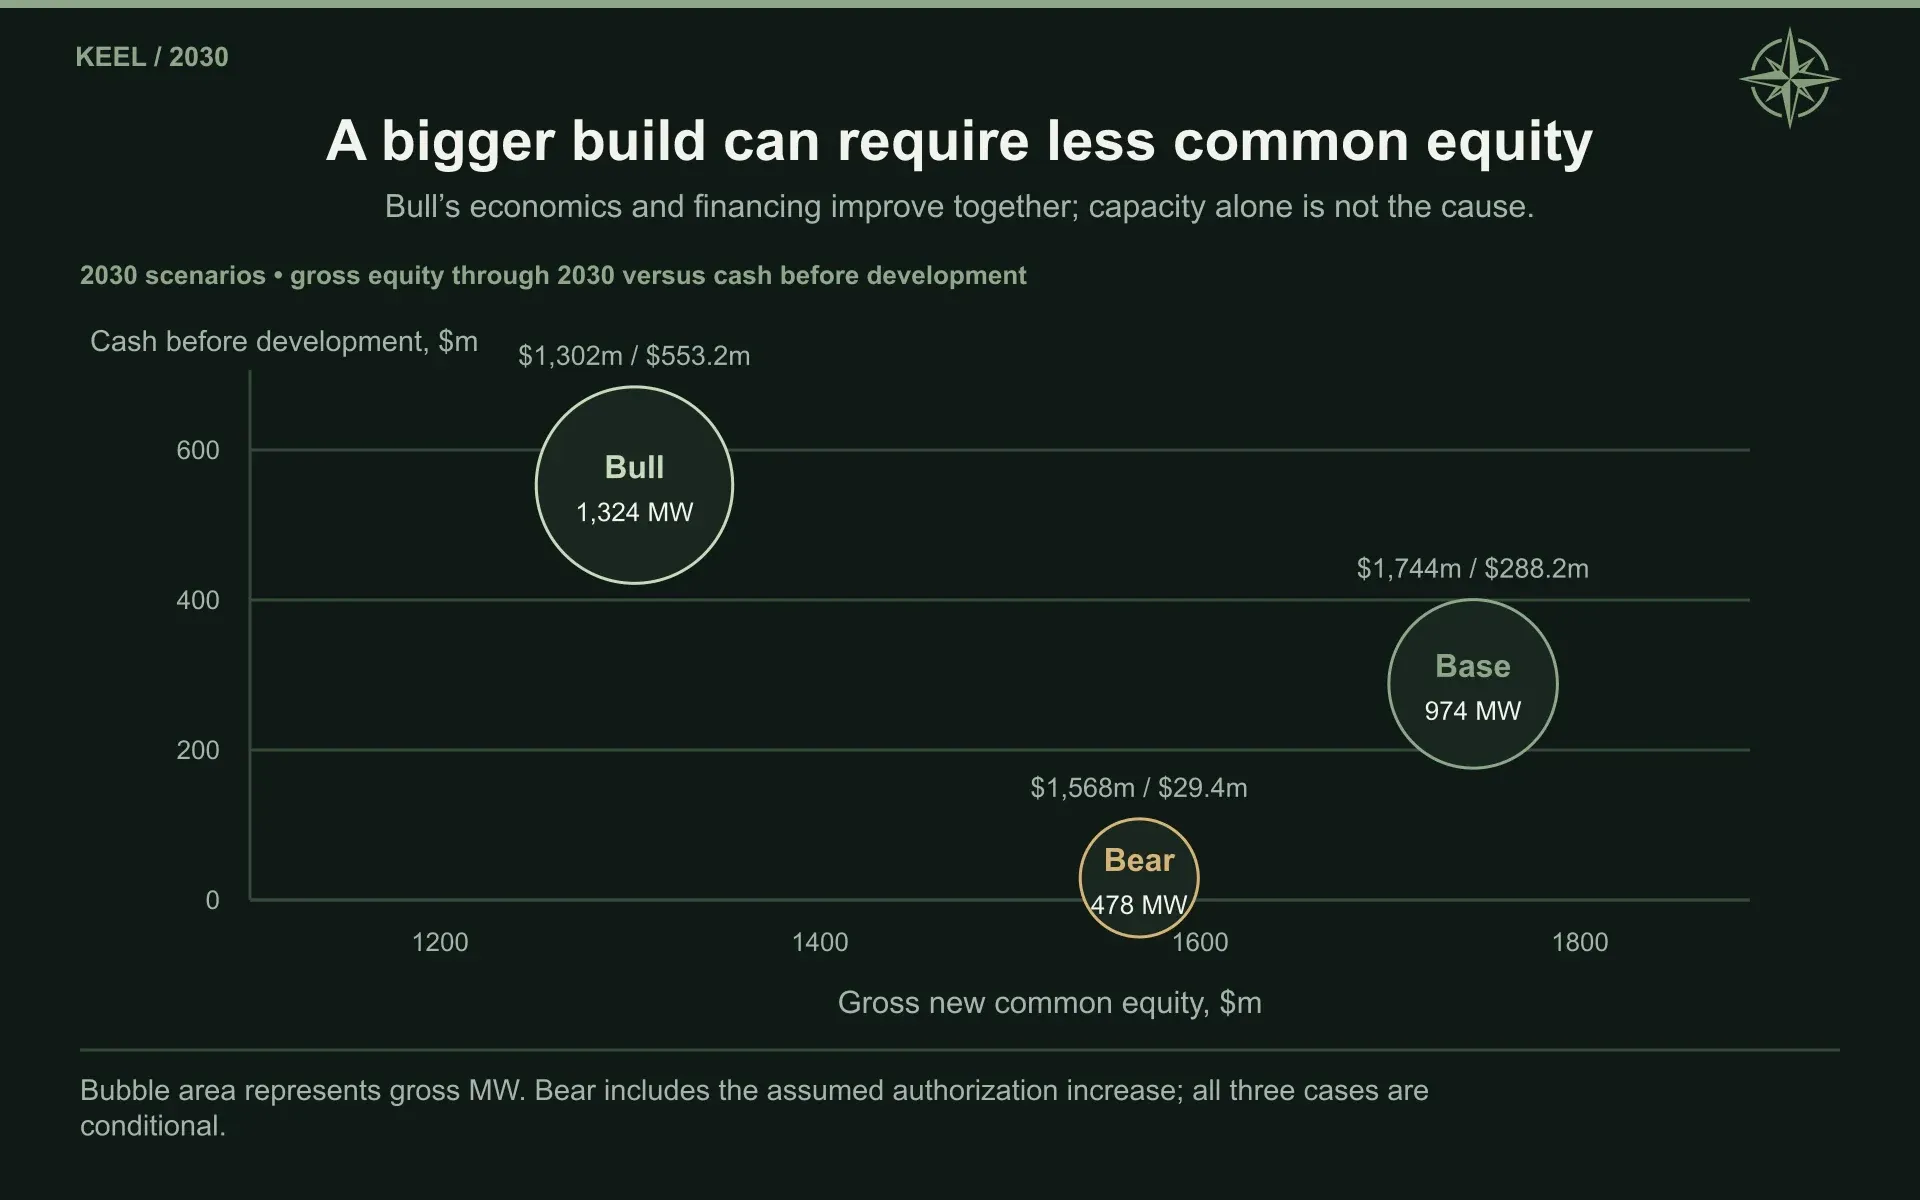
Bull raises approximately $1.30 billion of gross common equity through 2030, compared with $1.74 billion in Base and $1.57 billion in Bear. It can fund a larger program with fewer common-equity dollars because its operating and financing conditions are stronger. That relationship would reverse if management pursued the larger build without obtaining those conditions.
Base’s analytical balance sheet accumulates the infrastructure alongside the obligations used to finance it:
Base balance sheet, $m | 2026 | 2027 | 2028 | 2029 | 2030 |
|---|---|---|---|---|---|
Unrestricted cash | 561.4 | 150.0 | 150.0 | 150.0 | 744.9 |
Restricted cash | 53.4 | 191.8 | 299.7 | 431.5 | 505.8 |
Net capital assets | 579.0 | 2,785.3 | 5,219.4 | 7,599.8 | 7,878.0 |
Other assets before modeled receivables | 143.2 | 143.2 | 143.2 | 143.2 | 143.2 |
Modeled receivables | 0.0 | 2.1 | 37.5 | 80.9 | 107.1 |
Total assets | 1,336.9 | 3,272.3 | 5,849.7 | 8,405.3 | 9,379.0 |
Total liabilities | 1,090.5 | 3,020.6 | 5,039.2 | 7,146.1 | 7,508.6 |
Book equity | 246.4 | 251.7 | 810.5 | 1,259.2 | 1,870.4 |
Smaller opening accounts are carried on an analytical basis rather than forecasting every future fair-value movement. The resulting book equity is an accounting balance, not an appraisal of the properties.
The 2030 cash bridge is more revealing about how much freedom the company has earned:
Base 2030 cash conversion, $m | Amount |
|---|---|
Cash operating EBITDA | 996.8 |
Treasury income | 5.4 |
Interest | (451.0) |
Cash taxes | (25.9) |
Maintenance investment | (55.9) |
Scheduled principal repayment | (155.1) |
Working capital | (26.2) |
Cash before further development | 288.2 |
A company earning almost $1 billion before financing and other obligations retains less than one-third of that amount before its remaining development bill. The properties are contributing meaningfully, but the capital program is still influencing what the parent can do with the proceeds.
The separate $616.4 million of development spending in 2030 explains why we would not treat the $288.2 million as an immediately distributable dividend.
16. When Several Things Go Wrong Together
The more credible Bear argument begins with a company that finds customers.
KEEL signs agreements, builds useful infrastructure, and earns rent. Construction then costs more than expected, the customer accepts a phase later than planned, and the next equity offering occurs at a weak price. The finished properties can still be valuable while the original shareholders own much less of them.
The risks reinforce one another. A delay postpones cash while increasing carrying costs. A weaker balance sheet can make the next financing more expensive. Prospective tenants may become more cautious about a developer whose funding is less certain.
Management itself identified broader capital-market conditions, financing opportunities, interest rates, and intercompany financing across the AI industry as major risks on the August call. That is an important qualification to the claim that scarce near-term power gives KEEL negotiating strength.
The isolated operating sensitivities show where the pressure appears:
Change from Base | Gross common equity required | 2030 cash before further development |
|---|---|---|
Base assumptions | $1.744bn | $288.2m |
Initial rents 10% lower | 1.966 | 185.3 |
Construction costs 10% higher | 2.081 | 232.9 |
Borrowing rates two percentage points higher | 2.054 | 194.9 |
Maximum loan-to-cost reduced to 70% | 2.398 | 363.8 |
Physical completion delayed six months | 2.002 | 188.4 |
Tenant acceptance delayed six months | 2.356 | 77.5 |
Permanent maintenance requirements doubled | 1.860 | 235.8 |
Reducing debt produces more cash after debt service, but it raises the common-equity requirement. That can be a sensible trade when equity is available on acceptable terms. The financing problem is obtaining the extra money without surrendering too much ownership.
Acceptance delays create a different strain. The finished building is carrying expenses before the tenant begins paying, which cuts 2030 cash before development to approximately $77.5 million in the six-month test.
The more demanding tests ask whether the stated program can proceed at all:
Financing or approval constraint | First modeled failure |
|---|---|
No additional common equity available | November 2027 |
Gross common equity limited to $1 billion | June 2029 |
Bear authorization remains at 1.5 billion common shares | December 2030 |
Required permit denied | April 2027 in the defined project test |
Combined downside | June 2029 |
The combined downside applies lower rents, higher construction costs, more expensive and less available debt, a completion delay, and lower equity issuance prices. The resulting program exhausts the $2.5 billion common-equity envelope.
At that point, management needs to change the plan. It could defer optional capacity, sell assets, admit a partner, or recapitalize. Each response has different consequences. Continuing to value the full completed portfolio without accounting for the missing capital would overstate what existing shareholders can reasonably expect.
Macroeconomic demand is not sufficient protection against that outcome. AI usage could continue expanding while customers consolidate around better-capitalized providers or renegotiate future developments. Strong demand for computing does not require every landlord to earn the same return.
There are physical risks after opening as well. Changing equipment densities can require additional electrical or cooling work even when KEEL never owns the GPUs. Reliability failures, cyber incidents, disputes over acceptance, and interruptions to power can affect collection or create expenditure. The company’s risk disclosures address these exposures alongside competition, community opposition, environmental requirements, and supply-chain constraints.
The central maintenance allowances recognize an ongoing cost of preserving the properties. They cannot establish that every future hardware configuration will fit without modification.
We have also retained the disclosed litigation and potential customs exposure as unquantified contingencies rather than invent a settlement figure. Their absence from a specific annual cash line is not a finding that the eventual cost must be zero.
Our overall assessment is that the proposed properties can absorb several individual disappointments and remain useful investments. The original development schedule becomes much harder to defend when commercial weakness, delays, and expensive capital arrive together.
17. Assessing the Possible Outcomes
The first lease matters enormously, but it is only the first major commercial condition.
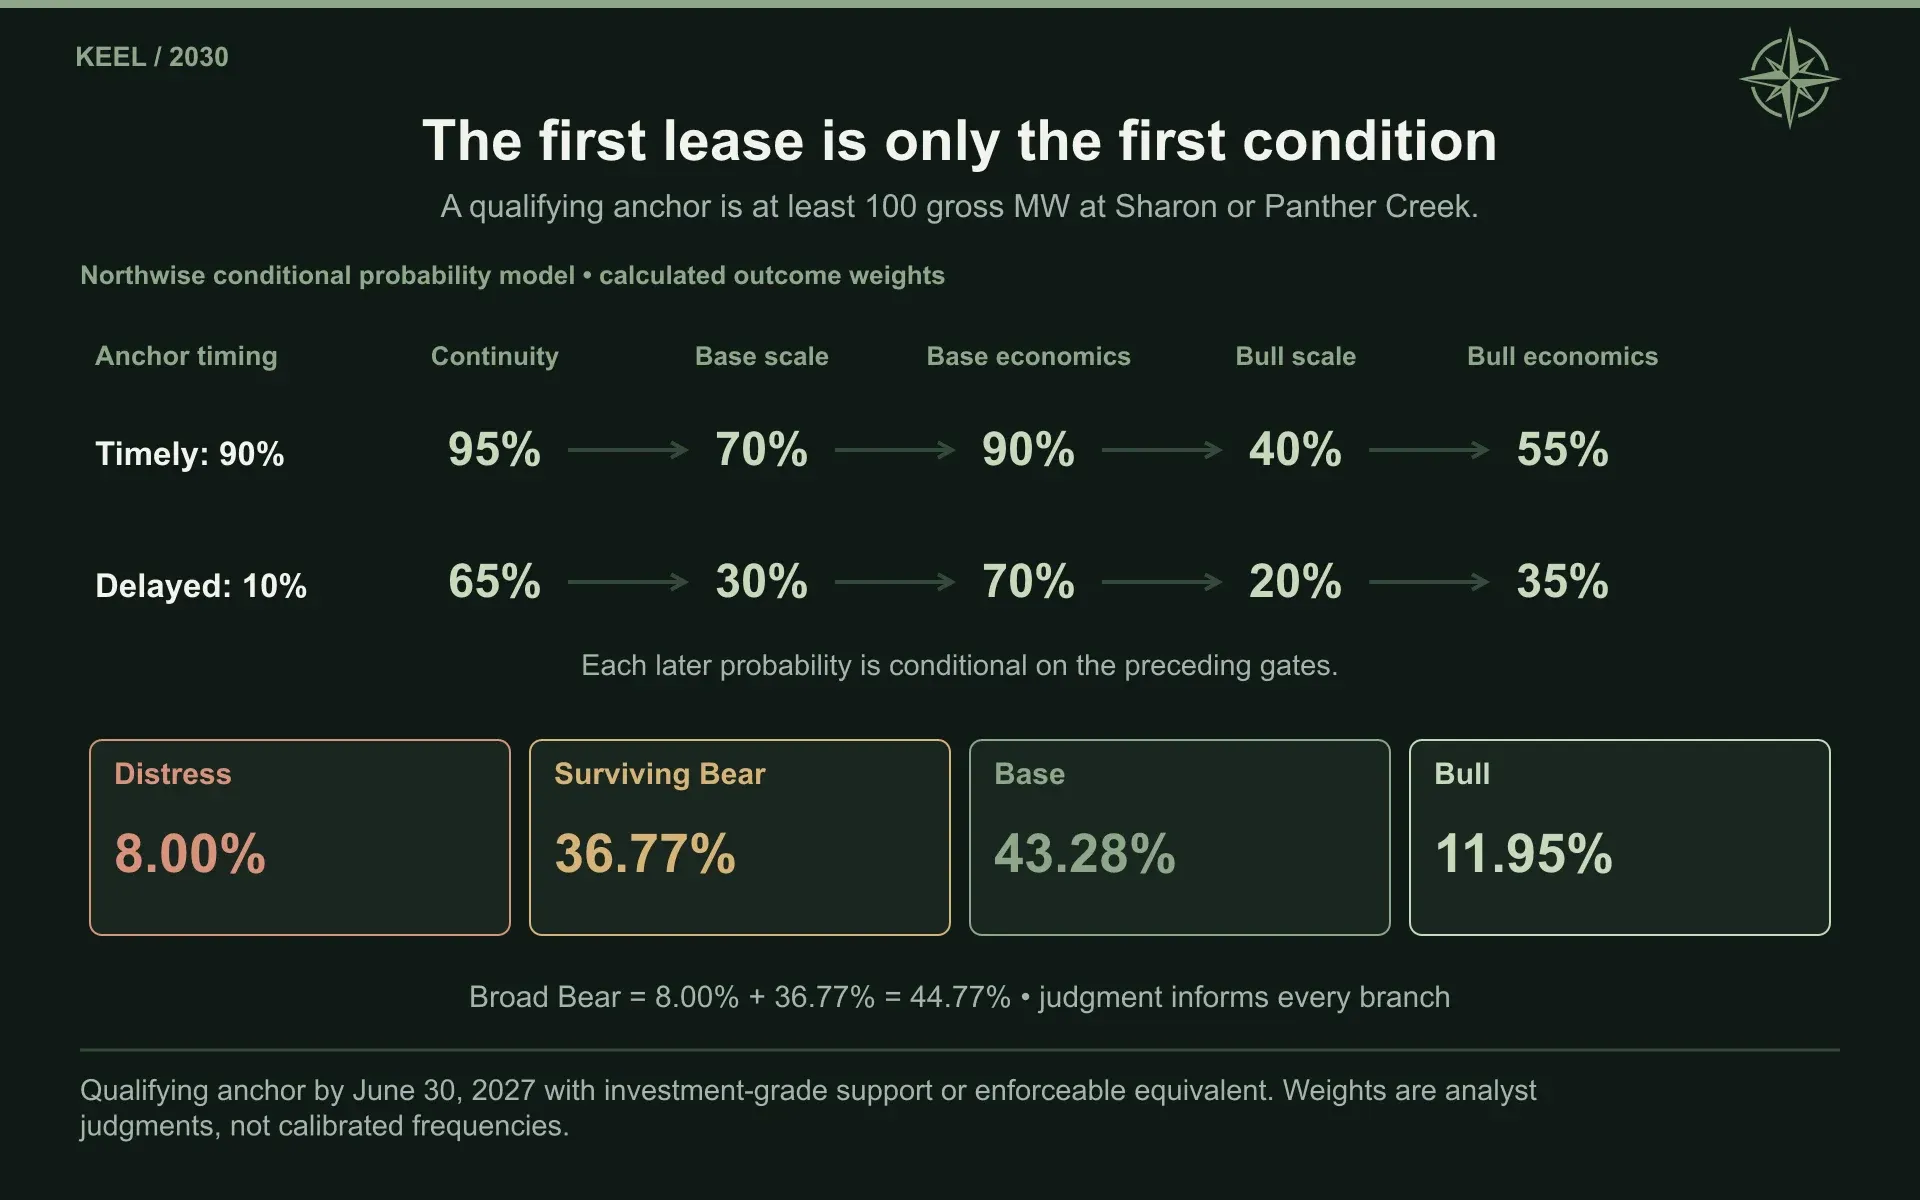
We define a qualifying anchor as at least 100 gross MW of contracted development at Sharon or Panther Creek, supported by investment-grade credit or an enforceable equivalent, by June 30, 2027. Our estimated probability is 90%.
That is a favorable assessment of the commercial engagement, site progress, and negotiating time described in the company’s disclosures. It is not a measured signing frequency. Management’s August account of multiple prospective tenants across the priority sites supports a high-confidence commercial view, but the contract itself remains outstanding in the evidence used here.
Subsequent conditions depend on whether the anchor arrives within that window:
Conditional assumption | Timely anchor | Anchor delayed |
|---|---|---|
Avoids a distressed recapitalization through 2030 | 95% | 65% |
Reaches Base-like scale, conditional on avoiding distress | 70% | 30% |
Retains Base-like shareholder economics at that scale | 90% | 70% |
Reaches Bull scale after satisfying the preceding conditions | 40% | 20% |
Achieves Bull-like economic value capture | 55% | 35% |
Base-like scale requires approximately 900 completed gross MW and 650 annual-average billable IT MW by 2030, together with broadly central-case economics. Bull requires approximately 1,200 completed gross MW and 950 average billable IT MW, alongside its stronger economic conditions.
This keeps a larger but heavily diluted company from automatically qualifying as Bull. It also allows a delayed anchor to lead to survival and eventual development rather than treating every missed date as insolvency.
The calculations are:
P(financing continuity) =.90(.95)+.10(.65) =92.00%
P(Base or better) =.90(.95)(.70)(.90)+.10(.65)(.30)(.70) =55.23%
P(Bull) =.90(.95)(.70)(.90)(.40)(.55) +.10(.65)(.30)(.70)(.20)(.35) =11.94585%
The resulting outcome weights are:
Outcome | Calculated probability |
|---|---|
Distressed financing or recapitalization | 8.00% |
Surviving but below the full Base outcome | 36.77% |
Base | 43.28% |
Bull | 11.95% |
The broad Bear category totals 44.77%, including distress.
These probabilities are calculated from analyst estimates informed by the evidence. Their arithmetic is precise; the underlying judgment is not statistically calibrated. We retain that distinction because a complicated formula should not make an uncertain assumption appear measured.
The expansion probability is especially important. Lowering the timely-anchor path’s chance of reaching Base scale from 70% to 50% raises broad Bear to approximately 60.16%, with Base at 31.28% and Bull at 8.56%.
Our confidence in an initial lease is therefore much higher than our confidence in the entire expansion. We think that is appropriate for a company whose priority campuses are in active commercial discussions while later developments still need important power and approval milestones.
The categories also cover more than one exact timetable. Meeting the anchor definition by June 2027 would not automatically validate the April financing dates in our central schedule. The financial cases are representative development paths within broader outcome ranges.
The next disclosures should allow those ranges to narrow. A signed lease will establish the customer, credit support, economics, and delivery conditions. A financing close will reveal the actual sponsor contribution and restrictions on cash. Tenant acceptance will test whether KEEL can turn its construction commitments into billable infrastructure.
Additional Panther Creek or Scrubgrass power agreements and Sherbrooke’s final approvals would then strengthen the case for expansion. Equity issuance and construction-cost disclosures will show whether that progress is preserving the ownership assumed in the forecast.
We believe the company has advanced far enough to warrant this detailed operating case. The most useful evidence now will come from contracts and delivery, rather than another increase in the headline number of potential megawatts.
Northwise Premium: What Should Investors Pay?
The research and operating forecasts above show what KEEL could build, what it would cost, and how the company could finance it. Northwise Premium adds our valuation of each outcome, the probability-weighted 2030 share target, the assumptions with the greatest effect on that value, and the entry prices required to earn an adequate annual return.
Northwise Premium
Choose how to continue with Northwise
Join Northwise Premium
Unlock the rest of this report, its complete valuation, the downloadable model, portfolios, and action framework.
Join Northwise PremiumCreate a Free Account
Continue across Free Northwise research, follow companies, save reports, and receive updates.
Create a Free Account
KEEL Scrubgrass Site Analysis
Our Keel Scrubgrass site analysis covers a potential AI data center campus, with PJM power, gas optionality, and meaningful expansion leverage.
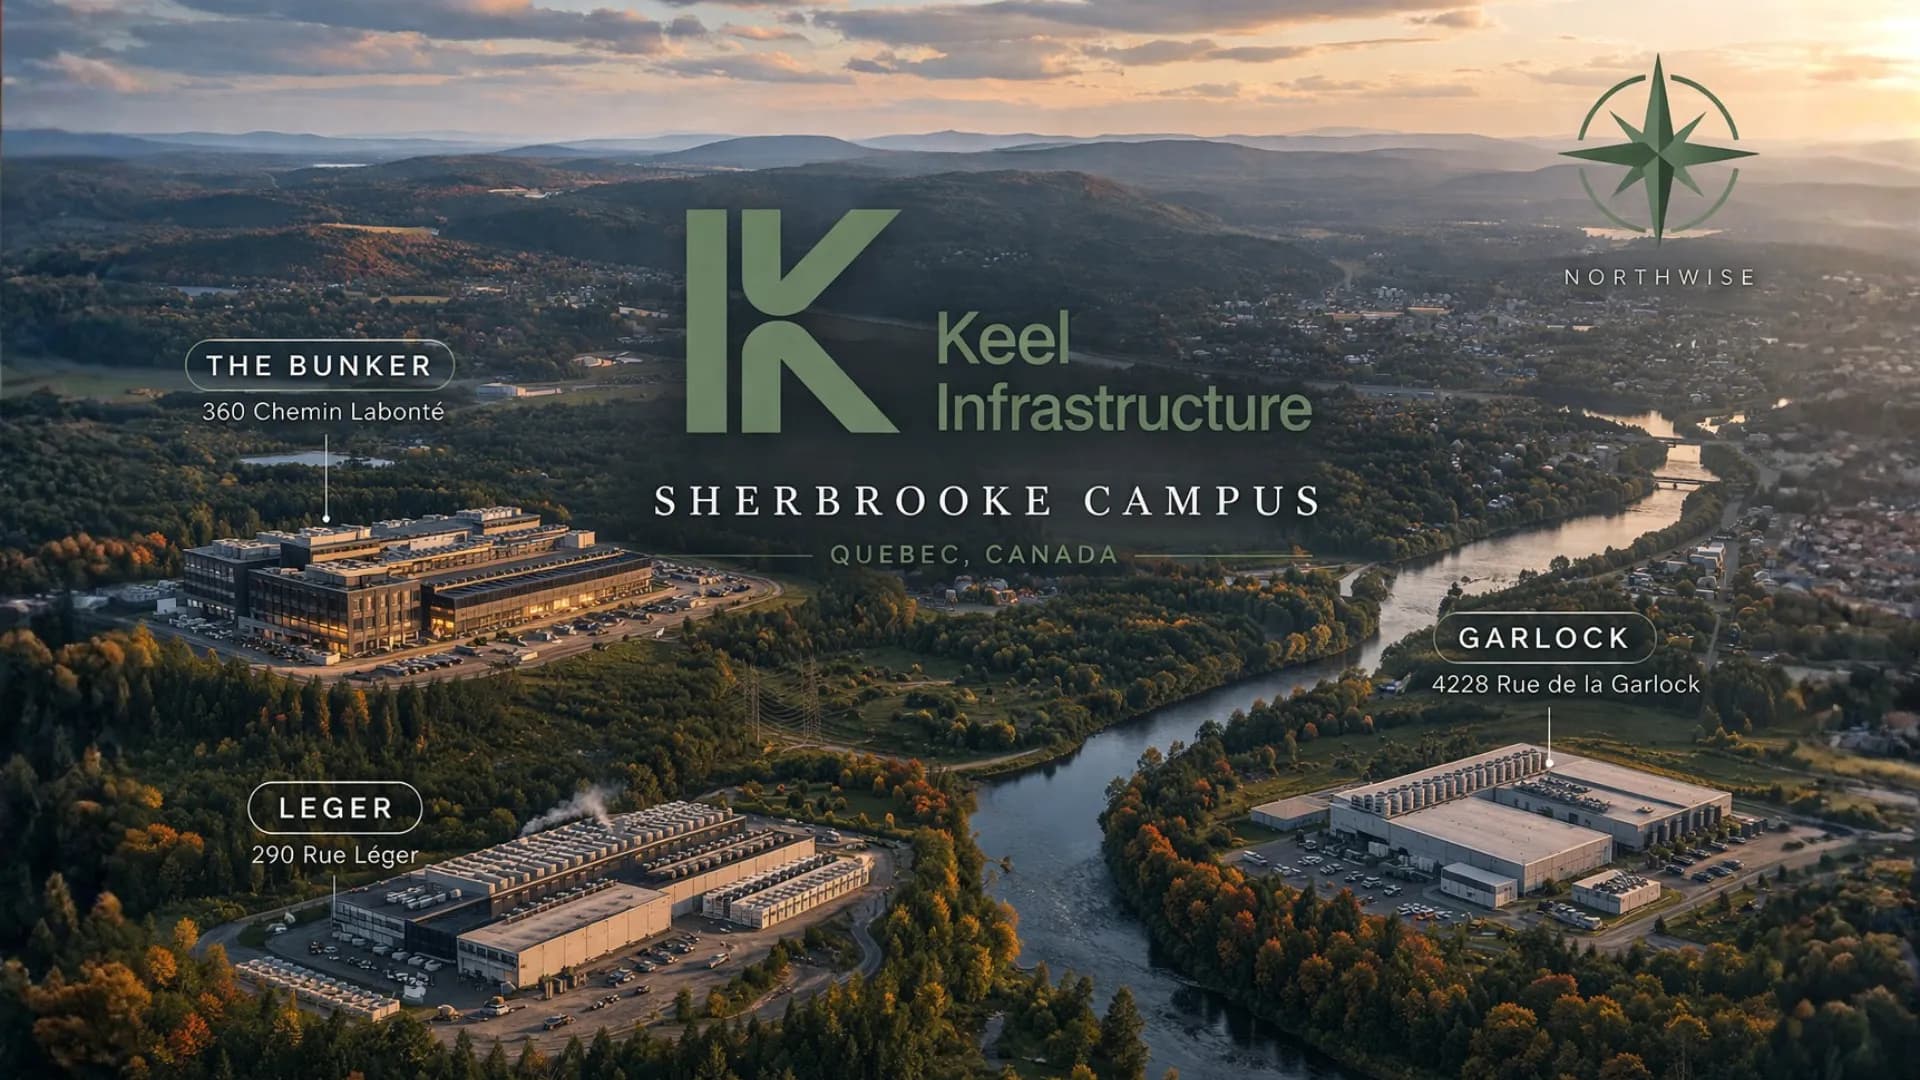
KEEL Sherbrooke Data Center
KEEL Sherbrooke data center campus analysis covering Leger, The Bunker, and Garlock, including power, site design, and HPC potential.
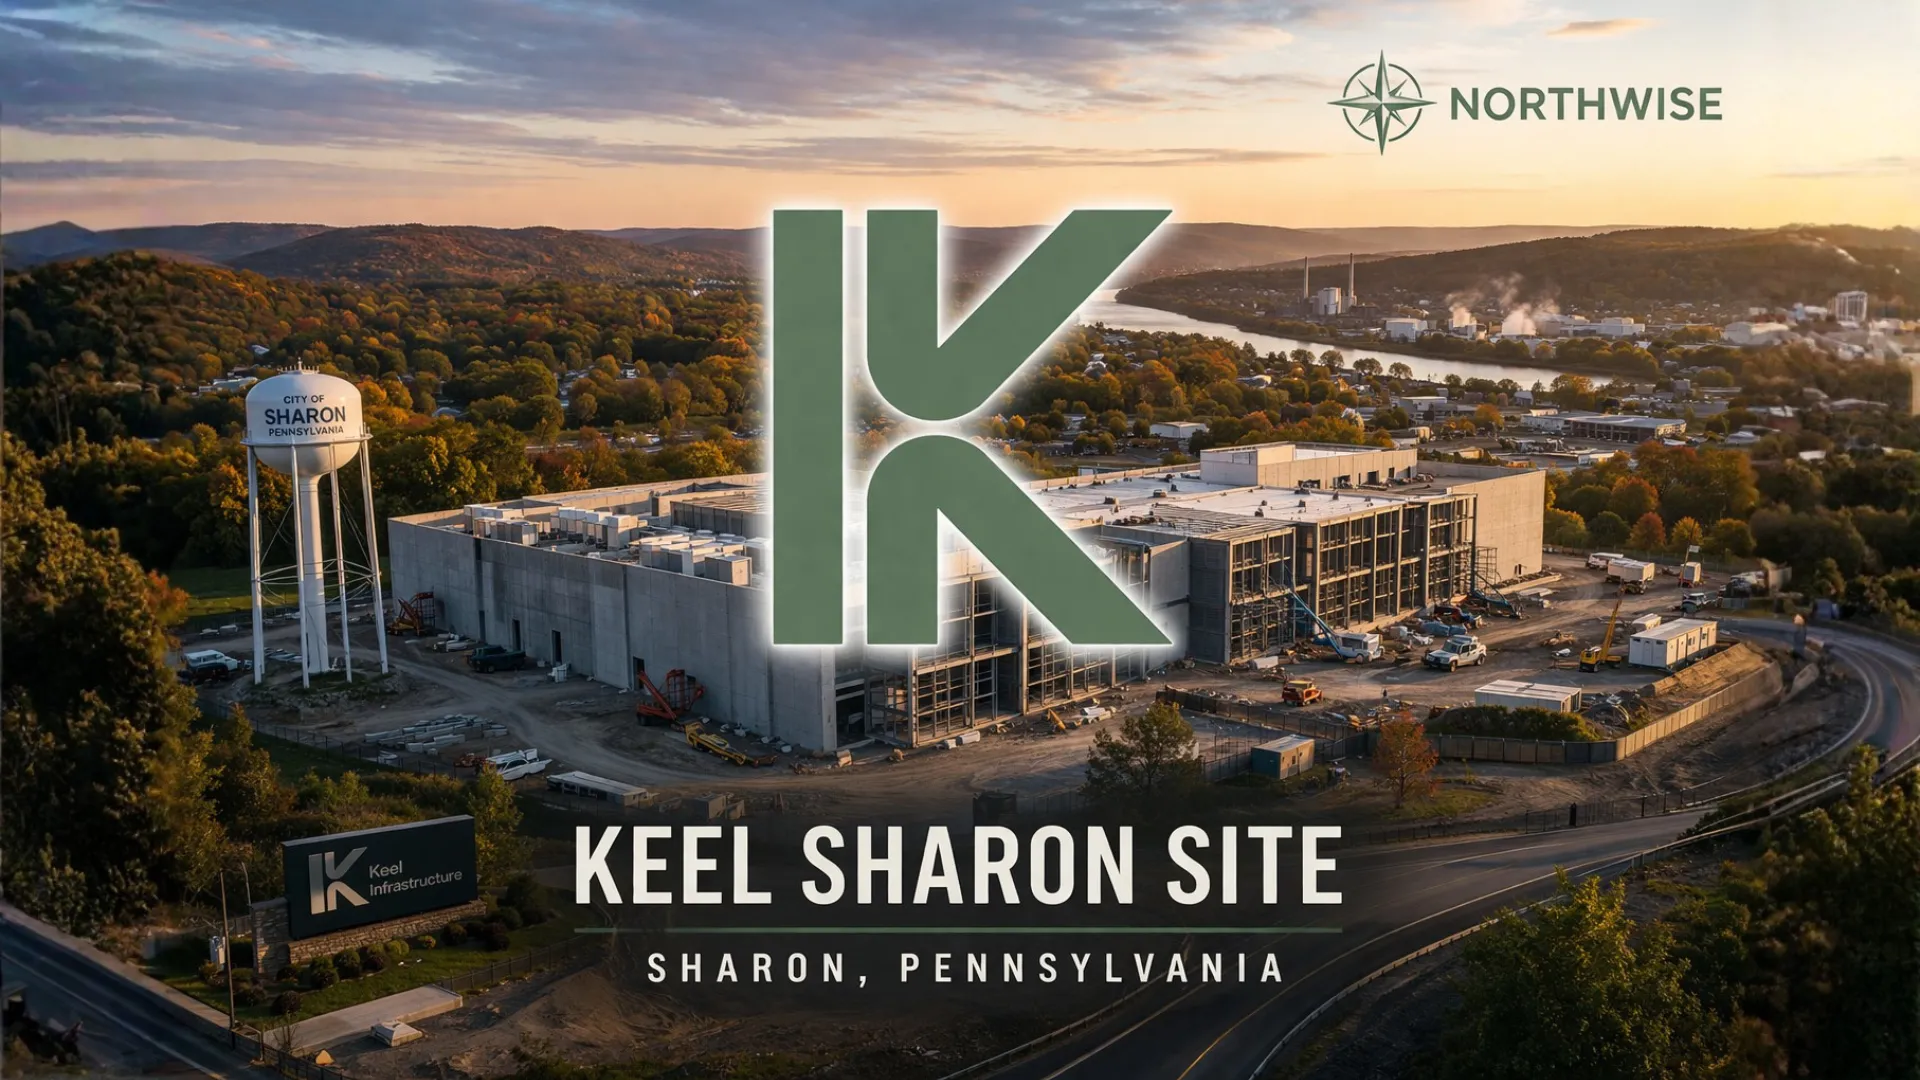
KEEL Sharon PA Data Center
KEEL stock Sharon PA data center analysis on Keel’s 110 MW site, Vera Rubin design, PJM power position, and AI infrastructure strategy.
Northwise Portfolios
See how the research becomes real decisions
Reader discussion
Discuss the research
Premium access is required to join this report's discussion.
Join Northwise Premium
No comments yet. Start a thoughtful discussion.