
IREN Stock Forecast 2027: The Year the Megawatts Come Due

IREN stock forecast 2027: examine AI capacity, contract pricing, capex and dilution, with Premium valuation scenarios and an editable financial model.
In this article
Our IREN stock forecast for 2027 follows capacity from construction to customer acceptance, then traces contract pricing, cash requirements and dilution to the value left for shareholders.
Two Prices for the Same Company
In the spring of 2026, IREN sold new shares through its at-the-market program at an average of about $52.84. After September the same program was clearing near $36.26. On November 6 the stock closed at $21.64, after trading as low as $17.16 intraday in recent sessions.
Over the same stretch, the business went the other way. Newly signed three-year contracts priced 11% richer per megawatt than the prior quarter's cohort, and five-year contracts 12% richer. One five-year deal landed near $22M per IT megawatt per year with the customer prepaying 90% of the GPU cost. A short contract cleared near $40M, and an H100 cluster that is two hardware generations old renewed at double its previous price.
Higher contract prices and a lower share price point to the same question: how much of the improving business will reach each share? Demand has strengthened, while the capital needed to serve it remains substantial.
The path is long. A megawatt at IREN has to be built, fitted with GPUs, tested, accepted by a customer and only then billed. Much of the spending comes before the associated customer revenue, funded by customers, lenders and new shareholders. Those sources bring service obligations, interest costs or dilution.
We built calendar 2027 one capacity block at a time to see how that journey plays out. The operating half of the story turned out to be the easier half. The question that decides the stock lives in the second half: whether the money arrives in the right order, at a price that leaves today's shareholders with a meaningful share of what gets built.
From Bitcoin Miner to Contracted AI Cloud
IREN started life as a bitcoin miner with an unusual asset base: large blocks of cheap, grid-connected power in West Texas and British Columbia. Mining was the first use for that power. AI computing turned out to be a far better one.
The conversion is well advanced. In the fiscal first quarter that ended September 30, 2026, IREN reported $228M of revenue, of which total AI cloud revenue contributed $200M and mining $28M. The company had 93 IT MW of AI capacity running and about $1B of annualized AI cloud revenue.
The operating run rate is supported by a much larger multiyear contract book. IREN reports $20.3B of backlog: $9.6B from Microsoft, $3.4B from NVIDIA and $7.2B from other customers, with the category figures rounded. The Microsoft agreement covers 200 IT MW of GB300 capacity at the Childress, Texas campus over about 5 years, and the first 50 MW block, Horizon 1, was delivered and accepted in August.
Underneath the backlog sits the power. IREN reports more than 5 GW of secured gross capacity, with Childress and the two Sweetwater campuses in Texas carrying most of the near-term build and Prince George, Mackenzie and Canal Flats in British Columbia supplying smaller, older blocks. The secured portfolio includes projects at different stages. Existing grid connections and the ability to deliver powered facilities help explain IREN's appeal to customers, but secured power is not the same as energized, equipped capacity.
Our forecast covers the AI cloud business. Residual mining is excluded, and so is any standalone software revenue from Mirantis, which management expects to be immaterial this fiscal year.
This forecast focuses on calendar 2027. Our earlier IREN dilution analysis through 2030 covers the longer buildout, while the IREN infrastructure guide explains the site portfolio.
The Argument Around the Stock
The optimists begin with scarcity. Power that can be energized in 2027 is one of the tightest inputs in the entire AI buildout, and IREN owns a lot of it. Contract prices are climbing, customers are funding a growing share of the hardware, and investment-grade offtake has let IREN borrow against GPUs at about 6%. On this view each quarter of delivery turns a stranded-looking power asset into a long-dated revenue stream on better terms than the last one.
The skeptics begin with the calendar and the balance sheet. The initial program slipped from a December 2026 target into January 2027, possibly February. Texas paused relevant environmental permits and new large-load energization approvals in September. Management's own plan shows about $6B of fiscal 2027 funding that is targeted and not yet secured, and the company has been selling equity into a falling share price.
Last quarter's net loss was $263M. A former miner, the argument goes, is borrowing heavily to rent out hardware that will need replacing within a handful of years, and shareholders are paying for the privilege in dilution.
Both camps are describing things that are true. They split on sequence. The optimists expect delivered contracts to generate the cash that settles the funding question. The skeptics expect the funding question to decide how many contracts get delivered.
We land closer to the optimists on the business and closer to the skeptics on the per-share arithmetic. The contracts, the customers and the pricing evidence are considerably stronger than a $21.64 stock suggests. The capital bill is also larger than a casual reading of the backlog implies, and a meaningful share of it will be settled in new shares at prices near today's.
What the September Quarter Settled, and What It Left Open
Four developments from the fiscal first quarter shape the 2027 forecast. They are easier to absorb one at a time.
The first is timing. The initial program, which management describes as roughly 0.3 GW of IT capacity carrying more than $4B of annualized revenue, had been aimed at the end of calendar 2026. It is now aimed at January 31, 2027, with a possible extension to the end of February.
Much of the movement traces to a network redesign that Microsoft requested, and IREN says those changes carry no delay credits. Horizon 1 keeps earning throughout. Only the unfinished blocks move.
The second is price. The 11% and 12% cohort increases, the $22M five-year deal, the $40M short-duration deal and the doubled H100 renewal all landed in the same reporting window. Management also quoted three-year pricing of $19M to $23M per IT MW for the quarter's cohort and five-year pricing near $17M. Those anchors differ in hardware, customer and service scope, so they tell us the direction of travel more precisely than the level.
The third is scope. IREN now targets about 0.8 GW of IT capacity by the end of calendar 2027: the initial 0.3 GW, another 0.3 GW for which GPUs are already ordered, and 0.2 GW still to order. On September 28 it placed $6.7B of Dell orders, with deliveries from the second half of calendar 2027 and payment due within 30 days of shipment.
The fourth is money. IREN ended September with $3.52B of unrestricted cash, $2.26B of restricted cash and about $10.04B of debt principal. Its first-quarter results show about $15B of capex still to spend before the fiscal year ends in June 2027, with about $9B framed as covered by cash, committed facilities and contracted prepayments and about $6B still to be raised.
The schedule moved later and prices moved higher in the same quarter, and the two fit together comfortably. A delayed fixed-price contract keeps its price and simply starts earning later. Higher pricing applies to capacity that has not yet been sold, which, as we will see, is most of what IREN builds in 2027.
A Megawatt's Long Walk to an Invoice
Most confusion about IREN's 2027 comes from treating several different megawatts as one. The forecast depends on keeping them apart.
Gross MW is what a site can draw from the grid. IT MW is the portion that reaches the computing equipment after cooling and electrical losses, and it is the denominator we use to compare contract economics. Customer agreements may instead specify GPU hours, dedicated clusters or other service terms. At the power usage effectiveness of 1.25 we assume for new liquid-cooled halls, 50 gross MW supports 40 IT MW.
From there a block passes through a series of gates. The data hall is built, then GPUs are delivered and installed, then the cluster is qualified and tested. The customer accepts it, often in stages, and only accepted capacity bills.
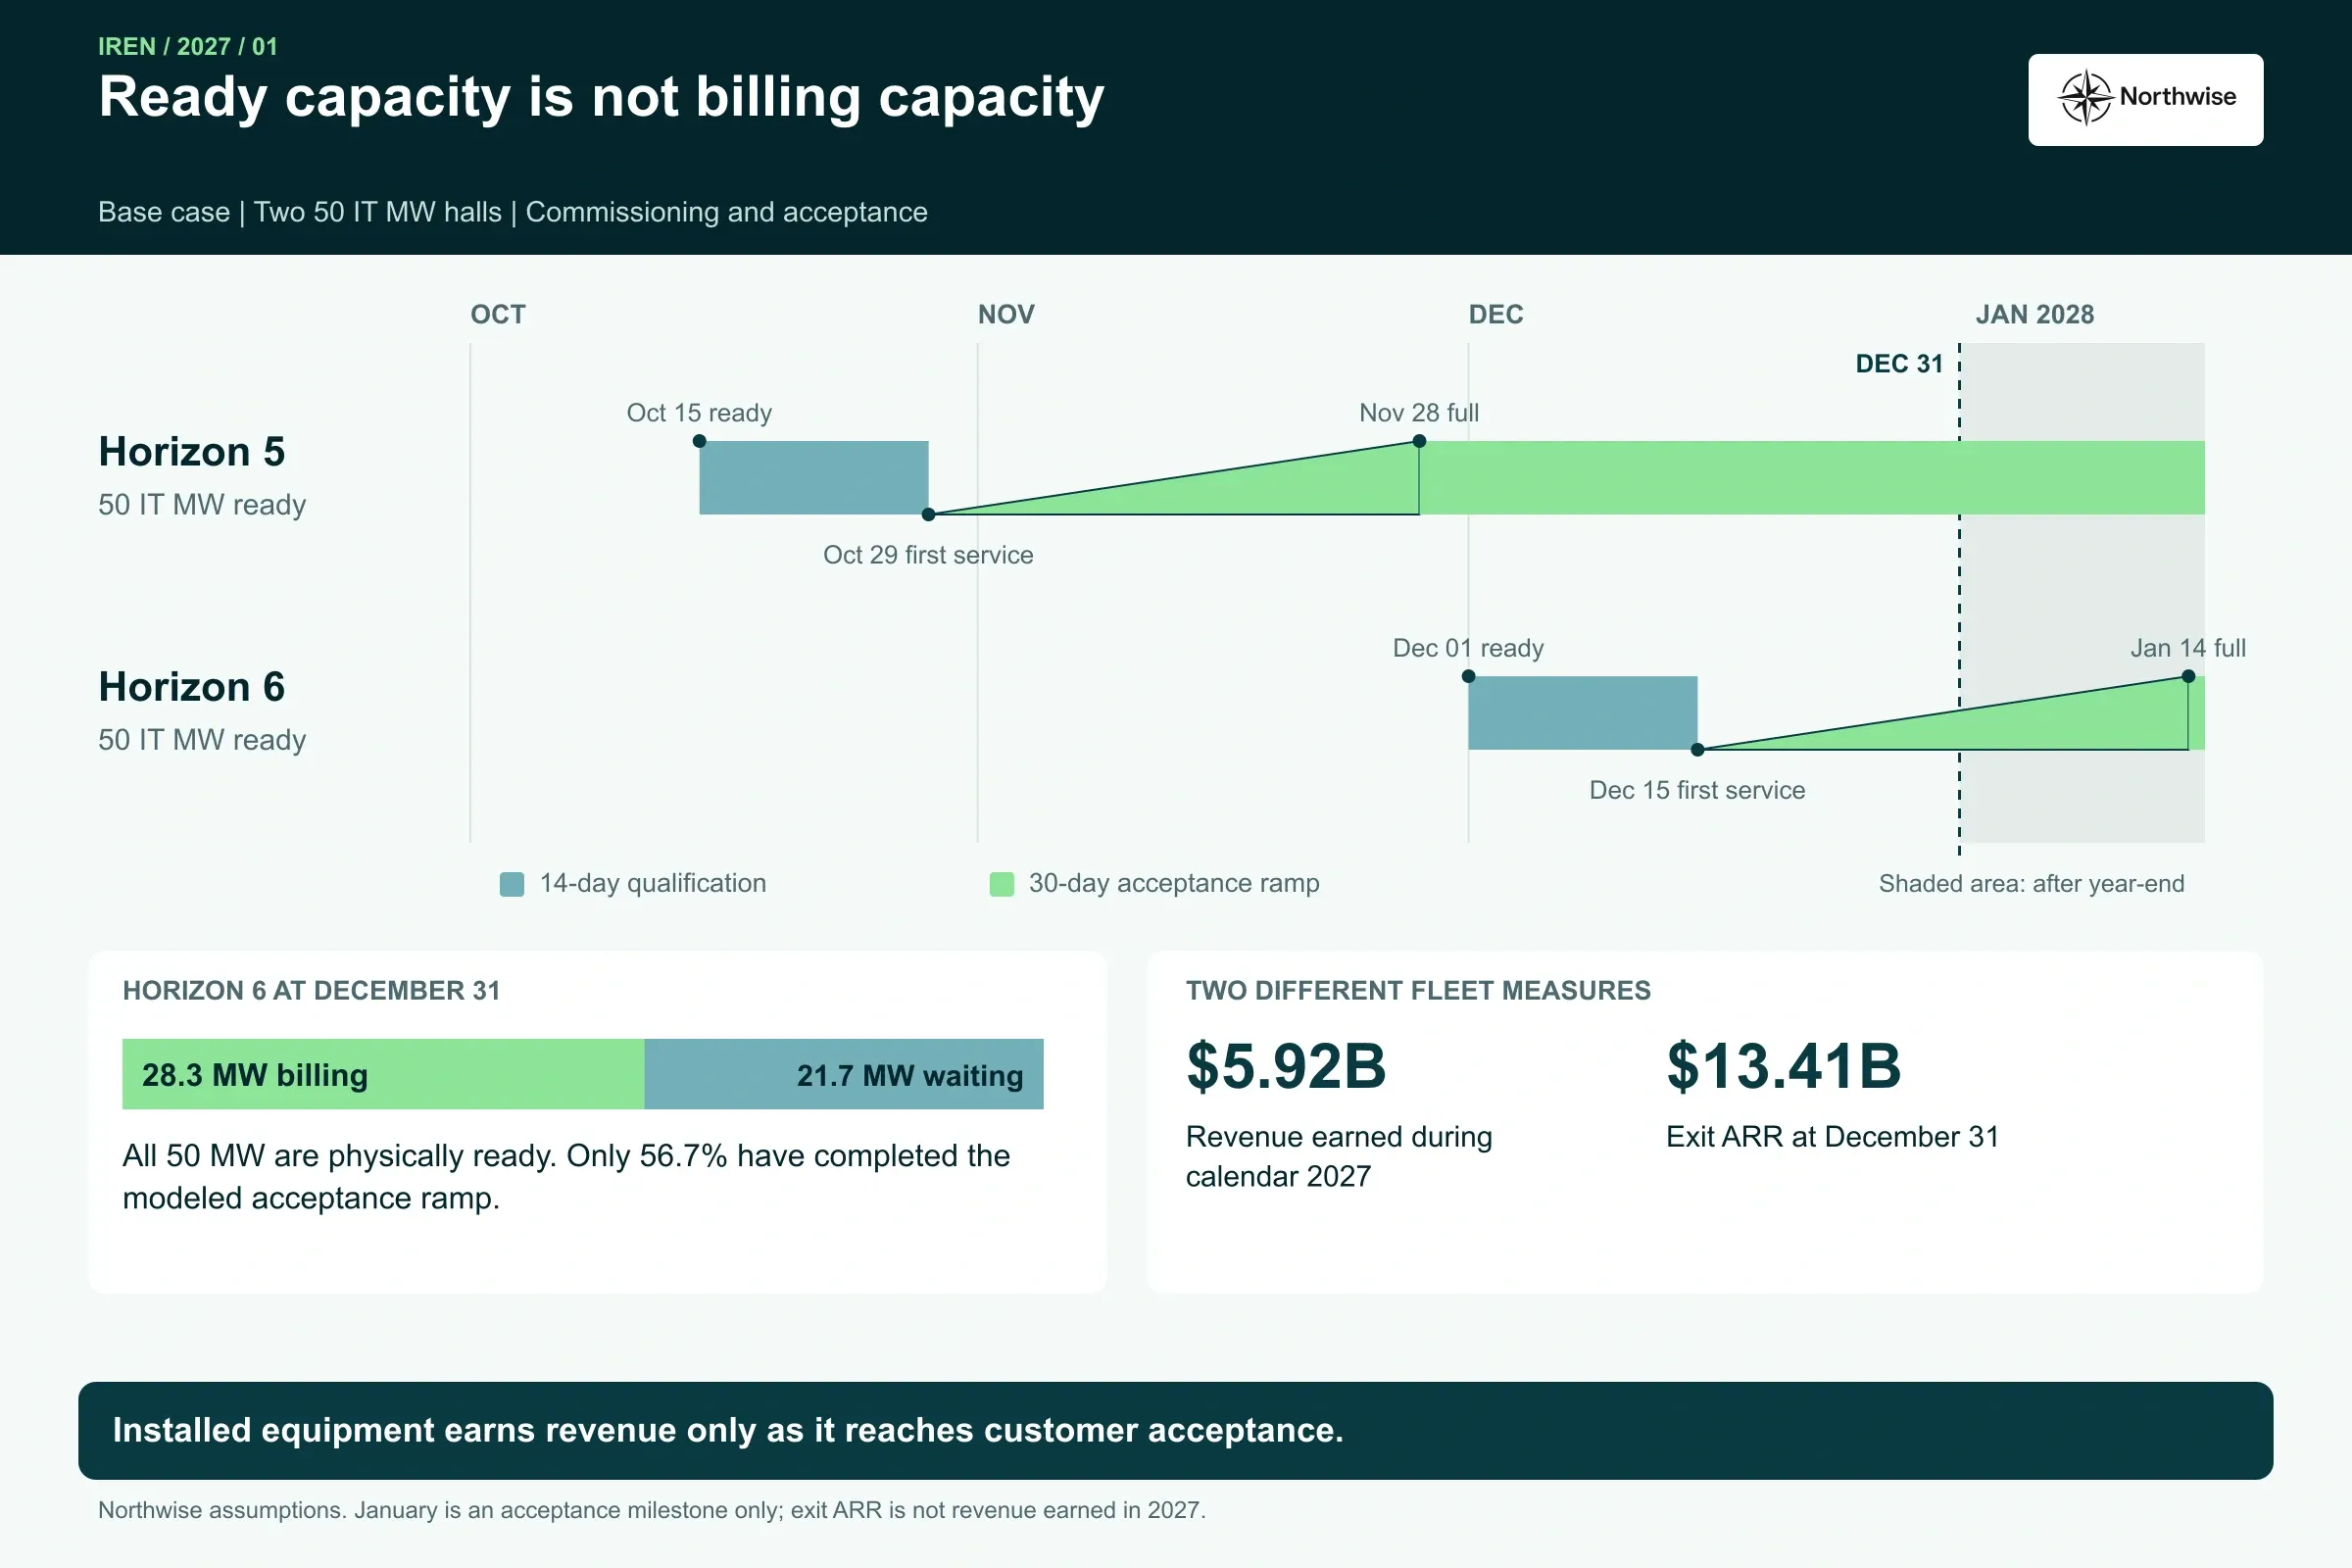
We model each gate separately. For the new liquid-cooled halls, a benchmark construction date moves by case, GPU readiness waits for both the building and the hardware, and a qualification period of 14 days in our Base case is followed by a 30-day ramp in which acceptance climbs linearly. A 50 IT MW hall that is ready on December 1 therefore exits the year with only part of its capacity billing.
Revenue follows accepted capacity day by day: IT MW times the contract's annual revenue per IT MW, integrated over the days actually in service. Exit annualized revenue is a separate number, a snapshot of December 31 billing scaled to a year. For a company adding capacity as fast as IREN, the gap between the two is enormous, and much of the noise around IREN's 2027 comes from quoting one as if it were the other.
The disclosures mix denominators too. Management's 0.3 GW and 0.5 GW figures are rounded IT capacity. Site maps and NVIDIA's 60 MW contract use gross power. Converting everything to IT MW takes judgment, and we flag where ours begins.
The Contracted Foundation
The initial program has four parts. Microsoft's Horizon 1 through 4 at Childress total 200 IT MW in four 50 MW blocks. The rest is made up of the existing Prince George halls, the air-cooled halls at Mackenzie and an initial air-cooled block at Childress.
Only the Microsoft quantities are disclosed in IT terms. For the other three blocks we use 35, 60 and 37.5 IT MW, conversions of the company's gross figures that keep the program close to management's 0.3 GW description. Our 332.5 IT MW total is an analytical allocation and should be read next to the company's rounded figure, never as a newly disclosed number. The 93 IT MW operating in September already sits inside it.
Pricing follows the same discipline. Microsoft's contract totals $9.66B with a 20% prepayment, about $1.94B a year or $485M per 50 MW block.
Prince George carries about $0.5B of contracted run rate. Mackenzie and the initial Childress air block together carry about $1.56B. The four parts add to $4.0B, which we treat as a floor under management's "more than $4B".
Initial program block | IT MW | First billing day, Base case | Annual revenue | Revenue per IT MW |
|---|---|---|---|---|
Microsoft Horizon 1 | 50 | In service since August 2026 | $485M | $9.7M |
Microsoft Horizon 2 | 50 | January 15, 2027 | $485M | $9.7M |
Microsoft Horizon 3 | 50 | January 31, 2027 | $485M | $9.7M |
Microsoft Horizon 4 | 50 | February 28, 2027 | $485M | $9.7M |
Prince George | 35 | In service | $500M | $14.3M |
Mackenzie air | 60 | February 15, 2027 | $1,050M | $17.5M |
Childress initial air | 37.5 | February 28, 2027 | $510M | $13.6M |
Total | 332.5 | $4,000M | $12.0M |
The staging follows the physical evidence. At the November update Horizon 2 had rack power, installed GPUs and fiber, with commissioning under way. Horizon 3 had GPUs on site and three halls energized. Horizon 4's hardware arrived later.
The dates are our reading of how a January 31 aggregate target with an end-of-February fallback tends to unfold in practice.
Slippage here has a simple price. The unfinished blocks carry about $3.0B of annual revenue between them, so each month of delay across all of them takes roughly $250M out of calendar 2027. Contracts run for fixed terms from acceptance, so the revenue moves later in time and the calendar year absorbs the loss.
Microsoft's $9.7M per IT MW is the lowest rate in the table. It is also the most bankable revenue IREN has.
The customer is investment grade, prepaid 20% of contract value and accepted Horizon 1 on schedule, and GPU financing against that kind of offtake has cost about 6.0%. Against non-investment-grade offtake, IREN's recent financing cost 9.0% to 9.5%. The cheapest revenue in the portfolio arrives with the cheapest money, a trade-off that runs through everything that follows.
Who Already Owns the Next Megawatts
Before any new contract can capture the reference prices, existing commitments take their share of the second wave.
NVIDIA's $3.4B, five-year managed cloud agreement comes first. Its 60 MW is gross power inside the later Childress air program, and we convert it to 45 IT MW delivered in three 15 MW tranches in March, June and September 2027. At $680M a year, that works out to about $15.1M per IT MW. The conversion is ours, and a different power envelope would change both quantity and yield.
A second commitment is quieter. Management has referred to capacity for an existing frontier-lab customer without disclosing its size. We reserve 50 IT MW of the Childress air expansion for it from May 2027 at $21M per IT MW, a level between the older program and the newest five-year deal.
Add those to the initial program and IREN's reserved book settles at 427.5 IT MW by September 2027, earning about $5.73B a year, or $13.4M per IT MW. Capacity beyond those reservations is allocated to future contracts at the prices assumed in each scenario.
A larger or lower-priced frontier-lab commitment would reduce the capacity or revenue yield available for new deals. A smaller reservation would leave more capacity open. The undisclosed quantity therefore matters in both directions.
The Second Wave
The capacity added after the initial program is where 2027 growth comes from, and where most of the capital goes.
Second-wave block, Base case | IT MW | GPU status | Billing begins | Contract basis |
|---|---|---|---|---|
NVIDIA tranches 1 to 3 | 45 | Ordered | March, June, September | Signed, $15.1M per IT MW |
Childress air, existing-customer reserve | 50 | Ordered | May | Committed, terms undisclosed |
Childress air, new sales | 92.5 | Ordered | June to November | New contracts |
Horizon 5 | 50 | Ordered | Late October | New contracts |
Sweetwater 1, block A | 50 | Ordered | Late October | New contracts |
Sweetwater 1, block B | 50 | Partly ordered | Late November | New contracts |
Horizon 6 | 50 | To order | Mid-December | New contracts |
Sweetwater 1, blocks C and D | 100 | To order | Late December | New contracts |
Canal Flats | 20 | To order | Late November | New contracts |
Construction progress differs by site, and the dates reflect it. At Horizon 5 and 6 both substations are complete and foundations and structures are in progress. At Sweetwater 1, substations for all four halls are complete, halls 1 and 2 have finished foundations with structures and cooling under way, and halls 3 and 4 are earlier. The evidence does not support treating Sweetwater as uniformly behind Childress, so we give both a shared benchmark and let later blocks follow the observed sequencing.
Ordering status varies as well. Management says GPUs are ordered for about 0.3 GW of the 0.5 GW expansion and has not said which sites the remaining 0.2 GW serves. We map the ordered capacity to the Childress air halls, Horizon 5, Sweetwater block A and part of block B.
The mapping is our proxy and not a disclosed purchase-order schedule. It still matters a great deal, since an ordered GPU must be paid for and an unplaced one can wait.
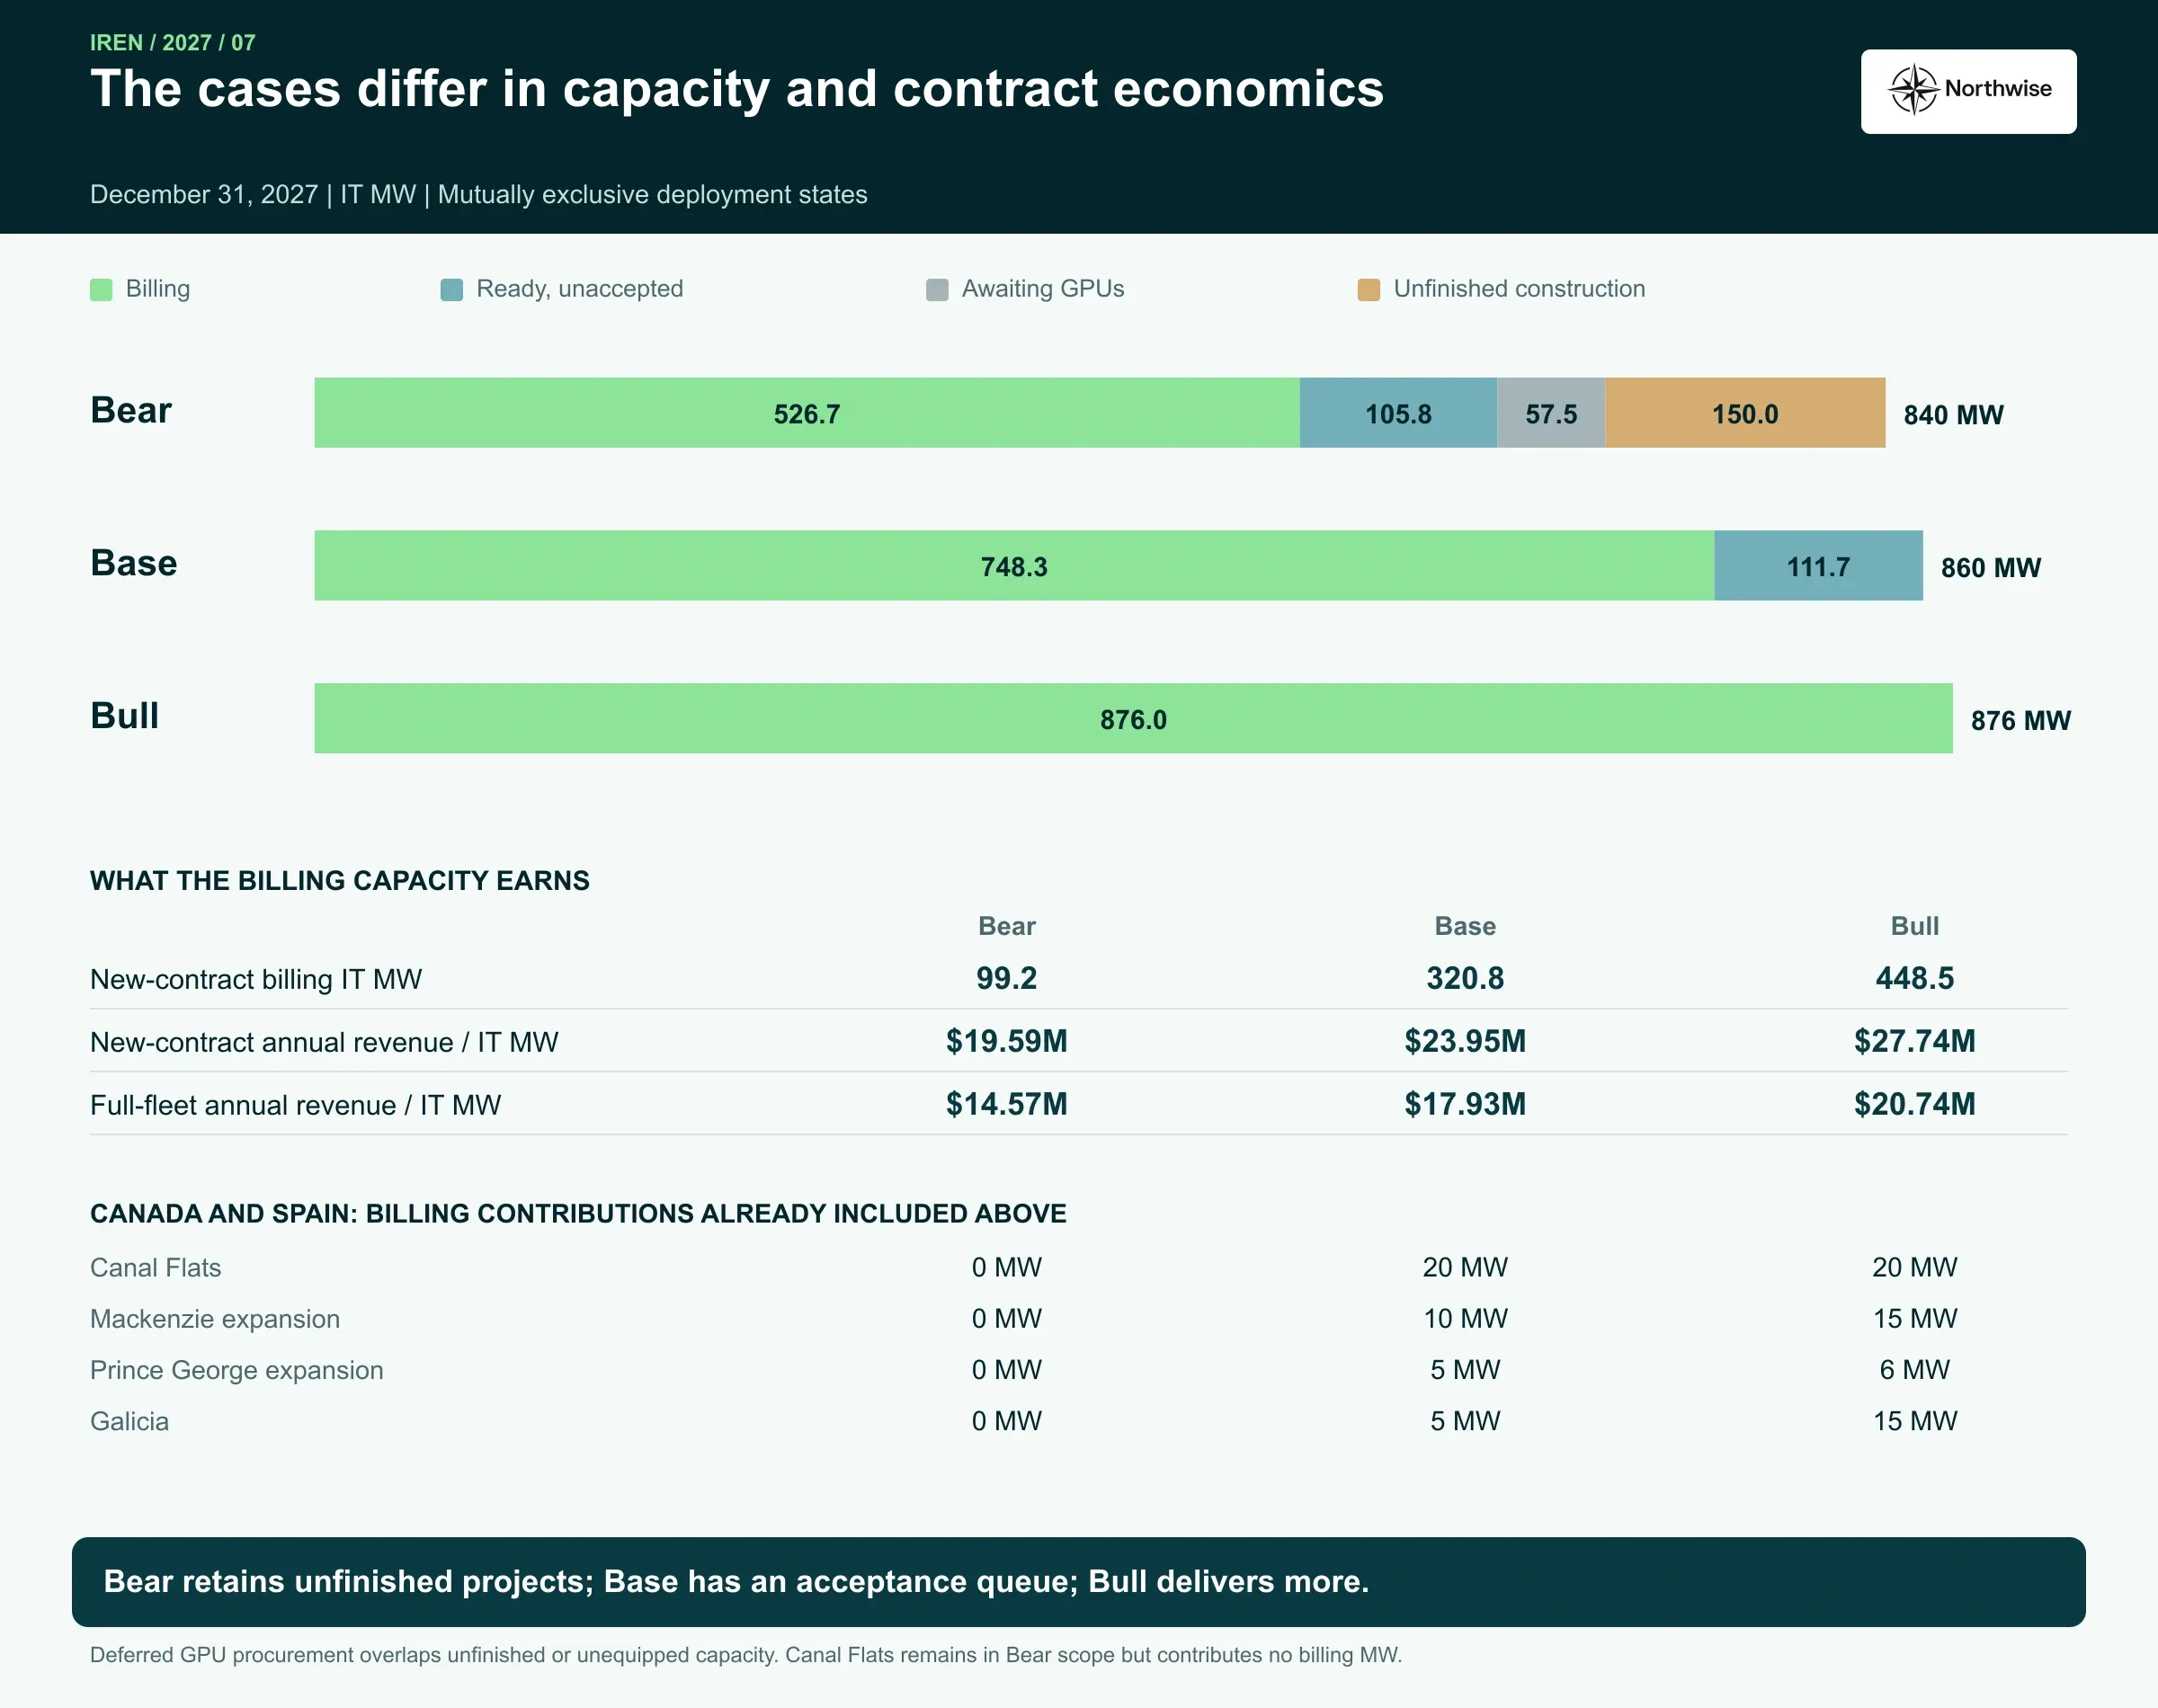
The Base case finishes the physical program inside the year. By December 31 all 860 IT MW in its scope are built and fitted with GPUs, and 748 IT MW are billing. The other 112 IT MW sit in the final stretch of customer acceptance: most of Sweetwater blocks C and D, which only begin billing on December 29, and part of Horizon 6.
Management's 0.8 GW target describes construction scope by year end. Our billing schedule describes when customers start paying for it. Both can be right at the same time, and in the Base case they very nearly are.
Canada: Converting Power IREN Already Owns
British Columbia is where IREN started, and its three Canadian sites offer something unusual in 2027: power that is already connected, with room left over. The company's fiscal 2026 materials identify liquid-cooled development opportunities across all three, and its November presentation shows Canal Flats, a fourth Prince George data hall and Mackenzie halls 5 and 6 at different stages.
We credit only what the power envelopes can carry. Prince George has 50 gross MW, already supporting 35 IT MW, which leaves room for about 5 more at our assumed efficiency. Mackenzie has a 100 MW envelope carrying 60 IT MW of air-cooled capacity, so a 10 IT MW liquid addition still leaves headroom. Canal Flats, with 30 gross MW, supports 20 IT MW.
Canadian and Spanish additions, IT MW | Bear | Base | Bull |
|---|---|---|---|
Canal Flats | Deferred | 20 | 20 |
Mackenzie liquid expansion | 0 | 10 | 15 |
Prince George expansion | 0 | 5 | 6 |
Galicia, Spain | 0 | 5 | 15 |
Canal Flats needs one clarification. We already include its 20 IT MW in our allocation of the core program against management's rounded 0.8 GW target. Its billing contribution is therefore included in our totals, rather than added again as incremental Canadian capacity. The site allocation remains our estimate.
Timing runs through the same gates as the Texas halls. Prince George reaches benchmark construction readiness on September 1, Canal Flats and Mackenzie on November 15, and each case shifts those dates by 45 days later, zero, or 30 days earlier before qualification and the acceptance ramp begin. The quantities and dates are our underwriting estimates against disclosed site stages. None is a deployment figure the company has published.
Galicia: A Small Bet on the Map
IREN's international pipeline includes Nostrum's development in Galicia, Spain. A March 2026 Nostrum announcement describes a 25 MWe project targeting availability in 2027.
We give it a small part to play. The Base case credits 5 IT MW and the Bull case 15 IT MW from a November 1 benchmark, both completing their partial deployments before year end. The Bear case credits nothing.
The evidence grade here is lower than anywhere else in the forecast. The announcement supports the existence and timing of the site. It establishes no IREN GPU cloud deployment, no signed compute customer and no procurement plan, so we price the capacity conservatively: 90% to 95% of the North American contract curve, 115% of North American direct costs, and full incremental capex of $40M of GPUs and $20M of data center per IT MW. Badajoz and Bundey receive no 2027 credit, as the company's own timing places them later.
At 5 IT MW, Galicia contributes about $0.1B to the Base exit run rate. Its value in the forecast is mostly as a marker. If IREN can stand up compute in Europe on Nostrum's timeline, the case for subsequent international compute deployments becomes stronger.
Why Each Megawatt Earns More Than the Last
IREN's recent disclosures show higher average pricing for newly signed three- and five-year contract cohorts.
The cleanest evidence is IREN's own. Newly signed three-year cohorts rose 11% quarter on quarter in annual revenue per IT MW, and five-year cohorts rose 12%. These compare reported cohort averages within the same contract durations. They provide stronger evidence of the direction of pricing than a single transaction, although hardware and service mix can still differ.
The individual deals sharpen the picture without matching it exactly. The five-year contract near $22M per IT MW came with the customer prepaying 90% of the associated GPU capex. The three-to-six-month contract cleared near $40M.
The H100 renewal doubled for a multiyear term on hardware most depreciation schedules would call middle-aged. Different customers, generations and service scopes sit behind each one, so none of them can simply be applied to the next contract.
Three conclusions survive the caveats. Prices on newly signed capacity are rising across durations. The H100 renewal shows that older hardware can retain substantial earning power; it does not establish its residual asset value. And customers are willing to fund a large share of the equipment to secure capacity, which tends to be the most reliable sign of a tight market.
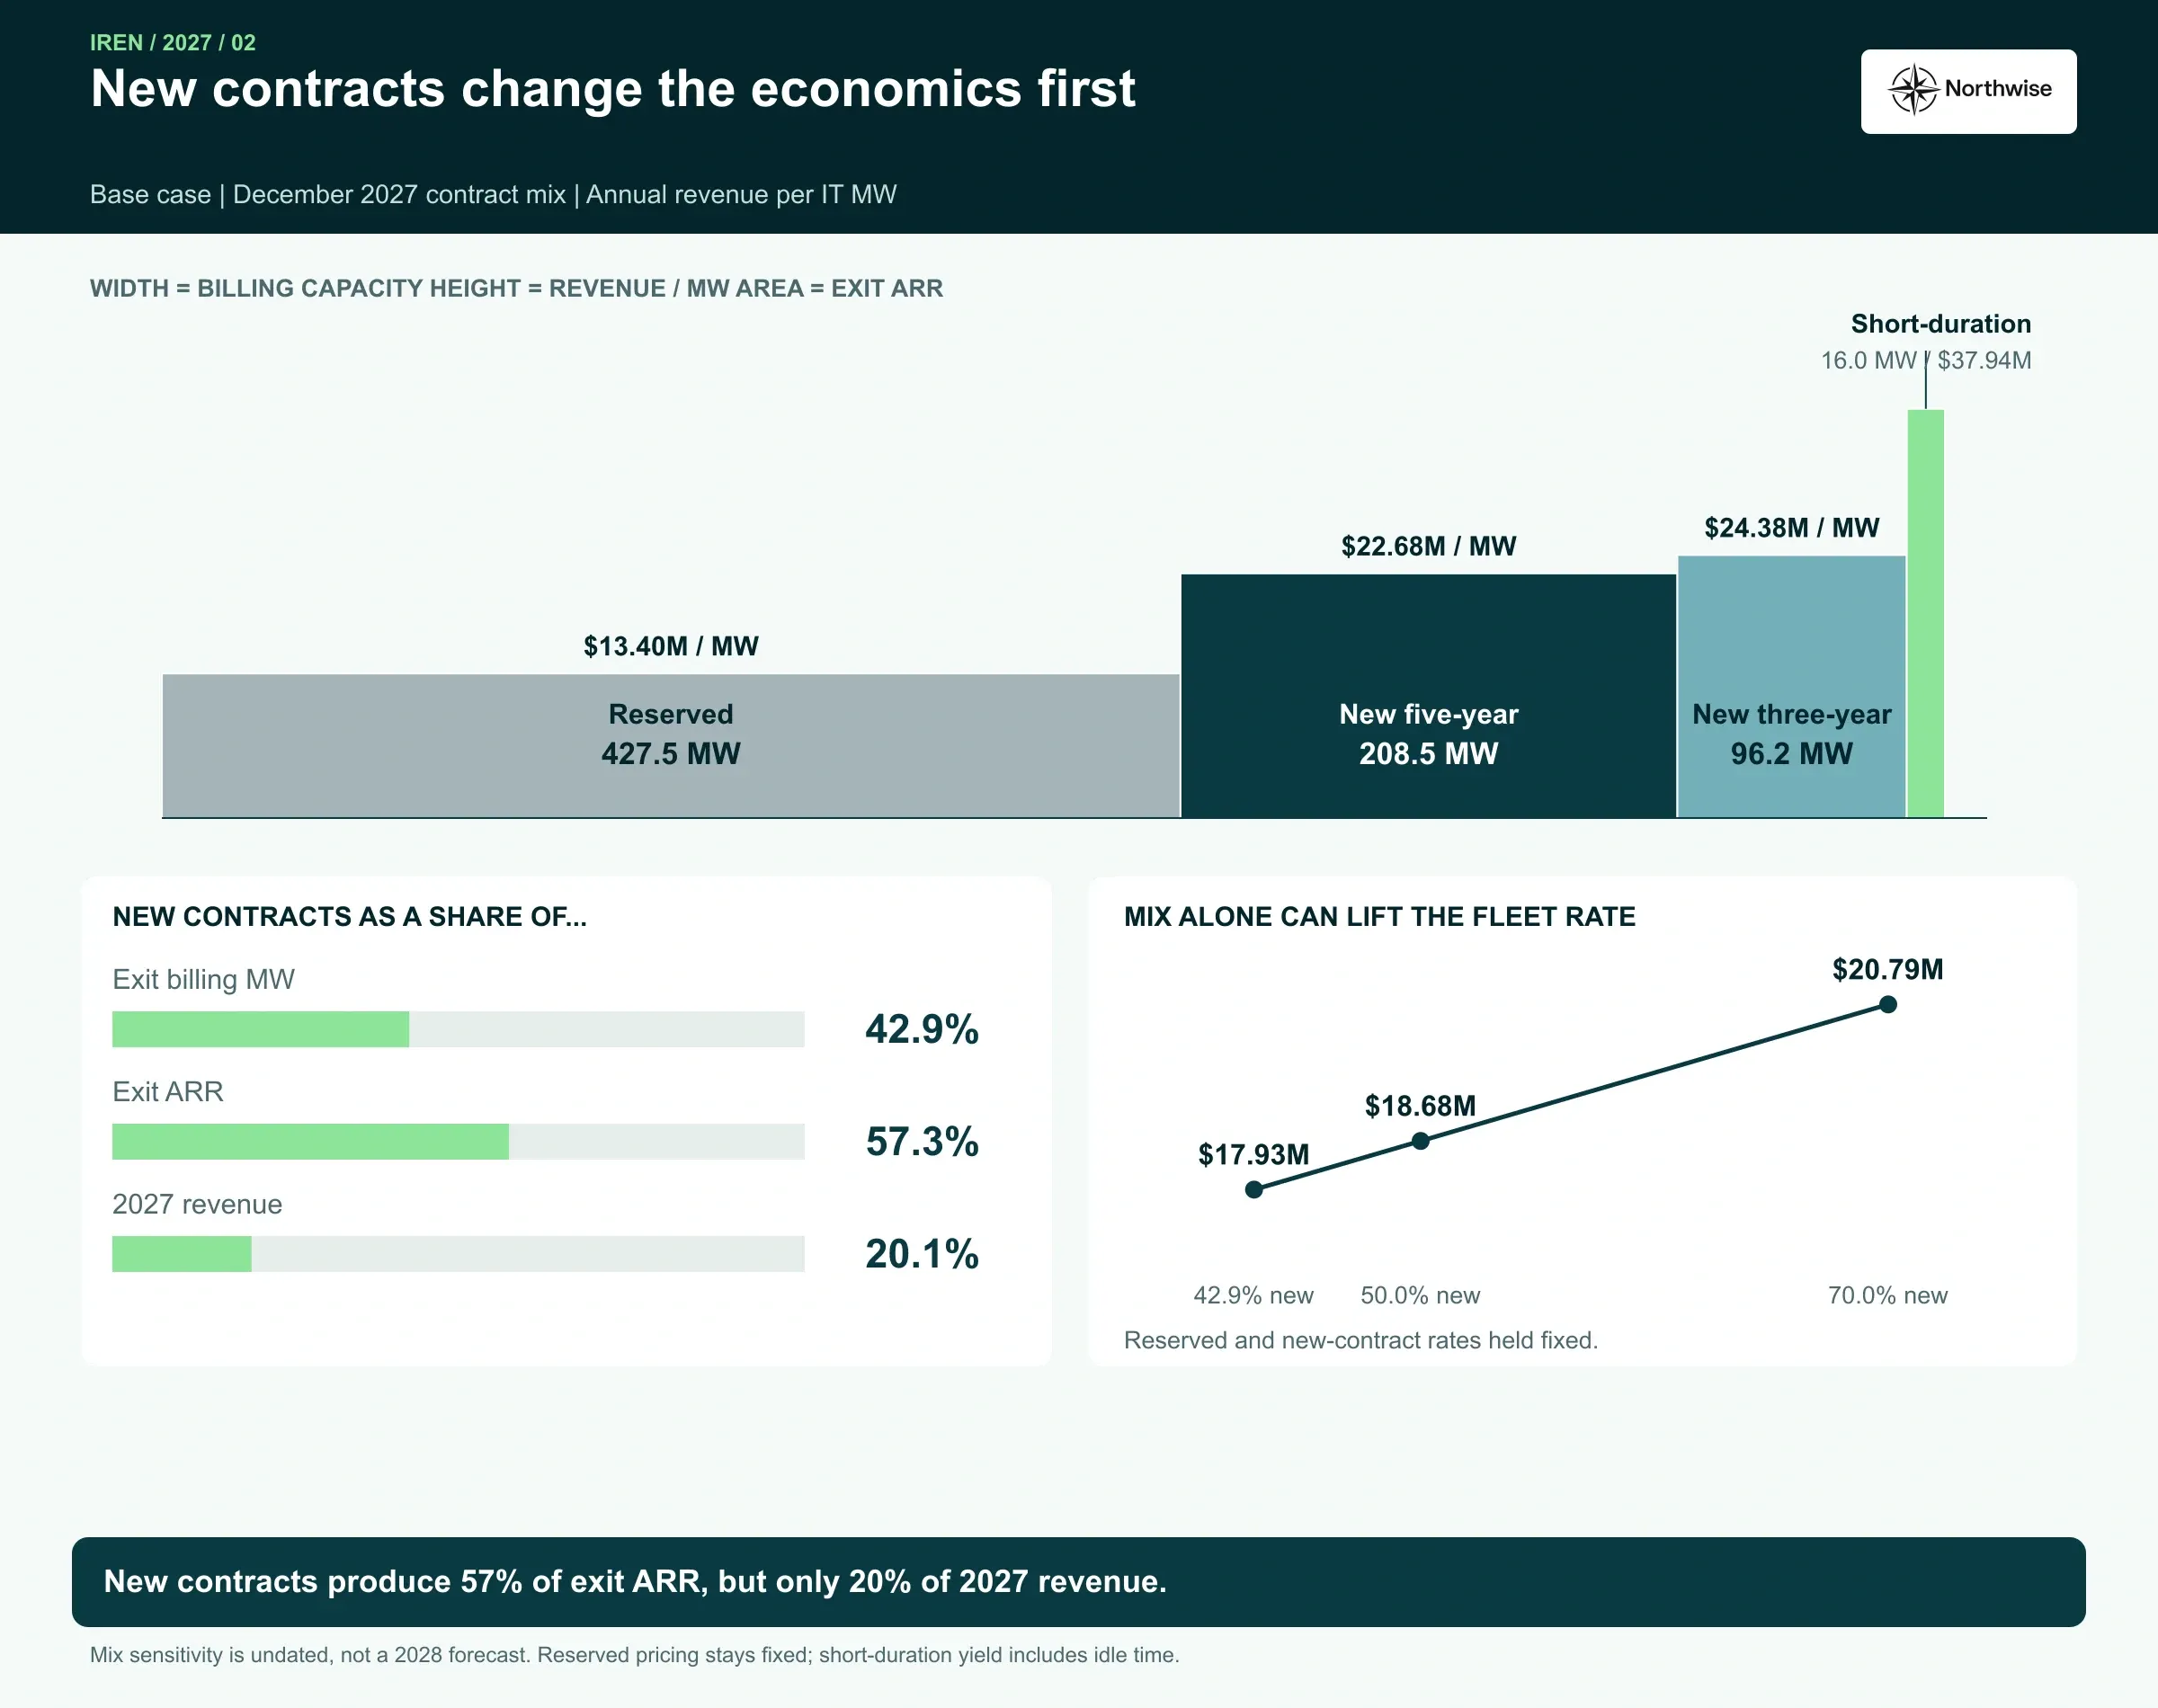
Rising new prices leave the installed book where it is. Microsoft's $9.7M, NVIDIA's terms and the initial program's pricing stay fixed until each contract comes up for renewal. The fleet's average rate climbs through mix, as newer and richer cohorts pile on top of an older base.
Contract vintage | Revenue per IT MW per year |
|---|---|
Microsoft Horizon 1 to 4 | $9.7M |
Initial program, other blocks | $13.6M to $17.5M |
NVIDIA managed cloud | $15.1M |
Existing-customer reserve | $21.0M |
New air-cooled sales, Base case | $23.1M |
New liquid-cooled sales, Base case | $24.35M |
The Fleet Average Catches Up Slowly
The blended rate is where the market's two stories about IREN meet. Old contracts anchor it, new contracts pull it, and the speed of the pull depends entirely on how many new megawatts reach customers before December.
Base case, period end | Mar 2027 | Jun 2027 | Sep 2027 | Dec 2027 |
|---|---|---|---|---|
Reserved capacity, IT MW | 347.5 | 412.5 | 427.5 | 427.5 |
Reserved revenue per IT MW | $12.2M | $13.3M | $13.4M | $13.4M |
New-contract capacity, IT MW | 0 | 30 | 63 | 321 |
New-contract revenue per IT MW | n/a | $23.1M | $23.2M | $24.0M |
Fleet revenue per IT MW | $12.2M | $14.0M | $14.6M | $17.9M |
For three quarters the fleet rate only creeps higher. The new Childress air halls arrive 30 MW at a time and are outweighed by more than 400 MW of older contracts. Then the liquid-cooled halls land in the fourth quarter, new-contract capacity jumps fivefold, and the fleet rate leaps from $14.6M to $17.9M in a single quarter.
Calendar revenue lags that exit figure by design. Blocks accepted in November and December contribute only weeks of service to the year, so the Base case earns about $14.3M of 2027 revenue per average billing IT MW, well below its December rate.
December 2027 | Bear | Base | Bull |
|---|---|---|---|
New-contract capacity, IT MW | 99 | 321 | 449 |
New-contract revenue per IT MW | $19.6M | $24.0M | $27.7M |
New contracts as share of fleet | 19% | 43% | 51% |
Fleet revenue per IT MW, exit | $14.6M | $17.9M | $20.7M |
2027 revenue per average billing IT MW | $13.4M | $14.3M | $15.9M |
The reserved book is identical in every case, so the spread between cases comes almost entirely from how much new capacity arrives and what it earns. Bear sells 99 IT MW of new capacity by December at about $19.6M. Base sells 321 IT MW near $24.0M. Bull sells 449 IT MW near $27.7M, and in doing so tips the majority of the fleet onto new-vintage pricing.
The Base mix at year end breaks down as 209 IT MW on five-year terms at about $22.7M, 96 IT MW on three-year terms at $24.4M and 16 IT MW of short-duration capacity at $37.9M after allowing for idle time between contracts.
The Base five-year liquid price of $23M sits $1M above the disclosed $22M deal. We justify the gap with the later liquid-cooled hardware these halls will carry and the quarter-on-quarter trend. It remains an underwriting judgment, and weaker renewal pricing or softer bids on the next disclosed deals would argue for moving it back to the observed level.
What the Rest of the Market Is Paying
Our Nebius 2027 model provides an industry comparison, with different products, customer access and contract economics. IREN's own pricing is more persuasive when the wider market moves the same way, and through early November it mostly did.
Nebius publishes hourly GPU quotes by region. Comparing complete Monday-to-Thursday windows across four consecutive weeks from mid-October, median B300 quotes in its western European region rose from about $5.00 per GPU-hour to $10.53, and B200 quotes in its central US region rose from $1.89 to $5.81. Complete-week medians confirmed the direction for both.
The picture had texture. B300 quotes in the UK and northern US regions wandered without a clear trend, and some H200 markets softened in the latest week. Weekend quotes in the European B300 series ran 11% to 33% below the same week's weekday median, so a comparison ending on a Sunday can confuse weekly seasonality with a change in demand. And quotes are quotes: the revenue a provider earns on sold hours is a different number.
Disclosed contract terms offer a steadier anchor. Nebius reported newly signed deals averaging above $20M per MW in its second quarter, landmark deals at $20M to $25M per MW and customer advances covering 50% to 60% of associated capex in 70% of deals. CoreWeave reported three-to-six-month contracts near $40M per MW in September, measured against total power, and July price increases of about 25% across hardware types.
Taken together, the evidence describes a firm market for capacity delivered in late 2026 and 2027, with new term contracts clustering between $20M and $25M per MW and short-duration capacity commanding a steep premium. Industry pricing informs IREN's next contracts without setting them. IREN's product, customer access and contract mix differ from both peers, and its own signed deals carry more weight in our forecast than anyone else's quote.
Price, Duration and Cash Travel Together
A contract's headline price matters alongside its duration, advance payments and customer credit quality.
Duration sets how long the price lasts and how lenders treat the revenue. Prepayment sets how much of the hardware the customer funds before service begins. Customer credit sets the cost of borrowing against the contract. A higher price with a short term and no prepayment can be worth less to IREN than a lower price with a five-year commitment and 90% of the GPU cost paid upfront.
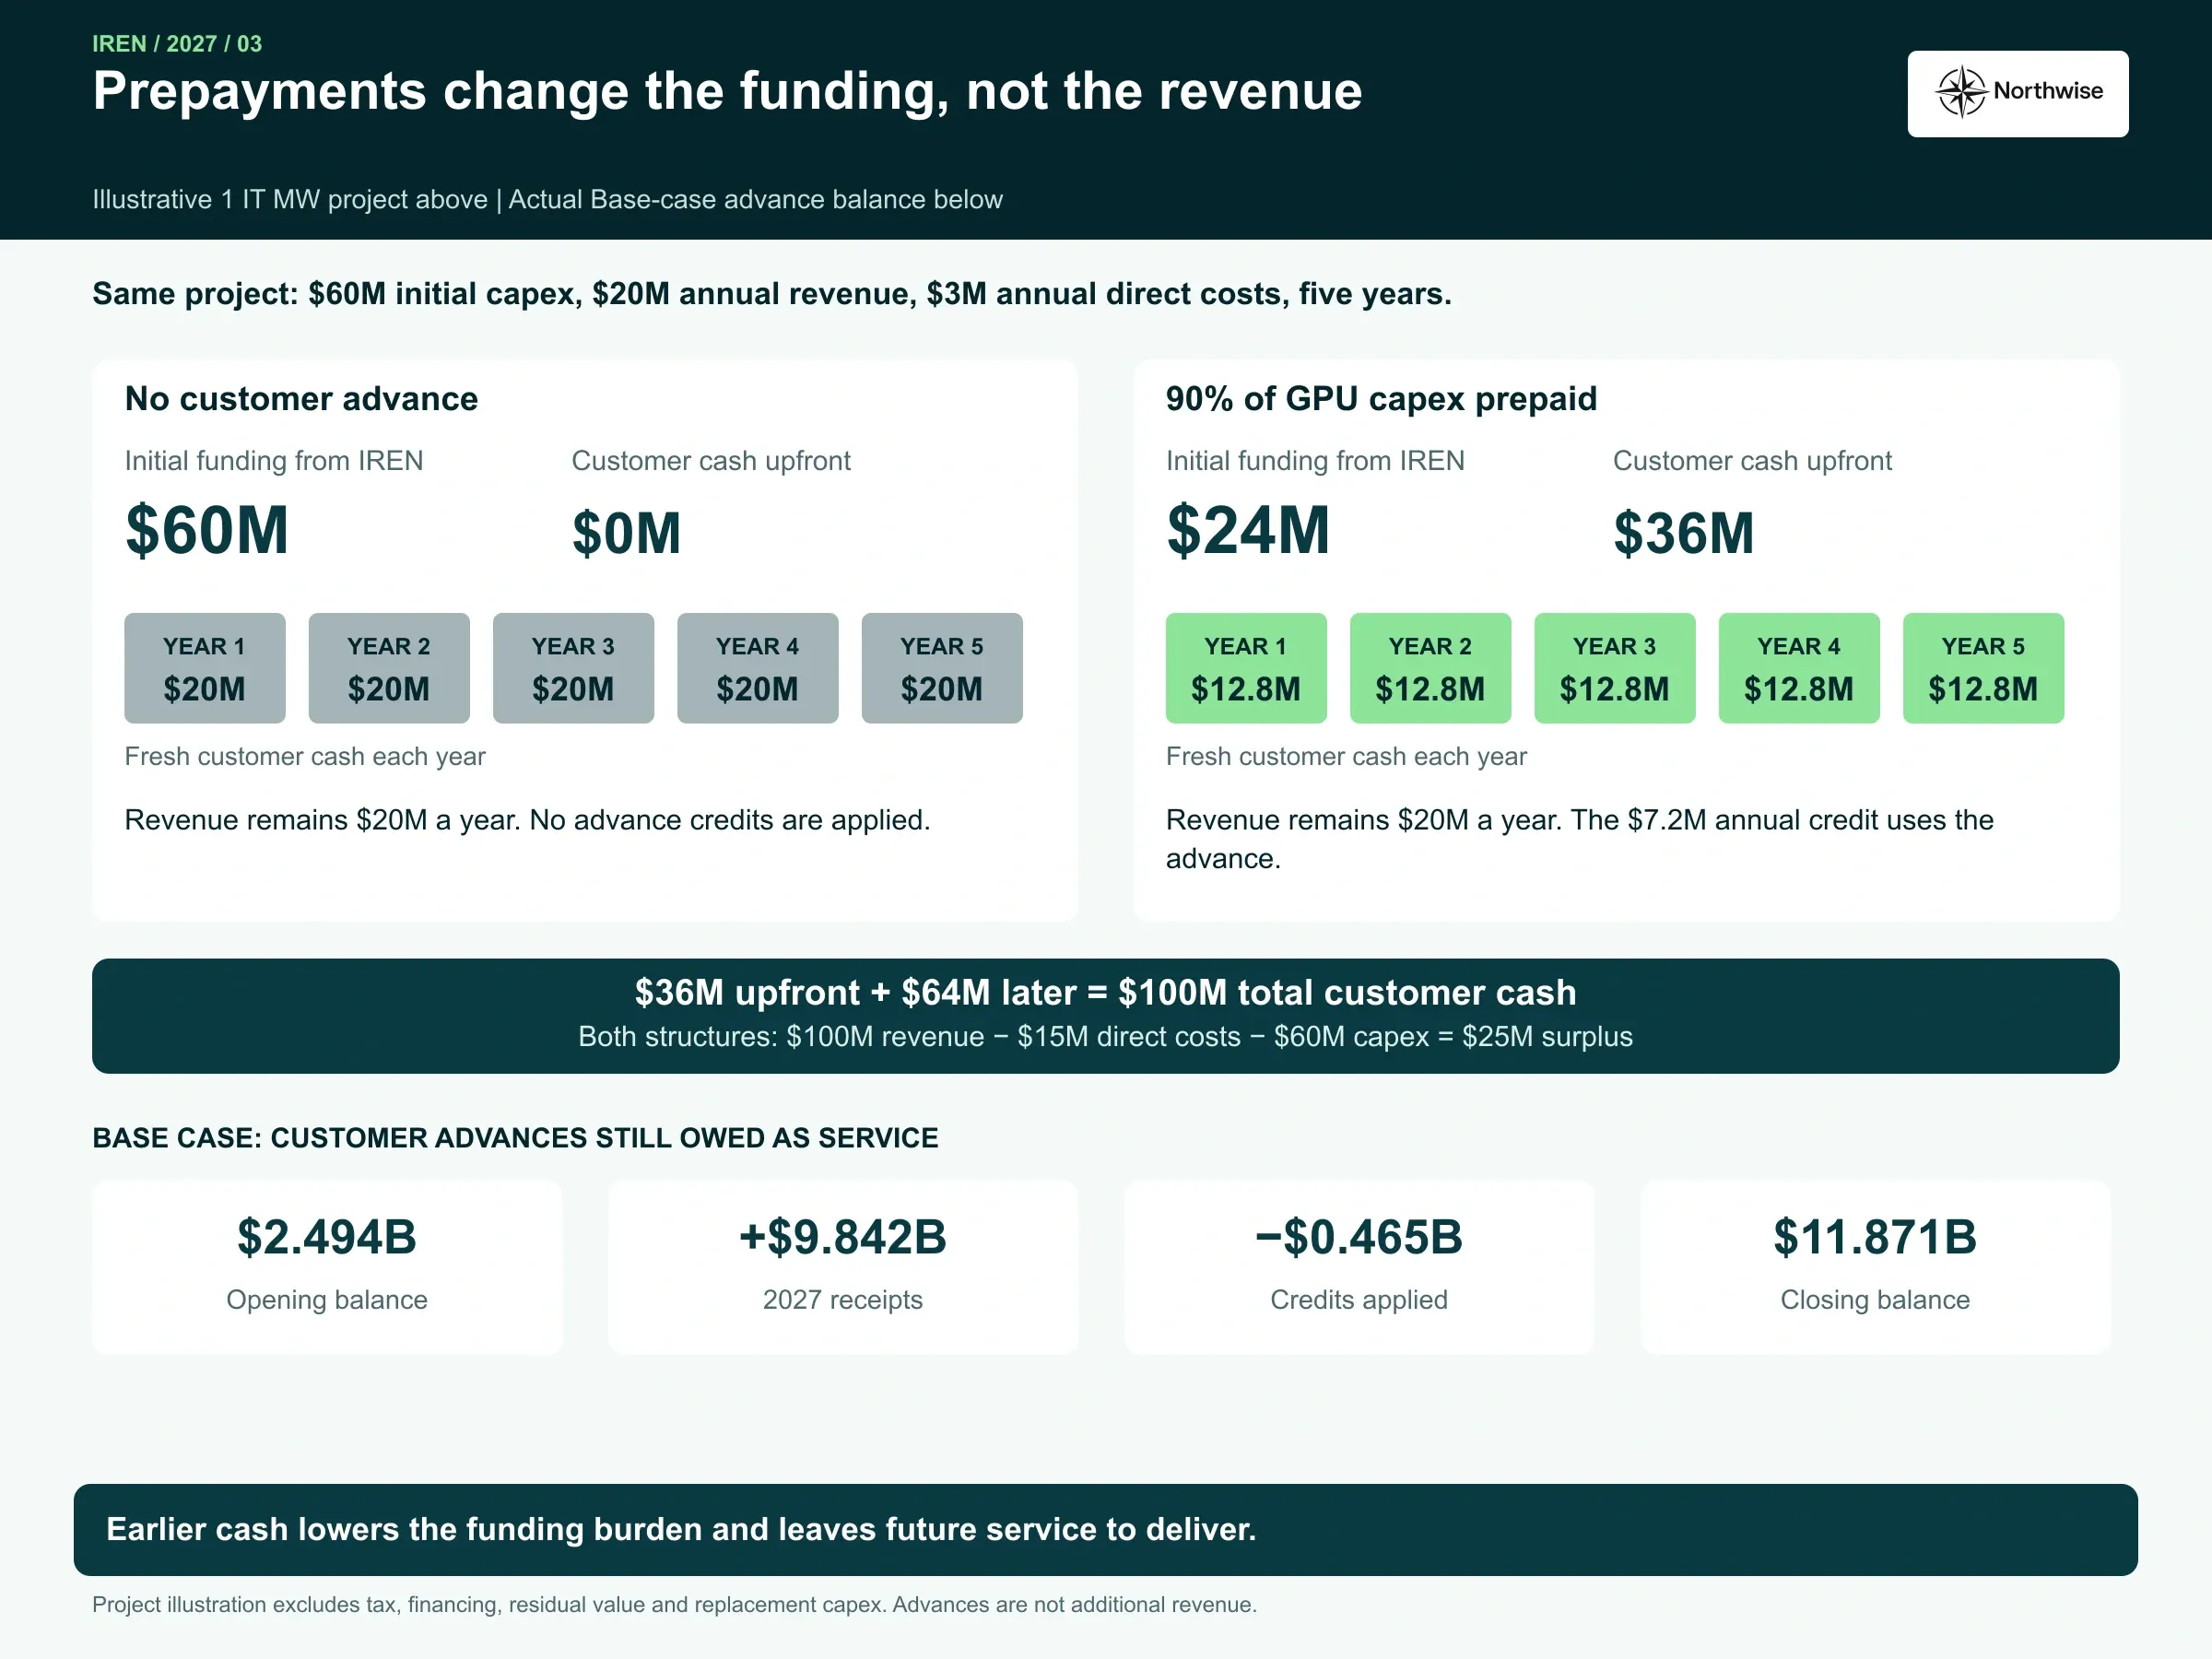
Management's own illustration makes the mechanics concrete. Take one IT MW earning $20M a year, with $20M of data center capex, $40M of GPU capex and $3M of annual direct costs. A customer prepaying 90% of the GPU cost hands over $36M before service starts and earns it back as a $7.2M annual credit over 5 years.
IREN's upfront capital falls from $60M to $24M, and simple payback drops to about 2.45 years. The simplified, undiscounted five-year surplus is the same $25M with or without the advance, before tax, financing costs, residual value and replacement spending. The prepayment changes how much money IREN must raise and when, without adding a dollar of revenue.
Our cases bundle price, duration and prepayment for each new cohort into a single package.
New-contract package | Bear | Base | Bull |
|---|---|---|---|
Five-year share | 80% | 65% | 50% |
Three-year share | 18% | 30% | 40% |
Short-duration share | 2% | 5% | 10% |
Five-year price, liquid, per IT MW | $20M | $23M | $25M |
Three-year price, liquid, per IT MW | $22M | $25M | $28M |
Short-duration price, per IT MW | $30M | $40M | $44M |
Short-duration paid coverage | 90% | 95% | 97% |
Blended liquid revenue per IT MW | $20.50M | $24.35M | $27.97M |
Customer prepayment, share of GPU capex | 45% | 60% | 85% |
Term GPU financing, share of GPU capex | 40% | 30% | 5% |
The Base blend works out as 65% of $23M, plus 30% of $25M, plus 5% of $40M adjusted for 95% paid coverage, for $24.35M per IT MW. A 50 IT MW liquid hall therefore carries about $1.22B of annual run rate. If its acceptance begins on October 29 and completes 30 days later, as Horizon 5 does in our Base case, it adds about $0.16B to 2027 revenue and the full $1.22B to the December exit.
The packages hang together on purpose. In Bull, customers pay more and prepay more, so IREN needs very little term GPU debt. In Bear, they pay less and prepay less, and lenders carry more of each cohort. A larger short-duration share lifts revenue per MW and shrinks the slice of capacity lenders will finance against term contracts, which is why Bull leans so heavily on customer money.
The Bull prepayment assumption of 85% is aggressive. It rests largely on one disclosed transaction at 90%, and management's portfolio objective of about 90% total GPU financing explicitly blends lender funding with prepayments. If customers prepay closer to the Nebius pattern of 50% to 60%, Bull needs materially more debt or equity than we show.
The Product on the Shelf
IREN sells sales-led GPU clusters, dedicated or managed, with bare-metal access, high-speed networking, storage and round-the-clock support. Its public offering is narrower than the platforms of Nebius or CoreWeave, which document self-service consoles, managed Kubernetes and Slurm, serverless inference and developer tooling.
The Mirantis acquisition, closed on August 3, is IREN's move to narrow that gap. Mirantis brings Kubernetes lifecycle management, cluster provisioning for NVIDIA hardware, observability and its k0rdent AI platform, and it already serves as the orchestration layer inside the NVIDIA managed cloud agreement. IREN says it is integrating k0rdent AI across its cloud.
The evidence supports a real capability in managed infrastructure, applied to at least one very large contract. A measurable software premium on IREN's contracts, or a broad catalog of self-service products, has yet to show up. Management expects Mirantis revenue to be immaterial in fiscal 2027.
We therefore add no software uplift to revenue per MW. Software shows up where it plausibly acts first: winning managed contracts like NVIDIA's, onboarding speed, reliability and renewal. Until IREN wins deals that explicitly price those services, it competes mainly on delivered, powered capacity, which in this market is a strong hand on its own.
Texas and the Permit Question
On September 21 the Texas governor directed the state's environmental regulator to pause data center approvals pending an audit. The regulator's October 19 response extended the pause to infrastructure directly supporting data centers and to some authorizations that normally need no affirmative permit. ERCOT separately paused initial energization approvals for new large loads of 75 MW or more, with an impact report targeted for December 10.
Most of IREN's modeled 2027 growth is in Texas. The effect depends on the authorization and the specific phase, so existing operating facilities and new developments need separate treatment.
Childress is energized and operating. Horizon 1 is accepted, and the rest of the campus sits behind existing power. Its pending federal operating permit application was filed in August and listed as administratively complete, and a timely, complete application generally protects an operating site while it is reviewed. That treatment does not establish approval for every expansion or replace other required authorizations.
Sweetwater 1 is connected, with an active early-works authorization, and management said on the November call that the permits needed for construction had been obtained. Both Sweetwater sites were conditionally included as base load by ERCOT in September.
Each of those facts has edges. An early-works authorization does not cover a 1.4 GW campus by default, and conditional classification falls short of unconditional permission to energize every later phase. A pending concrete-batch authorization tied to Sweetwater 2 could sit on its critical path. New Texas rules on large loads also bring curtailment obligations and collateral of $50,000 per MW for qualifying expansions.
We assign the exposure phase by phase and avoid a blanket Texas haircut. Childress and the first Sweetwater 1 program carry modest incremental risk in our Base case. Sweetwater 1 blocks C and D still contribute late in our 2027 Base case and remain exposed to phase-specific conditions. Expansion beyond the modeled Sweetwater 1 program, including Sweetwater 2, receives no 2027 operating revenue. Bear pushes Horizon 5 and Sweetwater block A into the final days of the year and defers GPUs for the remaining Sweetwater blocks, which is roughly how a meaningful regulatory delay would surface in the numbers.
Scarcity also cuts both ways. A freeze that slows IREN's expansion slows its competitors too, which supports pricing on the capacity IREN does deliver. We do not assume that scarcity automatically compensates for IREN's delays. Bear combines weaker execution and weaker commercial terms, while any pricing benefit from constrained competing supply remains a possible offset.
Reconciling Management's Fiscal Plan to Our Calendar
IREN's fiscal year ends in June and our forecast runs on the calendar, and the mismatch has a way of hiding capital.
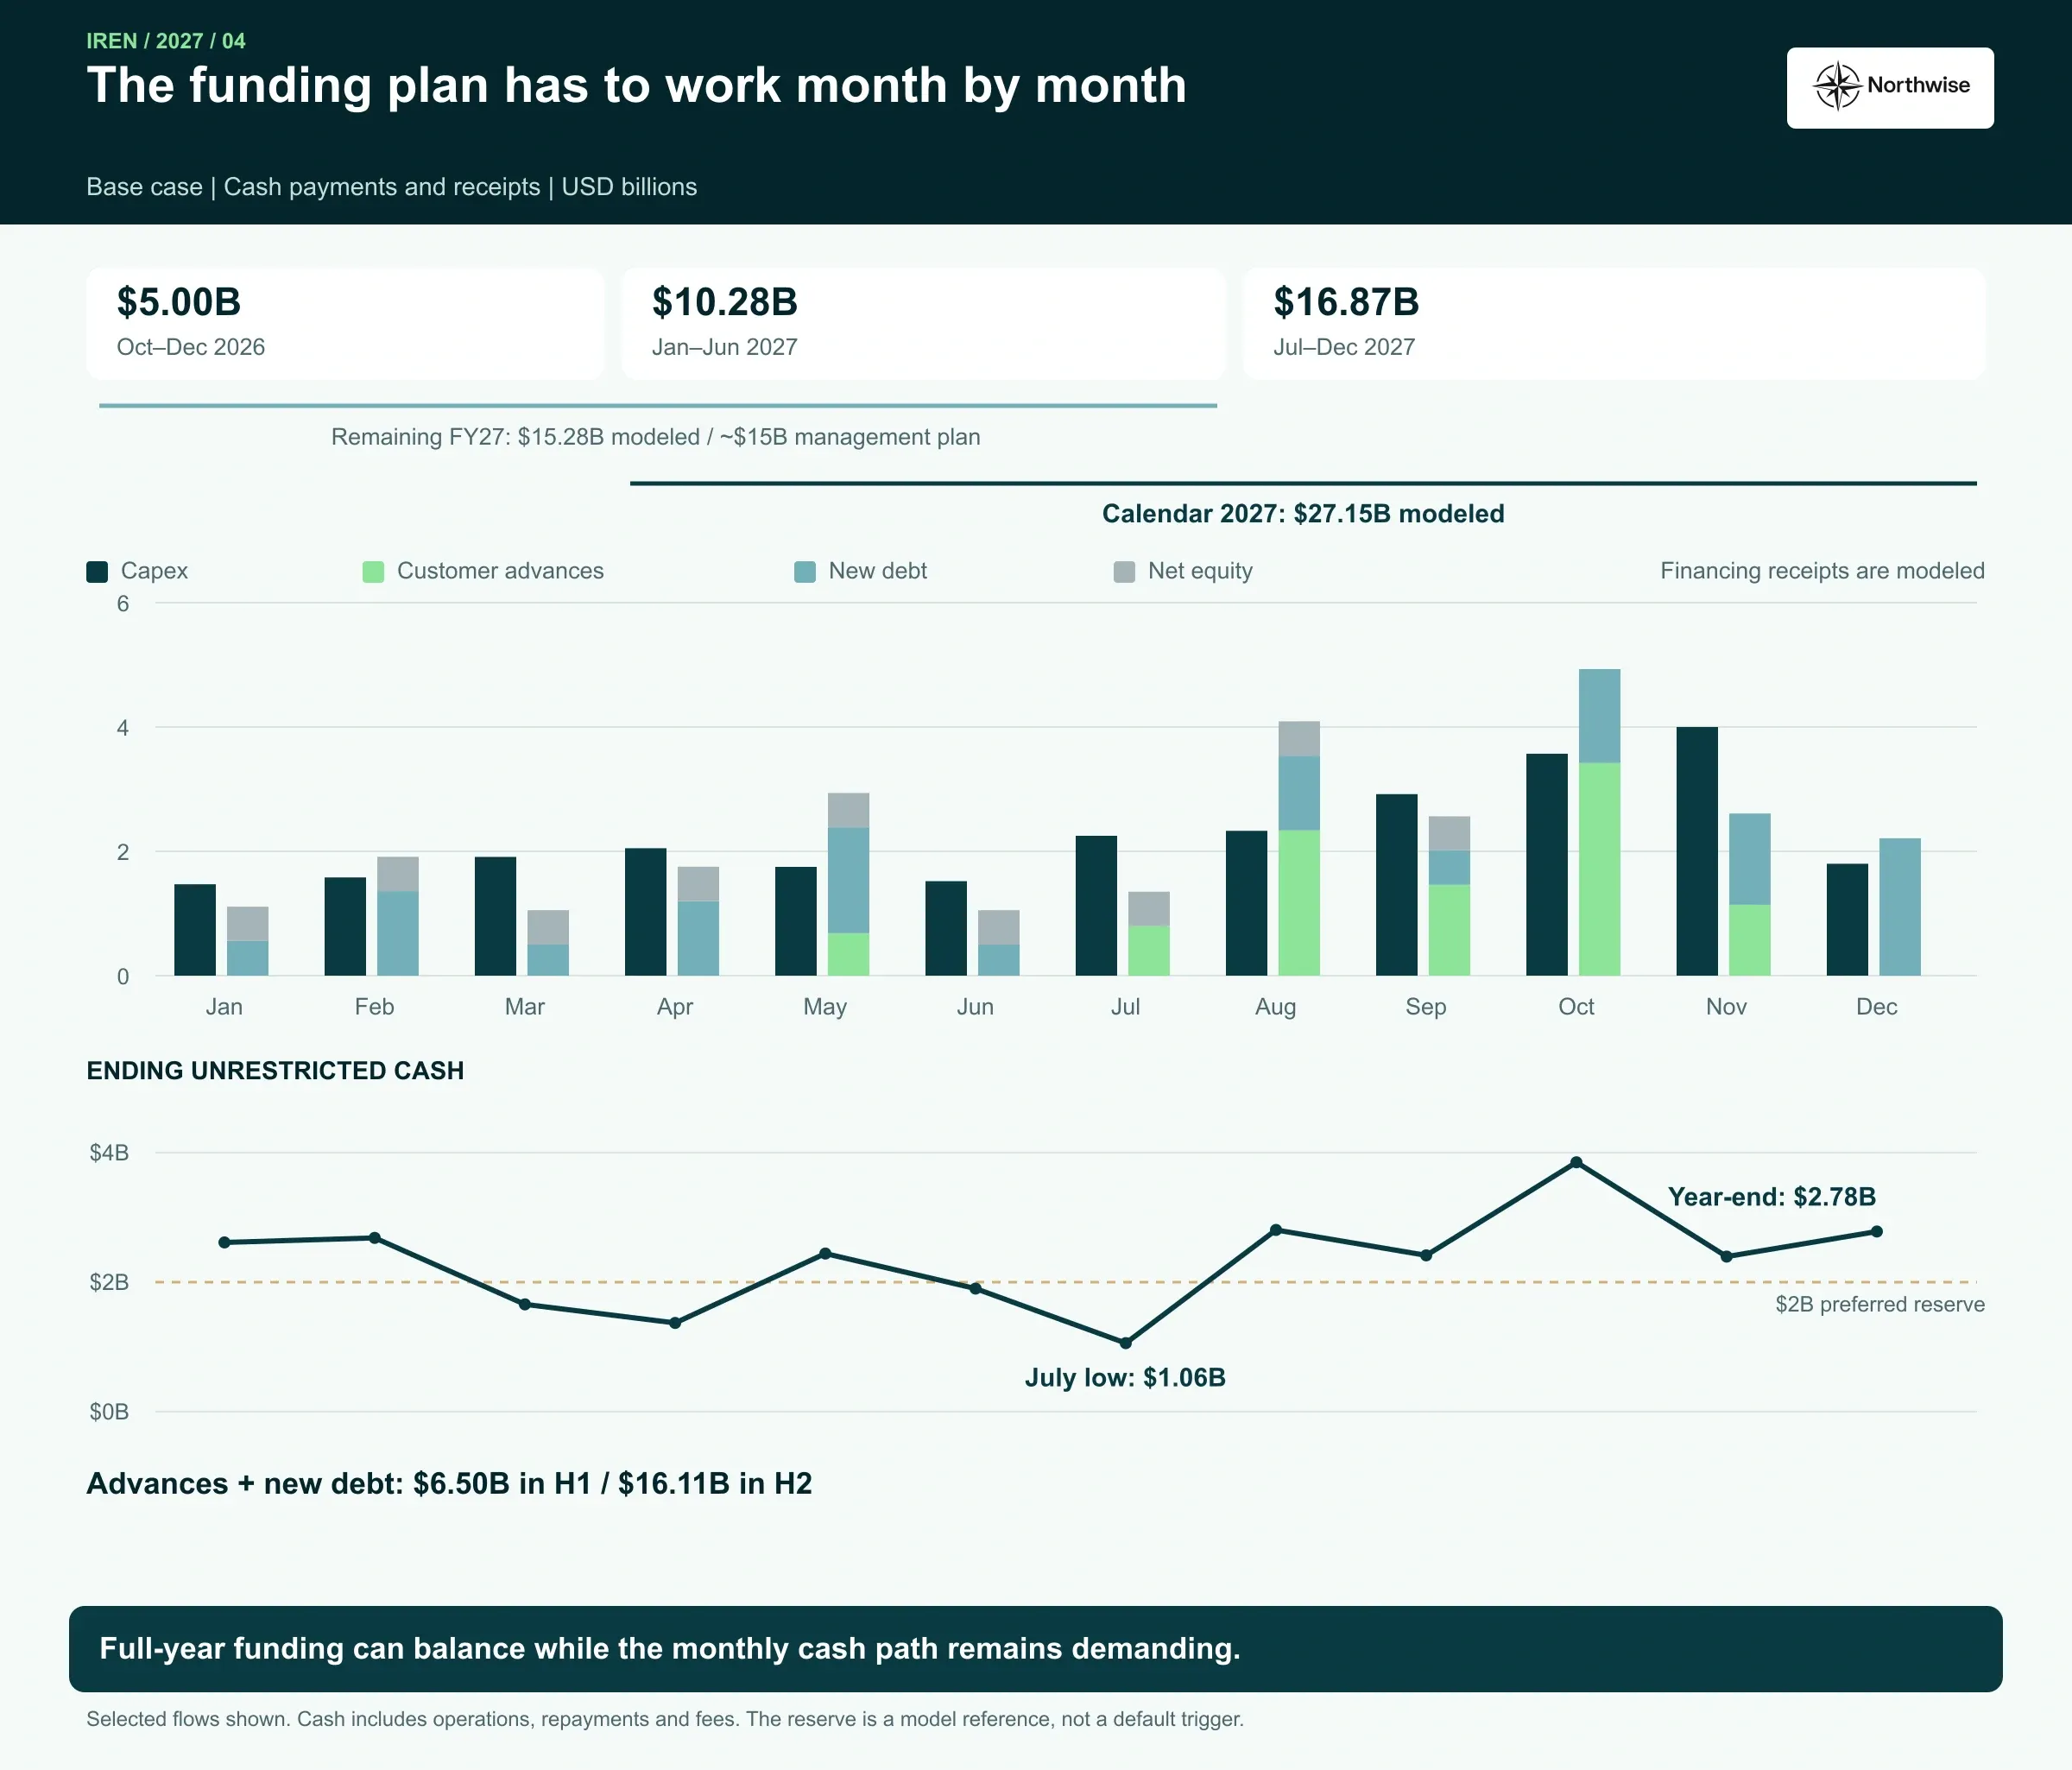
Management's $15B of remaining fiscal 2027 capex runs from October 2026 to June 2027. Our forecast places $5B of spending in the December 2026 quarter, and adding our January-to-June payments gives $14.17B in Bear, $15.28B in Base and $15.86B in Bull. The Base figure lands within 2% of the headline, with the difference coming from modeled payment timing. The comparison supports the scale of first-half spending, while the payment dates remain our estimates.
The second half of calendar 2027 sits outside the period covered by that remaining-FY27 capex guidance, and it is where the bill gets serious. Base spends $10.28B from January to June and $16.87B from July to December, as Dell deliveries arrive, Horizon 5 and 6 and Sweetwater 1 are fitted out and the Canadian halls are converted.
Management has pointed to $12B to $15B of potential financing capacity against its projected end-of-fiscal-2027 assets: about $5B to $7B against data centers, about $5B of GPU financing and prepayments, and $2B to $3B of corporate debt. None of it is committed. Our second-half receipts assume IREN can finance additional assets and contracts on similar terms, and they are our estimate of a feasible path, distinct from anything the company has announced.
Invoices Arrive Before Customers Do
Capex runs on its own clock, and that clock pays no attention to when customers start paying.
Each cohort passes through separate cash events in our model: the GPU order and any deposit, payment on shipment, data center construction payments, and finally the customer's acceptance. The Dell agreement requires payment within 30 days of shipment, backed by a parent guarantee. A hall running late on acceptance can still owe its supplier in full.
Capex and capacity, 2027 | Bear | Base | Bull |
|---|---|---|---|
Capex | $17.25B | $27.15B | $30.21B |
GPU-ready IT MW, December | 632.5 | 860 | 876 |
Billing IT MW, December | 527 | 748 | 876 |
Ready, awaiting acceptance, IT MW | 106 | 112 | 0 |
GPU orders deferred, IT MW | 207.5 | 0 | 0 |
Data center construction in progress, December | $2.6B | 0 | $1.5B |
The Bear column tells the story of slippage most clearly. Bear keeps the initial program and the roughly 300 IT MW of GPUs IREN has already ordered, which takes its equipment scope to 632.5 IT MW. It defers the 207.5 IT MW of unplaced orders: Horizon 6, most of Sweetwater block B, blocks C and D, and Canal Flats.
Even so, Bear spends $17.25B. The deferred halls keep their construction crews, and ordered equipment is paid for on shipment whether customers are ready or not.
Only 527 IT MW bill by December. Another 106 IT MW sit ready and waiting on acceptance, 150 IT MW of halls are still under construction, and a $400M construction payment slides into January 2028. Slippage cuts revenue far faster than it cuts spending.
The Bull column carries a different kind of spending. On top of a fully delivered 876 IT MW, it commits $2.1B in 2027 to the next phase of Sweetwater: $1.5B of construction and $600M of GPU deposits. None of it earns revenue in 2027, and the valuation gives it no separate credit. It is there to show that a company executing at Bull speed will already be paying for 2028 by the autumn.
Customer Money and Borrowed Money
Two sources carry most of the build before shareholders are asked for anything: customers and lenders.
Customer advances are the more distinctive. In the Base case IREN collects $9.84B of advances in 2027 from new term contracts prepaying 60% of their GPU cost. Those advances are cash today and service owed tomorrow: as each prepaid contract runs, part of its billing is settled by a credit against the advance instead of fresh cash. Credits applied in 2027 total only $0.46B, and the balance still owed at year end, about $11.9B, is a claim on future billing.
Lenders supply the rest. Base draws $12.77B of new debt and makes $2.71B of debt and lease principal repayments, ending the year with about $22.6B of debt principal. Recent financings show what credit quality is worth: about 6.0% against investment-grade contracts and 9.0% to 9.5% against others. Data center financing for Horizon 1 to 4 and GPU financing for the NVIDIA and existing-customer capacity are the stated near-term priorities, and neither is yet an executed facility.
Base case, 2027 | Amount |
|---|---|
Capex payments | $27.15B |
Debt and lease principal repayments | $2.71B |
Financing fees | $0.24B |
Total uses | $30.10B |
Operating cash before advances | $2.27B |
Customer advances received | $9.84B |
New debt | $12.77B |
Net equity proceeds | $4.96B |
Reduction in cash balance | $0.26B |
Total sources | $30.10B |
The money does not arrive evenly. About $6.5B of advances and new debt land in the first half and about $16.1B in the second, with customer advances alone jumping from $0.7B to $9.2B as Horizon 5, Sweetwater and the Canadian halls sign and prepay. On paper the plan balances. In practice it asks customers and lenders to commit far more in the second half of 2027 than IREN has arranged so far.
The tightest month in the Base case is July, when unrestricted cash dips to about $1.06B, roughly half the $2B operating reserve we treat as preferred. Bear's low point comes in October at about $0.50B. Neither case runs dry, and neither leaves much margin for a lender that takes an extra month.
The Share Count
Equity is the last source in the stack and the one that matters most to anyone who owns the stock today.
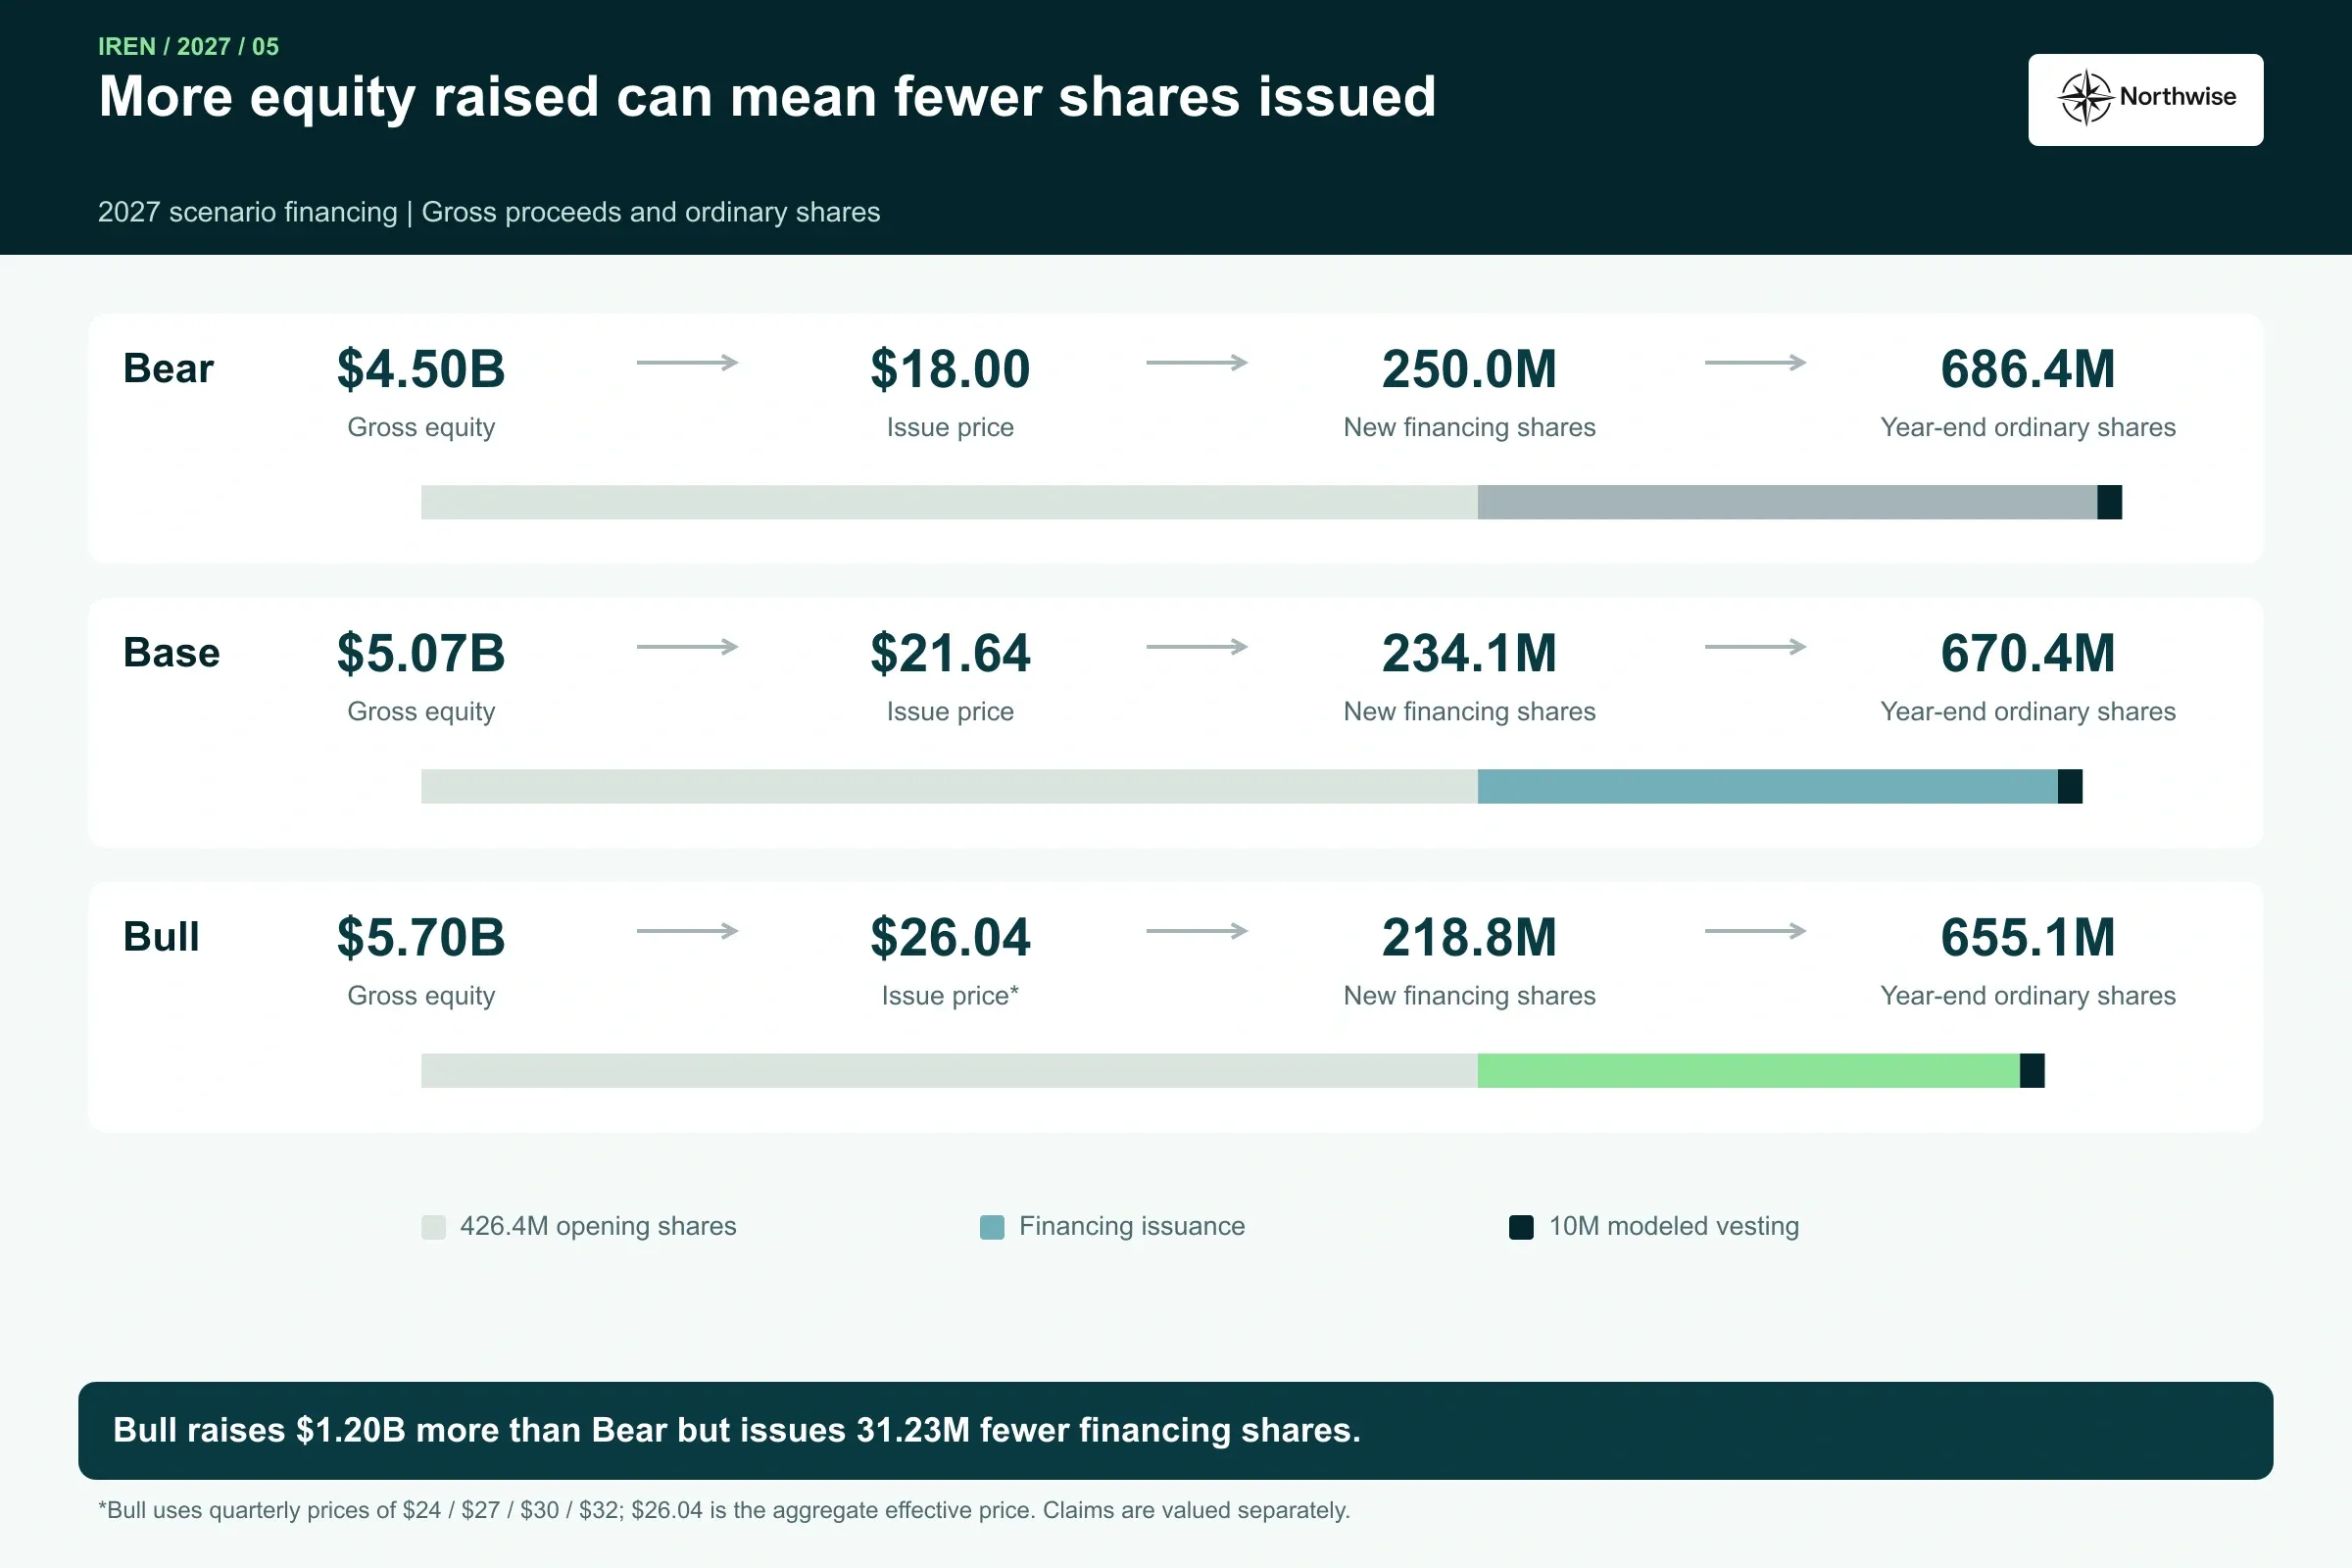
For the Base case we assume IREN issues at $21.64, the November 6 close, throughout the year, less a 2% allowance for costs. The October average of $36.26 is a real historical price and a poor forecast. Assuming the stock recovers before IREN needs to sell it would quietly build the conclusion into the funding math.
At that price, $5.07B of gross equity creates about 234M new shares. With stock compensation vesting, the share count climbs from about 426M to 670M by December, an increase of 57%.
Issuance is front-loaded. Base sells about $564M a month from January through August, $553M in September and nothing after that, as fourth-quarter customer advances and debt take over. Those amounts exceed the roughly $2.3B left on IREN's current ATM program, so the case assumes a new authorization by the spring.
Equity and shares | Bear | Base | Bull |
|---|---|---|---|
Issue price | $18.00 | $21.64 | $24 rising to $32 |
Gross equity issued, 2027 | $4.50B | $5.07B | $5.70B |
New shares issued | 250M | 234M | 219M |
Ordinary shares, December 2027 | 686.4M | 670.4M | 655.1M |
Bull raises the most equity and still ends with the fewest shares. It builds the most capacity and funds much of it with prepayments that leave less room for GPU debt, and the rising issue price means each dollar costs fewer shares. Bear raises the least and dilutes the most, which is the uncomfortable arithmetic of selling stock at $18.
Ordinary shares are only part of the dilution picture. IREN has six convertible note series, most paired with capped calls, NVIDIA holds conditional rights to buy up to 30M shares at $70, of which we include 10M in the modeled 2027 claims, and employees hold options. Whether those claims dilute depends on the share price at the valuation date, so we resolve them there instead of adding every potential share to the count.
Why $4.2B of EBITDA Still Loses Money
Revenue in the Base case climbs from $0.65B in the first quarter to $2.40B in the fourth, as Microsoft's blocks, the British Columbia halls, NVIDIA's tranches, the Childress air sales and finally the liquid-cooled halls arrive in sequence. For the year, revenue reaches $5.92B, against a December 2026 quarter in which management guided to about $250M of AI cloud revenue.
Base case, 2027 | Q1 | Q2 | Q3 | Q4 | Year |
|---|---|---|---|---|---|
Billing IT MW, quarter end | 347.5 | 442.5 | 490.2 | 748.3 | 748.3 |
Revenue | $0.65B | $1.24B | $1.63B | $2.40B | $5.92B |
EBITDA before stock compensation | $0.37B | $0.86B | $1.18B | $1.80B | $4.21B |
EBITDA margin | 56.6% | 69.1% | 72.1% | 75.2% | 71.0% |
Depreciation | $0.50B | $0.79B | $0.92B | $1.43B | $3.64B |
Normalized net earnings | ($0.33B) | ($0.17B) | $0.02B | $0.04B | ($0.43B) |
Exit run rate, quarter end | $4.23B | $6.20B | $7.18B | $13.41B | $13.41B |
EBITDA margins are high, driven by low direct costs per MW once capacity is running and corporate costs that grow far more slowly than revenue. The 86% segment gross margin IREN reported last quarter excludes depreciation and corporate costs, and it should not be confused with EBITDA.
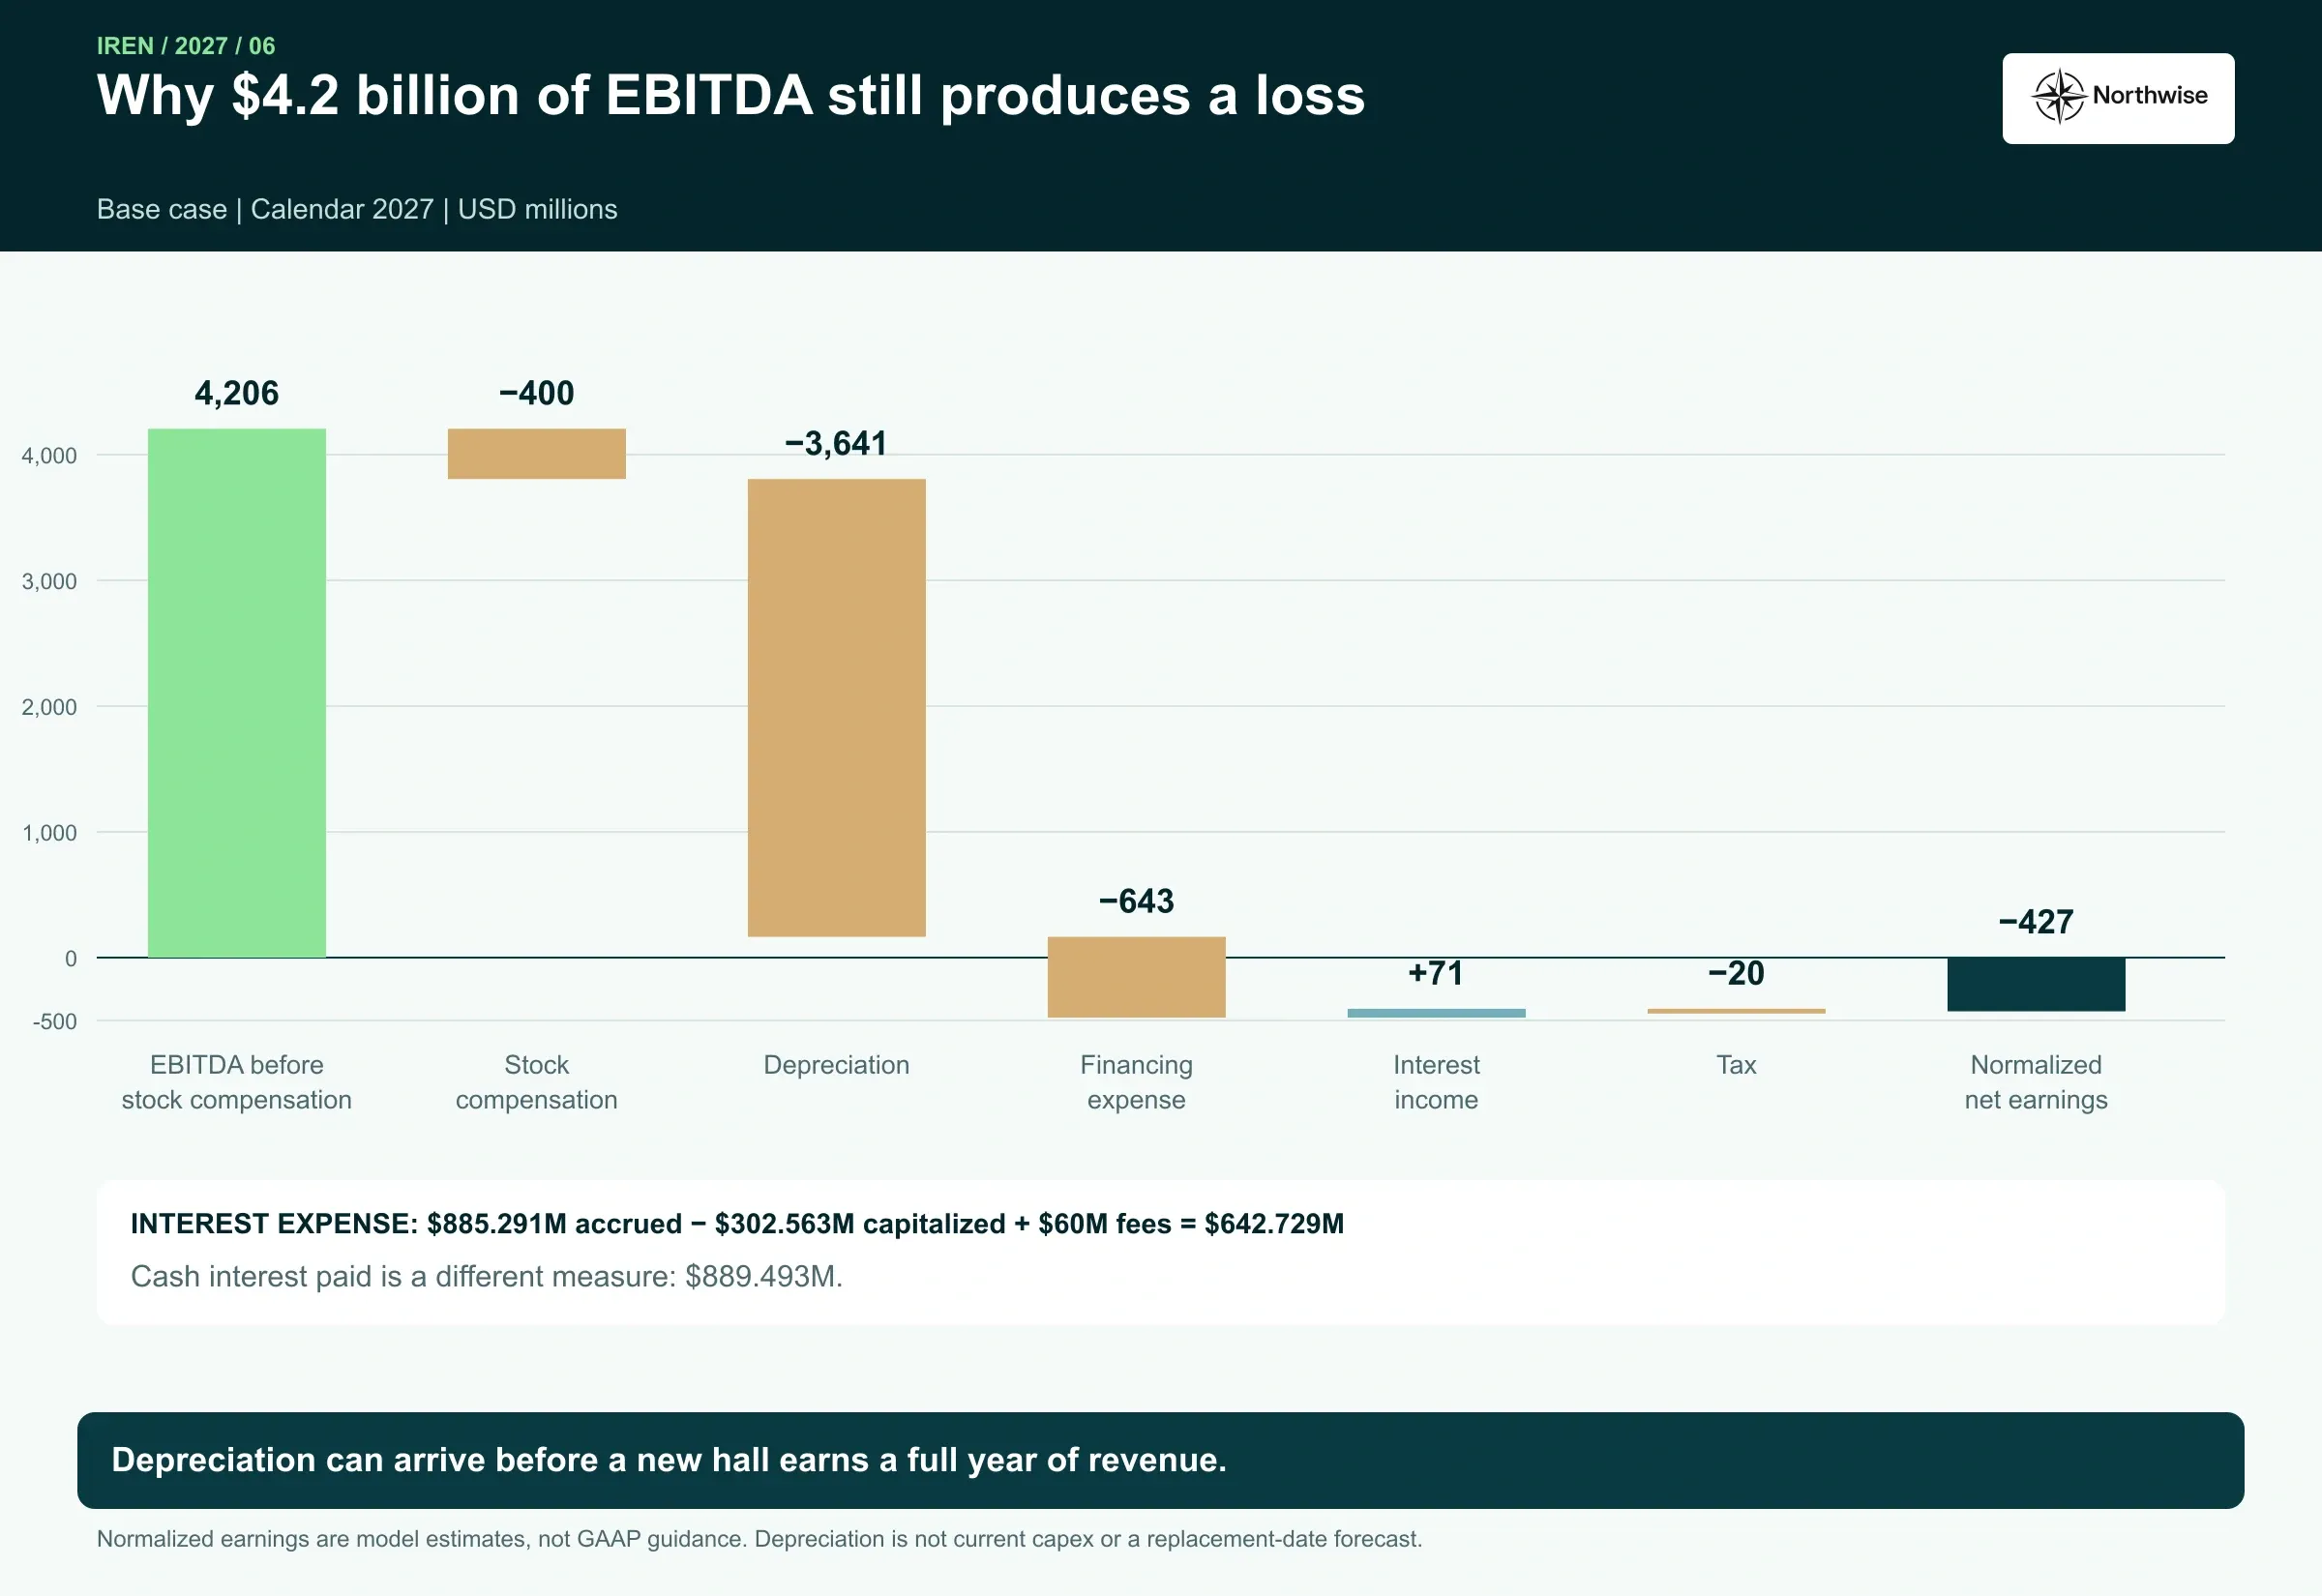
Below EBITDA the picture changes. GPUs depreciate over five years and infrastructure at 7.25% a year, so depreciation reaches $3.64B as billions of dollars of hardware enter service. Accrued financing interest is $0.885B. After capitalizing $0.303B into construction and adding $0.060B of debt-fee amortization, the earnings charge is $0.643B. Cash interest paid is a separate $0.889B measure. Stock compensation is $0.400B, interest income contributes $0.071B and tax is $0.020B. Base therefore loses $0.43B for the year even as EBITDA passes $4B.
The loss is the signature of a fleet in mid-ramp. Depreciation arrives with the hardware, revenue arrives with acceptance, and the gap closes as the year ends: fourth-quarter EBITDA annualizes to about $7.2B, depreciation to about $5.7B, and core earnings to barely above zero. A depreciating GPU fleet is no annuity, and the earnings line is where that becomes visible.
Our earnings line is labeled normalized for a reason. The forecast is an operating, cash and funding model, and GAAP treatment of financing components in prepaid contracts, lease classification, derivative remeasurement and impairment will differ from our service-period figures.
Three Ways 2027 Can Unfold
Our cases describe different combinations of execution, commercial terms and funding. Each moves timing, scope, pricing, prepayment, financing and the equity price together, as those variables tend to move together in practice.
Bear is a managed slowdown. Microsoft's last blocks slip to the end of March, liquid-cooled construction runs 45 days behind benchmark, qualification takes 30 days and acceptance ramps over 45. IREN keeps the GPUs it has already ordered and defers the rest, prices new contracts below the deals it has already disclosed and sells $4.5B of equity at $18. It ends 2027 with 527 IT MW billing and a long queue of finished capacity waiting at the door.
Base follows the disclosed construction stages with a separate acceptance schedule for each deployment. The initial program completes through February, the Childress air halls and NVIDIA tranches ramp across the year, and the liquid-cooled halls in Texas and Canada arrive in a dense fourth-quarter wave. Every GPU in its 860 IT MW scope is in place by December, and the last 112 IT MW are still working through acceptance on New Year's Eve.
Bull is faster delivery and richer contracts together. The initial program finishes in January, construction runs 30 days ahead of benchmark, qualification takes a week, and all 876 IT MW are billing before Christmas. Customers prepay 85% of new GPU cost, short-duration capacity takes 10% of new sales, and equity sells at prices rising from $24 to $32.
Case outputs, 2027 | Bear | Base | Bull |
|---|---|---|---|
Revenue | $4.93B | $5.92B | $7.51B |
EBITDA before stock compensation | $3.31B | $4.21B | $5.64B |
Normalized net earnings | ($0.98B) | ($0.43B) | $0.49B |
Exit annualized revenue, December | $7.67B | $13.41B | $18.17B |
Billing IT MW, December | 527 | 748 | 876 |
Capex | $17.25B | $27.15B | $30.21B |
Customer advances received | $3.62B | $9.84B | $13.62B |
New debt | $9.20B | $12.77B | $10.23B |
Debt and leases, December | $19.19B | $22.71B | $20.27B |
Lowest unrestricted cash | $0.50B | $1.06B | $2.20B |
Three features stand out. Calendar revenue varies far less than exit revenue, $4.93B to $7.51B against $7.67B to $18.17B, as most of the difference between cases sits in capacity that starts billing late in the year. Bear still grows revenue many times over, a reminder of how much is already contracted and built. And no case runs out of cash, as each assumes its financing response is achieved.
None of the cases is a percentile, a floor or a ceiling. They are three coherent versions of 2027 in which IREN keeps its access to capital.
What the Cases Leave Out
The most important limitation is the one all three share. Each assumes IREN raises the debt, prepayments and equity it needs at roughly the terms assumed.
A real funding failure would look nothing like Bear. It could involve unpaid supplier obligations, lender enforcement, distressed asset sales or a recapitalization on terms set by new money. Valuing that outcome requires entity-level collateral, creditor claims and realizable asset values that public disclosures do not fully provide, and we decline to pretend a weaker Bear stands in for it.
Smaller stresses inside the cases are visible already. If new GPU loans could only be drawn after customer acceptance, Bear would face a temporary cash gap of about $287M. If construction payments kept their original dates in place of moving with the slower build, the gap would be about $104M. Neither stress changes a single megawatt, and both show how thin the margin is in a year when cash leaves before it returns.
Several risks are also correlated in ways separate cases cannot fully display. Delayed acceptance with fixed supplier payments, lower prices with weaker prepayments, tighter lending with a lower share price, a permit delay on a phase with ordered hardware: any of these pairs could arrive together.
Future hardware replacement remains an important economic cost. The model depreciates GPUs over five years, but that accounting assumption does not establish a physical replacement date in 2032. Actual renewal needs will depend on performance, customer requirements, maintenance and resale economics. We do not forecast a replacement cycle beyond 2027; the valuation multiples must allow for that capital burden.
What Would Change Our View
The next disclosures can be tested against specific capacity, contract and financing assumptions.
On delivery, the first test is Microsoft's acceptance of Horizon 2 to 4 by the end of February, followed by the Mackenzie and initial Childress air blocks. Each month of slippage across those blocks costs about $250M of 2027 revenue. Later, Dell delivery dates and the commissioning of Horizon 5 and Sweetwater block A become the dates that separate Base from Bear. A hall with GPUs installed and no customer acceptance changes our readiness evidence, not our revenue.
On Canada and Spain, construction milestones at Canal Flats, Mackenzie and Prince George, and any sign of a signed compute customer in Galicia, would firm up capacity we currently treat as estimates. A delayed Galicia milestone removes or defers that cohort alone, without touching the rest of the international pipeline.
On regulation, the ERCOT impact report targeted for December 10, final classifications for Sweetwater and the status of the Childress operating permit application would tell us whether our phase-by-phase treatment is too generous or too cautious.
On commercial terms, the most useful disclosures would be signed IT MW with matched price, duration and prepayment, the size and pricing of the existing frontier-lab commitment, and renewal pricing on older hardware. A headline price without a quantity says less than a smaller deal with full terms, and a move in public spot quotes does not reprice reserved capacity.
On financing, the decisive events are executed facilities for Horizon 1 to 4 and the Childress air GPUs, customer advances actually received, a new equity authorization and the prices at which equity is sold. An executed loan changes funding certainty. Advances arriving later than contracted acceptance, or equipment invoices arriving earlier, would push Base toward Bear.
Management commentary carries less weight in our framework than evidence that capacity was accepted, customers paid the modeled price and financing closed on schedule.
Where This Leaves Us
IREN has crossed from power owner to contracted AI cloud. Its customers are among the most demanding buyers of compute anywhere, its newest contracts price far above its oldest, and those customers are willing to fund much of the hardware to secure a place in line. On the operating evidence, 2027 is the year the contracted program becomes revenue and the second wave gets built, with the last of it crossing the finish line as the year closes.
The bill is large and arrives early. Our Base case spends about $27B in 2027, borrows about $12.8B, collects about $9.8B from customers in advance and still sells about $5.1B of equity at the reference price, lifting the share count by more than half. Each of those steps has precedent. Each still has to happen.
Applying the November 6 reference price of $21.64 to our modeled December 2026 opening share count gives about $9.2B of equity value. Adding the same modeled opening debt and leases and deducting unrestricted cash gives an illustrative enterprise value near $18.8B, about 4.5 times Base 2027 EBITDA and 1.4 times its December exit run rate. This is a bridge using forecast opening balances, not a measurement of enterprise value on November 6. Those multiples look low for a business on this trajectory and more reasonable once the capital still to be spent, the shares still to be issued and the hardware still to be replaced are counted.
Our view is that the contract and pricing evidence supports more operating growth than the reference valuation suggests. Financing remains essential to realizing that growth, particularly in the second half of 2027.
How much of the improving contract economics actually reaches the equity is a valuation question, and that is where the premium section picks up.
Inside Premium
The premium section values IREN on December 31, 2027 under each case, walks the bridge from enterprise value to value per share, including convertibles, capped calls, NVIDIA's rights and employee options, and sets out the probabilities we assign to each case and why. It closes with our probability-weighted target, how sensitive it is to multiples, timing, price and a financing tail, the Northwise rating and entry zones, and how the reference price compares with those assumptions.
Northwise Premium
Choose how to continue with Northwise
Join Northwise Premium
Unlock the rest of this report, its complete valuation, the downloadable model, portfolios, and action framework.
Join Northwise PremiumCreate a Free Account
Continue across Free Northwise research, follow companies, save reports, and receive updates.
Create a Free Account
IREN Stock Dilution: Can the Build Reach Shareholders?
IREN stock analysis of AI growth, funding and dilution through 2030. Read our full valuation, 27 scenarios and price zones free. Excel model is Premium.
IREN Stock Forecast 2030
IREN’s new AI-developer contracts are the strongest evidence yet that it can sell something more valuable than bulk hyperscaler capacity.
IREN Stock Infrastructure Analysis
Explore IREN data centers in Canada, the US, Australia and Spain, with site studies and clear distinctions between planned power and delivered AI capacity.
Northwise Portfolios
See how the research becomes real decisions
Reader discussion
Discuss the research
Premium access is required to join this report's discussion.
Join Northwise Premium
No comments yet. Start a thoughtful discussion.