WULF Stock Forecast 2030: The Cash Behind the Campuses
Explore Northwise’s WULF stock forecast for 2030: TeraWulf’s AI campuses, lease cash flow, construction funding, dilution and valuation scenarios.
TeraWulf’s industrial sites are finding new customers in the AI economy. Our forecast follows the power, construction and long-term leases behind that transformation, then examines what the expansion leaves for the shareholders financing it.
Northwise Research | September 11, 2026
On TeraWulf’s August earnings call, chief technology officer Nazar Khan described a construction program that would need roughly 1,000 electricians at its peak. The company had brought in a second electrical contractor at Lake Mariner, its data-center campus in New York, while continuing to adjust the buildings’ power and cooling systems around its customer’s requirements. Server racks would arrive before the first new hall began collecting rent. The equipment still had to be connected, tested and accepted.
TeraWulf, which trades on Nasdaq as WULF, develops the facilities that house other companies’ computing equipment. Its customers bring the servers. WULF supplies the buildings, electrical infrastructure, cooling and operating support needed to keep them working. The business began in Bitcoin mining, but its development program now centers on long-term leases for the much larger computing installations used in artificial intelligence. By the August call, 102 megawatts of that leased capacity were operating at Lake Mariner.
The electrician count is worth remembering alongside the contract headlines. This is a technology investment whose immediate progress depends on an industrial construction schedule.
In Kentucky, WULF has agreed to provide Anthropic with 401 megawatts of critical IT capacity at a former aluminum-smelting site. Together with the retained contracts at Lake Mariner, that brings its contracted portfolio to 839 MW. Anthropic’s initial twenty-year lease represents approximately $19 billion of nominal revenue, a commitment that would have been difficult to reconcile with WULF’s reported business only a few years ago. Most of the facilities that will earn it still have to be completed.
We think the company has earned credibility as a developer. It has attracted demanding customers, assembled sites with identifiable routes to power and begun delivering the infrastructure it promised. Dismissing the whole enterprise as a Bitcoin miner borrowing an AI narrative overlooks the leases and the work already performed.
The favorable interpretation still needs a financial test. A long lease can be attractive to a customer, financeable for a lender and less rewarding than expected for the shareholder who supplies the construction equity. The outcome depends on the rent schedule, the final cost of the facility and how much ownership must be sold before the property can support itself.
Our Base forecast gives WULF considerable operating success. It reaches 2,359 critical IT MW by December 2030, with approximately $5.22 billion of annual revenue. Funding that expansion requires roughly $7.08 billion of additional common-equity proceeds after June 2026, alongside substantial project borrowing.
That is the position we take through this report. WULF has a credible opportunity to become a large infrastructure owner. We are less willing to assume that completing more campuses, on its own, settles the investment case. The detail lies in how those campuses are paid for and what each existing share owns when the work is finished.
Contents
1) The business inside the ticker
2) Why AI customers are looking at old industrial sites
3) Lake Mariner: the construction becomes a business
4) Justified and the opportunity in Kentucky
5) Muskie: a utility partnership with a large bill attached
6) The remaining development portfolio
7) Why selling Abernathy was a serious strategic decision
8) The capacity forecast through 2030
9) What a twenty-year contract pays in its first year
10) The economics of the next 100 megawatts
11) The cash balance and the construction calendar
12) Following rent through the project accounts
13) Minority ownership, employee obligations and compensation
14) The shares issued along the way
15) Reading earnings without losing sight of cash
19) When several things go wrong together
20) How we assess the probabilities
22) Valuing the rent after 2030 Premium
23) Two methods, two different answers Premium
24) Annual share values and the weighted outcome Premium
25) Expected returns and entry prices Premium
26) What the valuation can withstand Premium
27) The Northwise judgment Premium
1. The business inside the ticker
A company developing an AI model needs somewhere to run it. That requires more than floor space. Thousands of specialized processors must receive power continuously, release their heat safely and communicate without the surrounding facility becoming the constraint.
WULF’s role is to deliver and operate that facility. Its leases specify infrastructure and capacity for the tenant’s high-performance computing workloads, usually abbreviated HPC. The customer supplies the computing equipment and controls its use. Our forecast therefore does not include a WULF-owned fleet of graphics processing units, or GPUs, the specialized processors commonly used for AI work.
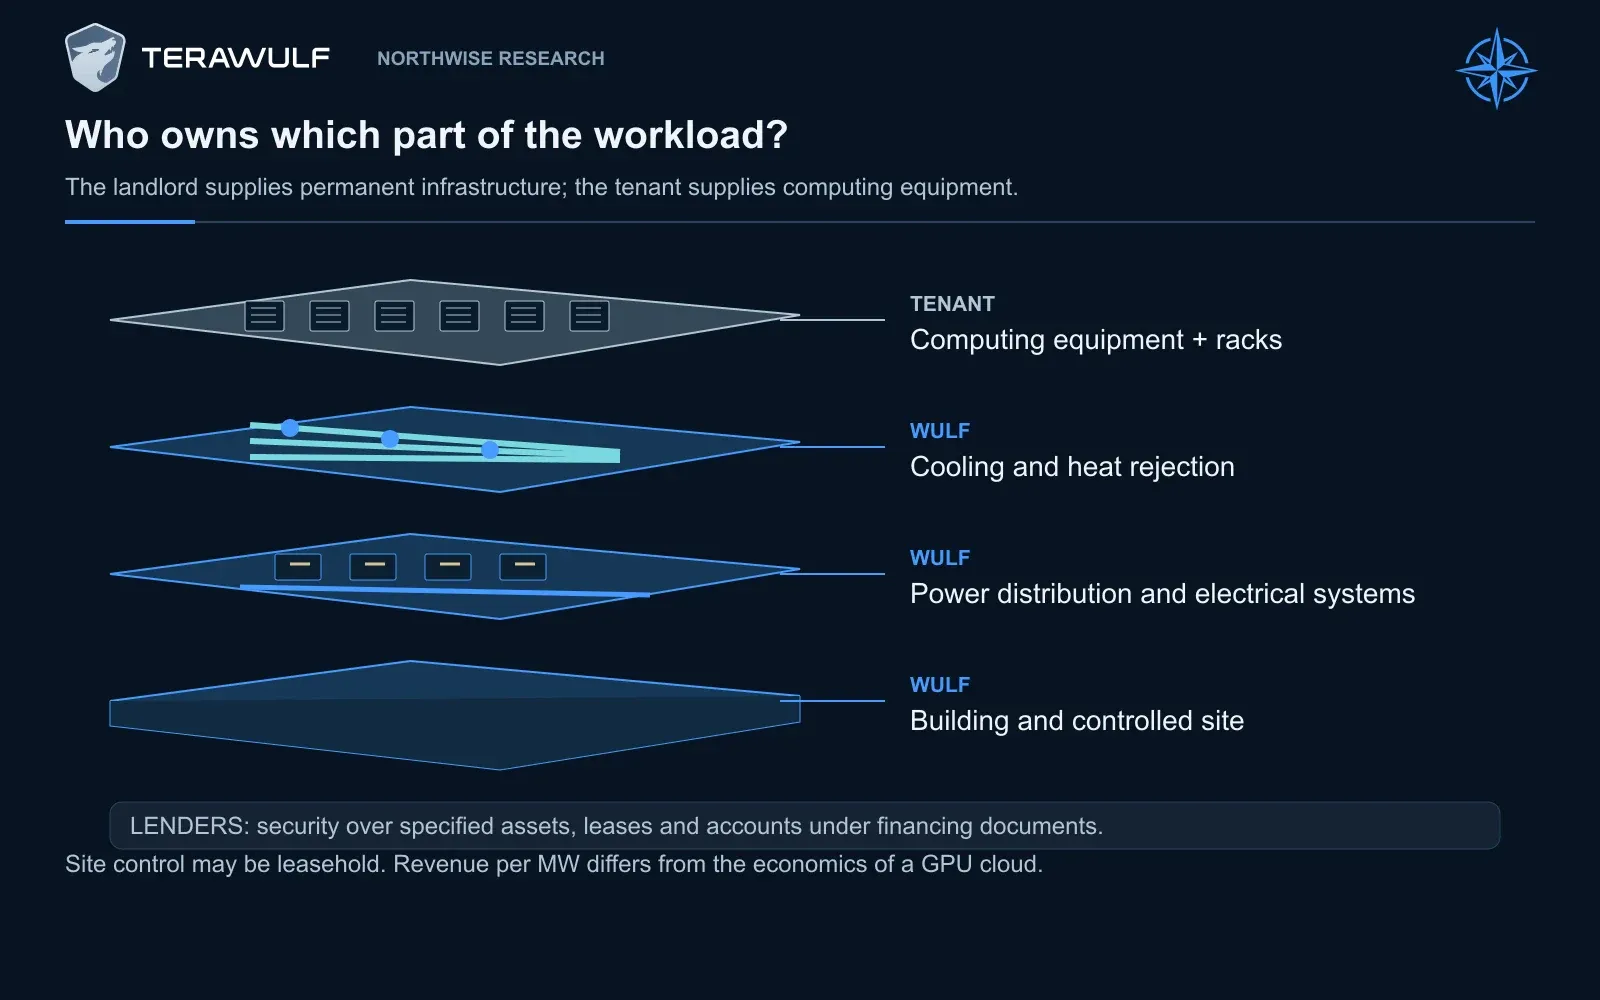
TeraWulf supplies the facility, electrical systems and cooling under its leases. Tenants supply computing equipment. Lenders have contractual security interests rather than an additional physical operating layer.
Capacity is expressed in megawatts because electrical demand is a major determinant of what the building can support. A megawatt measures power, not a number of servers or a quantity of AI output. “Critical IT capacity” refers to the power available to the computing equipment. The wider campus also needs electricity for cooling and other infrastructure, so a utility-service figure and a critical IT figure cannot be substituted for one another.
The rental arrangement gives WULF a narrower commercial exposure than a cloud provider selling computing services. Once an accepted hall is available under a fixed-rent lease, the tenant’s decision to use its servers less intensively does not automatically reduce the rental bill. WULF also avoids directly funding the tenant’s next generation of GPUs.
That protection is valuable, particularly for investors uncomfortable forecasting which chips or AI applications will remain competitive. It has limits. The customer must keep paying, WULF must perform its obligations, and a new generation of hardware can require changes to the building around it.
Khan discussed this on the first-quarter call. A long lease could span several hardware generations, with different electrical and cooling requirements. The company was already adapting designs for equipment from several suppliers, and even a six-month change in delivery could affect the hardware intended for a hall.
We therefore view WULF as an infrastructure developer with technology-sensitive customers, rather than a passive owner of generic warehouses. The permanent electrical assets can outlast the first servers installed inside them. Their useful commercial life still depends on whether the site can accommodate what customers need next.
Mining helped WULF establish its sites and operating experience. By the second quarter of 2026, HPC leasing accounted for approximately 71% of total revenue, and the company was repurposing parts of its mining footprint for the new business. Our forecast retains a transitional mining contribution in 2026 and 2027, then none from 2028 onward.
The relevant comparison with companies such as CoreWeave, Nebius or IREN consequently begins with responsibilities, not revenue per megawatt. A cloud operator may earn more revenue from the same electrical capacity because it owns the computing equipment and sells additional services. It also pays for those assets and bears their replacement risk. WULF earns less of the customer’s total computing spend, but commits capital to a different part of the installation.
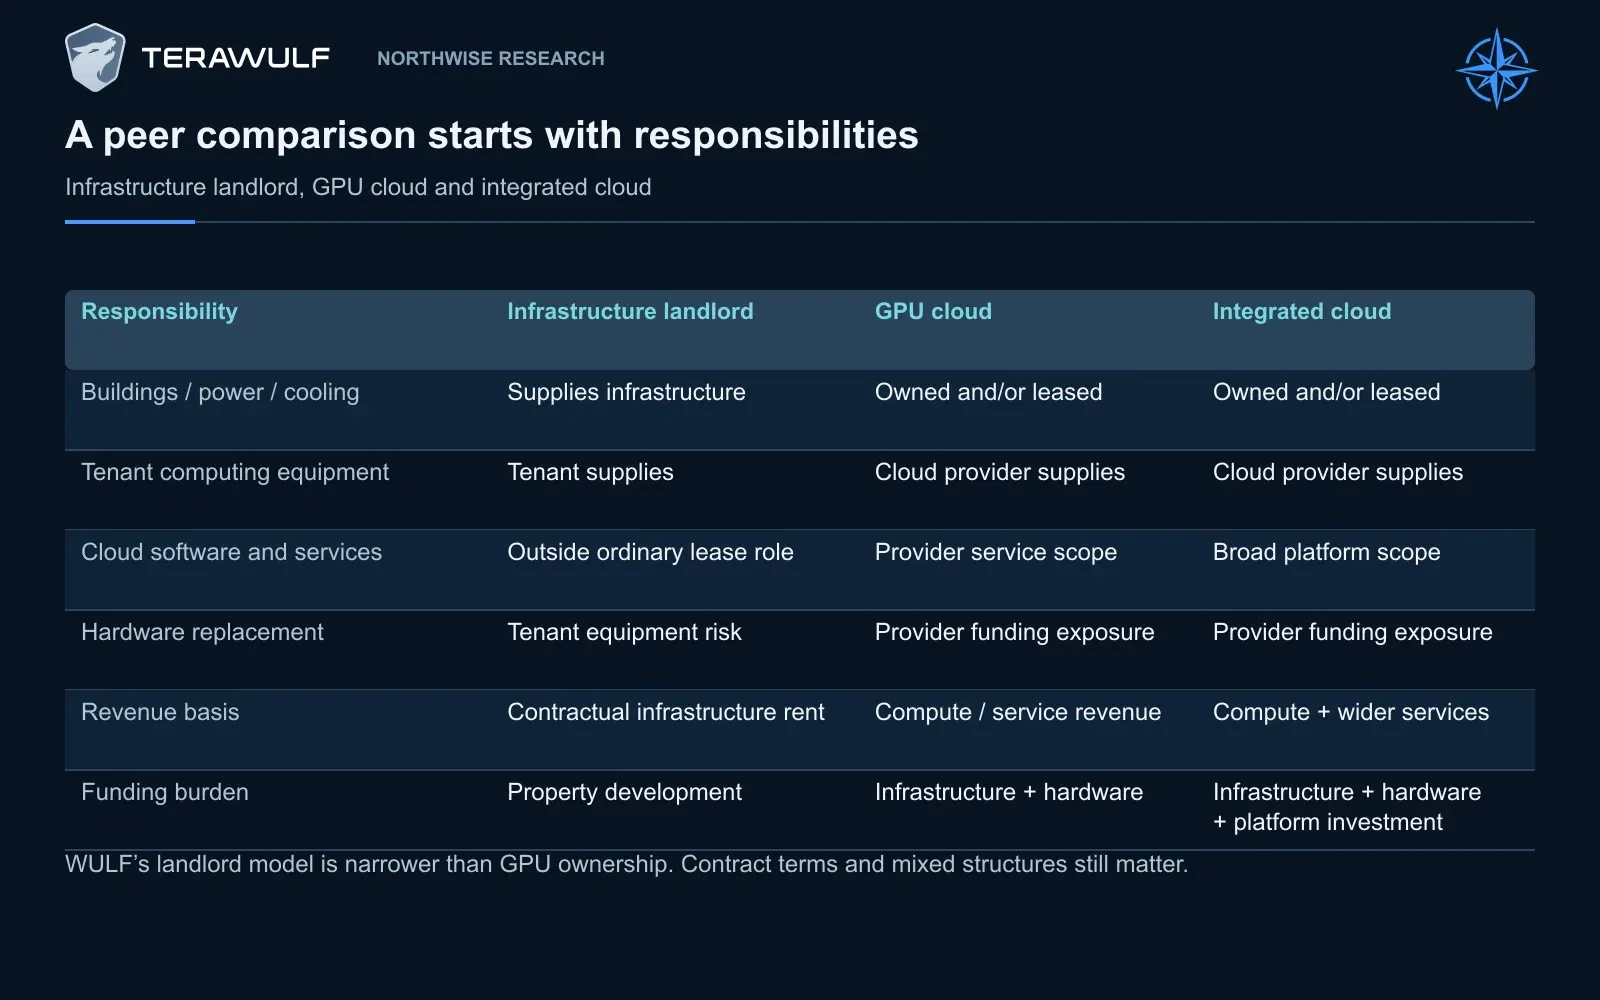
An infrastructure landlord, GPU-cloud provider and integrated cloud have different responsibilities for buildings, computing equipment, software and hardware replacement. Comparing reported revenue per megawatt without those distinctions can mislead.
2. Why AI customers are looking at old industrial sites
The AI expansion is making existing electrical infrastructure more valuable.
In its April 2026 outlook, the International Energy Agency estimated that worldwide data-center electricity consumption would rise from approximately 485 terawatt-hours in 2025 to 950 TWh in 2030. That would be around 3% of global electricity demand. The forecast is large enough to require considerable investment, but it does not imply that the world as a whole is running out of electricity. (IEA)
The difficulty is local. A customer needs a large, dependable supply at a particular place and within a commercially useful period. National generation statistics cannot establish whether the network serving that place can accommodate another major load. The IEA’s earlier research found that nearly half of U.S. data-center capacity was concentrated in five regional clusters, illustrating how a manageable national demand share can become a much harder regional problem. (IEA)
That helps explain the attraction of an old power station or aluminum facility. The previous industrial use may have left transmission connections, substations, land and a history of accommodating substantial electrical demand. Those assets can offer a head start over a site requiring an entirely new route to power. WULF’s acquisition of the former Hawesville industrial site included an energized substation, high-voltage transmission infrastructure and a direct connection to the regional network.
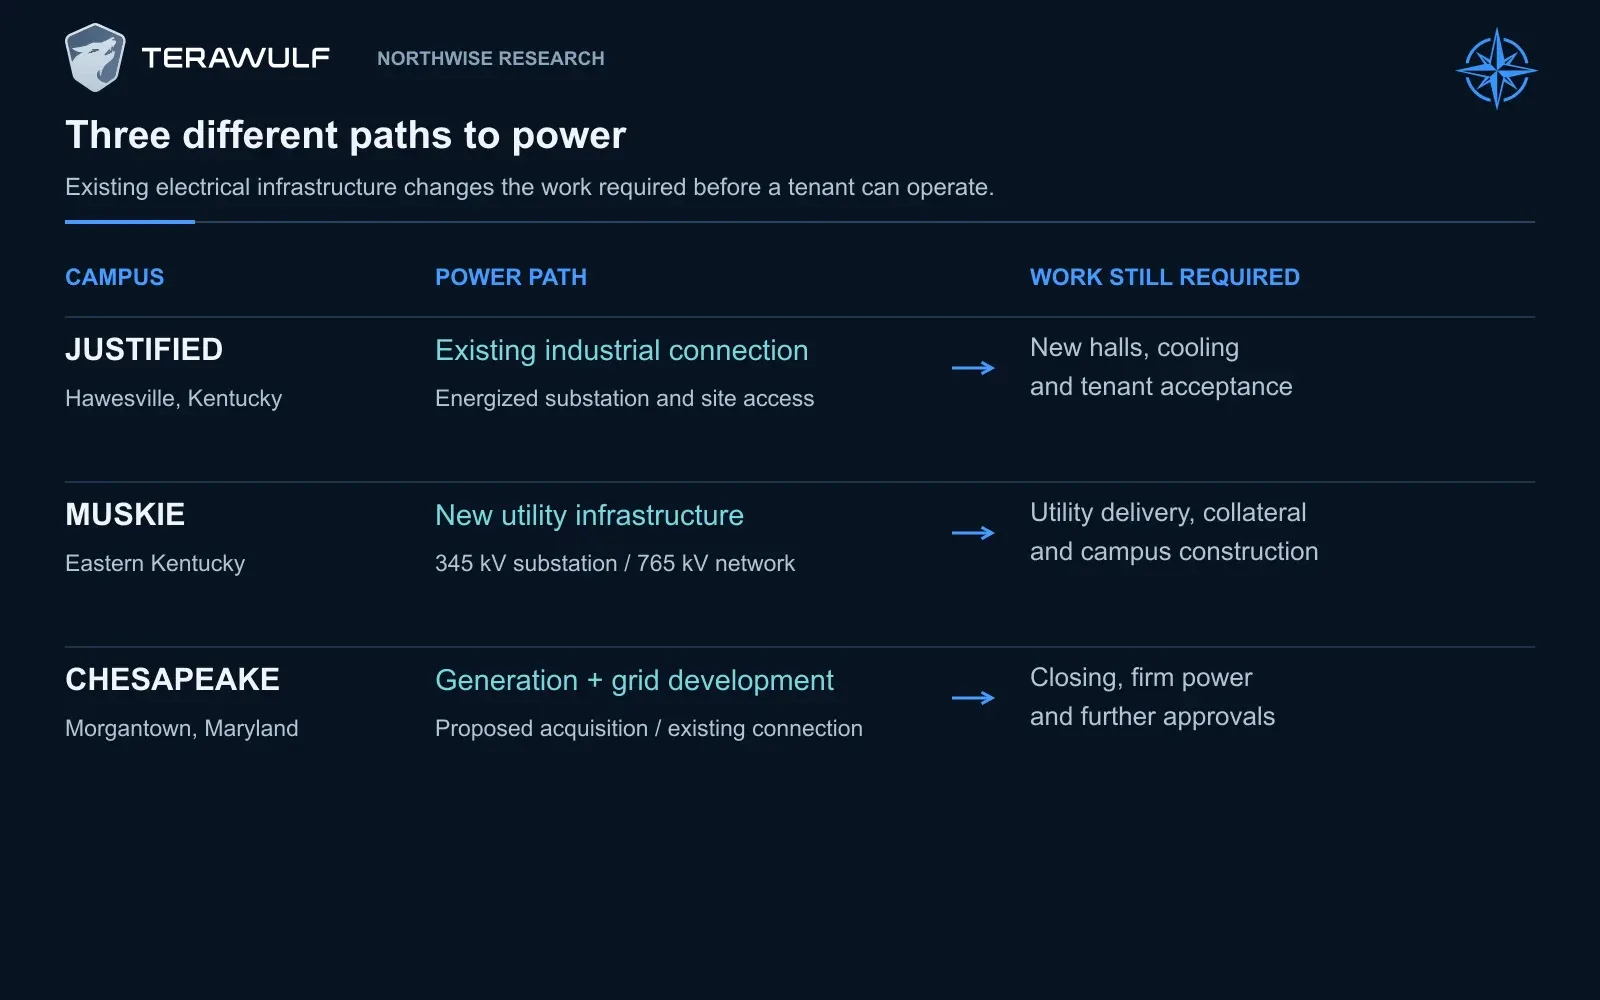
Justified reuses an industrial power site; Muskie relies on new utility infrastructure; Chesapeake remains a conditional generation-and-grid development. Each path requires different infrastructure and approvals.
The financial advantage comes from the time saved and the work avoided, not from the romance of industrial redevelopment. An old site can still need remediation, new equipment, substantial engineering and a different operating design. Its history is useful only where the inherited infrastructure serves the new customer.
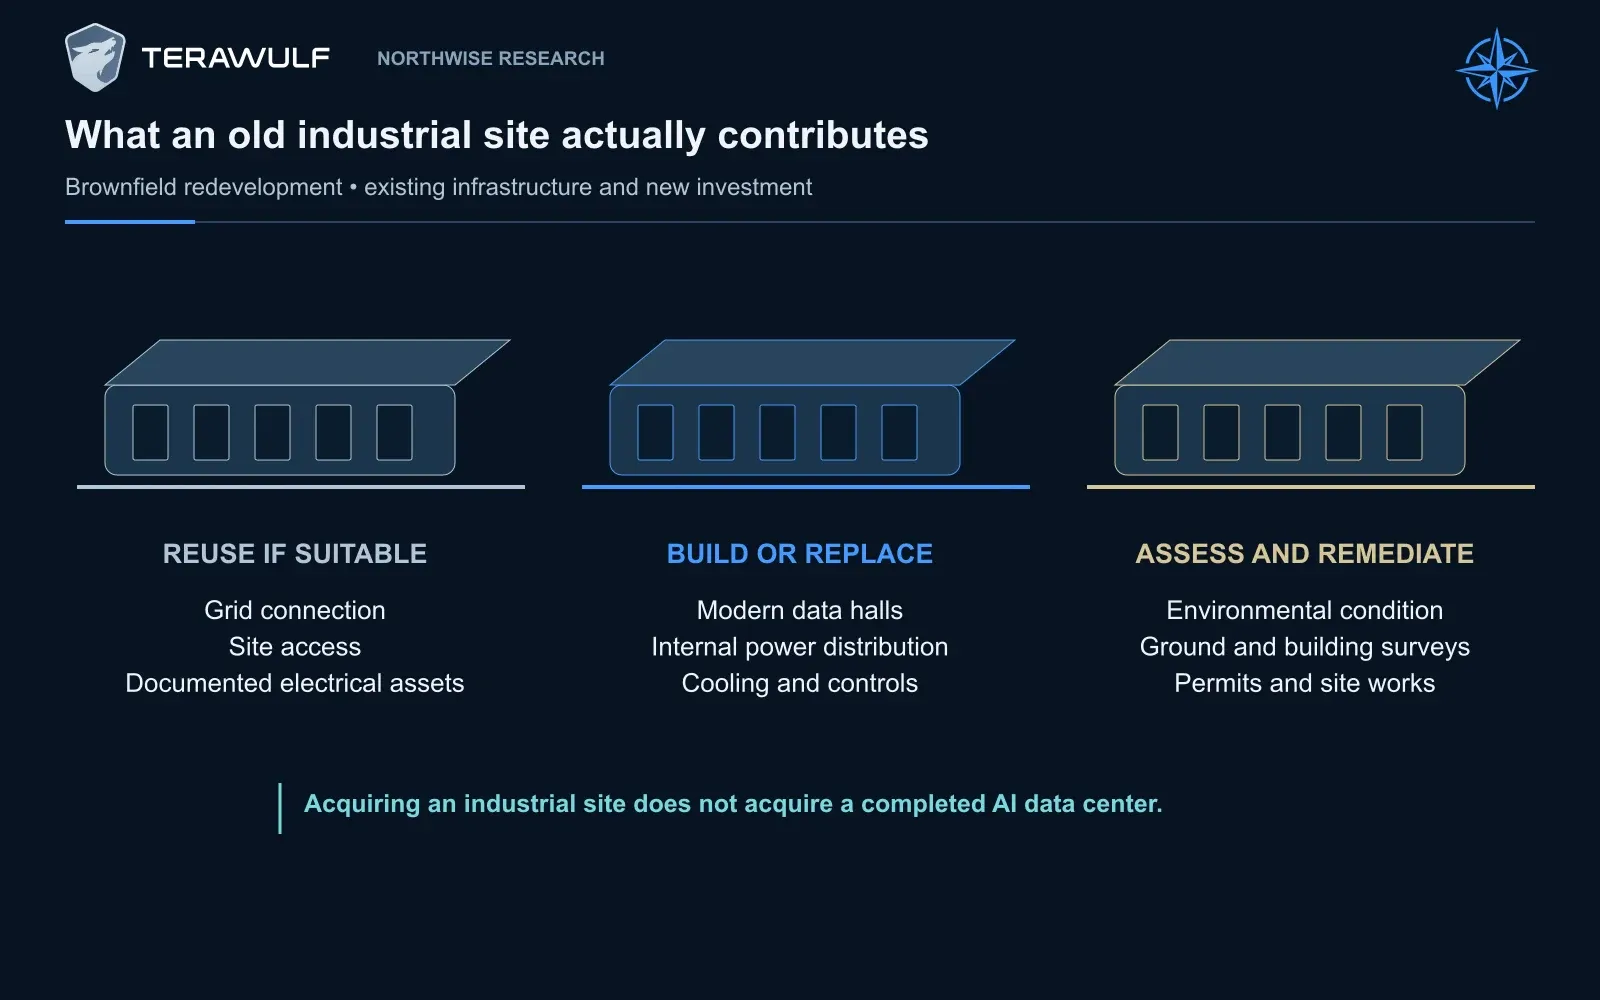
Industrial-site reuse can preserve useful grid connections and site access while requiring new halls, electrical distribution, cooling and remediation.
This also explains why a well-funded technology company might lease from a much smaller developer. Building internally remains an alternative, but money cannot retroactively complete a transmission study or create a construction workforce already familiar with the site. A customer may rationally pay an experienced developer to shorten the period before its computing equipment can operate.
We see that as WULF’s opportunity. The company is trying to make site selection, power arrangements and delivery repeatable across several regions. A completed campus should improve its credibility with the next customer and utility, provided the economics survive the work.
There is a less comfortable implication for the developer. The same urgency that supports rental demand can raise the cost of electrical labor, cooling equipment and construction. WULF’s roughly 1,000-electrician peak requirement at Lake Mariner is a company-specific example of that competition for resources. Strong demand appears on both sides of its project budget.
Longer term, we would resist underwriting permanent scarcity at today’s economics. Greater supply, changing customer architectures or more efficient hardware could weaken pricing for future leases even if total AI activity keeps growing. Conversely, lower computing costs can encourage more usage. The IEA describes falling energy use per AI task alongside adoption of more demanding reasoning, video and agentic workloads. Efficiency and total electricity demand need not move in opposite directions. (IEA)
For WULF, the consequence depends on timing. An existing fixed lease offers protection that an uncontracted development site does not. Our forecasts preserve that difference rather than applying one view of AI demand to every megawatt.
3. Lake Mariner: the construction becomes a business
Lake Mariner is the strongest operating evidence behind WULF’s ambition.
The retained contracted program consists of 60 critical IT MW for Core42 and 378 MW for Fluidstack. The latter includes 42 MW at CB-3 and 168 MW at each of CB-4 and CB-5. These figures already describe critical IT capacity, so they do not require another generic reduction from gross utility power.
The buildings enter service progressively. CB-3’s first hall reached ready-for-service status in late June, with the second following in mid-July. By the August earnings call, all 102 MW across Core42 and CB-3 were operating. Second-quarter HPC revenue rose to $31.9 million from $21.0 million in the first quarter, while total revenue increased from $34.0 million to $44.8 million.
Behind those figures was a process Khan explained in unusually practical terms. Major equipment is tested before shipment, then checked after installation. Individual systems are powered up and tested under operating conditions. The tenant brings in racks and integrates them with the hall’s power, cooling and controls. Functional performance testing then establishes the contractual delivery milestone described for CB-4.
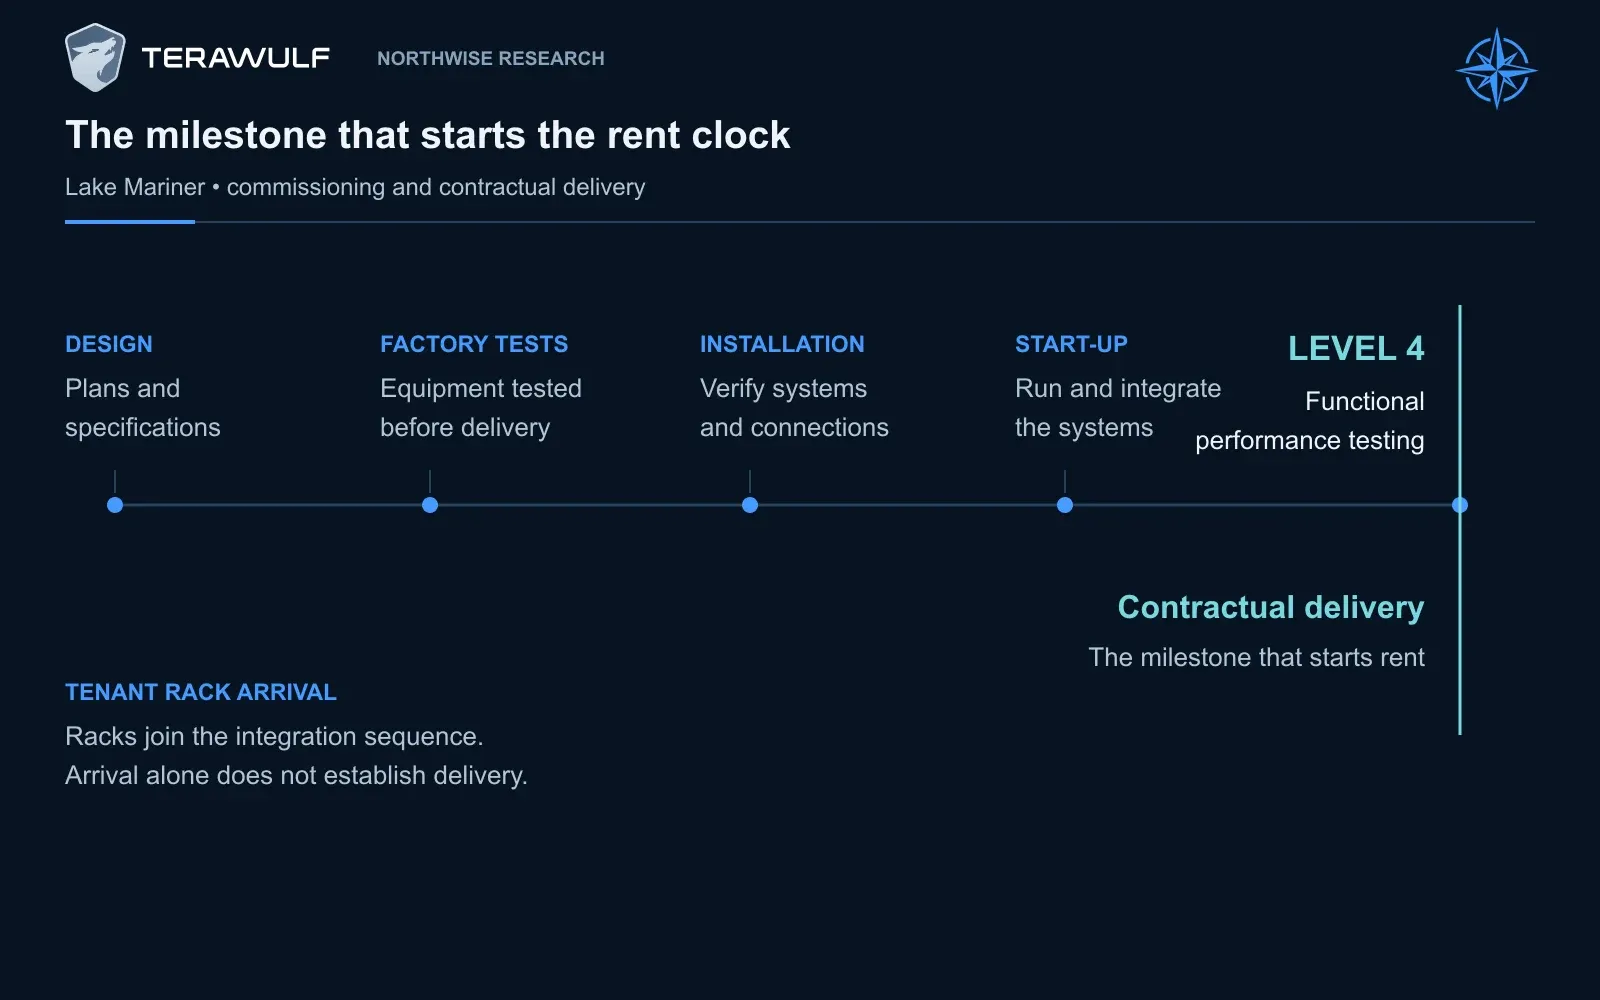
Commissioning progresses from planning and factory tests to installation checks, system start-up and functional performance testing. Level 4 was described as the contractual delivery milestone. Tenant rack arrival alone does not establish that milestone.
The sequence creates a period in which a hall looks close to finished, the customer’s equipment may already be arriving, and WULF is still paying to complete the work before rent begins. A construction photograph is useful evidence of progress. It does not establish the date or amount of the first collection.
Our Base forecast has CB-4’s four 42 MW halls beginning rent at the end of September, October, November and December 2026. CB-5 follows in mid-January, February, March and April 2027. These individual dates are Northwise assumptions built around management’s broader milestones of initial CB-4 delivery in late September and initial CB-5 energization in early January.
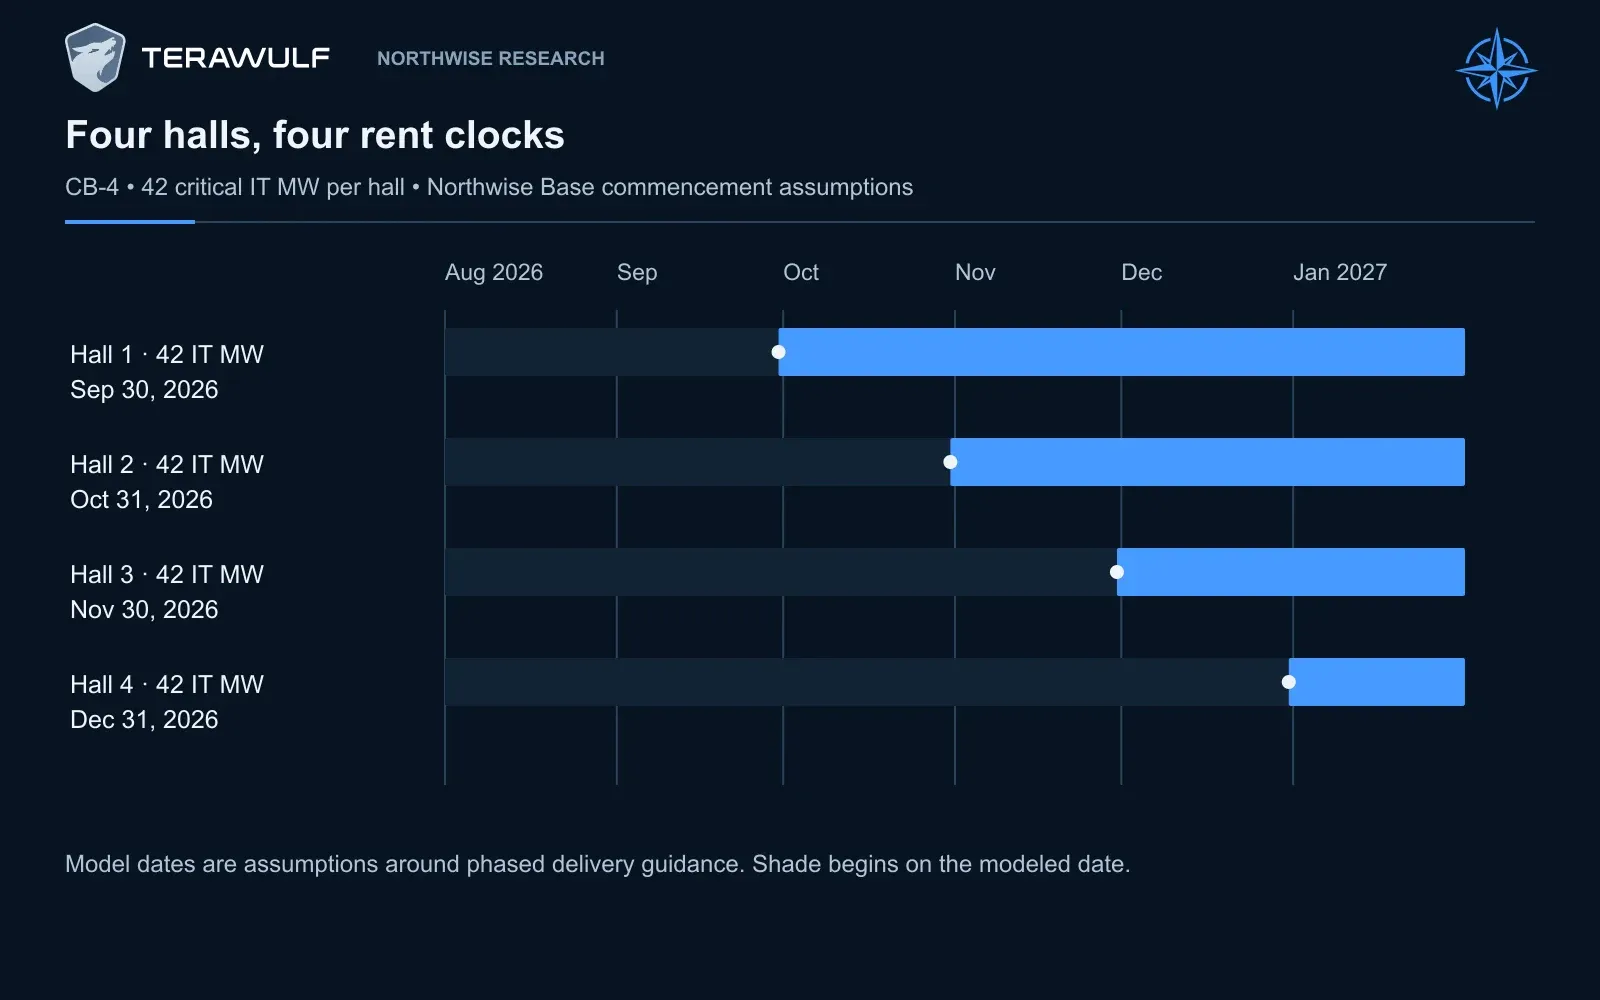
The Base model starts CB-4’s four 42 MW halls on September 30, October 31, November 30 and December 31, 2026. Each shaded lane starts at its own assumed rent date; year-end capacity does not represent a full year of rent.
The result is 270 MW operating at the end of 2026 and the full 438 MW during 2027. The December capacity contributes very little to the first year’s revenue, which is why the forecast follows the halls individually.
Customer changes have also altered the economics. WULF agreed to contribute approximately $150 million toward tenant fit-out costs incurred through June 2026. In return, the project expected more than $300 million of incremental lease revenue over the initial ten-year term. Combined with the expansion of CB-4 and CB-5, the amendments were expected to add more than $500 million of initial-term lease revenue.
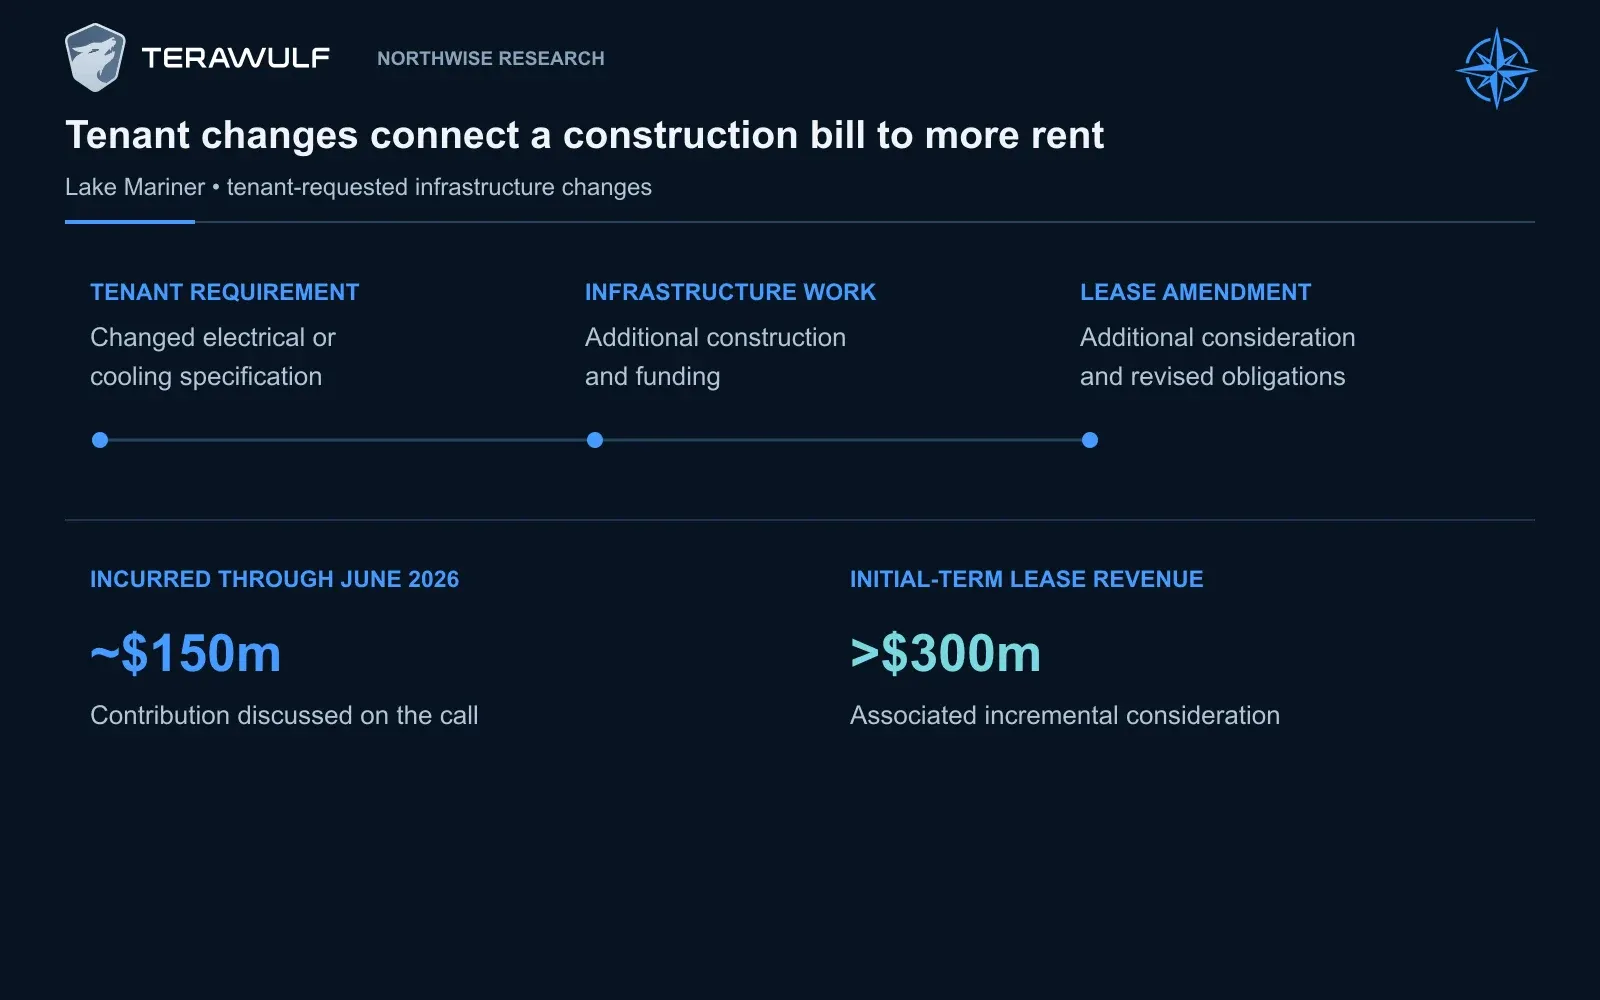
The approximately $150 million contribution incurred through June 2026 was associated with more than $300 million of incremental initial-term lease revenue.
We regard the rent adjustment as an encouraging sign that the customer and developer can preserve the commercial relationship as requirements evolve. The upfront contribution still has to be funded well before most of the associated revenue arrives. Its value depends on the payment schedule and the final cost, not merely on comparing $150 million with a larger nominal revenue figure.
Management estimated total WULF Compute project costs at approximately $9.1 million per critical IT MW, within its original $8 million to $10 million range. At June 30, approximately $1.7 billion of spending remained, around two-thirds already committed. Base uses that remaining expenditure; Bear allows $1.85 billion and Bull $1.65 billion.
As construction becomes more repeatable, WULF may gain better visibility into labor requirements and procurement. That would support the favorable case. For the current buildings, however, commitments already made mean that delaying delivery is unlikely to defer every corresponding cash payment.
4. Justified and the opportunity in Kentucky
The Justified campus in Hawesville provides a second test of the development strategy, on a much larger contract.
Anthropic, an AI model developer, has leased approximately 401 critical IT MW for an initial twenty years. The agreement represents roughly $19 billion of nominal revenue, with phased delivery expected to begin in the second half of 2027 and finish in early 2028.
The former aluminum site gives WULF a substantial electrical starting point. On August 24, the company announced approval of an electric-service agreement supporting up to 482 MW. It also estimated $4.0 billion to $4.5 billion of investment in site development and the initial halls, based on $10 million to $12 million per critical IT MW, excluding the customer’s computing equipment. (TeraWulf Inc.)
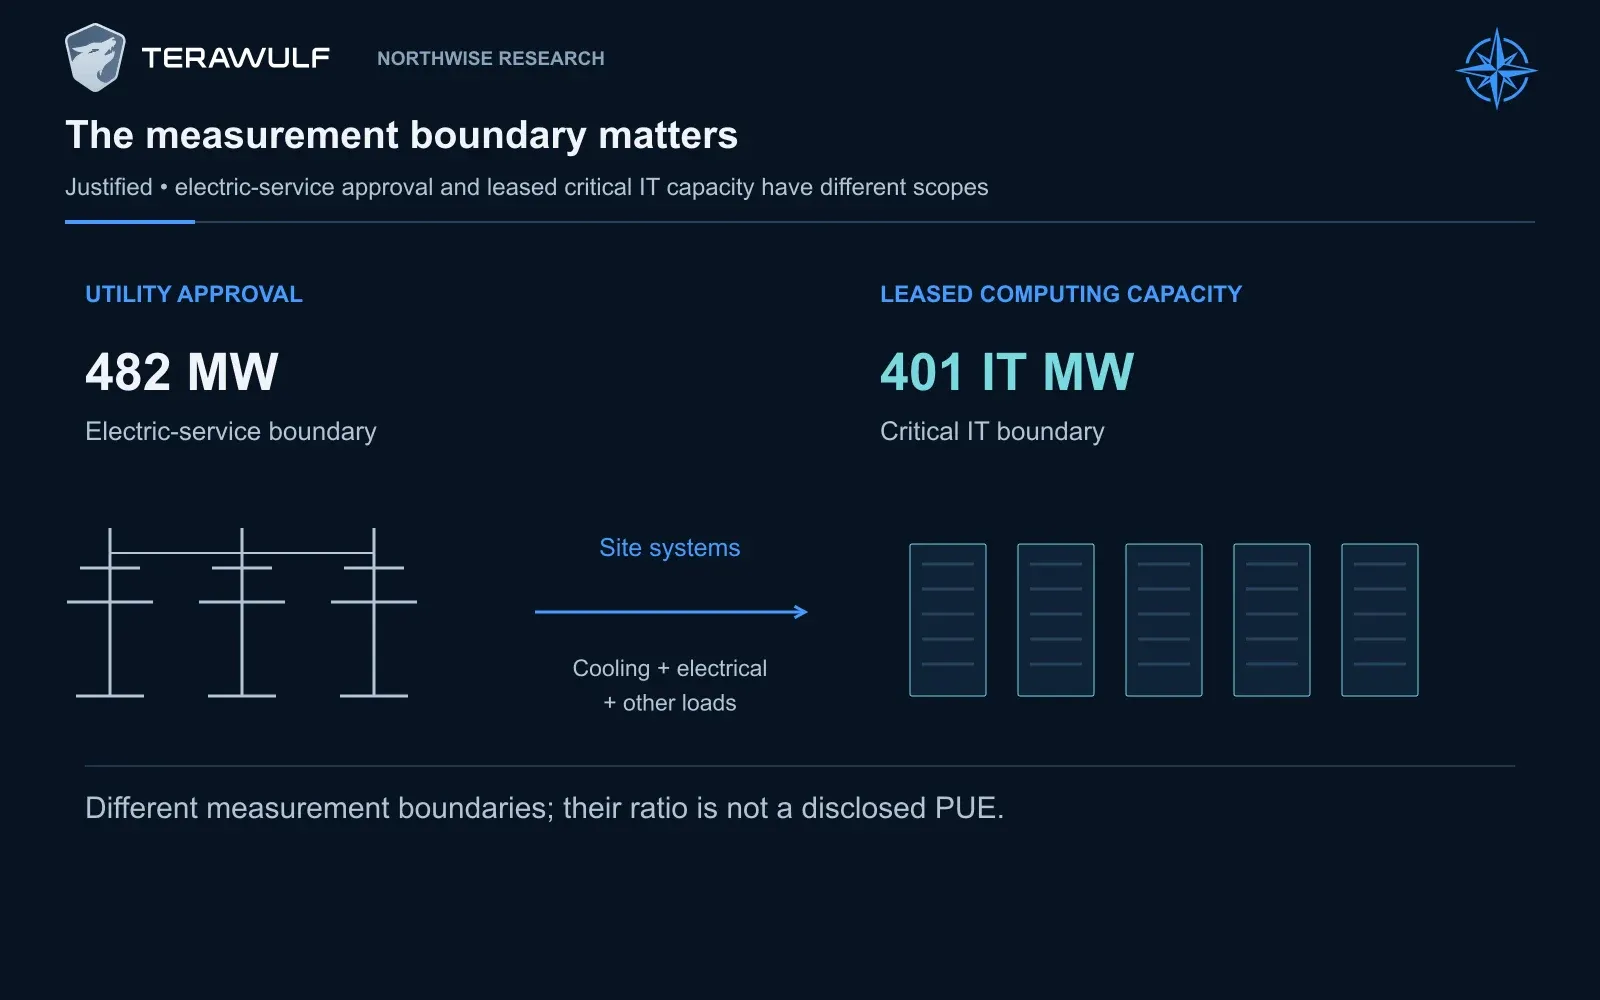
Justified’s 482 MW electric-service approval and 401 MW critical IT lease measure different things. Their ratio is not a reported site PUE, and the difference should not be labeled measured operating losses.
The 482 MW utility agreement and 401 MW tenant lease measure different requirements. The space between them should not be presented as observed operating losses, nor should the utility approval be treated as another 482 MW of leased capacity.
More important economically, the approved arrangement assigns the costs attributable to WULF’s load to the company, including customer-specific infrastructure and credit support. Existing ratepayers are not meant to become the default source of funding for the new campus. (TeraWulf Inc.)
That is how the public debate over AI’s electricity needs reaches a shareholder forecast. A utility can welcome a large new customer and still require protection against the customer arriving late, consuming less than planned or leaving an expensive investment unsupported. The developer’s lease and financing must accommodate those obligations.
We think this is preferable to relying on an indefinitely permissive regulatory environment. Clear cost responsibility can make a project more durable politically and financially. It can also require more cash at the beginning. Our assessment of a power agreement therefore includes the collateral and minimum-payment commitments, not just the capacity.
Base assigns Justified a direct development budget of $4.31 billion, or $10.75 million per critical IT MW. The $353 million already invested by June 30 is included in that total, not added again as future spending. Bear raises the budget to approximately $4.81 billion, above the company’s current aggregate range, while Bull uses $4.01 billion.
The Base schedule delivers 100 MW in September 2027, another 100 MW in November, 100 MW in January 2028 and 101 MW in March. Bear begins in 2028 and completes the initial campus in 2029. Bull reaches 300 MW during 2027 and finishes in January 2028.
Financing remains a separate requirement. At the August call, management expected investment-grade credit support and project borrowing for Justified. Our forecast assigns terms to that future financing rather than treating the expectation as cash already committed.
5. Muskie: a utility partnership with a large bill attached
Farther east in Kentucky, Muskie is where much of our forecast moves beyond signed tenant contracts.
The development is being pursued with Kentucky Power, an AEP company. Its infrastructure plan includes a new 345-kilovolt substation connected to the existing 765-kilovolt transmission network. The initial electric-service agreement covers up to 500 MW, while the related transmission arrangement is designed to support a 1,000 MW campus.
Management has discussed a broader expansion ambition, including potential capacity beyond that initial framework. We keep those descriptions separate from the contractual categories. The utility relationship gives Muskie more substance than an undeveloped parcel with a queue position, but it does not make every prospective expansion equally certain.
Initial electricity service is expected in the fourth quarter of 2028. Under the disclosed agreement, service obligations can begin when the relevant transmission and generation are available, even if the campus has not yet reached its expected consumption. Minimum charges are tied to contracted capacity.
That provision creates a scheduling problem worth taking seriously. The utility has to invest ahead of demand, so it seeks a dependable commitment. WULF then needs its tenant delivery and collections to fit the power schedule. A building delay could leave the developer paying for an electrical service that has not yet produced the expected rent.
Our Base case assumes the full gross-power development supports 800 critical IT MW by December 2030. The first 100 MW begins in December 2028. Three more 100 MW blocks enter service during 2029, followed by 200 MW in July and another 200 MW in October 2030.
The terminal capacity is 800 MW, but the average operating capacity during 2030 is 550 MW. Much of the full earnings contribution is still ahead at the valuation date.
Bear develops 400 critical IT MW. Bull reaches 1,000 MW, requiring additional gross power beyond the initial 1 GW framework under our assumptions. Bull is receiving credit for another development achievement, not merely using capacity already available.
There is also a substantial early cash requirement. WULF posted approximately $295.3 million in July to collateralize externally issued Muskie letters of credit. Further requirements precede full operation. That cash remains an asset, but it is not available to fund another campus while securing the utility commitments.
Muskie is a credible source of expansion. It is also a clear example of why the development opportunity and the funding requirement grow together.
6. The remaining development portfolio
WULF’s other locations provide choices rather than one uniform block of future capacity.
Additional Lake Mariner development benefits from an operating site and experience with its customers. Base adds 100 critical IT MW in July 2028 and another 100 MW in April 2029. These assumed future leases sit outside the retained 438 MW program.
Lake Hawkeye, associated with the Cayuga site in New York, is earlier in its development. Management’s first-quarter discussion described questions from the local planning process concerning noise, security, fire protection and traffic. The company was also coordinating around other proposed uses of the lakefront site.
Those questions deserve a place in the investment analysis. A community experiencing construction traffic, noise and pressure on local services does not evaluate a project through the tenant’s AI ambitions. A developer that answers the concerns well may create a more durable path to expansion. Assuming that approval is merely an administrative formality would understate the work.
Base includes 160 critical IT MW at Lake Hawkeye in July 2029 and another 160 MW in July 2030. Bull delivers 320 MW in 2029. Bear has no operating contribution through the endpoint. The larger outcomes remain conditional on the necessary power, permitting, customer and financing milestones.
Chesapeake presents a different set of requirements. The Morgantown site in Maryland includes approximately 210 MW of existing grid-connected generation and substantial electrical infrastructure. FERC authorized WULF’s proposed acquisition on July 29, clearing an important condition, while the company still identified remaining closing conditions and consents on the August call.
Our Base forecast includes 200 critical IT MW there in October 2030; Bull includes 400 MW in July. We do not assume that the existing generation alone can continuously serve the proposed campus. The forecast requires additional firm supply or an appropriate generation arrangement and carries a higher infrastructure-cost allowance. It includes neither an invented merchant-generation profit stream nor a separately owned new power fleet without its capital costs.
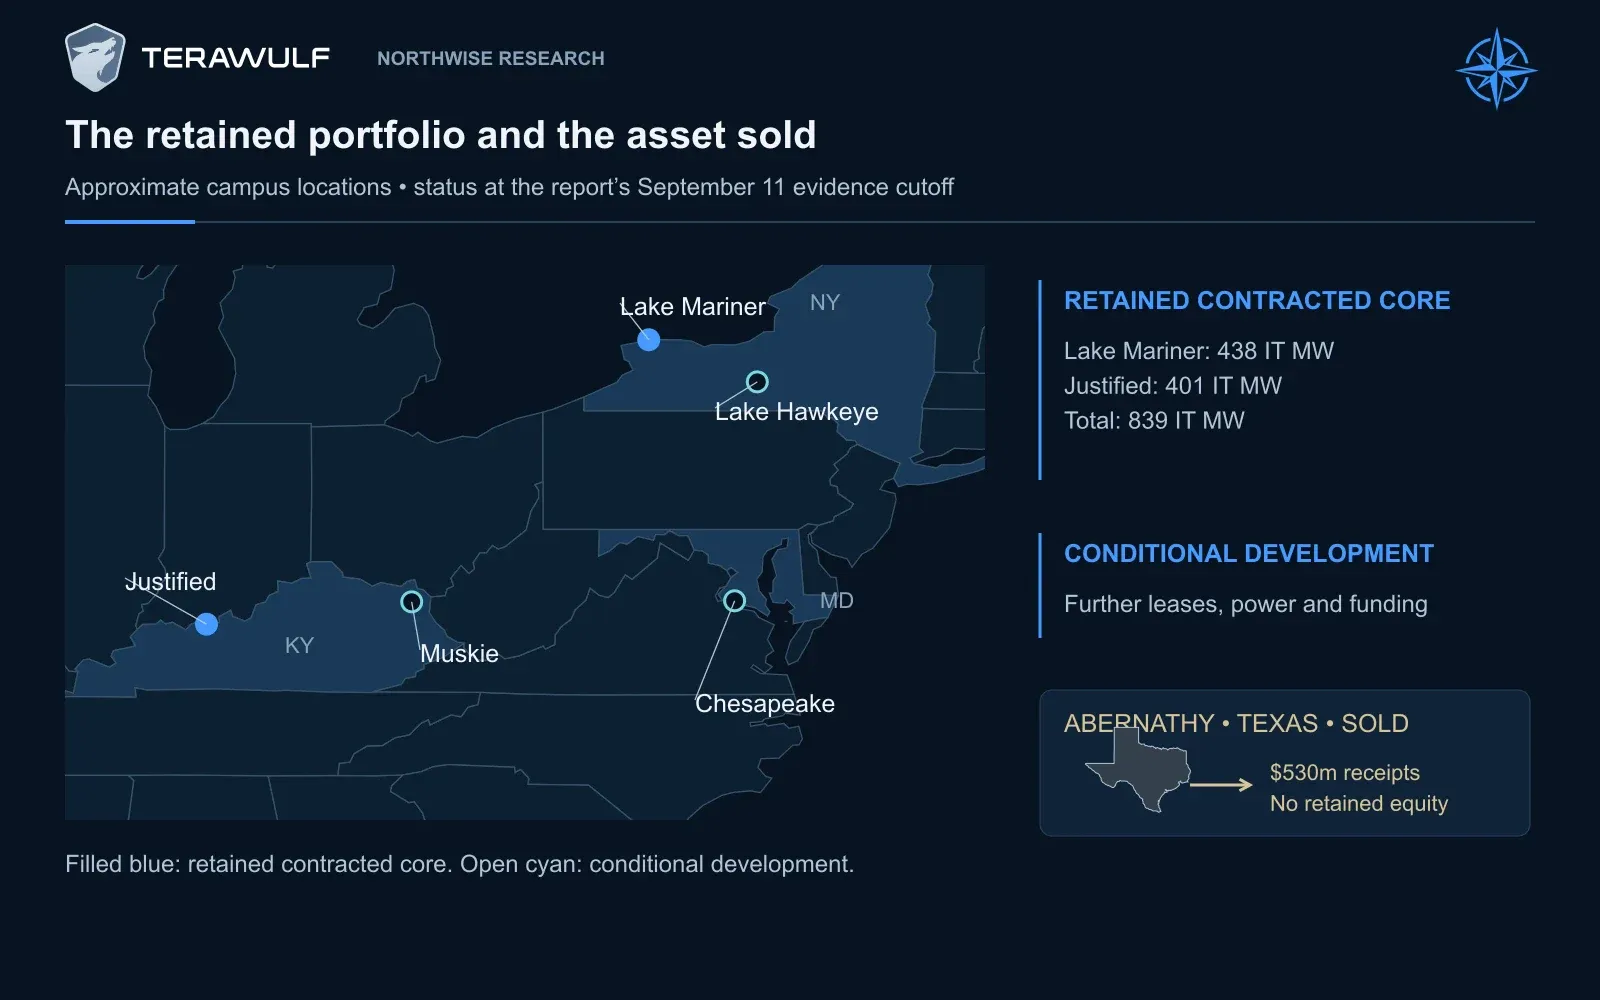
The map locates Lake Mariner and Lake Hawkeye in New York, Justified and Muskie in Kentucky, and Chesapeake in Maryland. Abernathy appears in a separate Texas inset as a disposed interest with sale receipts, not retained operating capacity.
Management has described behind-the-meter generation, where power is produced near the customer rather than delivered exclusively through the wider grid, primarily as a bridge toward utility-supported campuses. That is a more considered position than assuming that installing gas equipment allows a developer to avoid the grid permanently.
We assign no operating value to an unnamed Northern European opportunity. There is sufficient growth in the identified portfolio without capitalizing an international ambition before its assets and economics are established.
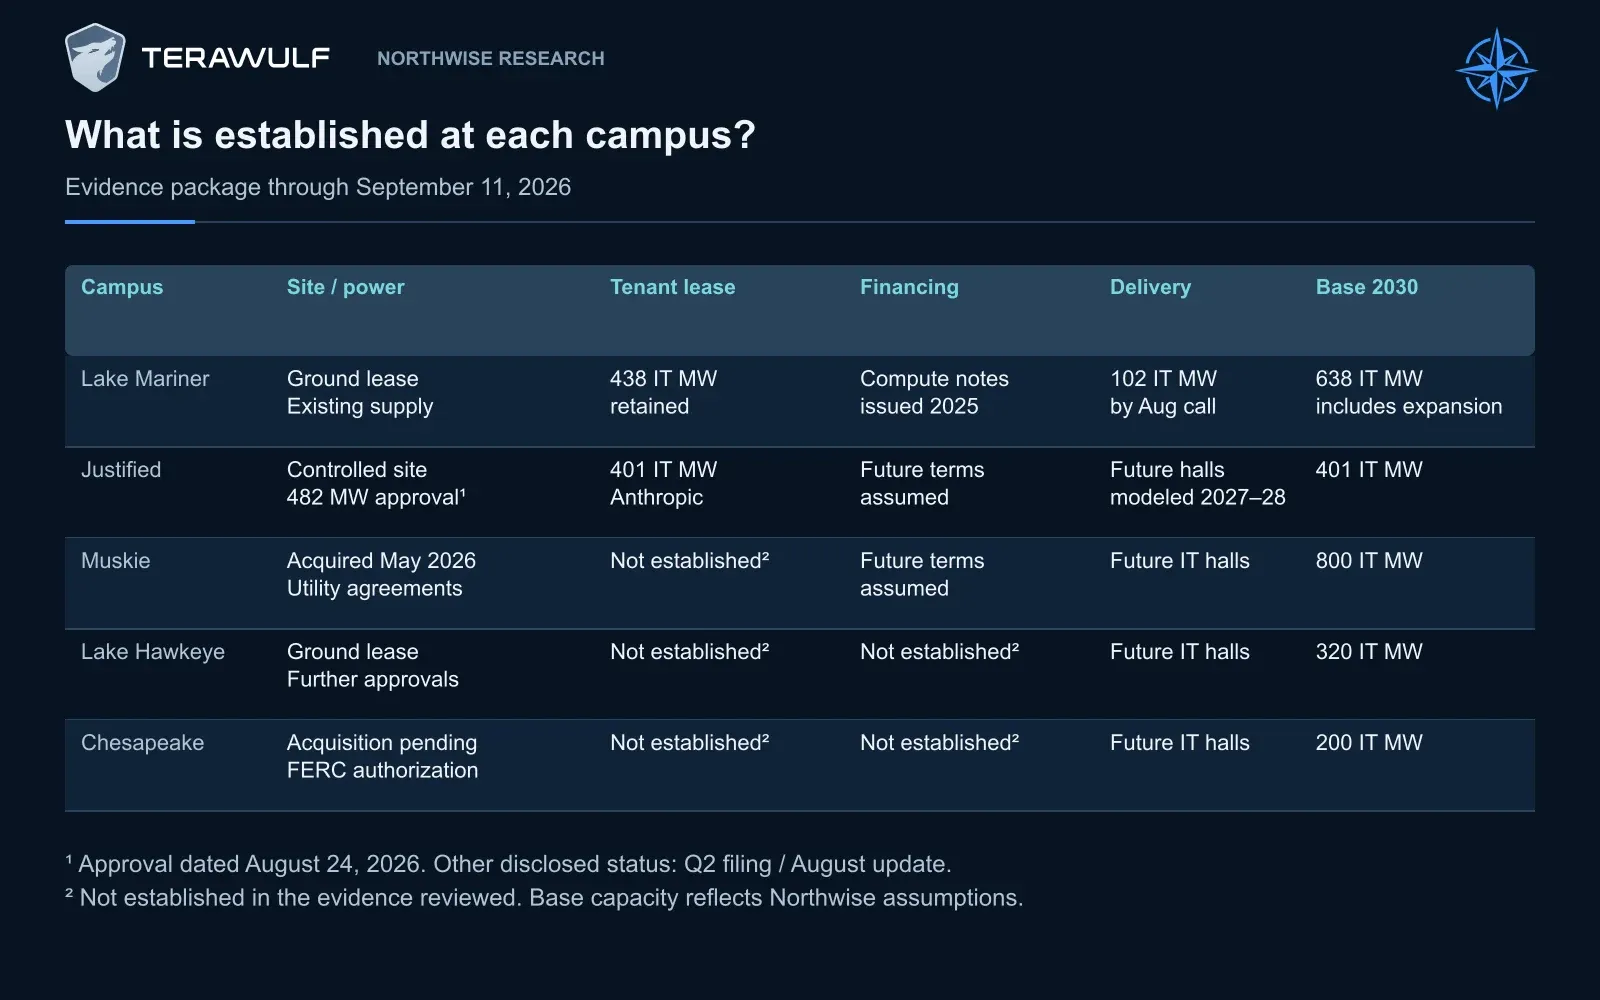
This evidence matrix distinguishes site control, power, leases, financing and delivery. “Not established” means not established in this evidence package; it does not prove an arrangement is absent.
7. Why selling Abernathy was a serious strategic decision
WULF does not have to retain every project to create value from its development work.
The company sold its entire 50.1% interest in the Abernathy joint venture effective July 6, 2026, for approximately $530 million. The payment schedule included $250 million shortly after the effective date, $150 million by year-end 2026 and approximately $130 million by April 30, 2027, subject to the agreement’s adjustments.
Our forecast receives $400 million in the second half of 2026 and $130 million in 2027. Abernathy contributes no future operating earnings, distributions or retained asset value.
Management reported a 20% investment IRR and explained that it preferred to concentrate capital and attention on larger projects it directly controlled. The return is management’s reported calculation. The strategic choice is independently important: WULF exchanged future participation in a campus for cash and the capacity to pursue other developments.
For existing shareholders, that can be a better decision than raising more common equity to own everything. It depends on the sale price relative to the economics surrendered and on the return available from redeploying the proceeds.
Our central forecasts assume no additional campus sales, new outside minority investors or extra customer prepayments beyond the arrangements specifically included. They therefore represent a largely retained-ownership strategy. The substantial common-equity requirements later in the report should be read in that context.
Further sales could reduce issuance materially. We would welcome them where the price is attractive, but would remove the future cash flows sold. Capital recycling changes both the source of funding and the business that remains.
8. The capacity forecast through 2030
The Base development path reaches six operating campus or expansion blocks by the end of the decade.
Year-end critical IT MW | 2026 | 2027 | 2028 | 2029 | 2030 |
|---|---|---|---|---|---|
Lake Mariner: retained contracts | 270 | 438 | 438 | 438 | 438 |
Lake Mariner: expansion | 0 | 0 | 100 | 200 | 200 |
Justified: initial Anthropic campus | 0 | 200 | 401 | 401 | 401 |
Muskie | 0 | 0 | 100 | 400 | 800 |
Lake Hawkeye | 0 | 0 | 0 | 160 | 320 |
Chesapeake | 0 | 0 | 0 | 0 | 200 |
Total | 270 | 638 | 1,039 | 1,599 | 2,359 |
Source: Northwise forecasts. Expansion outside the retained contracts requires further commercial, power, construction and financing milestones.
Bear and Bull make different development choices rather than applying a percentage adjustment to every campus.
December 2030 critical IT MW | Bear | Base | Bull |
|---|---|---|---|
Lake Mariner: retained contracts | 438 | 438 | 438 |
Lake Mariner: expansion | 100 | 200 | 200 |
Justified: initial campus | 401 | 401 | 401 |
Justified: additional expansion | 0 | 0 | 200 |
Muskie | 400 | 800 | 1,000 |
Lake Hawkeye | 0 | 320 | 320 |
Chesapeake | 0 | 200 | 400 |
Total | 1,339 | 2,359 | 2,959 |
All three eventually complete the 839 MW retained contracted portfolio. Bear then adds another 500 MW, Base adds 1,520 MW and Bull adds 2,120 MW.
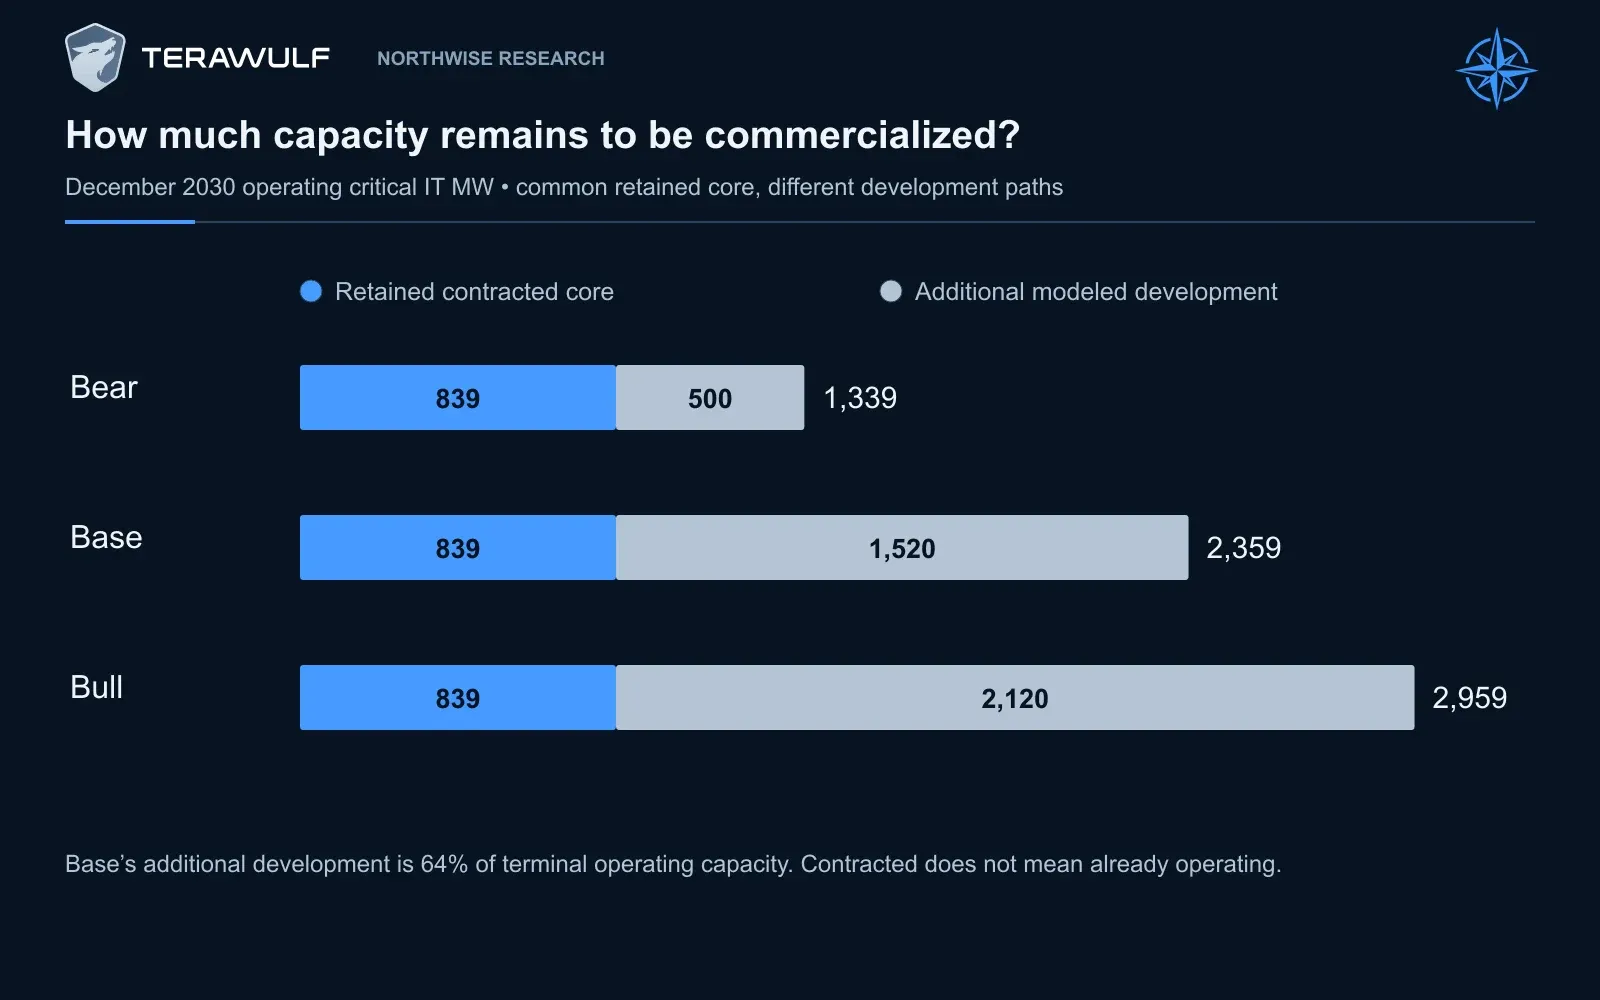
All scenarios eventually complete the 839 MW retained contracted core. Bear adds 500 MW, Base 1,520 MW and Bull 2,120 MW of modeled development. Base therefore requires substantial commercialization beyond existing contracts.
Base is therefore already ambitious. Approximately 64% of its terminal operating capacity comes from additional commercialization beyond the retained contracts. Management’s current target is 250–500 MW of incremental critical IT contracting annually, and the August call emphasized the resources required to support that pace. Our larger outcomes assume that the company’s commercial and organizational capacity expands.
The annual revenue forecast accounts for the month in which each block begins earning. Base ends 2030 with 2,359 MW but averages 1,879 MW during the year. A substantial amount of capacity completed near the endpoint has not yet contributed twelve months of rent.
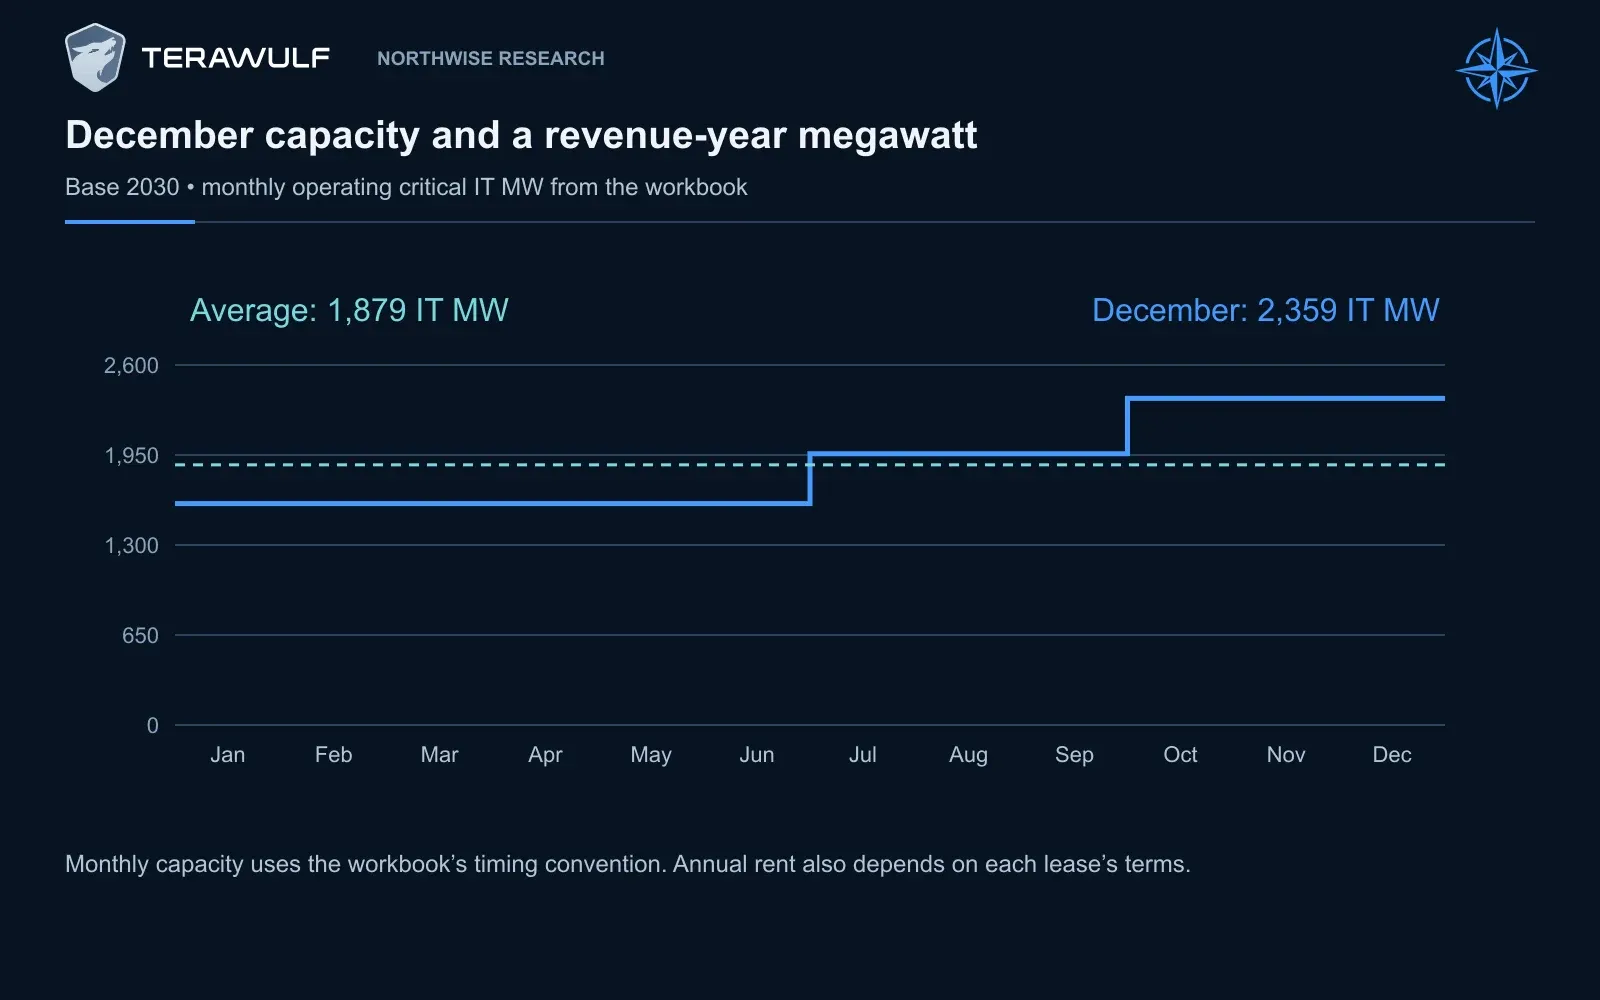
Base ends 2030 with 2,359 IT MW but averages 1,879 operating IT MW during the year. The monthly capacity path shows why late deliveries add less annual rent; the difference is timing, not idle capacity.
That timing also affects interpretation of free cash flow. A company finishing a large development program can have negative annual cash flow while holding valuable completed and nearly completed assets. The task is to distinguish that investment period from a property that remains uneconomic after it is operating.
9. What a twenty-year contract pays in its first year
Justified’s approximately $19 billion contract is an unusually large commercial commitment. It is not a disclosed schedule of equal annual cash receipts.
Dividing $19 billion by twenty gives $950 million. If the rent rises over time, starting cash rent will be lower. That changes the amount available for early debt service even when the total nominal contract value stays the same.
We assume the $19 billion represents fixed initial-term lease consideration and use a 3% annual escalator:
Starting annual rent = $19,000m ÷ Σₙ₌₀¹⁹ (1.03)ⁿ ≈ $707.1m
At full delivery, that is approximately $1.763 million per critical IT MW in the first lease year.
The complete private payment schedule is not disclosed in the research underlying the forecast. The escalation and composition of the headline are therefore explicit Northwise assumptions. Their importance is visible in a simple comparison:
Assumed annual escalation | Implied starting annual rent |
|---|---|
0% | $950 million |
2% | $782 million |
3% | $707 million |
4% | $638 million |
These are alternative mathematical payment schedules, not alternative terms reported by the company.
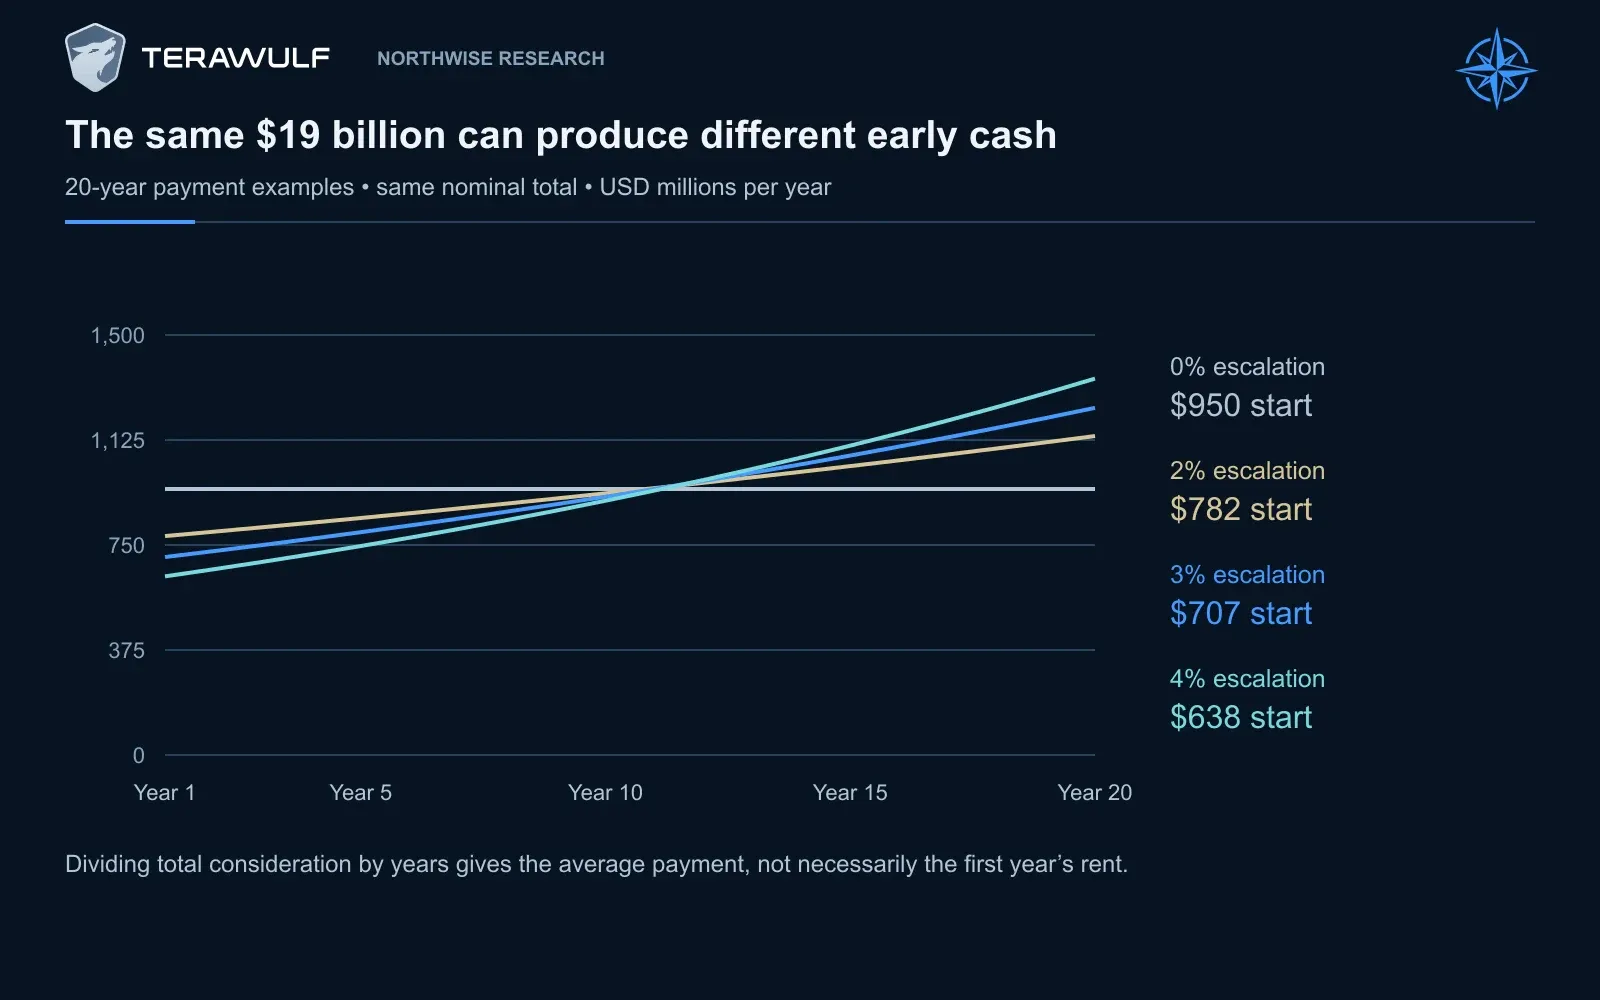
Payment schedules totaling $19 billion over 20 years start at about $950m with no escalation, $782m at 2%, $707m at 3% and $638m at 4%. The private cash-rent schedule is not disclosed; 3% is Northwise’s assumption.
The remaining rental assumptions are:
Program | Initial term used | Starting annual rent per critical IT MW | Annual escalation |
|---|---|---|---|
Core42 | 10 years | $1.500m | 3% |
Fluidstack at Lake Mariner | 10 years | $1.662m | 3% |
Anthropic at Justified | 20 years | $1.763m | 3% |
Future development: Bear | 15 years | $1.900m reference rate | 3% |
Future development: Base | 15 years | $1.850m reference rate | 3% |
Future development: Bull | 15 years | $2.050m reference rate | 3% |
Future-development reference rents are expressed at 2027 pricing and increase 2% for later delivery vintages. Existing contracts are not repriced to newer rates.
Fluidstack’s amended fixed consideration is reconstructed at approximately $7.2 billion over the initial ten-year terms. Core42’s starting rent is also an assumption rather than a claim to possess its complete amended rent roll. The disclosed amendments support changes to rent, capacity and commencement; they do not disclose every component of our forecast schedule.
Bear’s future-project reference rent is slightly higher than Base because it develops fewer, selectively priced projects later. Its construction costs and financing terms are worse, producing a weaker overall result despite that pricing assumption.
Customer credit belongs in the same discussion. A large, dependable tenant can support financing that a smaller buyer cannot. The landlord may prefer a somewhat lower rent if the associated credit terms reduce the total capital required. Maximizing nominal rent is not necessarily the same as maximizing the project’s value.
Google’s support for specified Fluidstack obligations is relevant for this reason. Delivery of CB-3 activated $600 million of that support under the conditions described by management. It improves the project’s credit position; it is not an unconditional guarantee of WULF’s common-share return or every future lease.
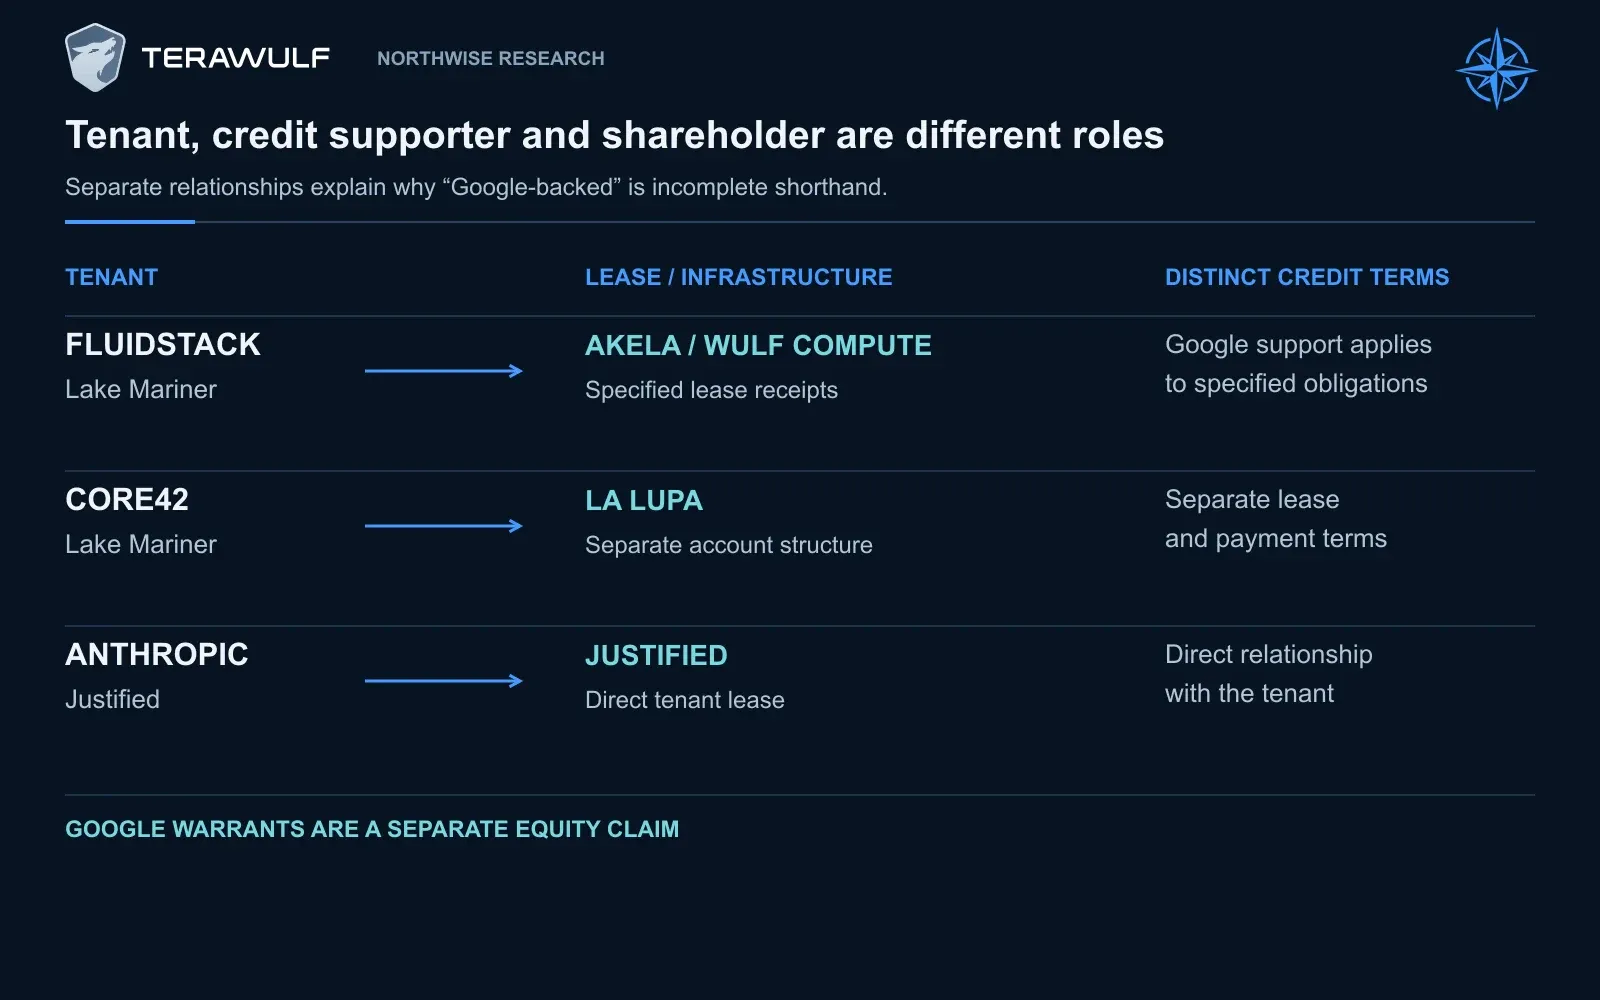
Fluidstack pays rent at Lake Mariner, with specified Google credit support. Google also holds equity-linked warrants. Core42’s lease and Anthropic’s direct Justified lease have separate terms.
10. The economics of the next 100 megawatts
At our Base assumptions, a new 100 critical IT MW development costs $1.075 billion directly and begins with approximately $185 million of annual rent. An 85% property cash operating margin leaves roughly $157 million before maintenance, financing, taxes and corporate expenses.
The initial property-income yield on direct development cost is about 14.6%. That is a commercially interesting starting point. It is also only the beginning of the shareholder calculation.
At 75% debt funding, the project borrows approximately $806 million. A 7.25% coupon consumes roughly $58 million annually, before scheduled principal repayments. The parent supplies the remaining construction equity and must accommodate financing fees, reserves and other cash requirements. It then waits through construction before receiving operating cash.
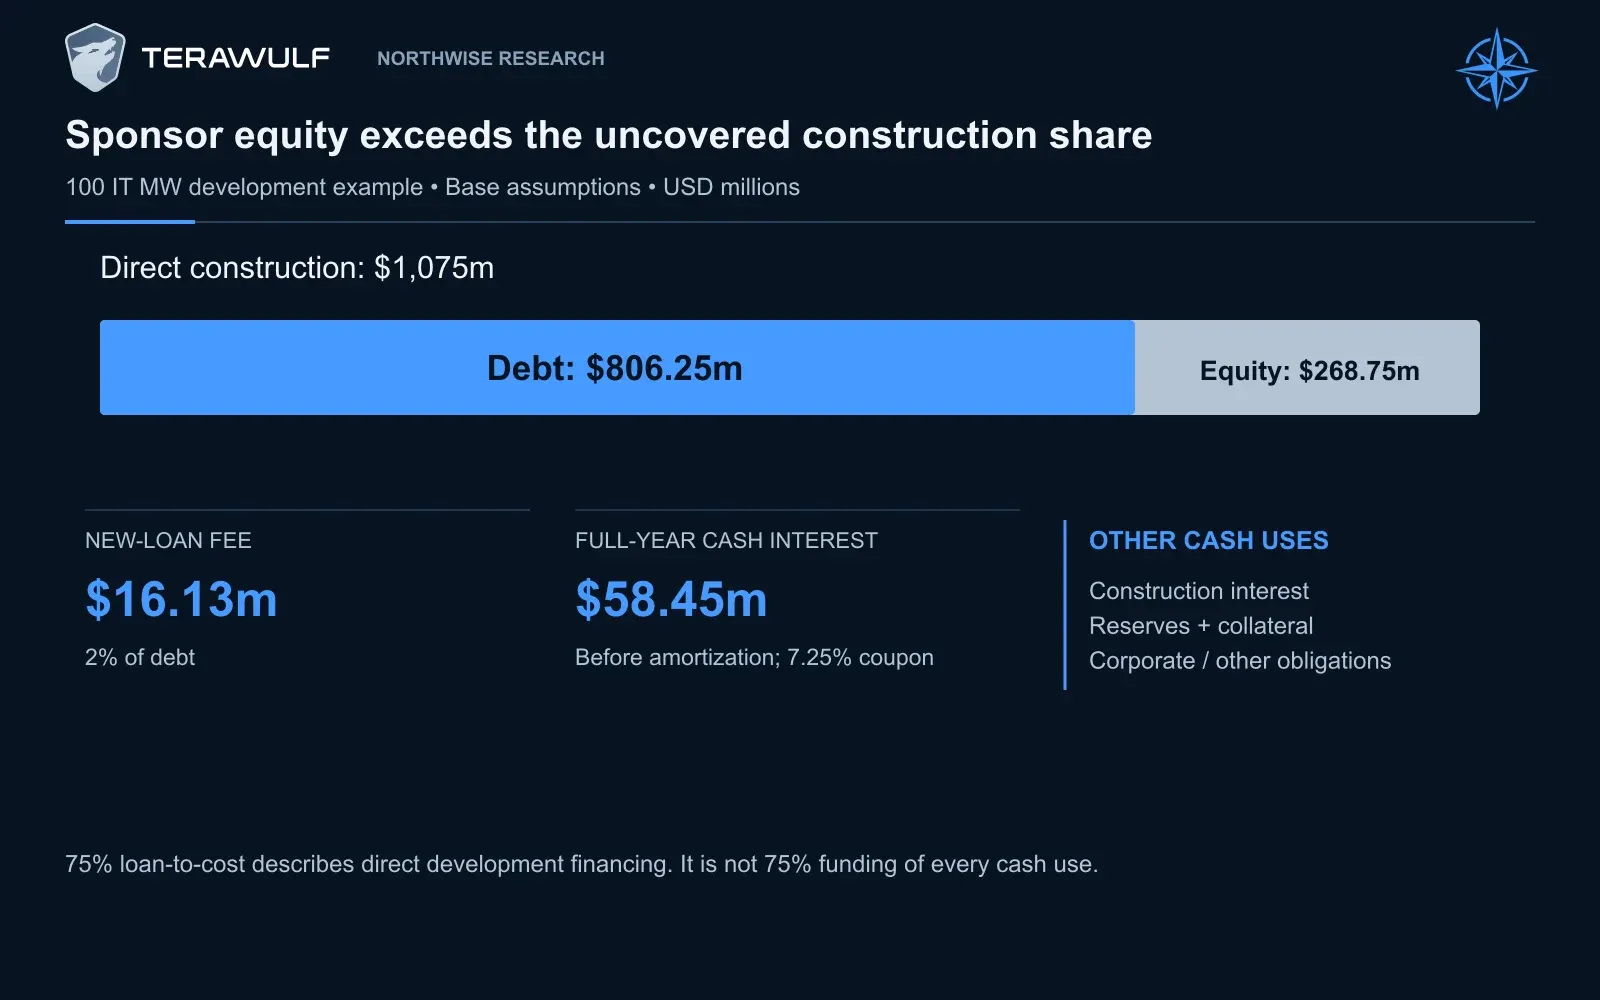
A 100 IT MW project at Base assumptions has $1,075m direct cost and $806.25m debt at 75% loan-to-cost. The $268.75m direct equity share excludes financing fees, construction interest, reserves, collateral and other obligations.
Development and financing assumption | Bear | Base | Bull |
|---|---|---|---|
New-campus direct cost per IT MW | $11.50m | $10.75m | $10.00m |
Justified direct cost per IT MW | $12.00m | $10.75m | $10.00m |
Property cash operating margin | 82% | 85% | 88% |
New-project debt/direct development cost | 65% | 75% | 80% |
New-project cash interest | 9.00% | 7.25% | 6.25% |
Annual scheduled amortization assumption | 3.5% | 2.5% | 2.0% |
Residual project cash sweep assumption | 20% | 10% | 0% |
2030 refinancing rate | 9.50% | 7.00% | 6.00% |
Core42’s Bull property margin remains capped at 85%. Chesapeake carries a 12% premium to the applicable direct development cost.
For ordinary new developments, we allocate 20% of construction cash two calendar years before delivery, 55% in the preceding year and 25% in the delivery year. The retained Lake Mariner program and Justified have their own spending schedules.
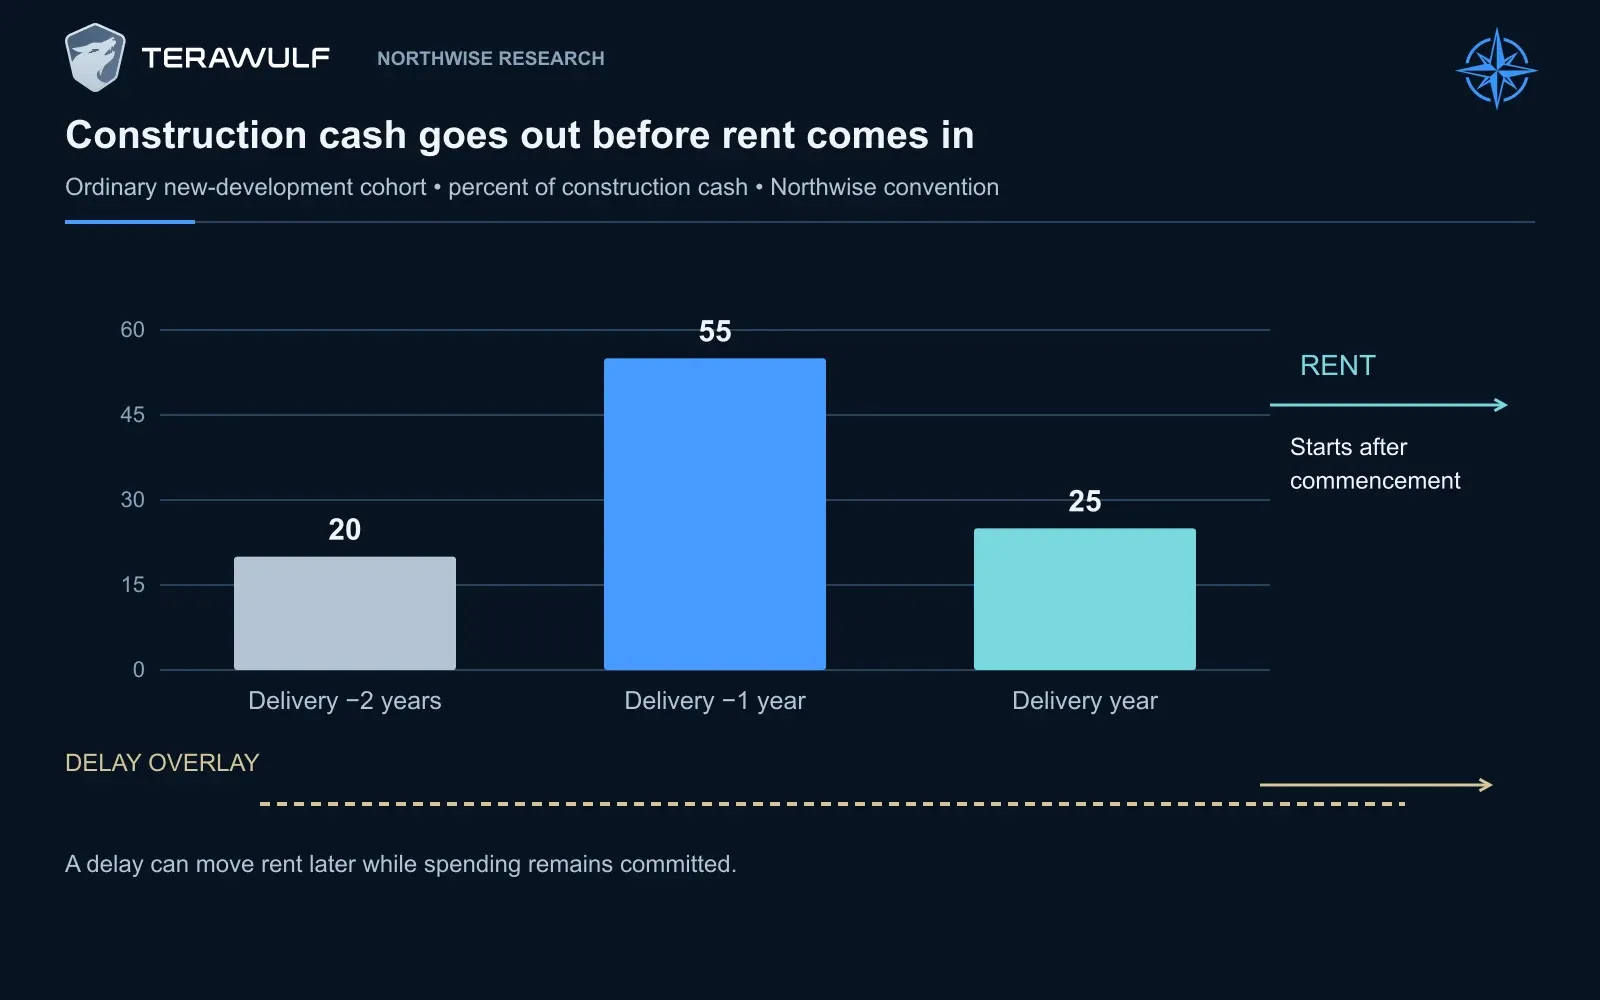
For ordinary new projects, Northwise allocates 20% of construction cash two years before delivery, 55% in the preceding year and 25% during the delivery year. Lake Mariner’s retained contracts and Justified use their own schedules.
Base construction cash, $m | 2026 | 2027 | 2028 | 2029 | 2030 |
|---|---|---|---|---|---|
Historical first-half construction | 1,378.5 | 0.0 | 0.0 | 0.0 | 0.0 |
Lake Mariner: retained contracts | 1,200.0 | 500.0 | 0.0 | 0.0 | 0.0 |
Lake Mariner: expansion | 215.0 | 806.2 | 860.0 | 268.8 | 0.0 |
Justified | 1,000.0 | 2,500.0 | 457.7 | 0.0 | 0.0 |
Muskie | 215.0 | 1,236.2 | 2,902.5 | 3,171.2 | 1,075.0 |
Lake Hawkeye | 0.0 | 344.0 | 1,290.0 | 1,376.0 | 430.0 |
Chesapeake | 0.0 | 0.0 | 481.6 | 1,324.4 | 602.0 |
Total | 4,008.5 | 5,386.5 | 5,991.9 | 6,140.4 | 2,107.0 |
The forecast allows 2% financing fees, 3% common-equity issuance costs and a 1.5% refinancing fee. Maintenance begins at $0.08 million per operating IT MW-year at 2026 prices and increases 2% annually. Electricity reimbursements begin at $0.47 million per operating IT MW-year, also increasing 2%, with an equal operating expense and no assumed margin.
Financing can change these economics in ways a property yield alone will not reveal. A lower coupon helps only where it applies. A reduction in short-term policy rates would not automatically reduce the fixed 7.75% coupon on the existing secured notes. New lenders would also consider the tenant, construction status and credit risk when pricing another project. The existing note coupon is fixed under its disclosed terms.
We are particularly cautious about cost overruns. A fixed-dollar loan commitment does not expand automatically because the building becomes more expensive. Our overrun stresses leave the original debt commitments fixed and require the sponsor to find the difference.
11. The cash balance and the construction calendar
At June 30, WULF reported approximately $3.03 billion of cash, equivalents and restricted cash. The amount was substantial, but it was spread across accounts with different obligations.
Management described approximately $1.9 billion of gross cash at WULF Compute and about $1.5 billion after the specified reserve and construction-interest accounts. It also identified approximately $1.7 billion of remaining Lake Mariner spending. The useful comparison is between the cash committed to that development and the work still to be paid for, not simply the consolidated cash total.
We allocate $1.9 billion of opening cash to WULF Compute and the exact consolidated residual, approximately $1.13 billion, to the parent. This is an analytical reconciliation of the consolidated balance to rounded management commentary, rather than a separately reported exact parent balance.
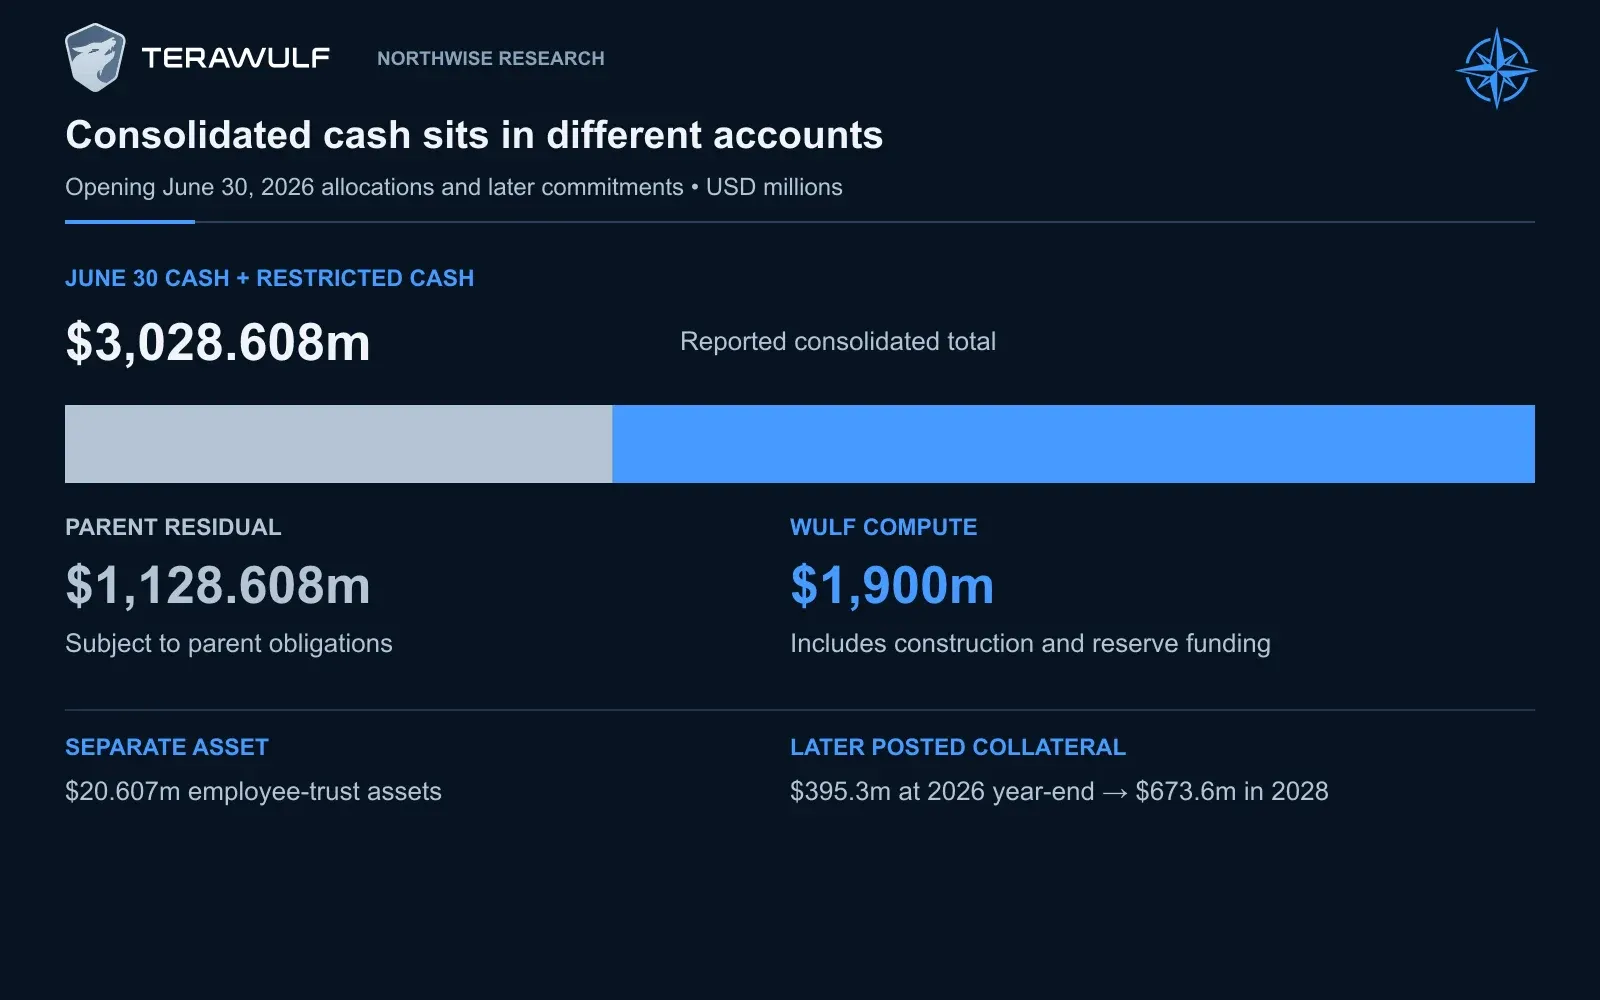
Northwise allocates the $3,028.608m June cash and restricted cash total between $1,900m at WULF Compute and a $1,128.608m parent residual. Construction accounts, debt reserves, later posted collateral and employee-trust assets have different uses and dates.
The parent then receives Abernathy proceeds in installments, supplies project equity, posts collateral and pays its own obligations. Project cash reaches it only when the financing arrangements permit a distribution.
The monthly timing produces a second-half 2026 funding requirement in our expanded development schedule even though the parent ends the year above its minimum cash balance. Base raises approximately $212 million gross during that period.
Management had said that its liquidity and expected transaction proceeds could fund its near-term plans without another common-equity raise. Our result addresses a different development schedule, including our assumptions for accelerated expansion, collateral and the timing of project reimbursements. It should not be read as a funding shortfall announced by the company.
The distinction is economically meaningful. A receipt expected in December cannot pay an obligation due months earlier. Nor can cash held to protect a lender or utility be spent freely because it appears somewhere on the consolidated balance sheet.
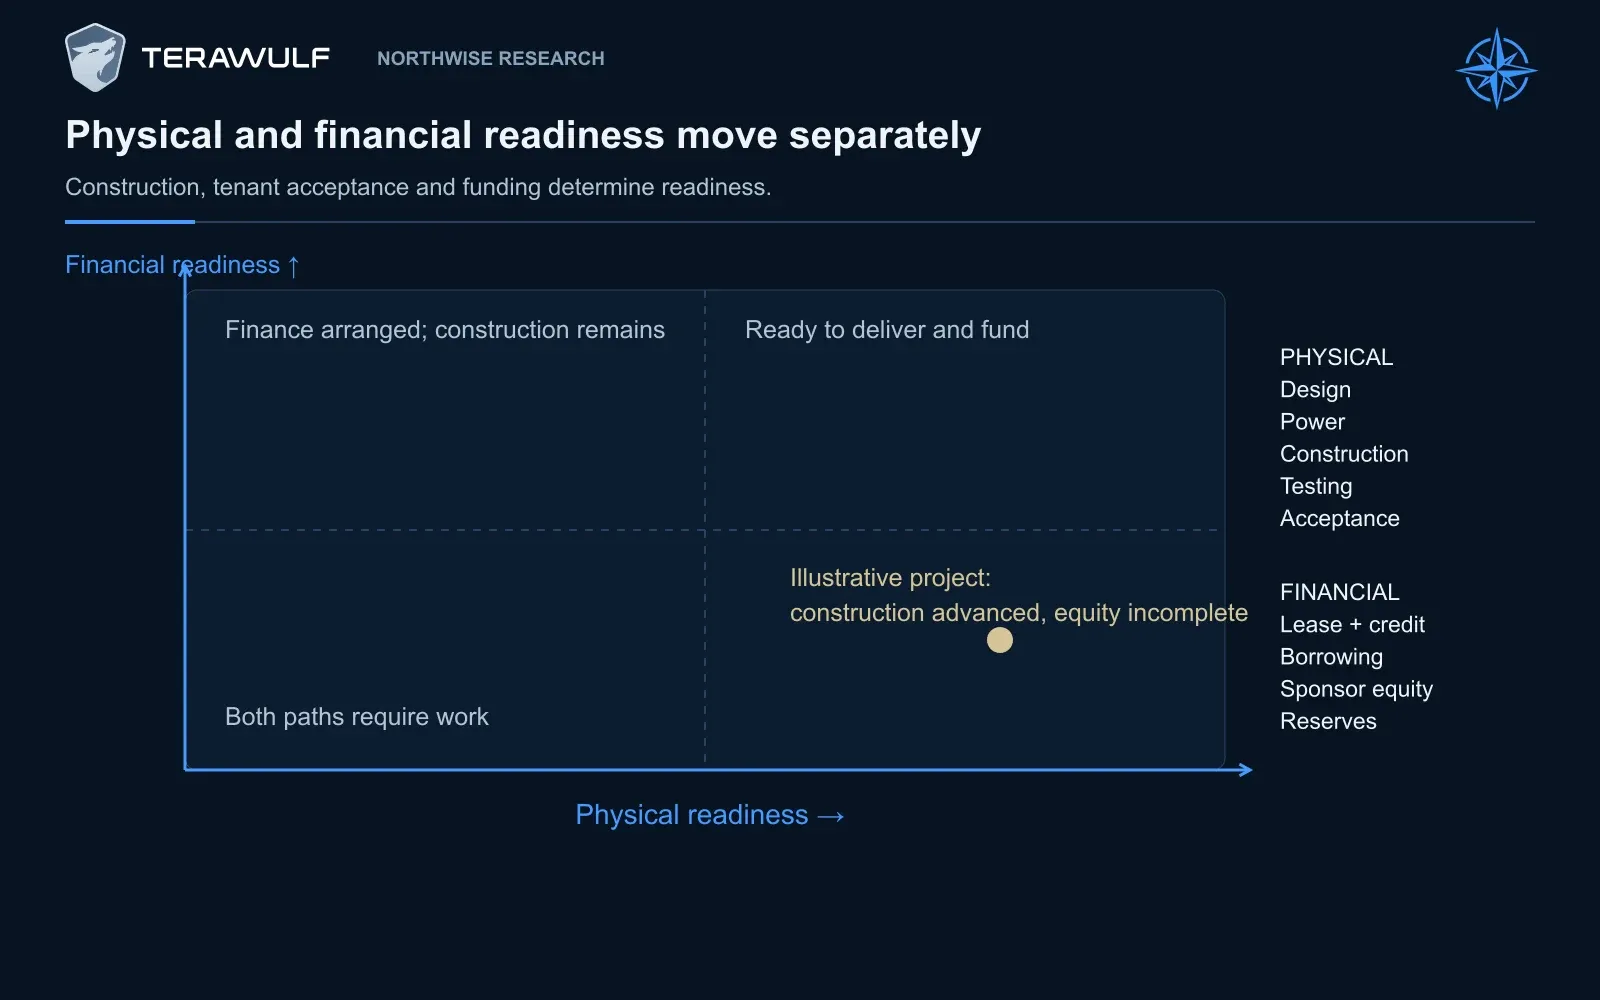
The readiness map separates construction and acceptance from leases, borrowing, sponsor equity and reserves. A physically advanced project may still need financing before the parent can complete it.
Our posted-collateral forecast rises from approximately $395 million in 2026 to $674 million in 2028 and remains at that level through 2030. It includes a $100 million assumed Justified allowance, not a disclosed final requirement. Employee-trust assets are also kept outside shareholder-accessible liquidity.
The construction schedule separately accounts for invoices earned and cash paid. Opening construction liabilities are settled within the remaining cash budget. An assumed 80% of ordinary accounts payable is allocated to construction for that reconciliation. The exact campus-level allocation is an underwriting assumption; the consolidated liabilities are reported in the filing.
This is where the quality of the development budget becomes important. A forecast must recognize work already performed but not yet paid without charging shareholders for the same construction twice.
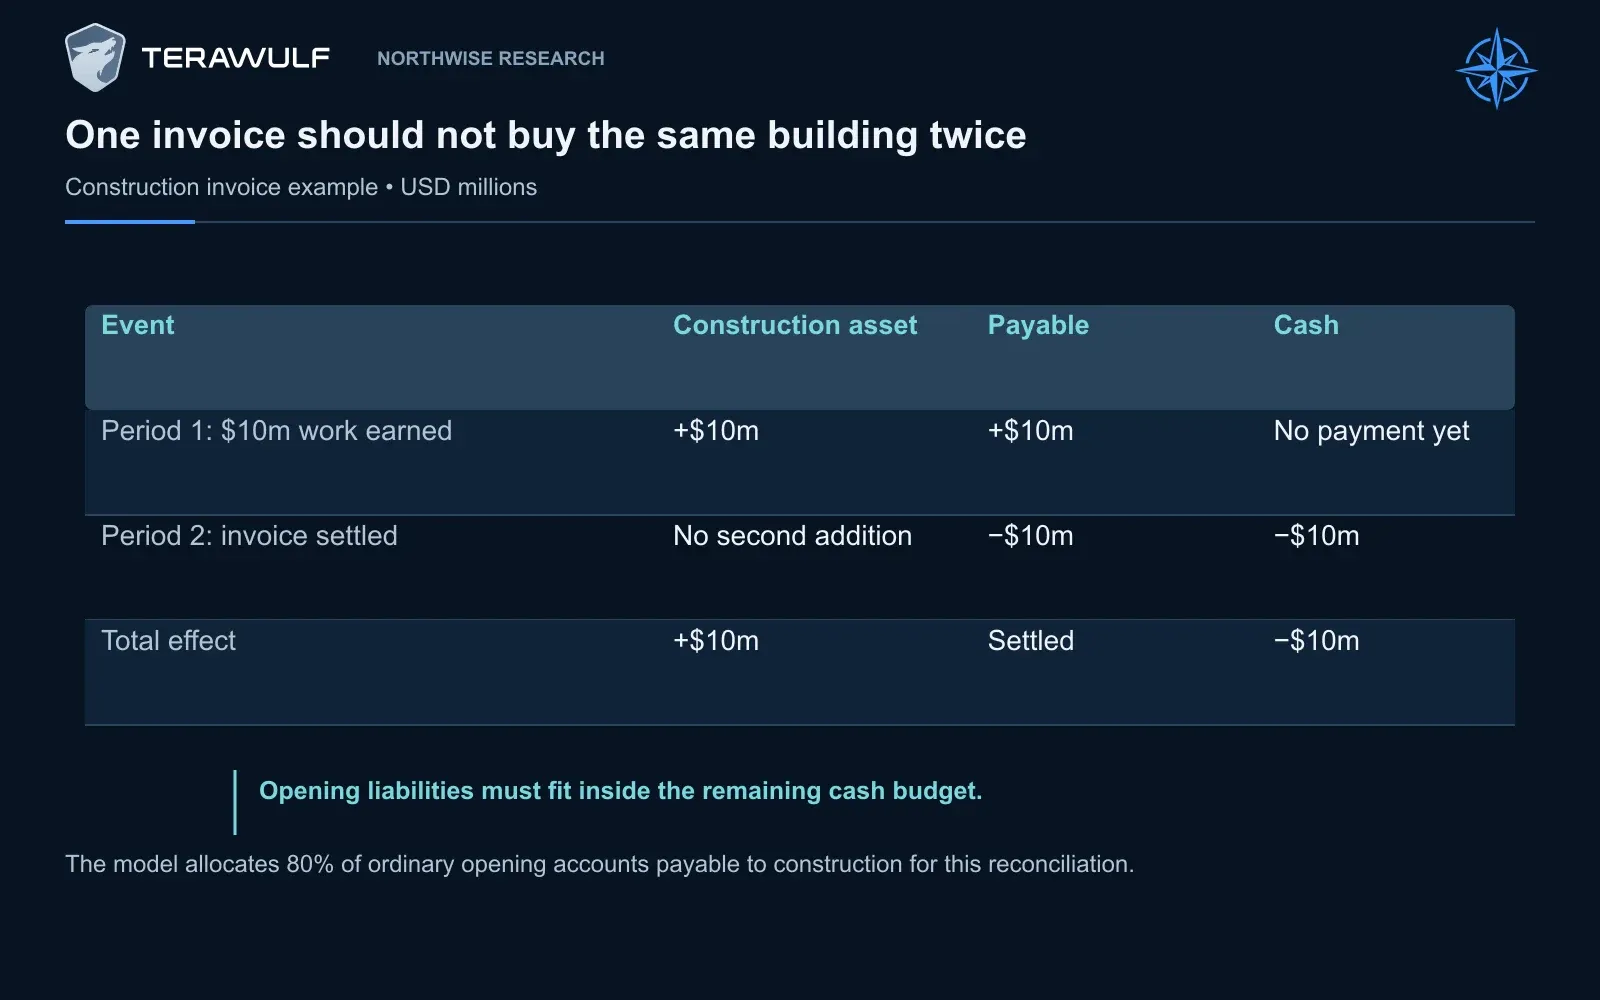
A $10m construction invoice increases the asset and a payable when work is earned; settling it later reduces cash and the payable without adding the building again. Northwise reconciles opening construction liabilities within the remaining cash budget.
12. Following rent through the project accounts
The parent company owns the development subsidiaries, but it cannot necessarily use their cash as though they were unrestricted bank accounts.
Project lenders advance money against identified assets and leases. Their agreements specify where receipts go, what reserves must be maintained and when the owner can withdraw the residual. Those protections help make the borrowing possible.
At Lake Mariner, Core42-related receipts enter the La Lupa account structure, while the Fluidstack program is associated with Akela. The original WULF Compute indenture routes the La Lupa residual into the project structure after the specified operating expenses. It also requires a $265 million post-construction debt-service reserve and includes a 50% excess-cash-flow offer mechanism. (SEC)
The offer allows noteholders to tender debt for repurchase using qualifying available cash. Acceptance and timing matter. Notes repurchased through that mechanism do not reduce the scheduled installments, and applicable lease-termination proceeds must support debt redemption rather than becoming unrestricted parent cash. (SEC)
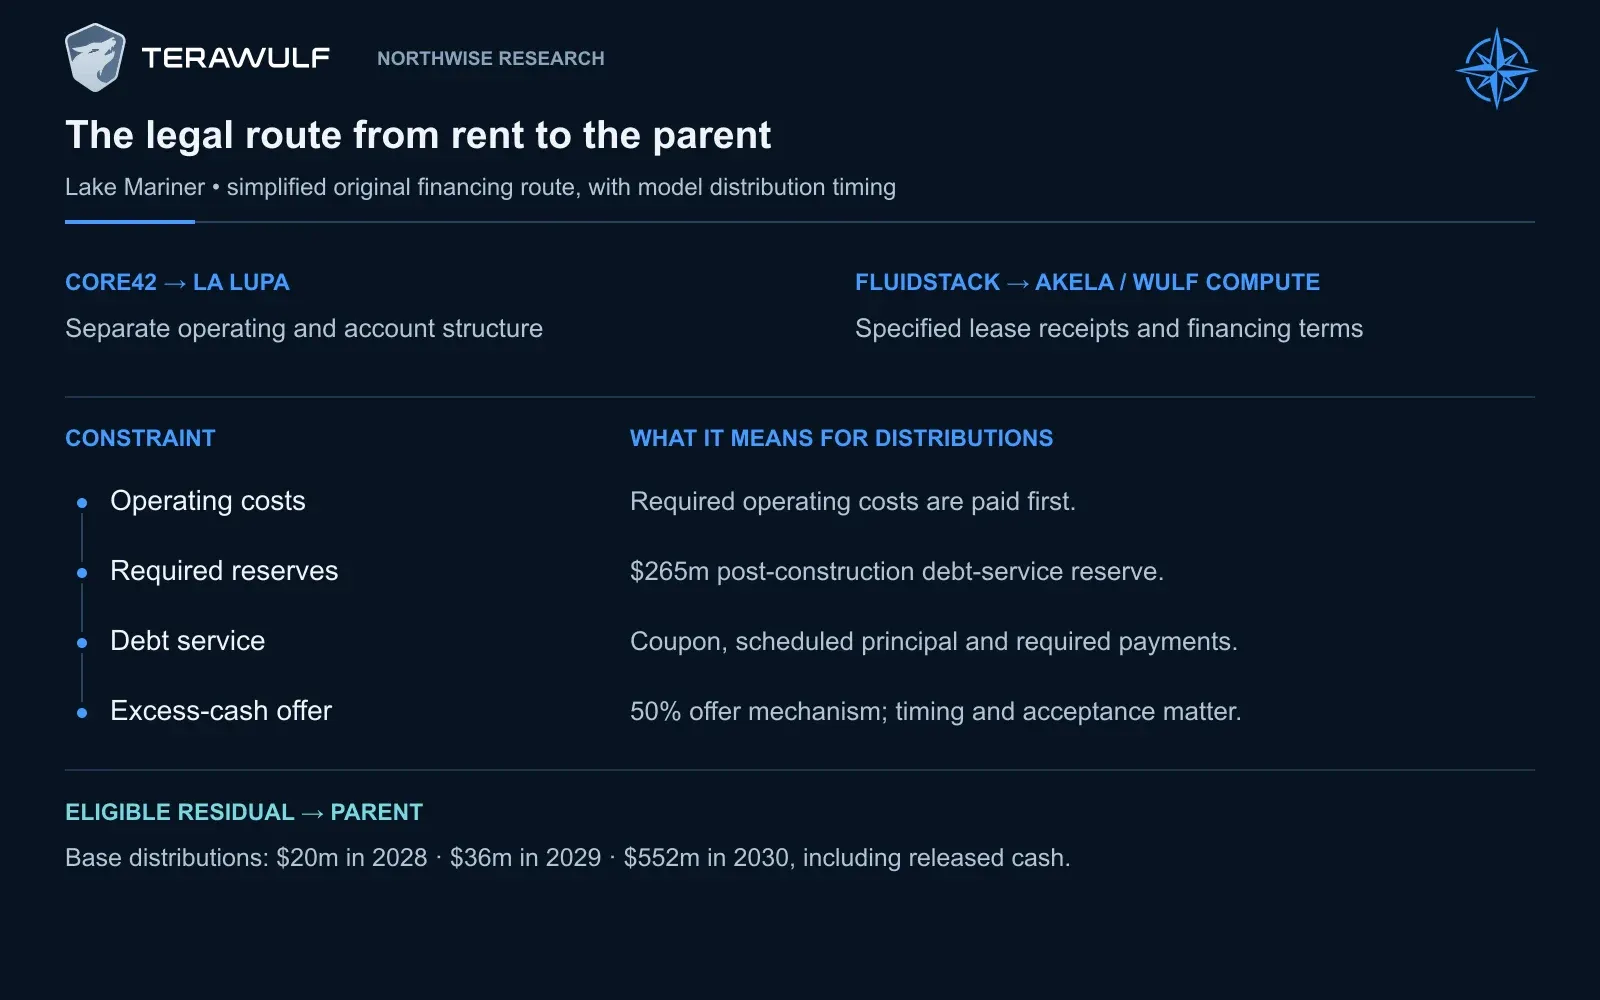
Core42 receipts enter La Lupa; the Fluidstack program is associated with Akela and WULF Compute. Operating costs, required reserves, debt service and the excess-cash-flow offer mechanism constrain eligible parent distributions.
Our forecast uses the ordinary retained-cash distribution route and preserves the required accounts before releasing money to the parent. Base Lake Mariner distributions are approximately $20 million in 2028 and $36 million in 2029, followed by approximately $552 million in 2030 after refinancing and the release of accumulated cash and reserves.
The 2030 increase is therefore partly a release of money earned or retained earlier. It should not be annualized as though the property had suddenly developed a new recurring earnings stream.
WULF’s major existing instruments are:
Instrument | Original principal | Cash coupon | Maturity |
|---|---|---|---|
WULF Compute secured notes | $3.200bn | 7.75% | October 2030 |
2030 convertible notes | $500m | 2.75% | February 2030 |
2031 convertible notes | $1.000bn | 1.00% | 2031 |
2032 convertible notes | $1.025bn | 0% | 2032 |
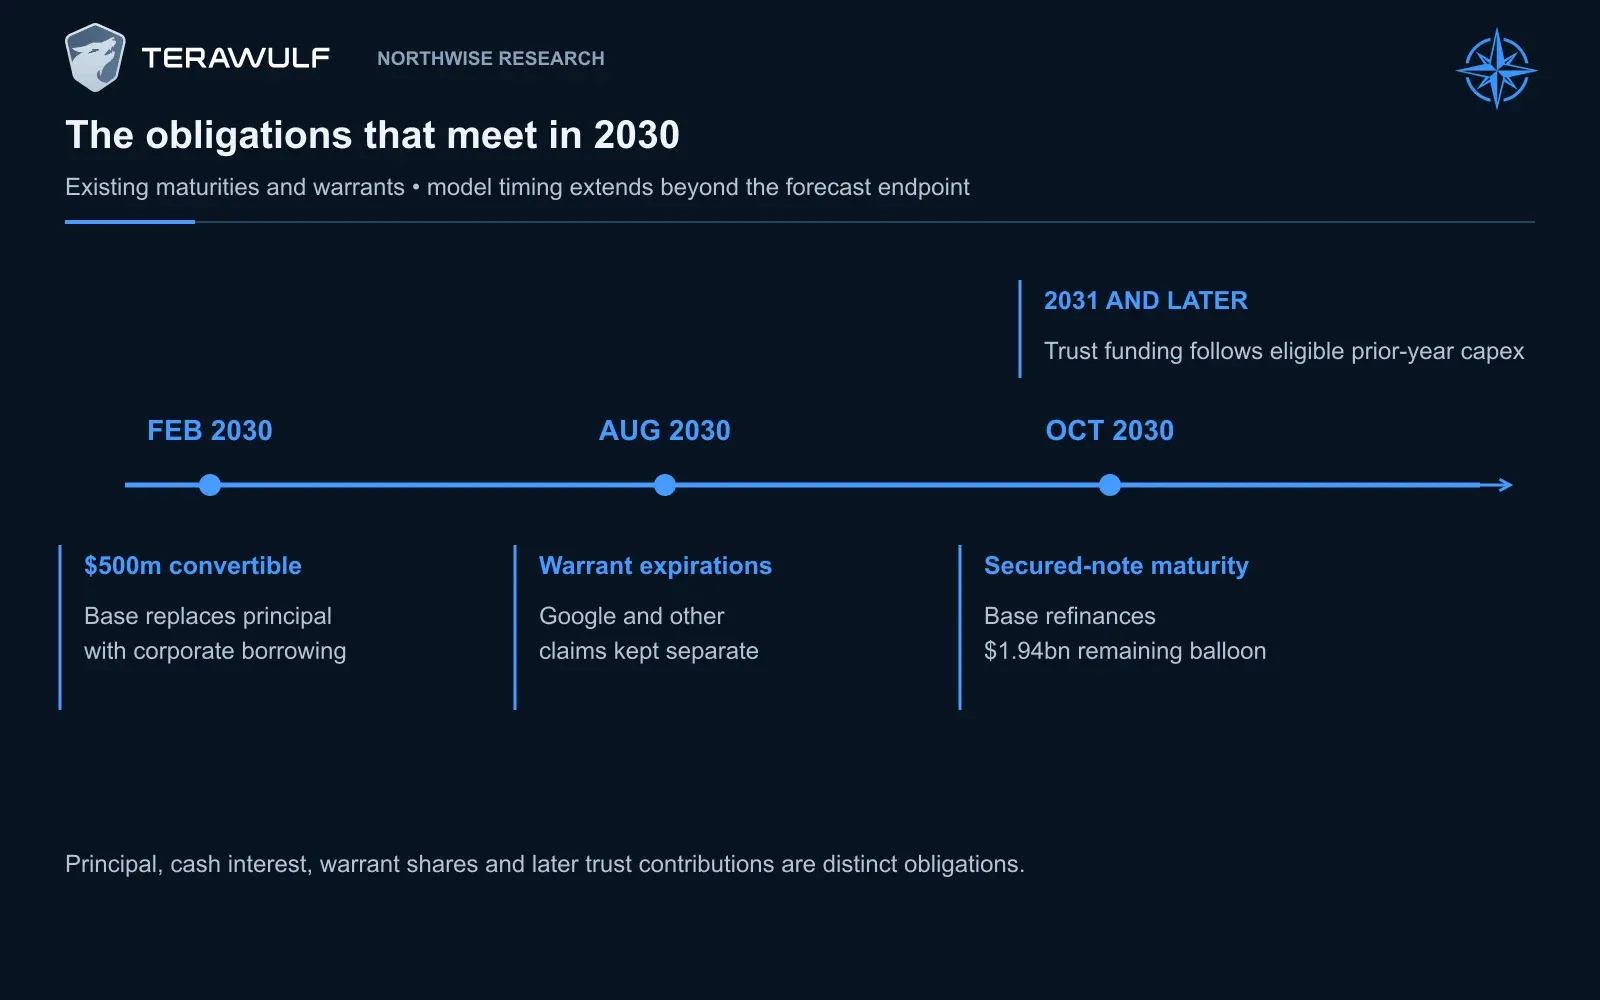
The 2030 calendar includes February convertible maturity, August warrant settlements and October secured-note maturity. A contribution generated by 2030 eligible capex remains payable after the endpoint rather than disappearing from the analysis.
Existing principal, coupons and maturities are company disclosures. Replacement borrowing is a Northwise assumption.
Base refinances approximately $1.94 billion of the Lake Mariner balloon in October 2030 and separately replaces the $500 million convertible principal with corporate borrowing in February. Bear refinances 85% of its remaining Lake Mariner balloon and pays down the balance. Base and Bull refinance the full remaining project balloon at assumed rates of 7% and 6%.
Base borrowing and repayment, $m | 2027 | 2028 | 2029 | 2030 |
|---|---|---|---|---|
Debt draws, including refinancing | 3,664.9 | 4,493.9 | 4,605.3 | 4,015.7 |
Scheduled principal | 245.0 | 386.5 | 485.8 | 600.9 |
Cash sweeps | 0.0 | 24.8 | 47.9 | 69.2 |
Maturity settlements | 0.0 | 0.0 | 0.0 | 2,435.4 |
Ending funded debt | 10,467.3 | 14,549.9 | 18,621.5 | 19,531.6 |
A larger operating portfolio should give lenders more evidence to evaluate. It does not guarantee the terms available at maturity. Our December 2030 valuation is calculated after the year’s settlements, rather than immediately before them.
13. Minority ownership, employee obligations and compensation
Ownership percentages do not always describe who supplies the capital.
The seller of Justified received a 6.8% minority interest without the usual corresponding construction-funding obligation. The agreement provides a redemption right beginning on the first anniversary of operations, at a fixed amount reduced by prior distributions.
We assume a $150 million gross redemption amount. Base pays approximately $105 million in 2028 after modeled prior distributions and owns the full interest thereafter. The $150 million is an assumption because the disclosed material does not establish the fixed redemption price.
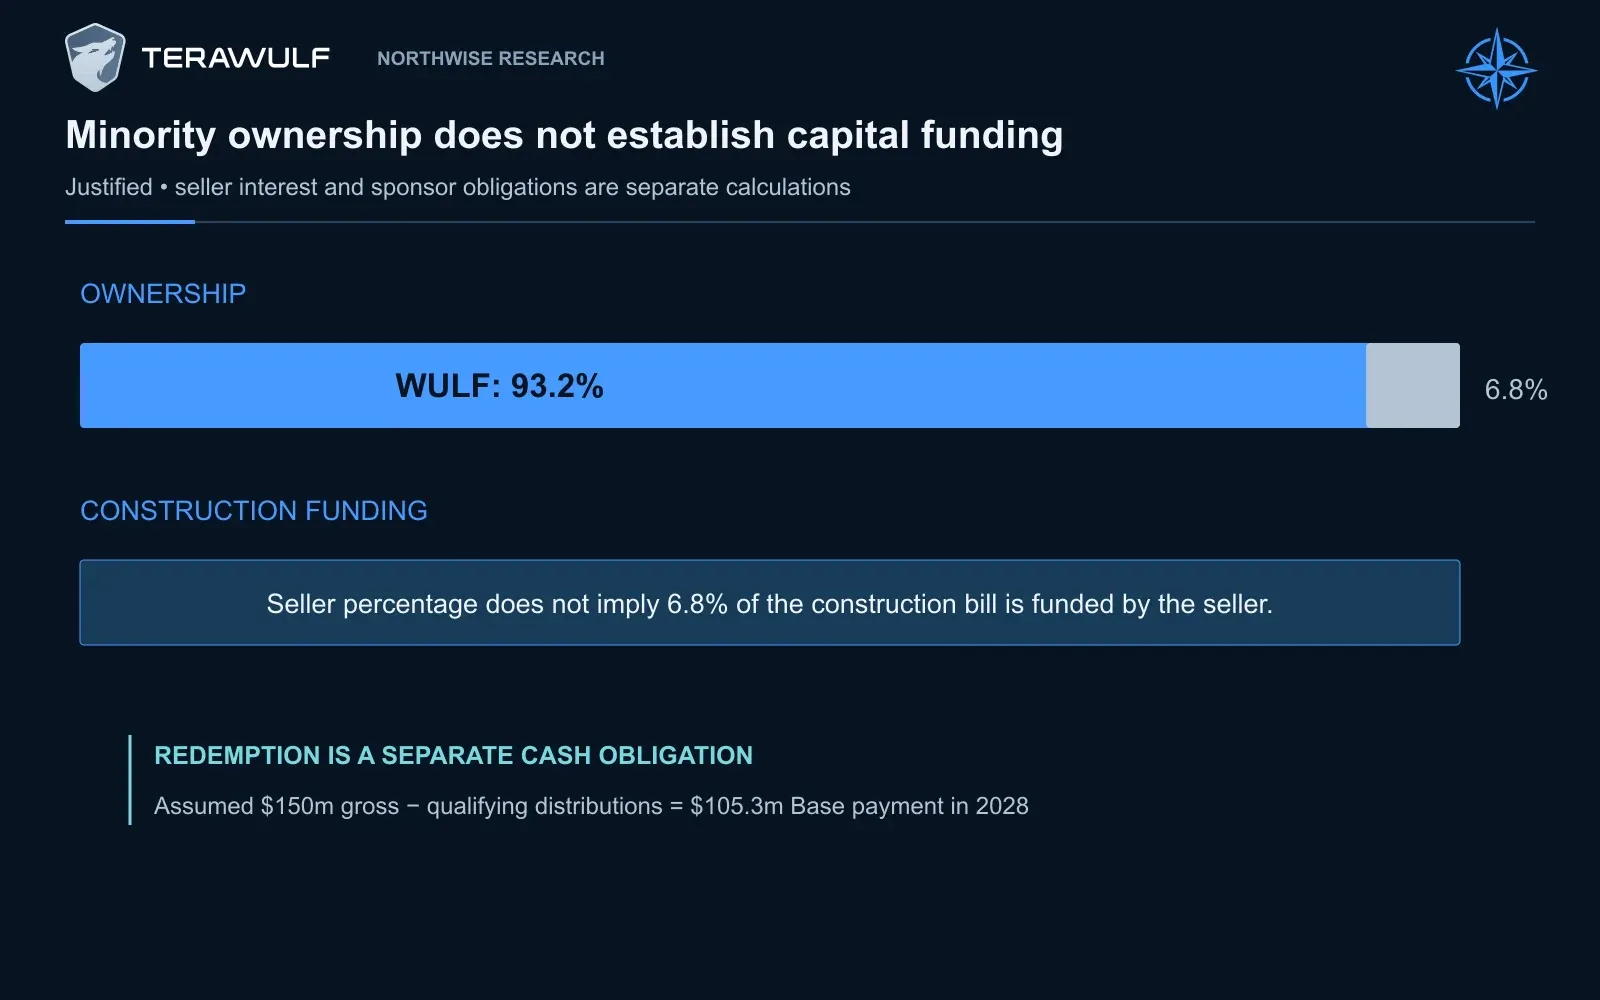
Justified’s seller holds a 6.8% minority interest without the ordinary proportional construction-funding obligation. Northwise’s $150m gross redemption assumption is reduced by prior qualifying distributions, producing a $105.3m Base payment in 2028.
The Beowulf acquisition creates a separate obligation to fund an employee trust based on 2% of eligible GAAP capital expenditure for HPC development. WULF contributed approximately $20.6 million during the first half of 2026 based on the relevant prior-period expenditure.
Our forecast follows the eligible expenditure and payment timing, including a contribution after 2030 arising from that year’s development activity. Base trust funding is approximately $130 million in 2030. The trust’s investments are not included as cash available to common shareholders.
Stock compensation is another cost with several dates attached to it. Expense is recognized over the service period, while shares and withholding cash are delivered as awards vest. Granting an award, recording an expense and paying withholding are connected events, not three independent estimates.
We use the existing unvested awards and their remaining expense, then add annual future grant budgets. Future awards vest over three years, with 30% assumed withholding. Base’s new-grant budgets for 2027–2030 are $170 million, $150 million, $160 million and $175 million. Several grant years overlap in each annual expense figure.
The cash consequence is visible in the reported accounts. WULF paid approximately $131.5 million for net share-settlement taxes during the first half of 2026. The company’s future compensation cannot be analyzed solely by adding back the income-statement expense.
Base reaches approximately $161.7 million of stock-compensation expense and $57.2 million of cash withholding in 2030. The forecast also includes deferred acquisition payments, development-linked earnouts and a $50 million Chesapeake acquisition allowance. Undisclosed amounts remain identified assumptions.
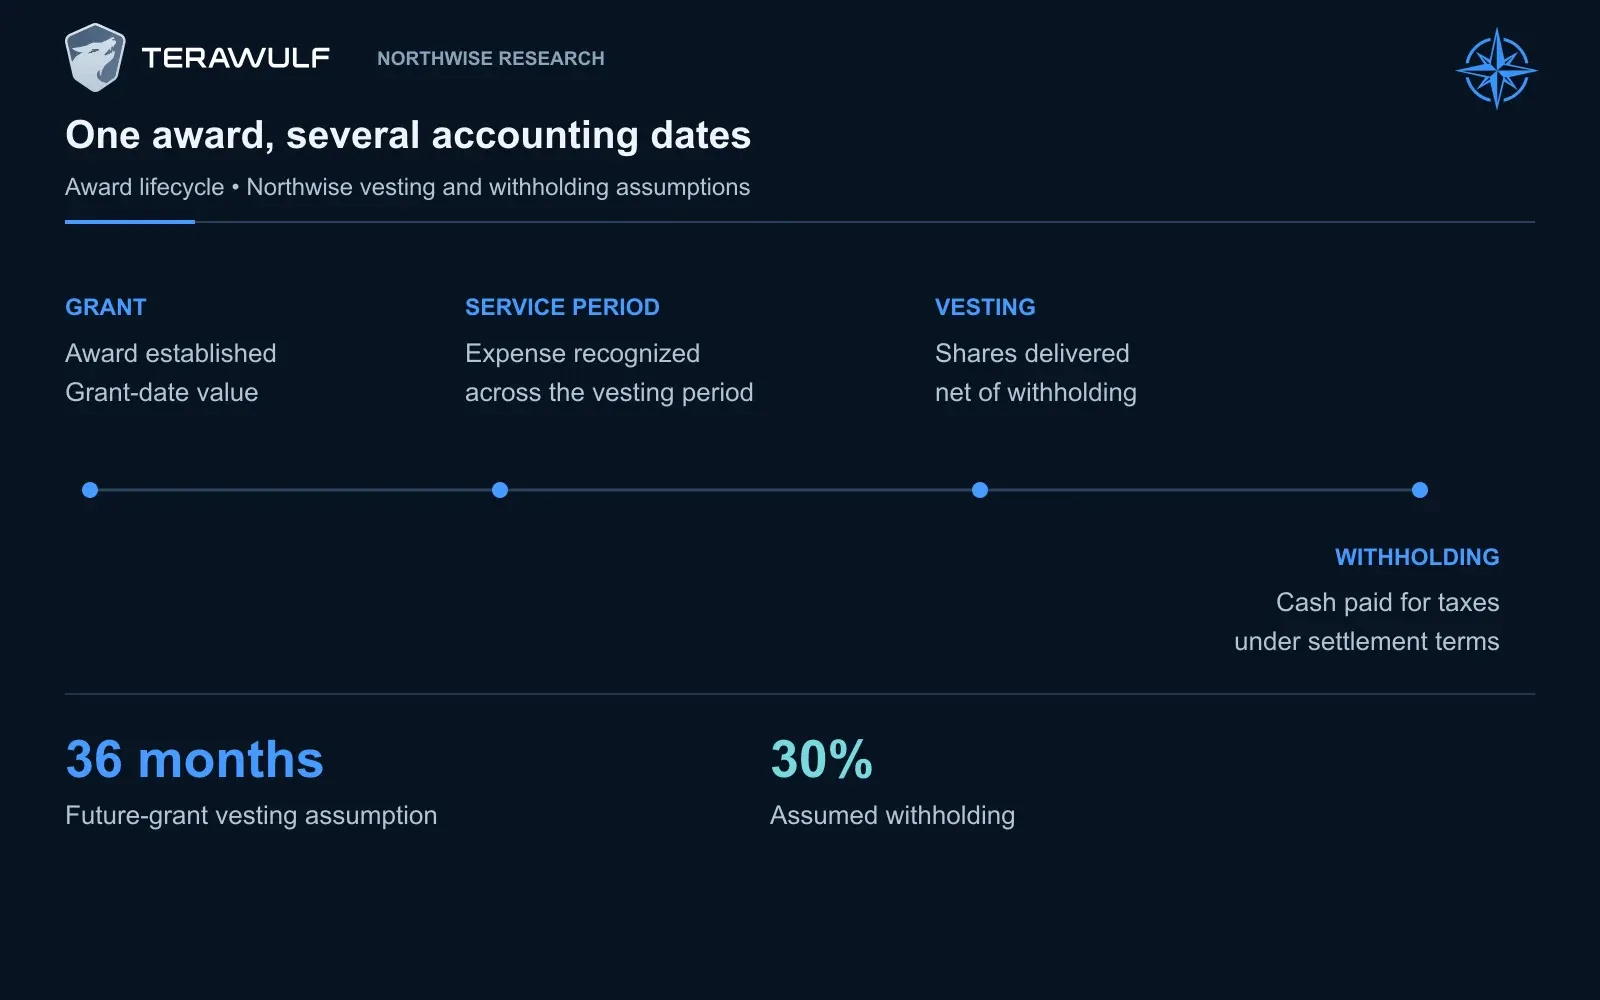
An award’s grant, expense recognition, vesting and cash withholding occur on different schedules. Northwise assumes three-year vesting and 30% withholding for future grants; those assumptions reconcile expense, delivered shares and cash rather than adding three unrelated costs.
Taken together, these obligations make the parent’s funding requirement larger than its share of direct construction costs alone would suggest.
14. The shares issued along the way
Our equity issuance follows the monthly funding need. It is not a fixed dilution percentage added at the end of the forecast.
After project contributions, distributions and other obligations, the parent raises enough modeled common equity to preserve a $250 million minimum cash balance where financing is available. Issuance costs 3%, and the share count depends on the market price received.
Financing and vesting price assumptions | 2026 | 2027 | 2028 | 2029 | 2030 |
|---|---|---|---|---|---|
Bear | $16.14 | $10 | $10 | $12 | $14 |
Base | $16.14 | $22 | $28 | $35 | $40 |
Bull | $16.14 | $30 | $45 | $60 | $75 |
These are financing assumptions, not Northwise fair-value targets. Base and Bull rely on favorable market access, while the lower-price stresses examine what happens when more shares must be sold.
The resulting ownership changes are substantial:
Outstanding-share bridge to 2030, millions | Bear | Base | Bull |
|---|---|---|---|
June 2026 outstanding shares | 498.9 | 498.9 | 498.9 |
Net shares from award vesting | 49.3 | 37.7 | 35.0 |
Shares issued for common-equity funding | 491.2 | 255.0 | 179.6 |
Residual shares from 2030 convertible settlement | 5.1 | 40.1 | 48.9 |
Warrant settlements | 77.7 | 77.7 | 77.7 |
Ending outstanding shares | 1,122.2 | 909.4 | 840.1 |
Google’s warrants represent approximately 73.58 million underlying shares within the warrant total. The forecast settles them in August 2030 under the applicable net-exercise terms, while keeping other warrants separate.
Convertible bonds require a different calculation. They are debt with an equity conversion feature. WULF’s 2030 issue has an approximate $8.48 conversion price and capped-call protection through $12.80. The 2031 issue has an approximate $12.43 conversion price and protection through $18.76. The 2032 issue has an approximate $19.94 conversion price; we assume no additional unverified capped-call protection.
A capped call can offset some of the conversion premium. It does not pay the principal under our cash-principal settlement assumption. Above the protection ceiling, additional share exposure can remain.
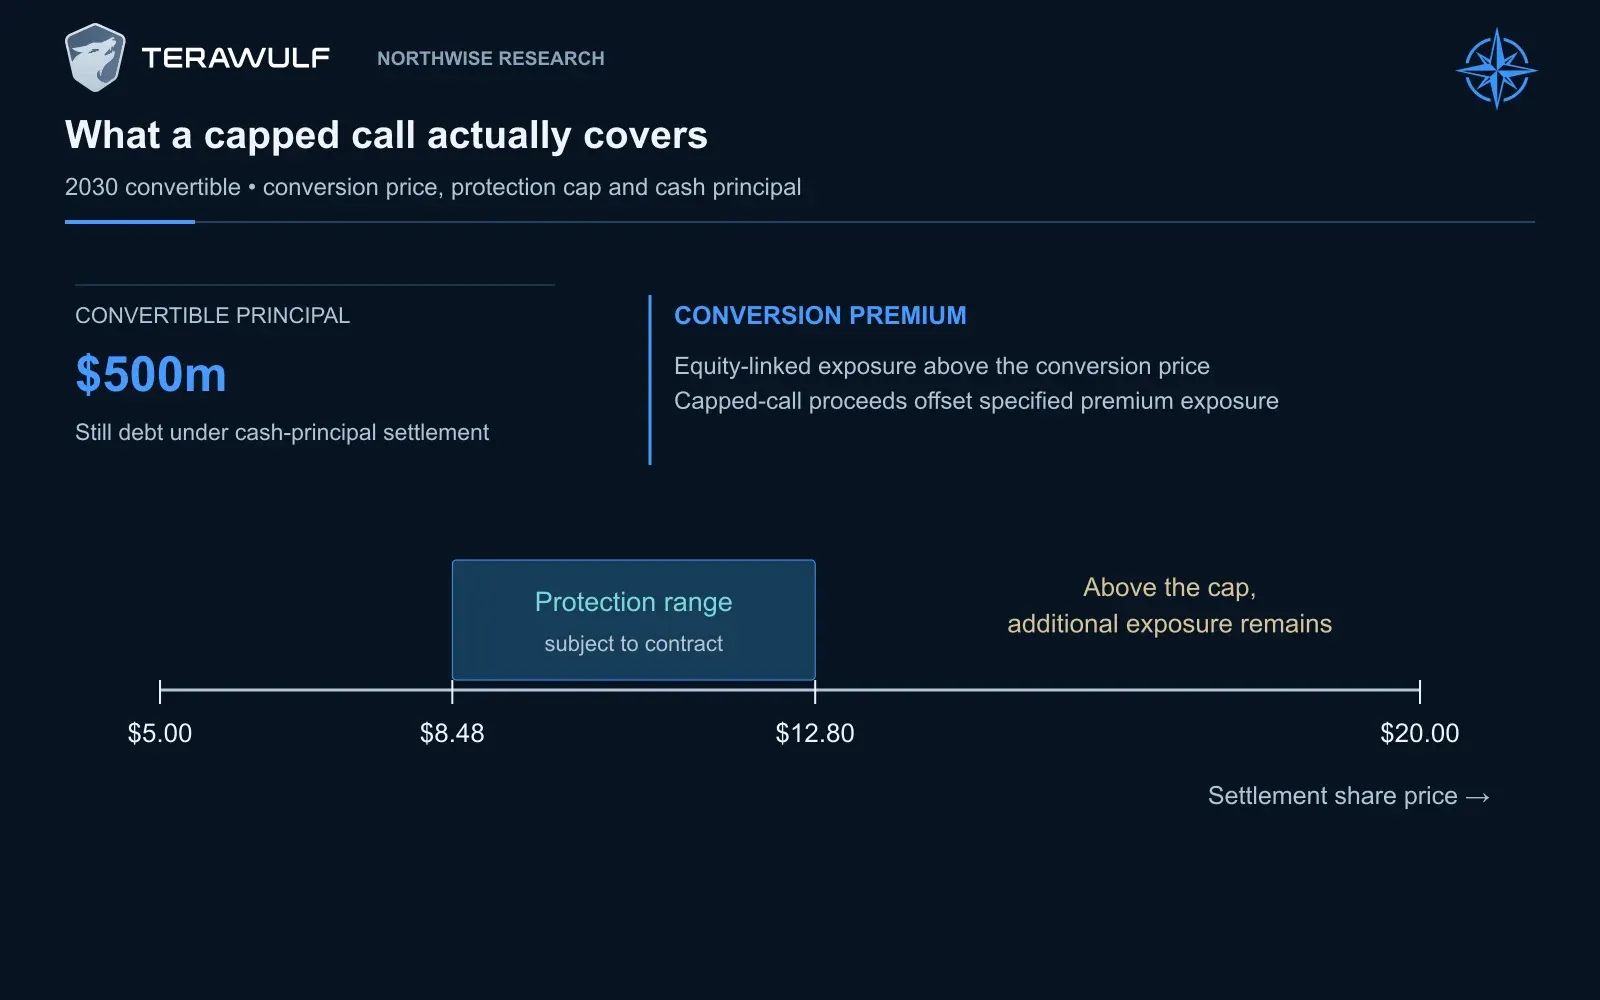
For the 2030 convertible, capped-call protection applies to specified conversion premium exposure from the approximately $8.48 conversion price through the $12.80 cap. It does not erase the $500m principal repayment assumed in cash.
We therefore retain the remaining principal as debt and calculate the incremental conversion claim separately. Adding the full underlying share count while also deducting all principal would charge common shareholders for overlapping claims.
Share authorization is another condition of the funded forecast. The disclosed authorization is 950 million common shares. Our three central cases assume that it increases to 1.5 billion in 2027 and that future incentive grants receive the required approvals. Those approvals are not represented as having occurred.
Issued shares, treasury shares and shares reserved for instruments must be considered together. Base ends 2030 with approximately 909 million outstanding shares and 933 million issued shares before considering the remaining reserved claims. Merely comparing outstanding shares with the old ceiling would miss the constraint.
15. Reading earnings without losing sight of cash
A completed hall can produce several different earnings measures, all describing different things.
Property cash operating income begins with contractual rent and deducts the costs of operating the property. Corporate and development expenses then reduce that amount to cash-rent EBITDA, our measure before interest, tax, depreciation and amortization based on the rental cash schedule.
The revenue-accounting forecast adds straight-line lease income to estimate adjusted EBITDA. Fixed escalating rent can be recognized more evenly over the initial lease than it is collected. That creates accounting income before some of the associated cash arrives.
Core42’s prepayment works in the opposite direction. WULF received $90 million in 2025, with credits applied against 50% of subsequent monthly base rent until exhausted. Our forecast uses the remaining credits during 2026–2027 rather than collecting the prepaid amount again.
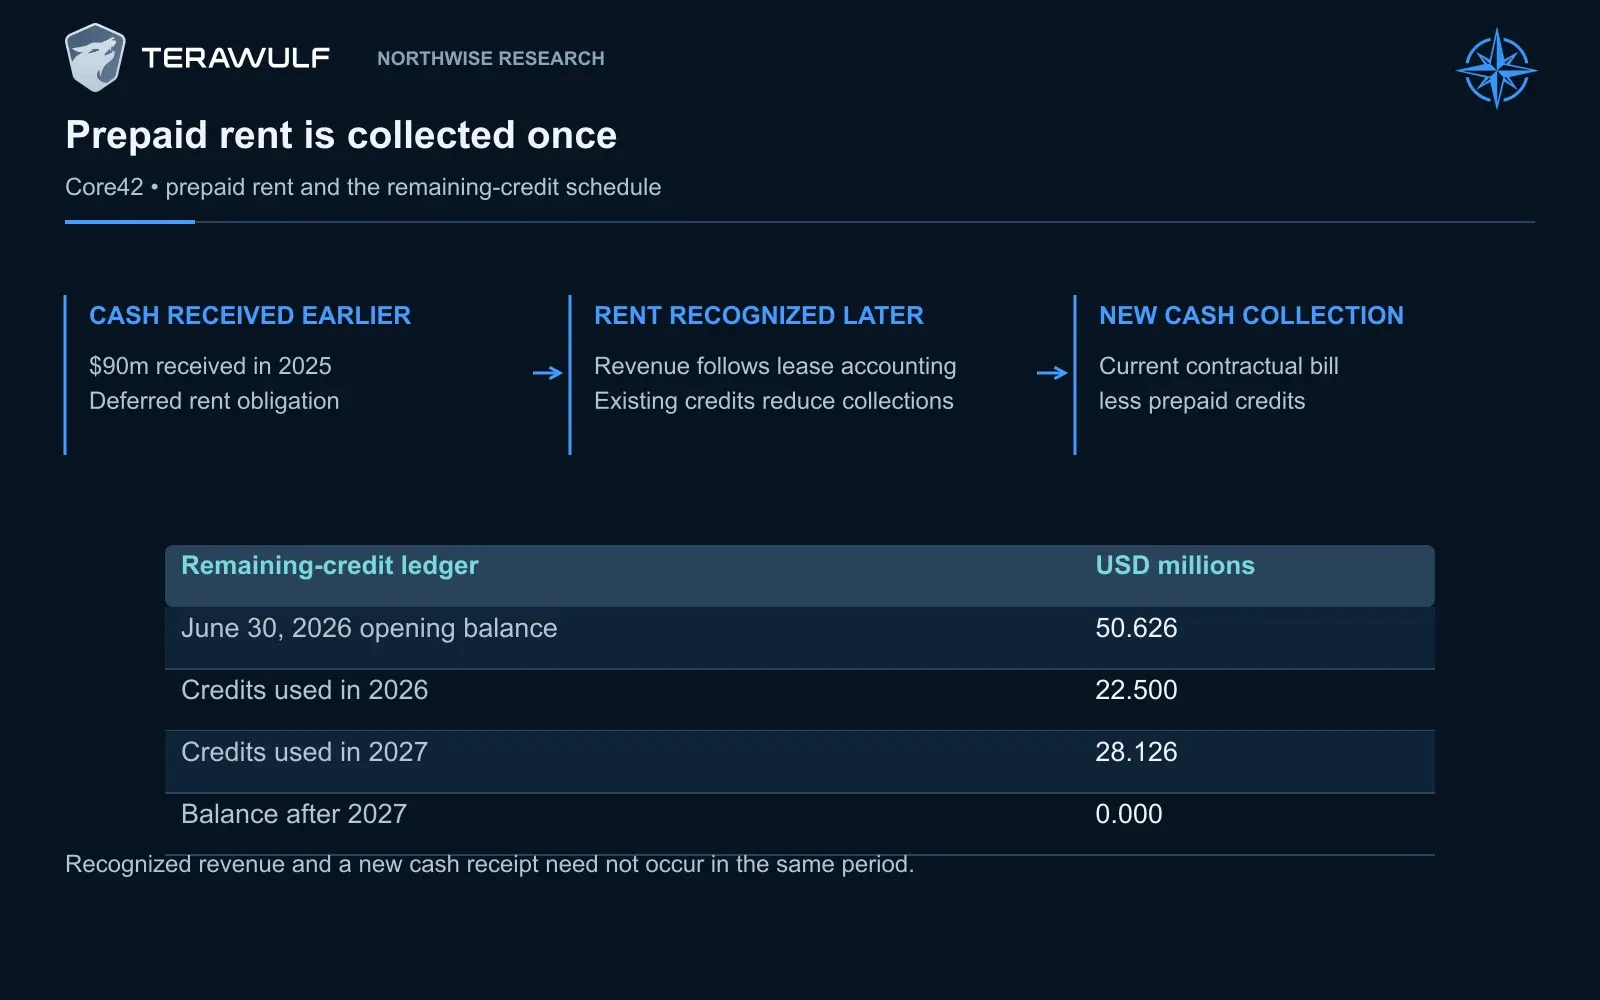
Core42 paid $90 million in 2025, with credits against 50% of subsequent monthly base rent until exhausted. The model uses $22.5m of credits in 2026 and $28.126m in 2027 rather than collecting that prepaid rent a second time.
By 2030, Base adjusted EBITDA is approximately $3.43 billion, including $681 million of straight-line rent uplift. Cash-rent EBITDA is approximately $2.75 billion.
The normalized earnings calculation is:
Base 2030 normalized earnings, $m | Amount |
|---|---|
Adjusted EBITDA | 3,432.4 |
Depreciation | (1,224.0) |
Stock-compensation expense | (161.7) |
Deferred lease-cost amortization | (57.3) |
Finance-lease asset amortization | (3.0) |
Income-statement interest expense | (1,161.4) |
Interest income | 42.6 |
Normalized pretax income | 867.6 |
Normalized tax expense | (216.9) |
Normalized net income attributable to WULF | 650.7 |
Normalized earnings include the expenses shown but exclude unpredictable future warrant remeasurement and selected nonrecurring items. They are not a forecast of future GAAP net income.
Depreciation assumes that 70% of development cost is depreciated over 25 years and 30% over ten years. Land is treated separately. Construction transfers into completed assets as the relevant halls enter service, while subsequent maintenance adds its own depreciable cost.
Interest also has a timing difference. Some financing costs incurred during construction become part of the asset’s accounting cost and are expensed later. Cash interest paid can differ from both stated interest accrued and the income-statement expense. WULF’s filing identifies these categories separately, and our forecast preserves them.
The cash result is:
Base 2030 cash generation, $m | Amount |
|---|---|
Adjusted EBITDA | 3,432.4 |
Remove straight-line rent uplift | (681.4) |
Cash-rent EBITDA | 2,751.0 |
Cash interest paid | (1,281.9) |
Interest income | 42.6 |
Cash taxes | (25.4) |
Working-capital investment | (55.0) |
Operating cash flow | 1,431.4 |
Maintenance capital | (162.7) |
Employee-trust funding | (130.1) |
Award-related cash withholding | (57.2) |
Cash before growth capital and principal repayments | 1,081.4 |
The final amount still has to meet growth expenditure, debt principal and other obligations. Project restrictions also determine how much is available at the parent.
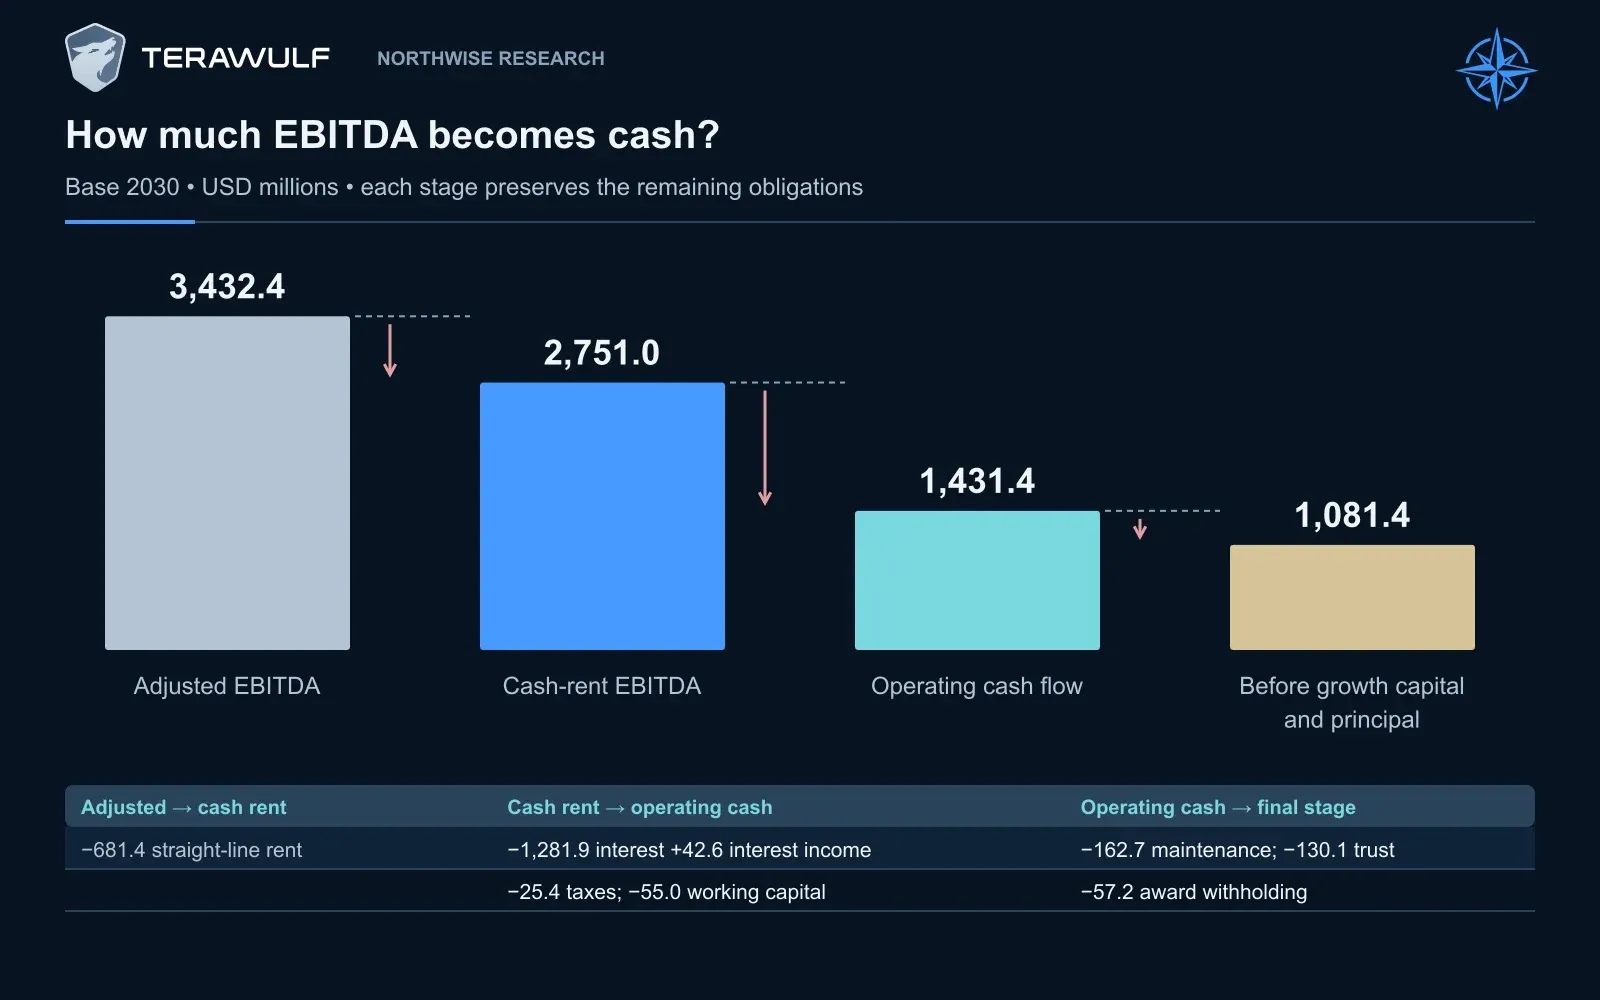
Base moves from $3,432.4m adjusted EBITDA to $2,751.0m cash-rent EBITDA, $1,431.4m operating cash flow and $1,081.4m before growth capital and principal. Straight-line rent, interest, taxes, working capital, maintenance, trust funding and withholding explain the bridge.
Cash taxes are calculated from forecast earnings, modeled depreciation, vesting deductions, an interest-deduction limitation and loss-carryforward utilization. We credit no unsupported opening tax-loss or interest carryforwards and assume no bonus depreciation or special real-property election. Normalized tax expense uses a 25% rate on positive normalized pretax earnings.
The low cash-tax result therefore reflects the assumed deduction schedule during a heavy investment period. It should not be extended indefinitely as a permanent tax advantage.
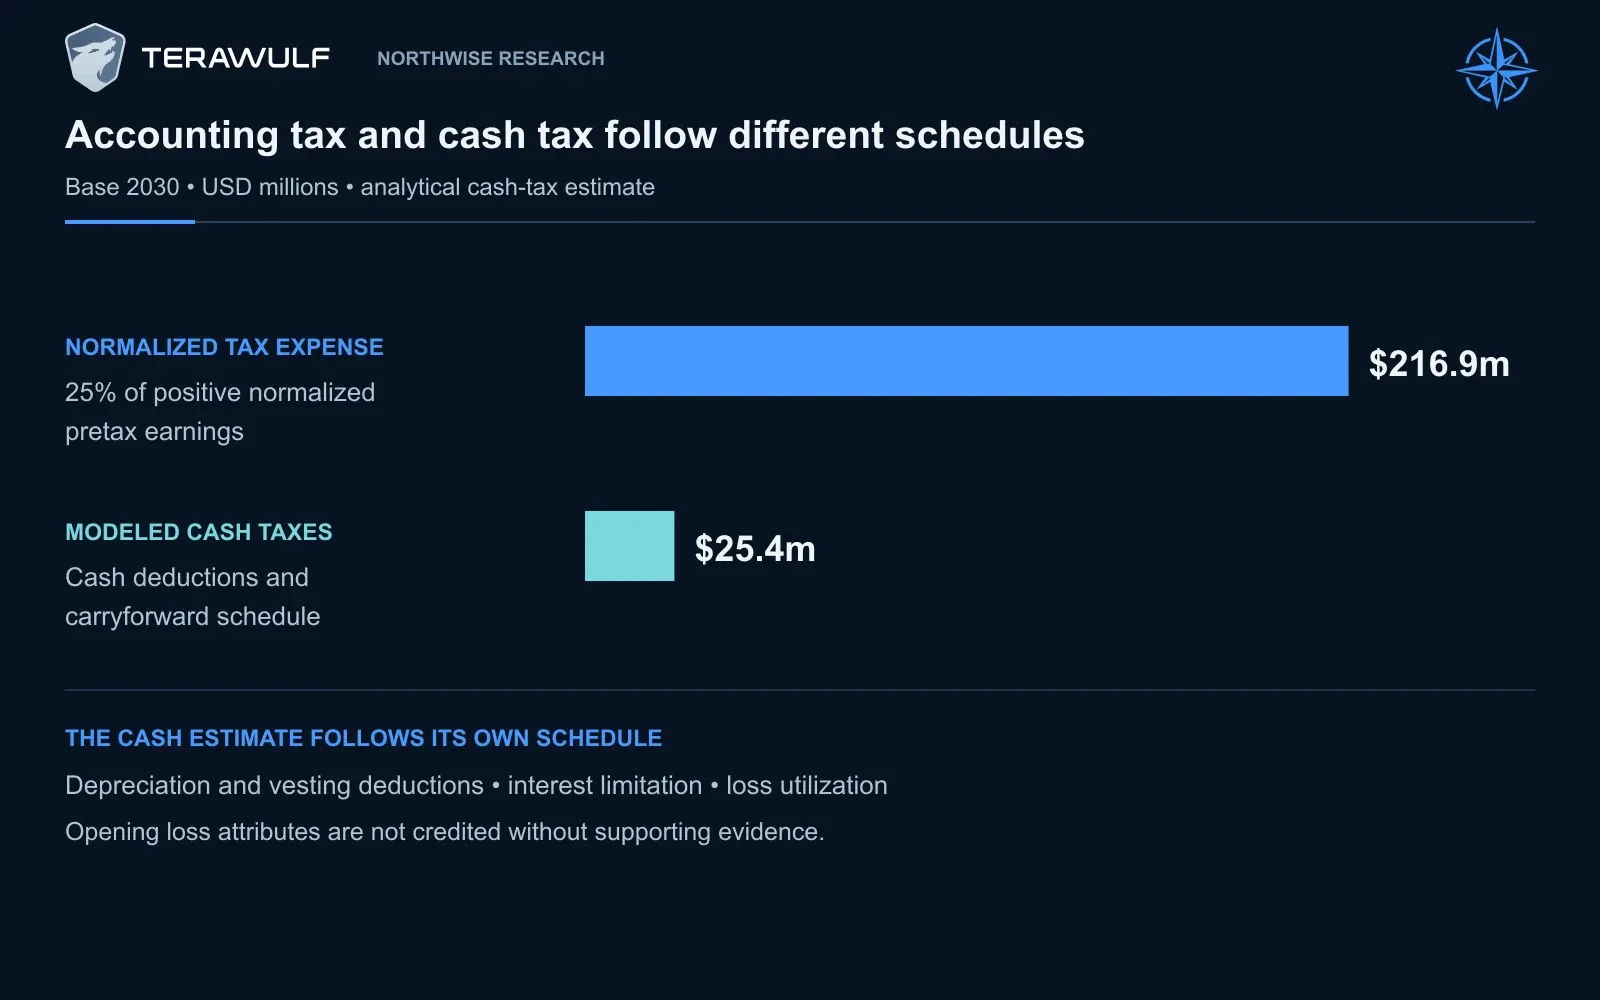
Base applies $216.9m of normalized tax expense to normalized pretax earnings, while modeled cash taxes are $25.4m after the assumed deduction and carryforward schedule.
16. The Base forecast
Base assumes that WULF completes the retained contracts, expands Lake Mariner and brings Muskie, Lake Hawkeye and Chesapeake into operation. It retains nearly all the ownership rather than relying on additional campus sales.
The company becomes much larger, but the construction program continues to outrun the cash generated by completed assets for most of the forecast. Each new campus increases earnings capacity while also demanding another contribution from the parent.
All financial amounts below are U.S. dollars in millions, except capacity, share counts and EPS. The 2026 figures combine reported first-half results with the second-half forecast. New common-equity proceeds refer only to issuance after June 2026.
Base operating and earnings forecast | 2026 | 2027 | 2028 | 2029 | 2030 |
|---|---|---|---|---|---|
Year-end operating critical IT MW | 270 | 638 | 1,039 | 1,599 | 2,359 |
Revenue | 259.6 | 1,117.9 | 2,300.3 | 3,639.4 | 5,215.1 |
Cash-rent EBITDA | (4.1) | 482.7 | 1,083.6 | 1,828.8 | 2,751.0 |
Adjusted EBITDA | 17.0 | 606.6 | 1,420.1 | 2,334.4 | 3,432.4 |
Depreciation | 120.1 | 320.1 | 527.0 | 852.4 | 1,224.0 |
Stock-compensation expense | 295.8 | 233.1 | 106.7 | 160.0 | 161.7 |
Deferred lease-cost amortization | 6.3 | 53.1 | 57.3 | 57.3 | 57.3 |
Finance-lease asset amortization | 1.5 | 3.0 | 3.0 | 3.0 | 3.0 |
Income-statement interest expense | 198.0 | 367.0 | 603.4 | 869.2 | 1,161.4 |
Interest income | 91.1 | 33.9 | 31.8 | 37.1 | 42.6 |
Normalized pretax income | (513.6) | (335.7) | 154.6 | 429.7 | 867.6 |
Normalized tax expense | 0.0 | 0.0 | 38.7 | 107.4 | 216.9 |
Normalized net income attributable to WULF | (512.6) | (338.6) | 103.6 | 322.3 | 650.7 |
Normalized basic EPS | $(1.05) | $(0.59) | $0.15 | $0.43 | $0.76 |
The earnings progression is slower than the revenue progression might suggest. Interest grows as the next properties are financed, while completed halls begin depreciating. By 2030, Base produces approximately $3.04 billion of property cash operating income, yet normalized net income attributable to WULF is about $651 million.
That does not make the property margin fictitious. It shows how much of the property economics is committed to financing and owning the assets.
Base cash flow and capital | 2026 | 2027 | 2028 | 2029 | 2030 |
|---|---|---|---|---|---|
Cash interest paid | 285.9 | 496.9 | 771.8 | 1,082.8 | 1,281.9 |
Cash income taxes | 0.0 | 0.0 | 4.3 | 11.2 | 25.4 |
Operating cash flow | (309.3) | (32.9) | 314.3 | 733.6 | 1,431.4 |
Direct construction capital | 4,008.5 | 5,386.5 | 5,991.9 | 6,140.4 | 2,107.0 |
Maintenance capital | 5.7 | 37.6 | 73.3 | 114.1 | 162.7 |
Free cash flow after construction and maintenance | (4,323.5) | (5,457.0) | (5,750.8) | (5,520.9) | (838.3) |
Employee-trust funding | 20.6 | 80.6 | 112.5 | 125.8 | 130.1 |
Cash award withholding | 199.1 | 164.0 | 36.6 | 61.8 | 57.2 |
New gross common-equity proceeds | 211.6 | 1,794.4 | 2,450.8 | 2,039.2 | 581.4 |
Ending funded debt | 7,047.4 | 10,467.3 | 14,549.9 | 18,621.5 | 19,531.6 |
Ending parent cash | 607.7 | 250.0 | 250.0 | 250.0 | 1,009.2 |
Ending project cash, including reserves | 969.5 | 646.5 | 853.8 | 1,066.6 | 642.8 |
Posted cash collateral | 395.3 | 534.5 | 673.6 | 673.6 | 673.6 |
Net property, plant and equipment | 5,895.4 | 11,237.1 | 17,073.0 | 22,840.2 | 24,150.4 |
Outstanding shares, millions | 523.10 | 624.89 | 715.47 | 777.85 | 909.38 |
Issued shares, millions | 547.06 | 648.86 | 739.44 | 801.82 | 933.35 |
Northwise forecasts. Free cash flow equals operating cash flow less direct construction and maintenance. Trust funding, award withholding, principal and other financing uses remain separate. Basic EPS uses average outstanding shares. Minority allocations and rounding explain differences between displayed pretax, tax and attributable-income rows.
Base spends approximately $23.63 billion on construction across 2026–2030 and raises $7.08 billion of additional common equity after June 2026. Outstanding shares rise from roughly 499 million to 909 million.
The terminal business is valuable enough to deserve careful valuation. It is not a small extrapolation of the company’s present footprint, and it does not arrive without a substantial change in ownership.
17. The Bear forecast
Bear assumes that WULF completes the existing contracted campuses but encounters a less favorable development environment. Optional projects move more slowly, construction costs more and financing is less accommodating.
This is a useful downside case precisely because the company still operates successfully. It does not require empty campuses or the disappearance of AI demand. WULF reaches 1,339 critical IT MW and nearly $3.39 billion of revenue, while the capital raised to get there leaves a weaker result for each share.
Bear operating and earnings forecast | 2026 | 2027 | 2028 | 2029 | 2030 |
|---|---|---|---|---|---|
Year-end operating critical IT MW | 144 | 438 | 638 | 1,139 | 1,339 |
Revenue | 216.9 | 774.1 | 1,323.2 | 2,490.0 | 3,388.8 |
Cash-rent EBITDA | (32.0) | 291.6 | 565.1 | 1,137.9 | 1,670.4 |
Adjusted EBITDA | (15.3) | 365.6 | 710.8 | 1,479.2 | 2,111.3 |
Depreciation | 110.8 | 248.9 | 323.9 | 618.9 | 852.8 |
Stock-compensation expense | 295.8 | 226.4 | 86.7 | 120.0 | 106.7 |
Deferred lease-cost amortization | 3.6 | 40.3 | 57.3 | 57.3 | 57.3 |
Finance-lease asset amortization | 1.5 | 3.0 | 3.0 | 3.0 | 3.0 |
Income-statement interest expense | 185.1 | 283.4 | 404.8 | 673.5 | 874.1 |
Interest income | 93.9 | 42.9 | 24.7 | 30.6 | 30.5 |
Normalized pretax income | (518.2) | (393.5) | (140.1) | 37.2 | 247.9 |
Normalized tax expense | 0.0 | 0.0 | 0.0 | 9.3 | 62.0 |
Normalized net income attributable to WULF | (517.2) | (393.6) | (145.4) | 25.9 | 185.9 |
Normalized basic EPS | $(1.07) | $(0.68) | $(0.19) | $0.03 | $0.17 |
Average operating capacity is 1,239 MW during 2030, producing approximately $1.90 billion of property cash income. Most of the apparent gap between that amount and attributable earnings is explained by expenses already visible in the development structure, particularly financing and depreciation.
Bear cash flow and capital | 2026 | 2027 | 2028 | 2029 | 2030 |
|---|---|---|---|---|---|
Cash interest paid | 266.9 | 346.9 | 536.7 | 737.3 | 819.5 |
Cash income taxes | 0.0 | 0.0 | 0.0 | 1.1 | 8.4 |
Operating cash flow | (310.1) | (57.6) | 41.8 | 398.9 | 856.7 |
Direct construction capital | 2,528.5 | 2,790.0 | 4,857.5 | 2,686.5 | 575.0 |
Maintenance capital | 4.3 | 26.6 | 44.8 | 79.7 | 107.3 |
Free cash flow after construction and maintenance | (2,842.9) | (2,874.2) | (4,860.5) | (2,367.3) | 174.4 |
Employee-trust funding | 20.6 | 50.9 | 59.0 | 102.1 | 57.5 |
Cash award withholding | 199.1 | 81.8 | 26.0 | 41.2 | 38.1 |
New gross common-equity proceeds | 230.6 | 650.3 | 2,576.7 | 1,566.8 | 331.5 |
Ending funded debt | 5,710.2 | 7,136.1 | 9,958.6 | 11,233.5 | 10,725.5 |
Ending parent cash | 308.4 | 250.0 | 250.0 | 250.0 | 424.1 |
Ending project cash, including reserves | 1,504.2 | 466.1 | 640.2 | 753.5 | 408.1 |
Posted cash collateral | 395.3 | 534.5 | 673.6 | 673.6 | 673.6 |
Net property, plant and equipment | 4,415.9 | 7,145.3 | 11,968.9 | 14,306.7 | 14,196.4 |
Outstanding shares, millions | 524.27 | 611.23 | 874.97 | 1,013.55 | 1,122.15 |
Issued shares, millions | 548.24 | 635.20 | 898.94 | 1,037.52 | 1,146.12 |
Construction free cash flow becomes positive in 2030 partly because expansion slows. Bear owns fewer assets than Base and has more outstanding shares. The positive cash-flow line does not make it the superior economic outcome.
Bear also remains financeable. A customer failure or prolonged closure of capital markets could produce a worse result than the one shown here.
18. The Bull forecast
The strongest favorable case is that experience improves the next project’s economics.
A repeated design can make procurement and labor requirements easier to estimate. A successful handover can strengthen the relationship with a tenant. A record of collecting rent can help the next lender assess the project. Bull assumes those benefits accumulate while WULF continues winning substantial capacity.
It combines faster delivery and stronger rent with lower construction costs, higher debt funding and cheaper borrowing. Favorable equity prices further reduce the number of shares required to supply the remaining capital.
Bull operating and earnings forecast | 2026 | 2027 | 2028 | 2029 | 2030 |
|---|---|---|---|---|---|
Year-end operating critical IT MW | 270 | 738 | 1,439 | 1,959 | 2,959 |
Revenue | 276.2 | 1,275.9 | 2,825.5 | 4,863.8 | 7,464.0 |
Cash-rent EBITDA | 8.2 | 575.3 | 1,417.3 | 2,625.4 | 4,189.0 |
Adjusted EBITDA | 31.0 | 730.7 | 1,838.8 | 3,319.7 | 5,203.7 |
Depreciation | 124.2 | 352.2 | 615.7 | 1,028.7 | 1,554.6 |
Stock-compensation expense | 295.8 | 236.4 | 121.7 | 195.0 | 221.7 |
Deferred lease-cost amortization | 7.4 | 54.1 | 57.3 | 57.3 | 57.3 |
Finance-lease asset amortization | 1.5 | 3.0 | 3.0 | 3.0 | 3.0 |
Income-statement interest expense | 203.1 | 394.4 | 664.3 | 980.7 | 1,375.0 |
Interest income | 90.9 | 34.0 | 33.6 | 40.0 | 51.7 |
Normalized pretax income | (510.1) | (275.4) | 410.5 | 1,095.1 | 2,043.8 |
Normalized tax expense | 0.0 | 0.0 | 102.6 | 273.8 | 511.0 |
Normalized net income attributable to WULF | (509.1) | (281.4) | 296.9 | 821.3 | 1,532.9 |
Normalized basic EPS | $(1.02) | $(0.47) | $0.45 | $1.17 | $1.94 |
Bull produces approximately $4.55 billion of property cash income in 2030. The operating scale is considerably larger than Base, while the cash burden remains substantial.
Bull cash flow and capital | 2026 | 2027 | 2028 | 2029 | 2030 |
|---|---|---|---|---|---|
Cash interest paid | 302.3 | 592.7 | 890.1 | 1,198.4 | 1,431.4 |
Cash income taxes | 0.0 | 0.0 | 10.5 | 27.8 | 224.5 |
Operating cash flow | (315.3) | (41.6) | 498.9 | 1,397.6 | 2,503.5 |
Direct construction capital | 5,928.5 | 6,240.0 | 6,513.0 | 7,064.0 | 2,620.0 |
Maintenance capital | 6.3 | 42.2 | 87.2 | 144.2 | 217.3 |
Free cash flow after construction and maintenance | (6,250.1) | (6,323.8) | (6,101.3) | (5,810.6) | (333.8) |
Employee-trust funding | 20.6 | 119.3 | 131.1 | 137.6 | 149.0 |
Cash award withholding | 199.1 | 218.4 | 45.5 | 82.7 | 84.3 |
New gross common-equity proceeds | 761.5 | 1,726.1 | 2,143.4 | 1,336.4 | 372.9 |
Ending funded debt | 8,550.3 | 13,044.1 | 17,834.9 | 22,938.6 | 24,340.7 |
Ending parent cash | 815.2 | 250.0 | 250.0 | 250.0 | 1,792.4 |
Ending project cash, including reserves | 815.0 | 725.6 | 943.4 | 1,174.5 | 703.3 |
Posted cash collateral | 395.3 | 534.5 | 673.6 | 673.6 | 673.6 |
Net property, plant and equipment | 7,824.7 | 14,069.1 | 20,421.1 | 26,985.0 | 28,508.8 |
Outstanding shares, millions | 557.16 | 634.53 | 684.52 | 710.00 | 840.07 |
Issued shares, millions | 581.13 | 658.49 | 708.49 | 733.97 | 864.04 |
The company raises approximately $6.34 billion of additional common equity while spending $28.37 billion on construction. It builds more than Base with less common-equity funding because the property economics, borrowing terms and issuance prices are better.
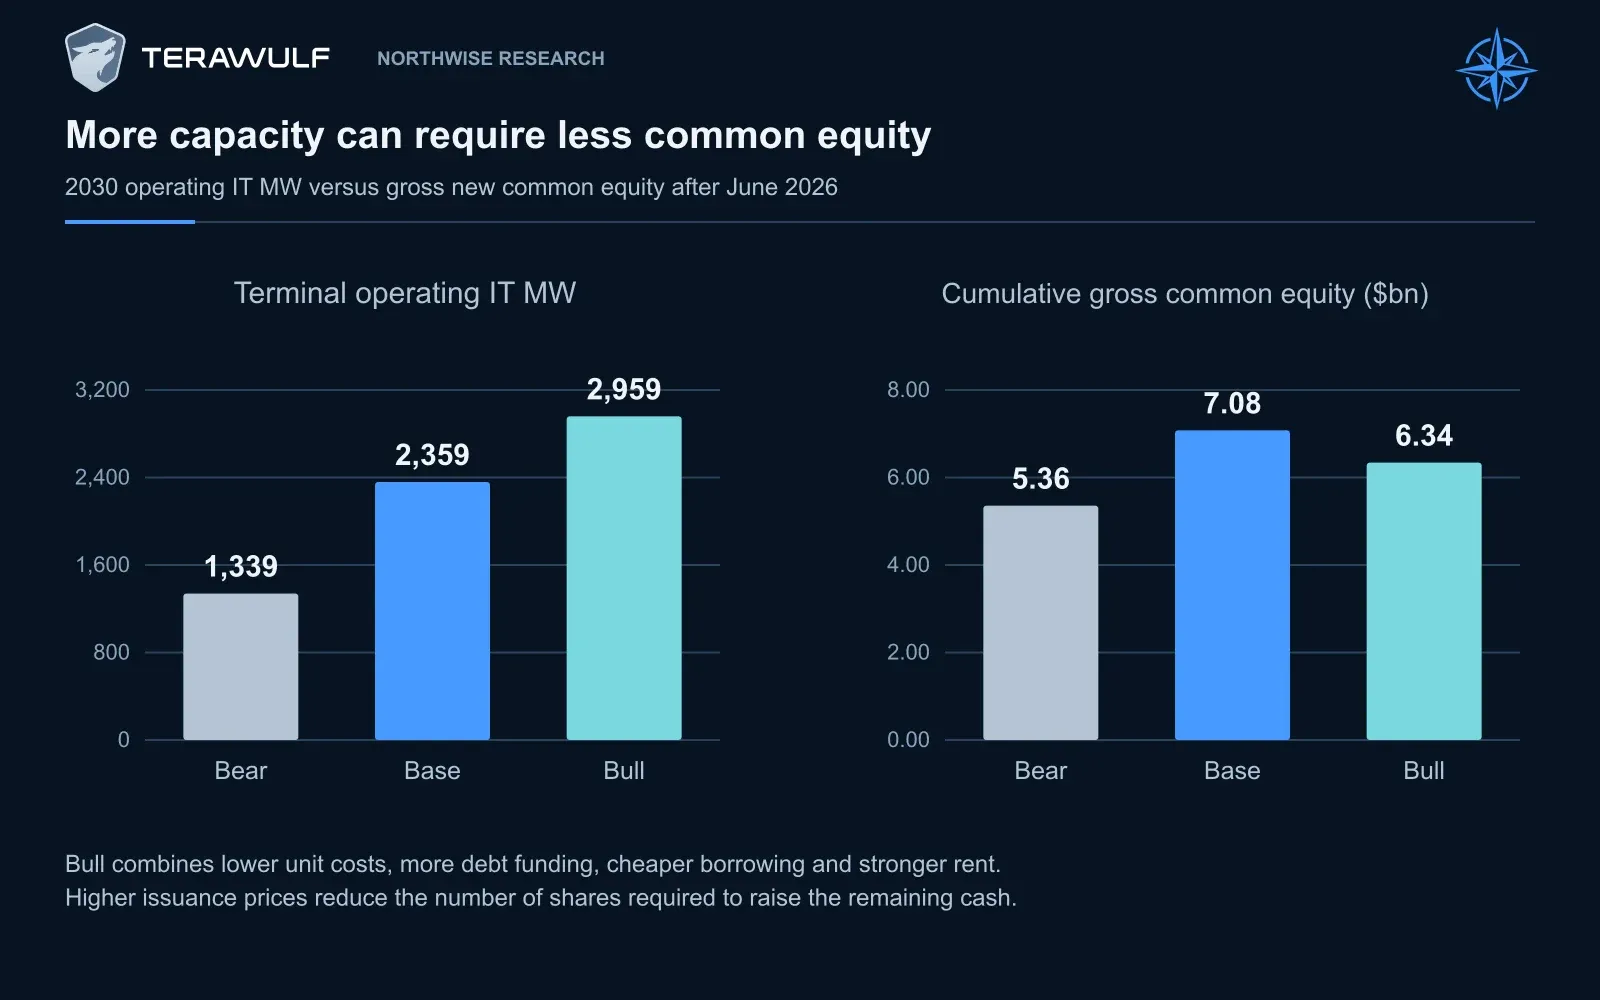
Bull reaches 2,959 IT MW with $6.34bn of cumulative new common equity, compared with Base’s 2,359 MW and $7.08bn. Bear reaches 1,339 MW while still raising $5.36bn. Development costs, debt terms and operating cash affect proceeds needed; issuance prices affect shares sold.
That possibility deserves a meaningful place in the valuation. It requires several improvements to arrive together, which is why we do not give it the same probability as the central outcome.
19. When several things go wrong together
A delayed hall does not necessarily become a bad asset. A higher coupon does not necessarily eliminate the project’s return. The risk becomes more serious when weaker operating conditions and less accommodating capital markets arrive at the same time.
For example, a slowdown in new AI investment could leave existing tenants paying rent while prospective leases take longer to negotiate. Contractors might still expect payment for committed work. Lenders could ask for more sponsor equity, and the common stock could be less favorable currency just when WULF needs to sell more of it.
Our stresses follow those effects through the operating and funding schedules.
Base operating stress | 2030 operating IT MW | 2030 revenue | Cumulative new common equity |
|---|---|---|---|
Central forecast | 2,359 | $5.22bn | $7.08bn |
Construction costs +10%, fixed loan commitments | 2,359 | $5.22bn | $9.40bn |
Construction costs +20%, fixed loan commitments | 2,359 | $5.22bn | $11.80bn |
New lease rents −10% | 2,359 | $4.97bn | $7.24bn |
New financing rates +2 percentage points | 2,359 | $5.22bn | $7.89bn |
Property margins −5 percentage points | 2,359 | $5.22bn | $7.29bn |
Uncontracted deliveries delayed 12 months | 1,599 | $3.65bn | $8.17bn |
Maintenance capital +50% | 2,359 | $5.22bn | $7.18bn |
Combined adverse conditions | 1,599 | $3.53bn | $14.03bn |
The combined case delays uncontracted deliveries twelve months, increases remaining construction costs 20%, reduces new rents 10%, raises borrowing rates two percentage points, reduces property margins five percentage points and lowers issuance and vesting prices 20%.
It still assumes the required financing can be obtained. That is a demanding assumption when the common-equity requirement has risen to approximately $14 billion.
The delay stress also preserves expenditure already committed. Some projects reach operation after 2030, so they retain development value where justified, less the remaining cost. They are neither treated as rent-producing assets before delivery nor written off merely because they miss the endpoint.
Capital-market closure requires a different response:
Restriction on the unchanged development plan | First shortfall | Cumulative unfunded requirement |
|---|---|---|
No common equity available during 2028 | January 2028 | $2.38bn |
Common authorization remains 950 million shares | March 2028 | $3.70bn |
No 2030 refinancing and no 2030 common equity | January 2030 | $2.38bn |
These are unfunded plans, not valid completed-business forecasts.
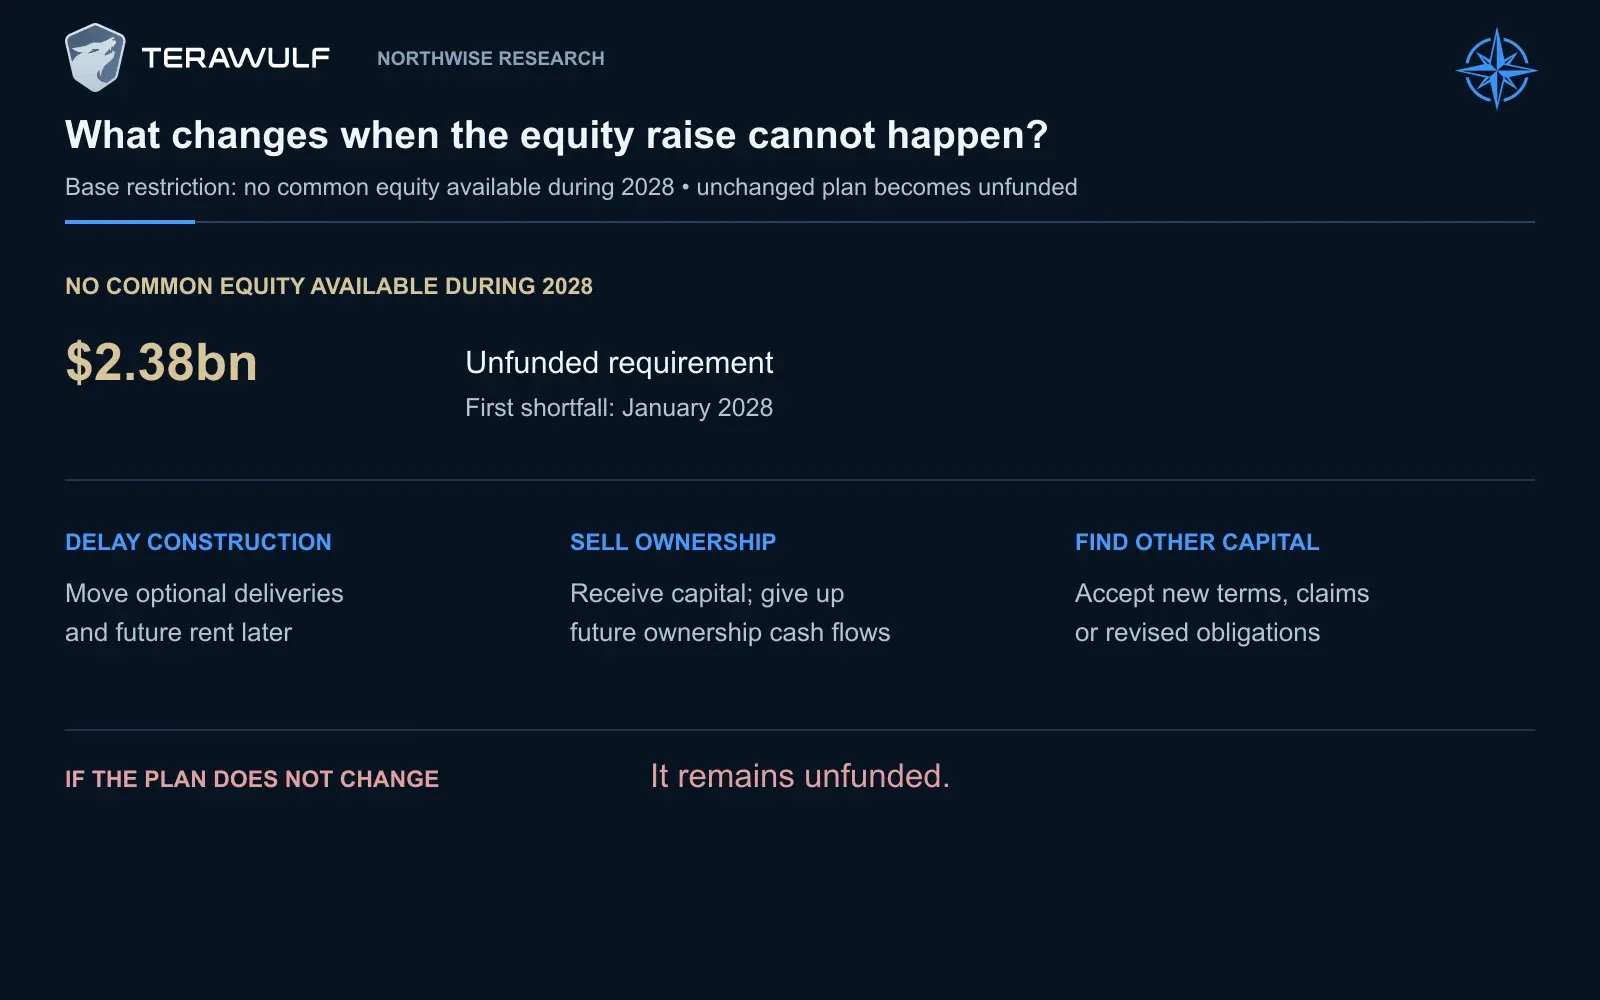
Removing 2028 common-equity access produces a first shortfall in January 2028 and a $2.38bn cumulative unfunded requirement in the fixed stress. Delaying projects, selling ownership or finding other capital changes the plan; the original complete development program cannot remain intact without funding.
WULF would have to delay discretionary development, sell ownership, obtain another source of capital or change its obligations. Each response would alter the future business. We do not assume the entire expansion survives unchanged after removing the money needed to complete it.
20. How we assess the probabilities
The scenario weights begin with the commercial and financing requirements, rather than a predetermined 25%/50%/25% split.
Our commercial reference includes three large campus-level transactions from January 2025 through September 11, 2026: Lake Mariner’s Fluidstack program at its amended 378 MW size, Abernathy’s 168 MW program and Justified’s 401 MW lease. Abernathy counts as evidence of commercial activity but remains excluded from retained operations after its sale. Core42 was signed before this observation window.
The average transaction size is approximately 316 MW across a 1.692-year observation period.
We then estimate the additional commercialization needed early enough to produce operating capacity by December 2030. There are 4.304 years to the endpoint. Our assumptions allow a normal two-year interval from contract to operation and a 40% chance of an additional nine-month delay for future developments. With a steady assumed arrival of new business, that produces an effective contracting window of approximately 2.004 years.
The timing assumptions are judgments. They are not a measured WULF failure rate, and the delay allowance is not a cancellation haircut applied to existing contracts.
Commercial requirement | Bear | Base | Bull |
|---|---|---|---|
Additional operating capacity by 2030 | 500 MW | 1,520 MW | 2,120 MW |
Required annual commercialization during the effective window | 250 MW | 759 MW | 1,058 MW |
Annual transactions at the observed average size | 0.79 | 2.40 | 3.35 |
Base and Bull require throughput above management’s current 250–500 MW annual contracting target under this timing convention. That could come from larger transactions, more transactions or shorter delivery intervals. It is an additional achievement in the forecast, not something established by the existing contracts.
We use a negative-binomial likelihood, a count model that allows transactions to arrive unevenly. The dispersion parameter is four, an explicit choice allowing substantial variability rather than a parameter estimated reliably from three observations.
Financing is assessed against the existing 7.75% project coupon and management’s approximately 68% pro forma debt capitalization following amendments and added equity. Our future project assumptions range from 9% borrowing at 65% funding in Bear to 6.25% borrowing at 80% funding in Bull. The historical capitalization measure and future direct-cost loan-to-cost are not identical denominators, limiting the precision of the comparison.
We allow uncertainty of 1.5 percentage points around the coupon and eight percentage points around the debt share, with a negative 0.50 correlation. The correlation represents a financing environment in which stronger credit support can permit both cheaper debt and larger advances.
Starting from equal scenario priors:
P(s | E) = [P(s) × Lcommercial,s × Lfinancing,s] ÷ Σⱼ [P(j) × Lcommercial,j × Lfinancing,j]
Probability calculation | Bear | Base | Bull |
|---|---|---|---|
Commercial likelihood | 0.0993 | 0.1549 | 0.1180 |
Financing compatibility factor | 0.7058 | 0.6770 | 0.3114 |
Calculated scenario weight | 33.1% | 49.5% | 17.4% |
Base receives the strongest support, while Bull is penalized for requiring a greater improvement in both commercial scale and financing terms.
These are evidence-informed, model-implied probabilities conditional on the selected regimes. The sample is small. The starting prior, delivery assumptions, dispersion and financing tolerances influence the result, and the calculation assumes conditional independence between commercial and financing evidence after selecting a scenario.
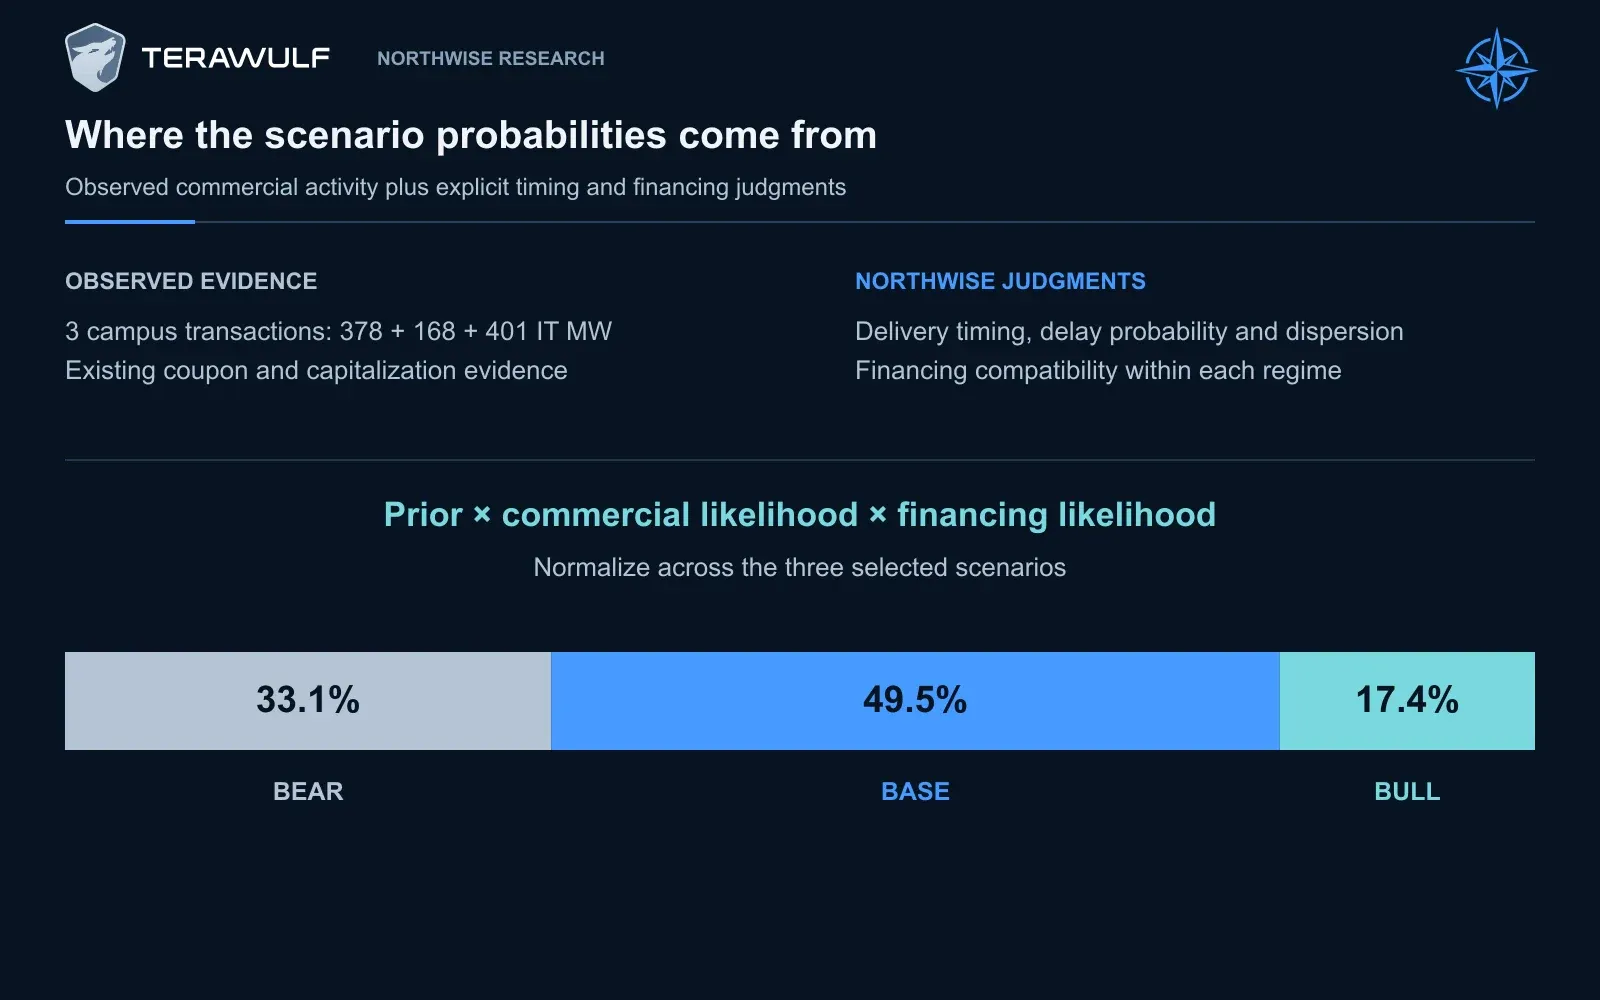
Northwise combines three observed campus-level transactions with assumed delivery timing, transaction variability and financing compatibility. Normalization produces 33.1% Bear, 49.5% Base and 17.4% Bull weights, conditional on the three financed regimes.
We use the method to make the judgment inspectable. It does not turn limited evidence into statistically established odds or make the three scenarios exhaustive.
21. What we need to see next
The next useful operating update will connect a delivery milestone with the cost of reaching it.
Accepted halls establish when rent can begin. Updated cash-to-complete estimates show whether that delivery preserved the intended economics. Completed financing reveals the sponsor contribution, the reserve requirements and the eventual route for cash back to the parent.
The next lease deserves the same attention. Its megawatts tell us the scale, but starting cash rent, escalation, customer credit and required infrastructure determine whether it is better business. A larger nominal contract can still demand a greater early equity contribution.
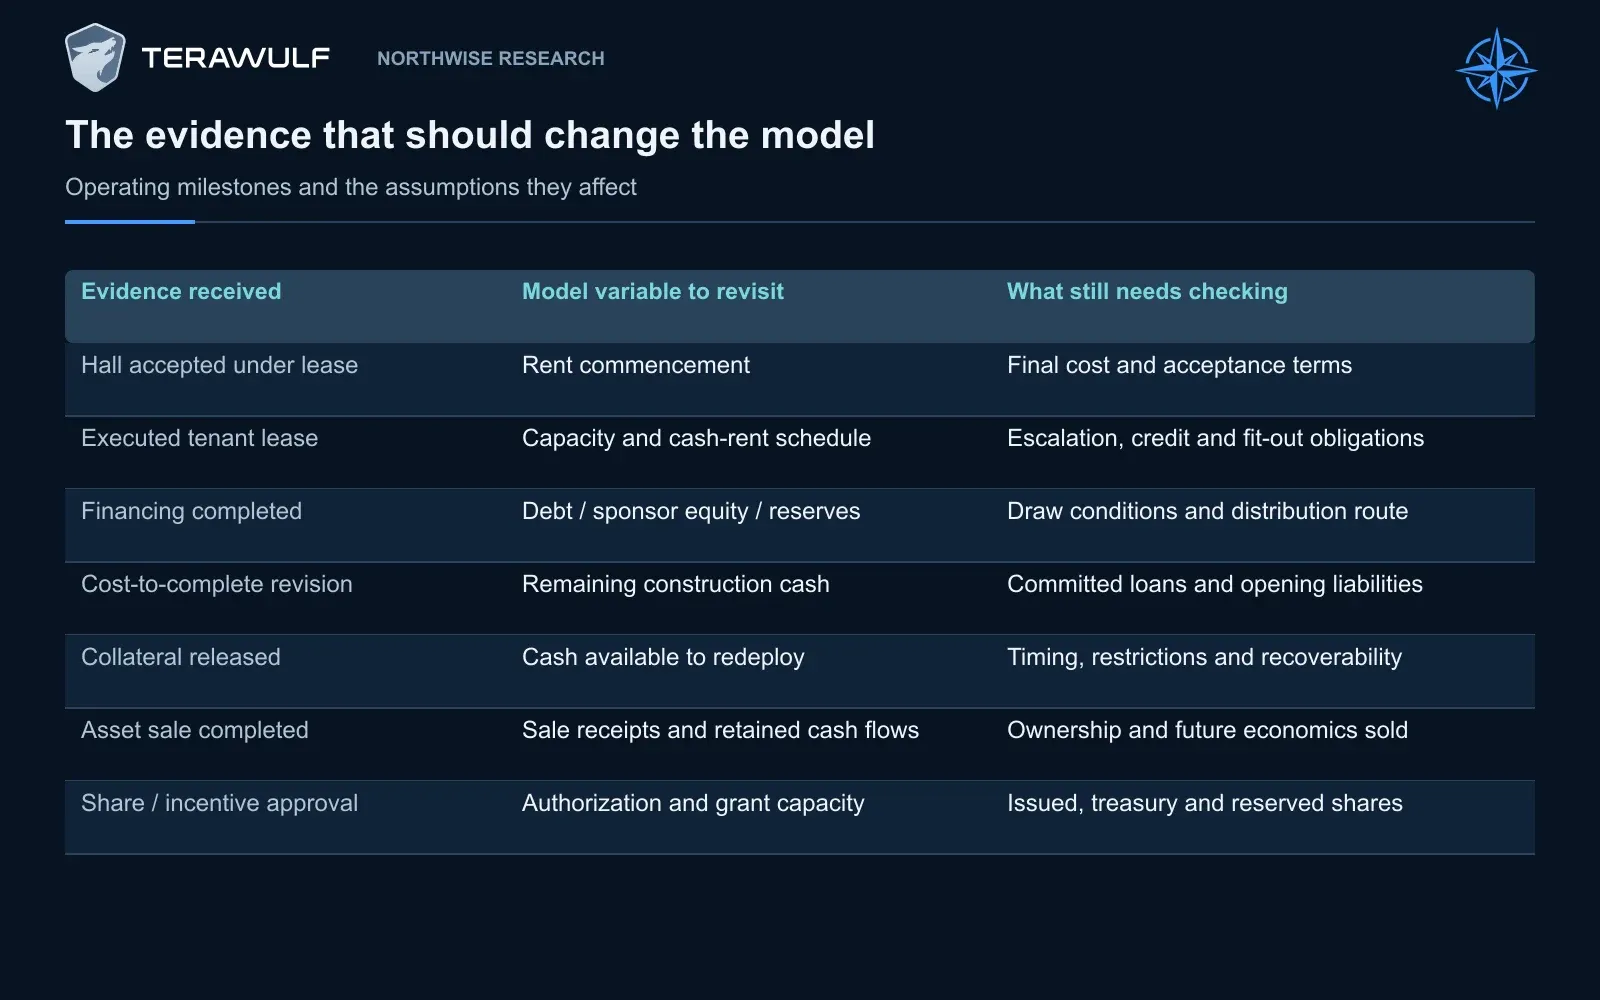
Future model changes should follow accepted halls, executed lease terms, completed financing, revised costs to complete, collateral releases, asset sales and authorization approvals. A headline alone does not establish each cash-flow effect.
We will also watch management’s willingness to choose among projects. Abernathy showed that WULF can realize value without retaining an asset indefinitely. Where the common stock is an expensive source of capital for existing holders, another appropriately priced sale could be preferable to owning more of the portfolio.
The favorable operating development would be evidence that each new project becomes easier to specify, deliver and finance. That is how execution experience can become a lasting economic advantage rather than simply an ability to manage more construction.
Our Base forecast assumes WULF grows well beyond the retained contracts. It also charges the company for the funding required to do so. The valuation begins with that larger business and the ownership that remains after it has been financed.
From operating growth to shareholder returns
The operating forecast shows what WULF could build and earn. Northwise Premium follows that forecast through project debt, future equity issuance and the value left per share.
Continue for our valuation scenarios, expected returns, entry-price framework and combined financing stresses.
Northwise Premium
Choose how to continue with Northwise
Join Northwise Premium
Unlock the rest of this report, its complete valuation, the downloadable model, portfolios, and action framework.
Join Northwise PremiumCreate a Free Account
Continue across Free Northwise research, follow companies, save reports, and receive updates.
Create a Free Account
What is WULF Stock?
What is WULF Stock? TeraWulf is shifting from bitcoin mining to AI data centers through Lake Mariner, Abernathy, and Fluidstack.

Jumia Stock Forecast 2030: The Business Beyond Breakeven
Explore Northwise’s Jumia stock forecast for 2030: country growth, unit economics, cash flow, dilution and three valuation scenarios, with a financial model.

SNOW Stock Forecast 2030: The Business Behind Enterprise AI
Northwise’s SNOW stock forecast for 2030 examines enterprise AI, consumption growth, margins and dilution, with a downloadable Snowflake FY31 model.
Northwise Portfolios
See how the research becomes real decisions
Reader discussion
Discuss the research
Premium access is required to join this report's discussion.
Join Northwise Premium
No comments yet. Start a thoughtful discussion.