Jumia Stock Forecast 2030: The Business Beyond Breakeven

Explore Northwise’s Jumia stock forecast for 2030: country growth, unit economics, cash flow, dilution and three valuation scenarios, with a financial model.
Francis Dufay has rebuilt the economics of selling online across Africa. We believe the next opportunity lies in what Jumia can do with that stronger foundation: finance its own growth, reach more customers, and develop a lasting continental commerce platform.
On Jumia’s May earnings call, Antoine Maillet-Mezeray had an expense increase he wanted investors to welcome. Sales and advertising spending had risen 64%, to $5.1 million. The company was still losing money, still reducing headcount, and still promising breakeven later in the year.
“We view this increase positively,” its finance chief said. Better product availability, service quality, and customer retention were allowing Jumia to put more money into marketing while improving the economics of the business. On the same call, management discussed removing another 200 employees from an organization already less than half its former size.
For investors who remember Jumia’s earlier expansion, that combination deserves scrutiny. Spending more to grow was never the difficult part. The difficulty was getting customers to return often enough, at an attractive enough cost, to pay for the infrastructure built around them.
A serious skeptic can accept that Dufay has improved the company and still doubt what comes next. Perhaps Jumia is becoming a more efficient operator in markets whose purchasing power, currencies, and delivery costs will always constrain its economics. Perhaps the approach to profitability depends on a spending restraint that renewed expansion would undo.
Our view is more constructive. Jumia’s improving contribution from each order gives management a stronger foundation for investment than it had before. The opportunity within its existing countries remains substantial, international sellers are still building their African businesses, and advertising and warehousing are becoming more valuable as marketplace activity increases.
We therefore expect successful cost discipline to lead to higher spending. Self-funding would allow Jumia to pursue more of the opportunities it has spent years preparing to serve, without making each new initiative dependent on another equity raise.
That future is not secured. The first profitable year in our Base case has little room for disappointment, and the company’s continental ambitions must survive the economics of individual countries. But a forecast that assumes Jumia becomes leaner indefinitely would miss the purpose of the turnaround. The point of making growth more productive is to earn the ability to do more of it.
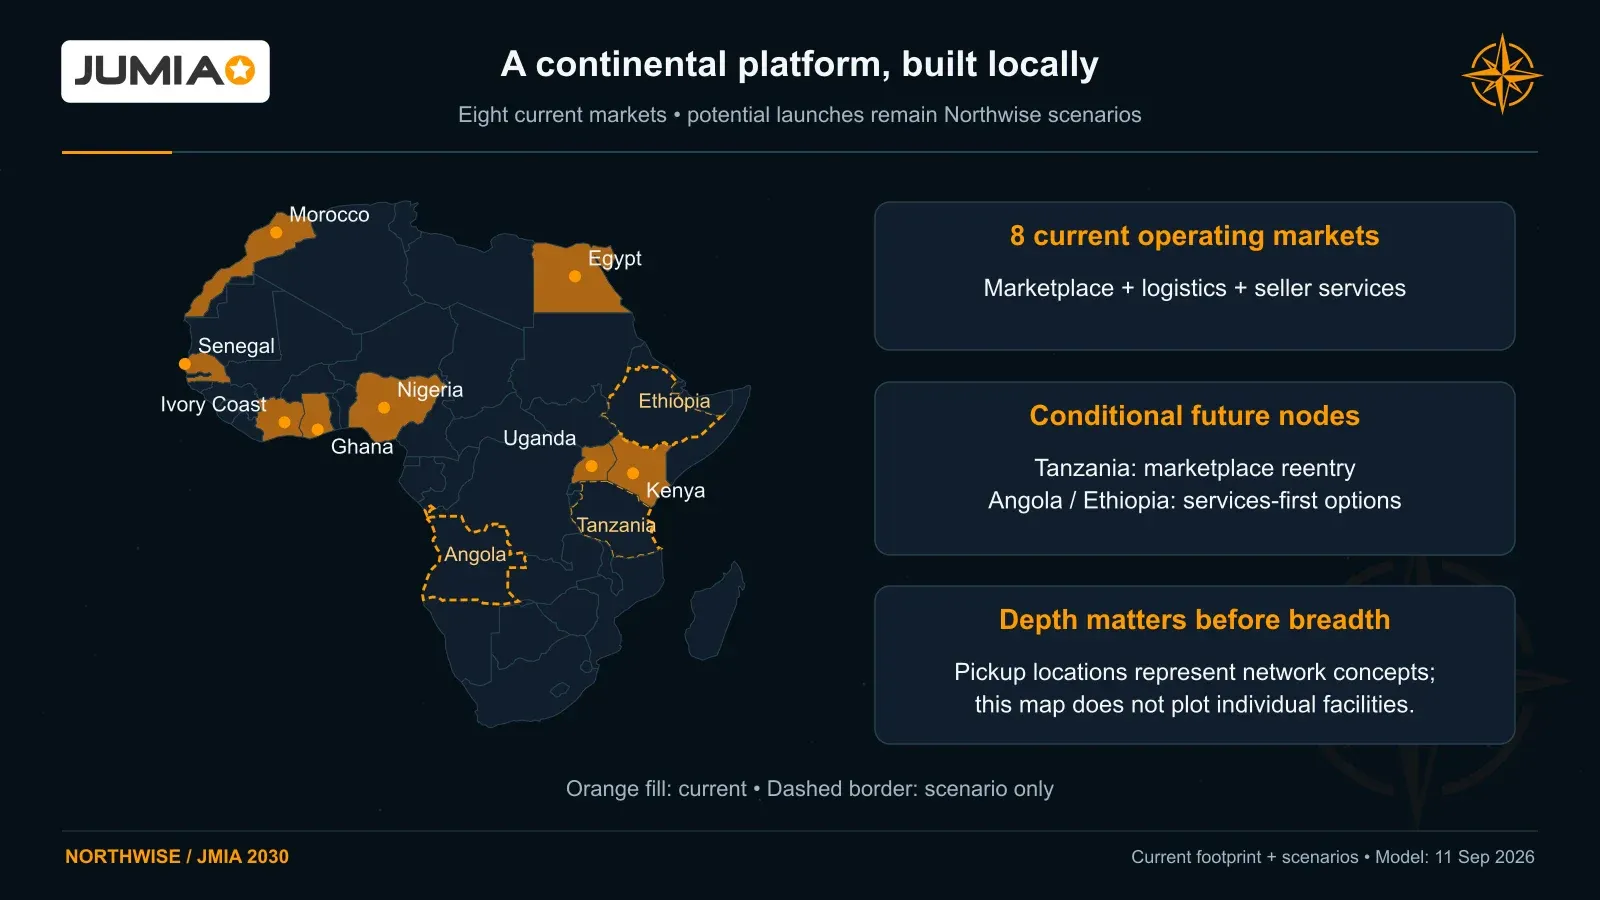
Jumia’s eight current markets are highlighted in orange; Tanzania, Angola and Ethiopia are outlined as conditional Northwise expansion scenarios.
Contents
11) Base case: the existing footprint finances a larger business
16) Valuing a company that is still investing Premium
17) The platform premium and the cash-flow test Premium
18) Annual valuations through 2030 Premium
19) Separating execution from market recognition Premium
20) What the targets imply for returns Premium
21) The Northwise required-return ladder Premium
22) Valuation under pressure Premium
23) The Northwise investment view Premium
1. A slower headline, a healthier business
Jumia’s second quarter gave both sides of the argument something to work with.
Growth in gross merchandise value, or GMV, slowed to 23% after adjusting for Algeria’s exit, compared with 32% in the first quarter. Management lowered its full-year GMV growth outlook to 20%–30%, while retaining its expected adjusted EBITDA loss of $25 million–$30 million and its objectives for breakeven and positive cash flow in the fourth quarter.
That was a real reduction in the growth outlook. It should not be dismissed because other metrics improved.
Yet the composition of the quarter was considerably better than the headline suggested. Physical-goods orders grew faster than GMV. The average basket became smaller, while the gross profit earned from an order increased. Advertising and seller services grew rapidly, and the adjusted EBITDA loss narrowed.
Reported operating measure | Q1 2026 | Q2 2026 |
|---|---|---|
GMV | $211.2M | $216.3M |
GMV growth, excluding Algeria | 32% | 23% |
Physical-goods orders | 5.9M | 6.3M |
Physical-goods order growth, excluding Algeria | 31% | 28% |
Quarterly active customers | 2.5M | 2.6M |
Revenue | $50.6M | $52.0M |
Gross profit | $29.4M | $30.7M |
Gross profit as a share of GMV | 13.9% | 14.2% |
Adjusted EBITDA | $(10.7)M | $(8.7)M |
Operating cash outflow | $12.5M | $11.8M |
The growth percentages above use Jumia’s continuing-market comparisons. They are not all the growth rates that would result from dividing the displayed reported totals.
The category mix explains much of the apparent contradiction. Phones and electronics receded while home and living gained share. Compared with Q2 2025, physical-goods average order value fell from $36.30 to $34.60 in Q2 2026, but gross profit per physical-goods order increased from approximately $4.80 to $4.90. Jumia was processing more orders in categories that could generate better monetization despite their lower ticket prices.
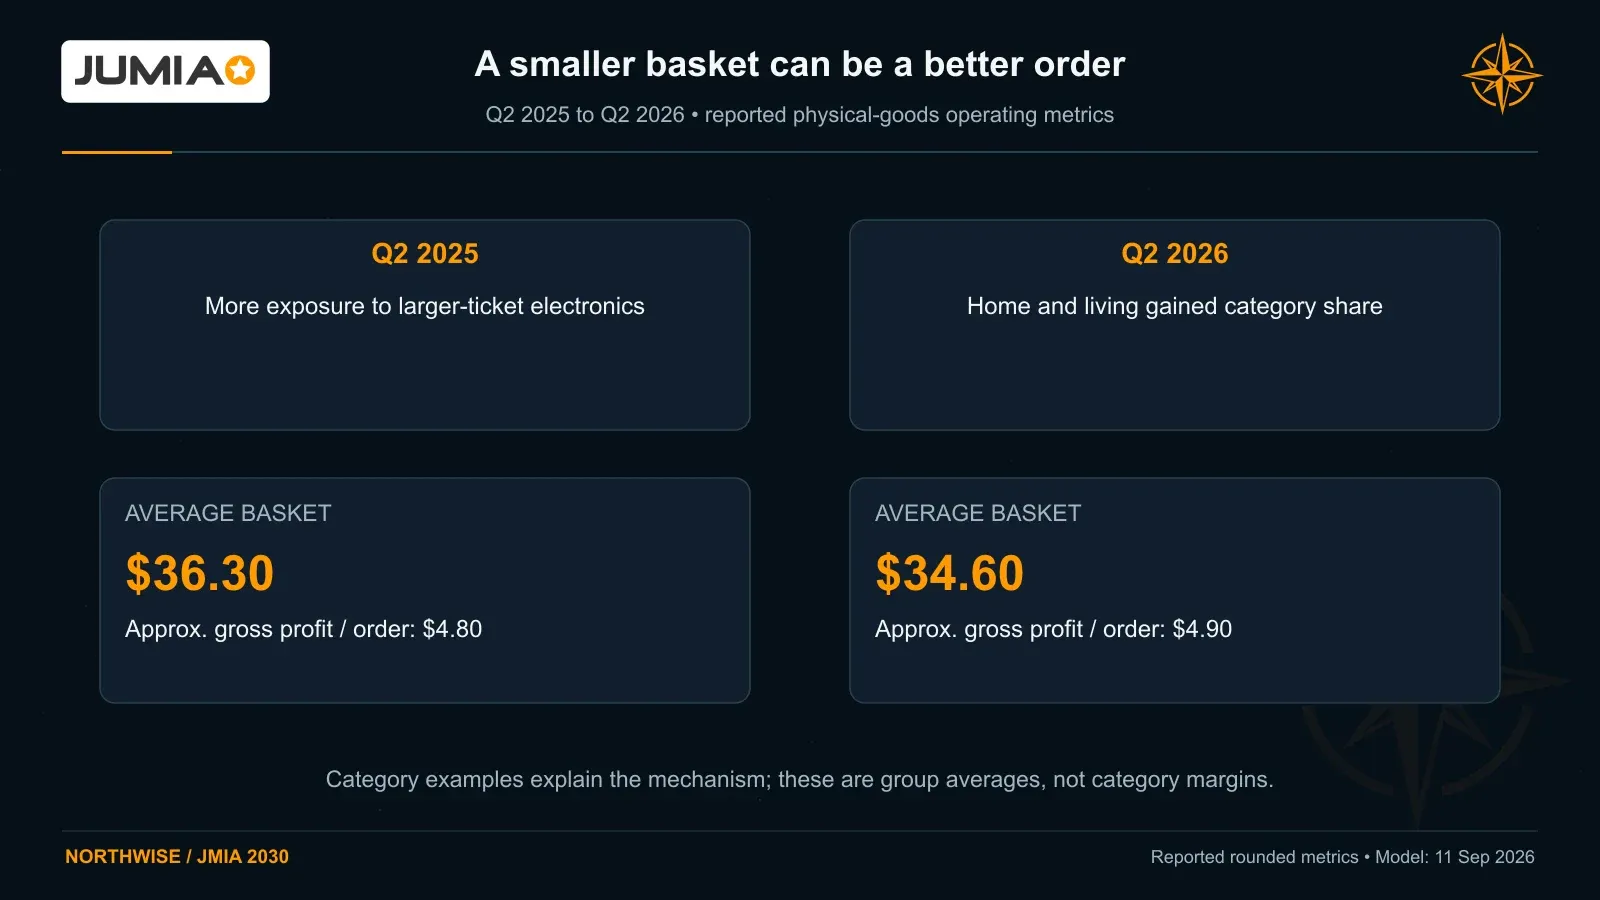
Jumia’s average physical-goods basket declined from $36.30 in Q2 2025 to $34.60 in Q2 2026 while reported gross profit per order increased from approximately $4.80 to $4.90.
The improvement survived customer-acquisition spending. Gross profit after fulfillment and sales and advertising expense reached approximately $12.5 million, against $8.9 million a year earlier. That is the amount left to support technology, administration, and the rest of the organization. It is a more revealing checkpoint than either GMV growth or reported revenue on its own.
We read the quarter as evidence that Jumia’s operating model is becoming more resilient. Weakness in a large-ticket category did not prevent the company from improving its contribution economics. We do not read it as evidence that demand has become predictable, or that higher-margin categories can offset every future disruption.
The distinction is visible in cash. Jumia’s liquidity declined by $14.3 million during Q2, even as its adjusted EBITDA loss improved. Working capital can absorb the benefit of a better income statement, particularly while a company is preparing inventory and supply for future sales.
The business is improving. The timing of cash generation still requires close attention.
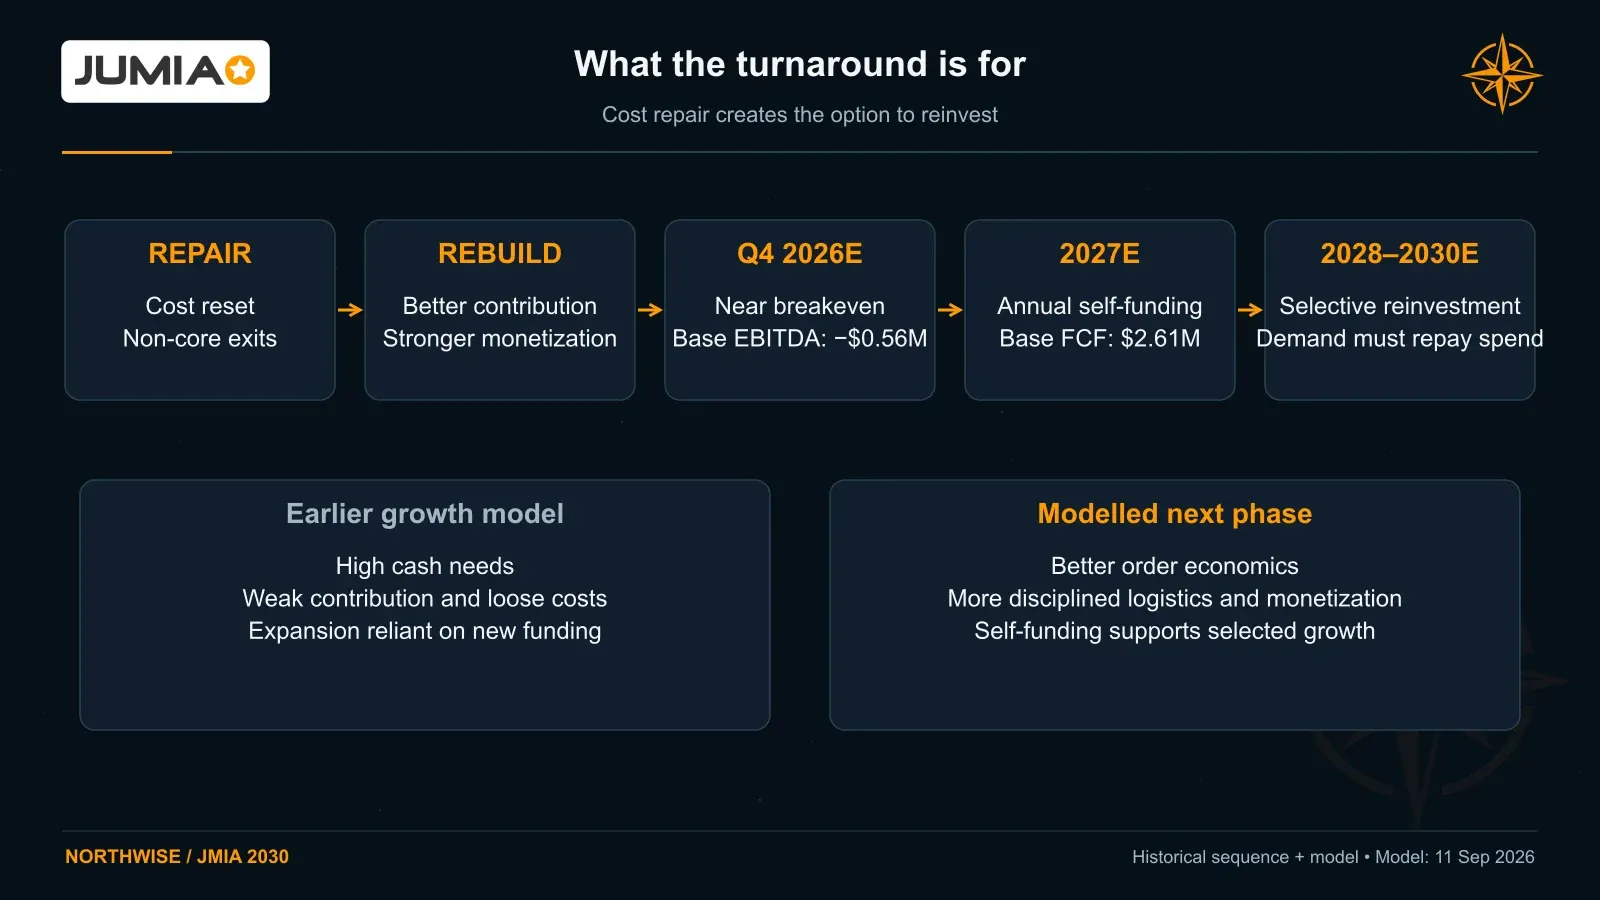
Jumia’s turnaround moves from cost and margin repair toward conditional 2027 self-funding and a 2028–2030 investment phase; Q4 2026 remains near breakeven in Base.
2. What Jumia earns from an order
A customer can buy the same product through Jumia under two arrangements that produce very different reported revenue.
When Jumia owns the merchandise and sells it itself, it records the sale as first-party revenue and deducts the merchandise cost. When a third-party seller owns the merchandise, Jumia records its fees rather than the full value of the product. Advertising, warehousing, and other seller services add further revenue around the transaction. Jumia’s revenue presentation therefore changes with the role it plays in the sale, even when the customer experience looks similar.
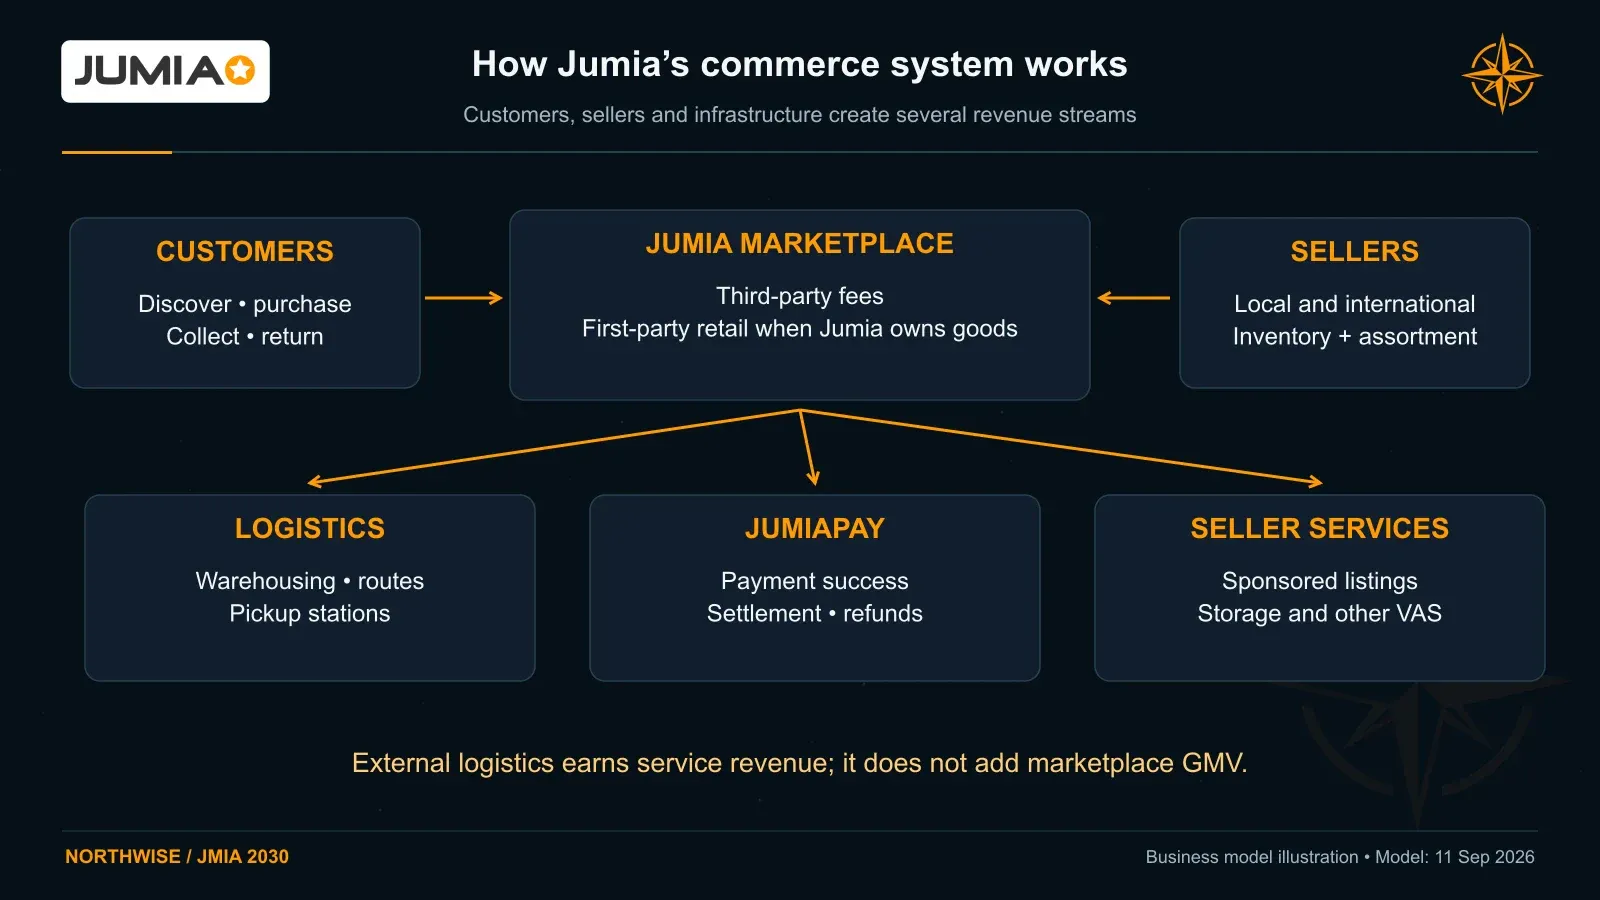
Jumia connects customers with third-party sellers and first-party retail, supported by logistics, pickup stations, payments, advertising and warehousing.
Consider two illustrative $100 orders. In one, Jumia buys inventory for $85 and sells it for $100. It reports $100 of revenue and $15 of gross profit before fulfillment and other operating costs. In the other, a seller owns the inventory and pays Jumia $15 in fees. Jumia reports $15 of revenue rather than $100.
The two transactions can generate similar gross profit while producing radically different revenue figures. Their working-capital exposure is also different because somebody else finances the inventory in the marketplace transaction.
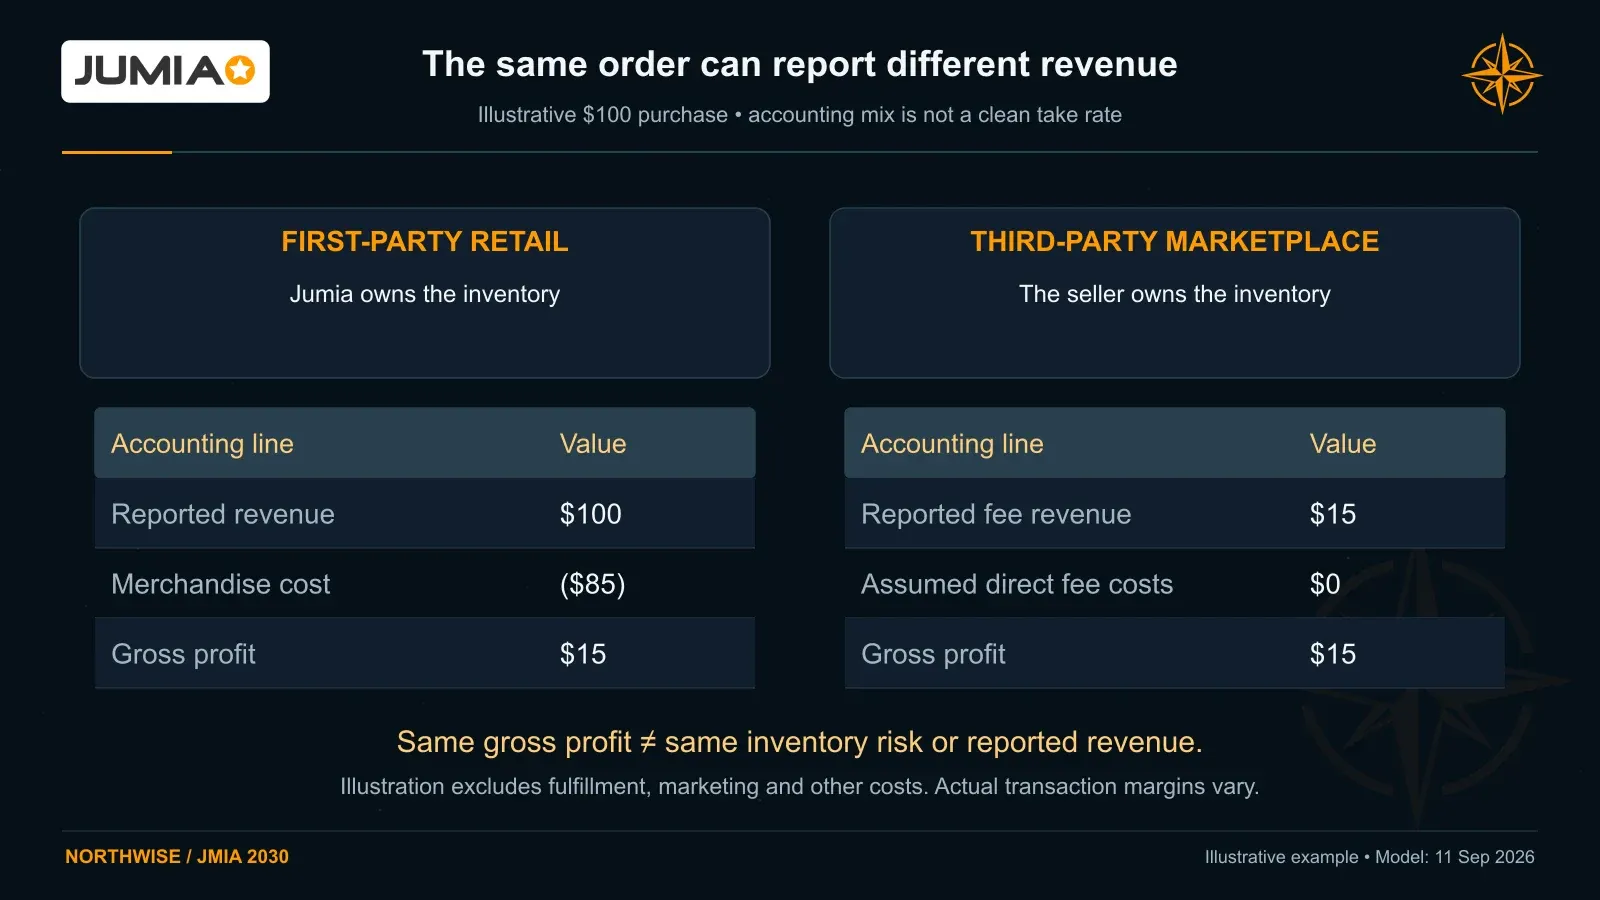
Illustrative first-party retail records $100 revenue and $85 merchandise cost; a marketplace transaction records $15 fees. Both can leave $15 gross profit before fulfillment.
This is why we do not treat revenue divided by GMV as a clean commission rate. It combines gross merchandise revenue, marketplace fees, and service revenue. A shift toward first-party retail can increase that ratio without a corresponding improvement in the economic value of the platform.
Q2 provided a practical example. First-party revenue declined, while marketplace revenue grew substantially faster than consolidated revenue. Gross profit also grew faster than revenue. The company’s accounting mix made the top line look less impressive than the underlying monetization.
GMV itself needs careful interpretation. Jumia defines it as the value of orders including shipping fees and value-added tax, before discounts or vouchers, and irrespective of cancellations or returns. Orders and active-customer measures also include activity that may subsequently be canceled or returned. These are useful measures of demand entering the platform, but they are not the same as completed, cash-generating transactions.
Our analysis follows the money further. We separate first-party sales from marketplace fees, advertising, seller services, and external logistics. We then deduct merchandise costs, fulfillment, and Jumia’s own marketing expenditure before considering corporate expenses.
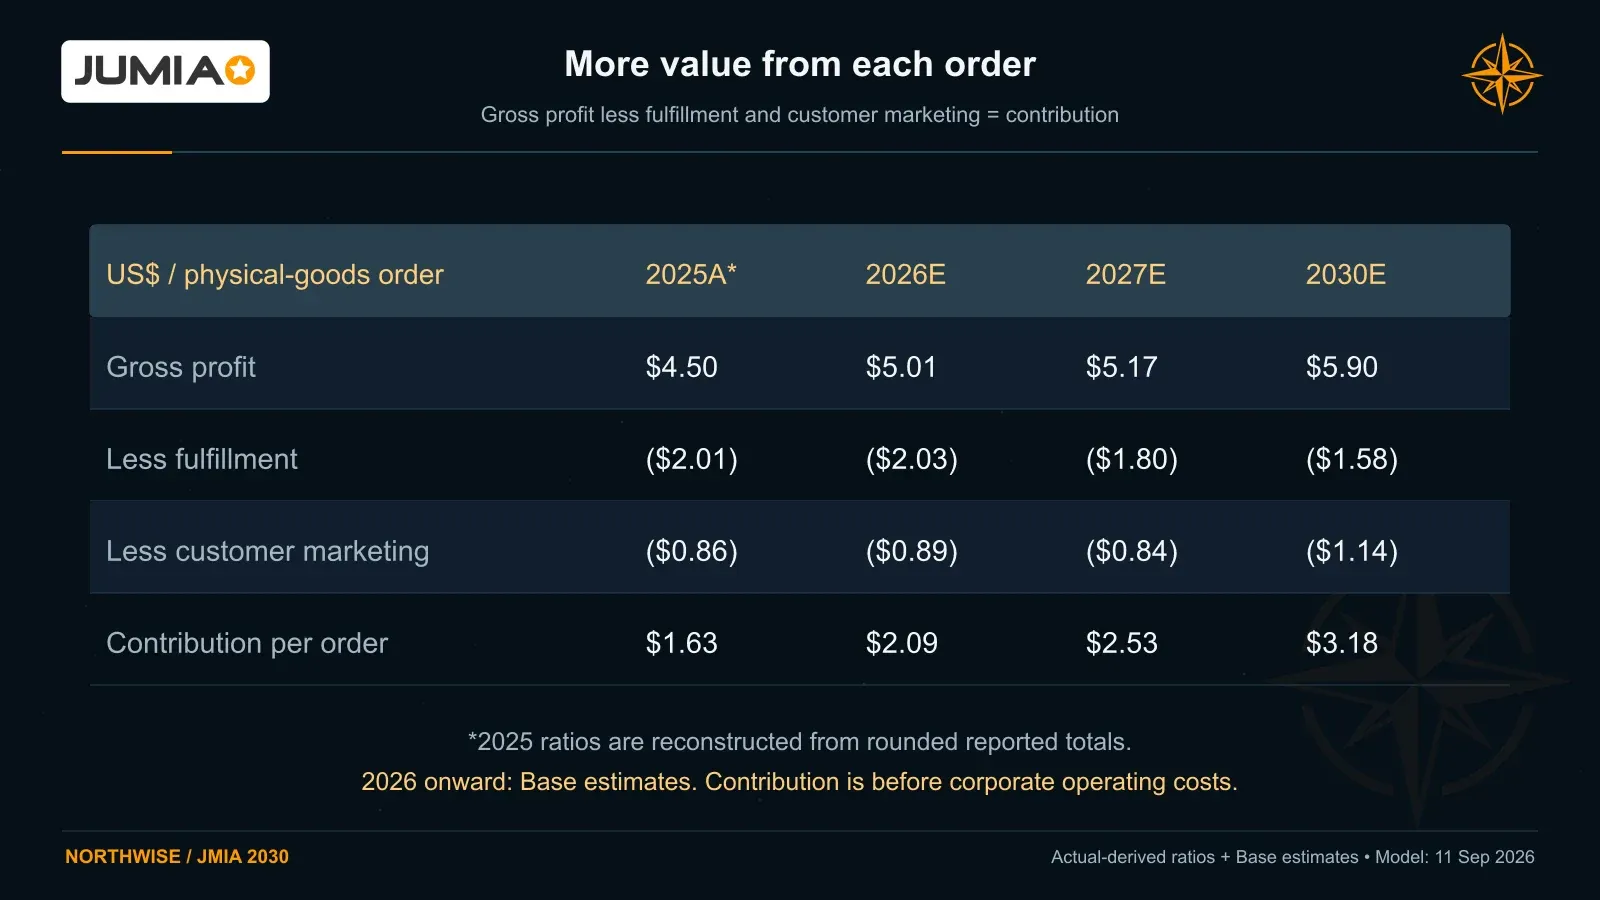
Northwise’s per-order bridge compares 2025 actual-derived ratios with 2026, 2027 and 2030 Base forecasts, showing contribution rising from $1.63 to $3.18 per order.
Advertising deserves one additional clarification. Advertising revenue is money sellers pay Jumia for visibility. Sales and marketing expense is money Jumia spends to attract and retain customers. A growing advertising business does not mean the company can stop spending on customer acquisition.
JumiaPay fits into this operating system as payment infrastructure. Its usefulness lies in helping customers complete purchases and supporting payment, settlement, and refund processes. Jumia discontinued quarterly payment-volume and gateway-transaction disclosures beginning in Q1 2026 after narrowing its strategic focus toward physical goods. We assign it no separate fintech business in the forecast.
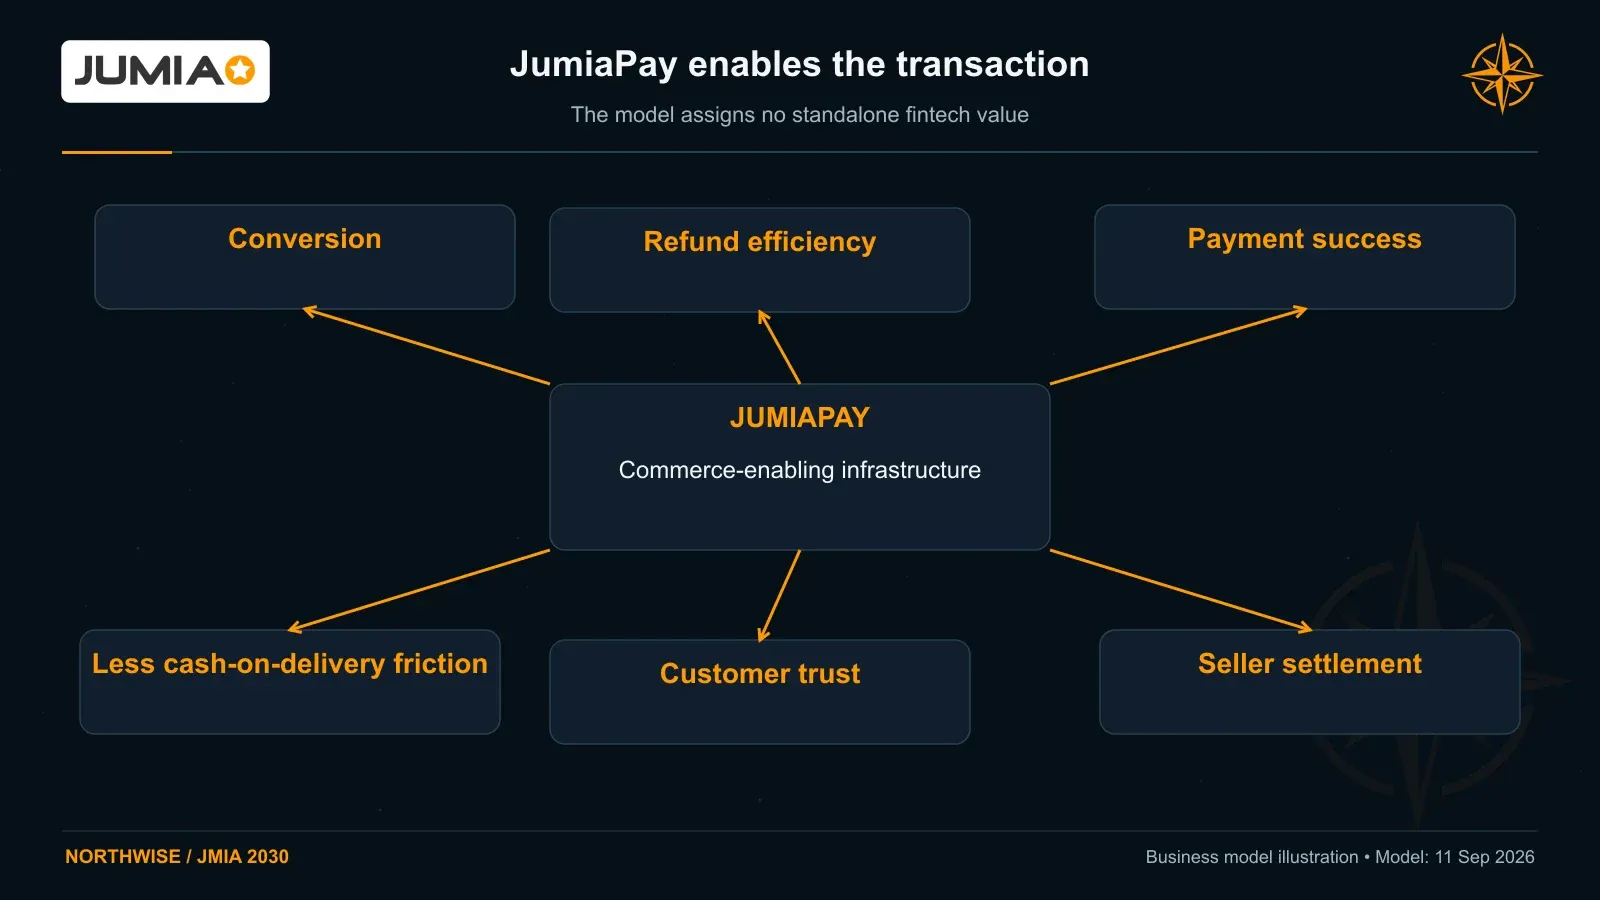
JumiaPay supports checkout, payment success, seller settlement and refunds; Northwise treats it as commerce infrastructure with no standalone fintech valuation.
3. Distribution determines the market
For an online retailer operating in a well-served city, a new delivery point may improve convenience. For Jumia, opening a pickup station can make an entirely new group of customers economically reachable.
Dufay described this directly on the Q1 call. A city without an established distribution network was effectively outside Jumia’s addressable market. He estimated that its Nigerian network had recently covered cities representing roughly one-third of the country’s population, compared with closer to 60% in the more mature Ivory Coast business. Those figures describe distribution coverage, not customer penetration or market share.
That changes how we think about runway. Jumia does not have to enter another country to expand the population it can serve. It can deepen its presence within countries where it already has a brand, supplier relationships, and an operating organization.
The pickup model also changes delivery economics. Instead of sending a vehicle to many individual addresses, Jumia can consolidate packages at a collection point. The customer accepts some responsibility for the final part of the journey in return for access, convenience, or a more attractive delivery proposition.
At sufficient volume, that can improve the number of packages moved per route and reduce the costs associated with dispersed home deliveries. It can also make an otherwise unattractive geography viable.
The constraint is density. A pickup station with too few orders still needs servicing, and a wider network can initially increase complexity before it increases efficiency. More locations are valuable when they produce enough repeat activity to justify the routes connecting them.
By Q2, pickup stations accounted for 75% of shipped packages, up from 71% a year earlier. Orders from outside the main urban centers represented 61% of gross orders. These figures show that Jumia’s business already extends well beyond a narrow affluent-capital-city customer base.
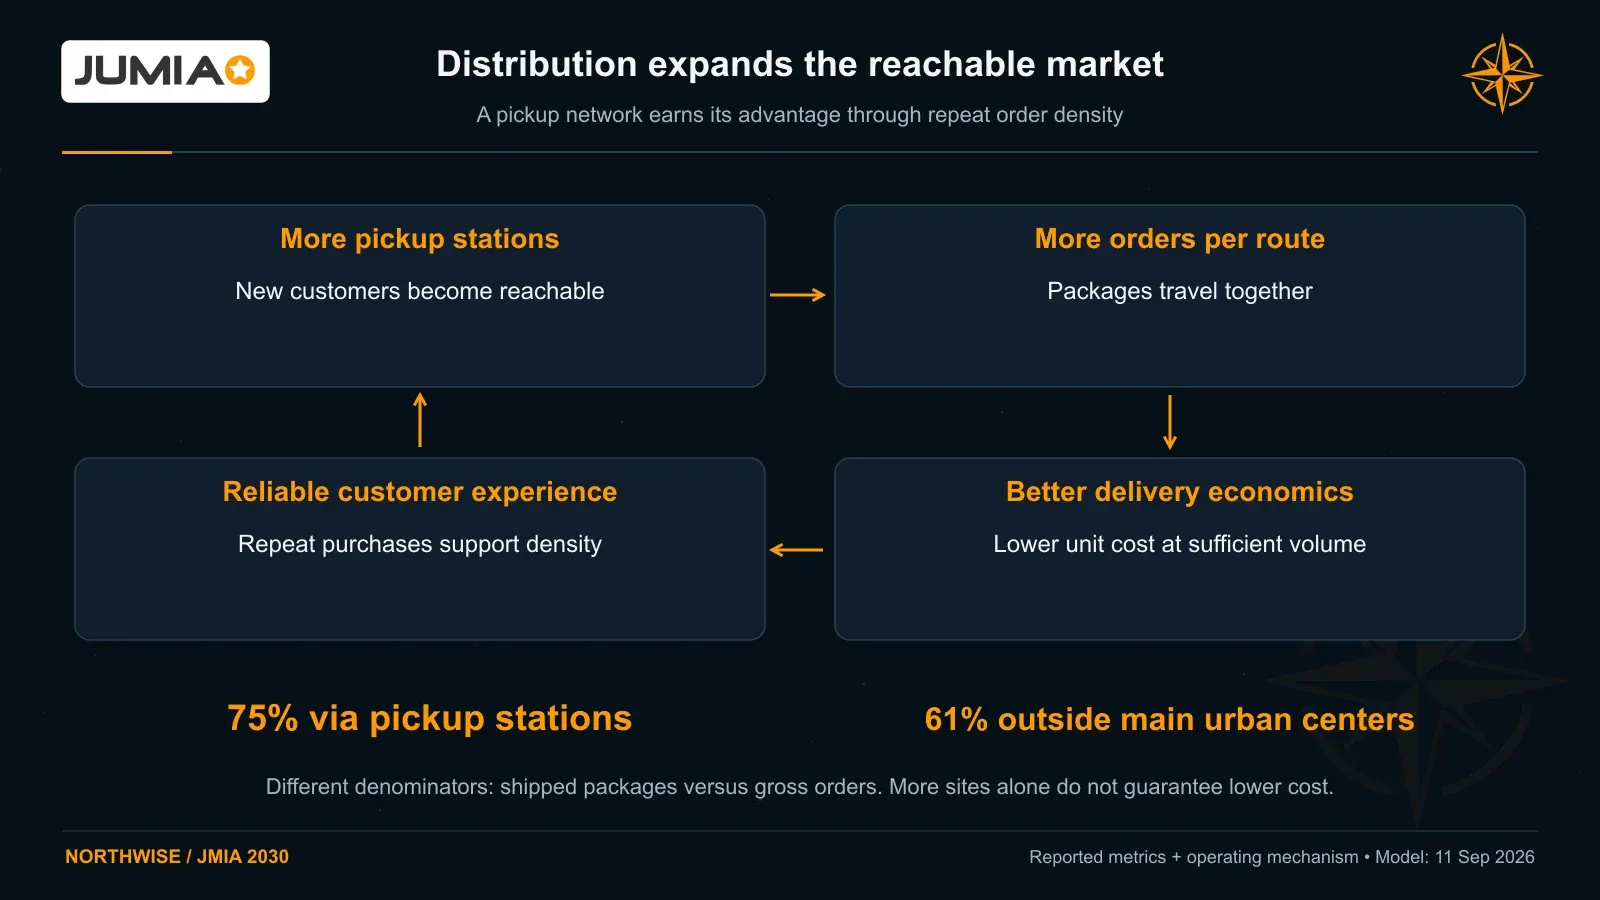
Pickup stations handled 75% of shipped packages in Q2 2026, while 61% of gross orders came from outside main urban centers. Route density can lower fulfillment cost and support repeat demand.
For a household in a secondary city, the appeal can be straightforward. A product available locally in limited selection or at a high price becomes accessible through a broader catalog. Successful delivery then reduces the uncertainty surrounding the next purchase. Better assortment brings the first order; a reliable experience helps make the second one possible.
This is the operating logic behind our frequency assumptions. It is not enough for customers to register or try a heavily promoted product once. They must find reasons to return without requiring the same acquisition expense every time.
The economics remain exposed to fuel and labor. Management reported that higher fuel prices were complicating logistics negotiations in 2026, even as contract renegotiation and productivity initiatives improved the cost base. Pickup stations reduce some exposure to home-delivery costs, but they do not eliminate trucking, warehouse, or partner expenses.
We expect distribution to become an advantage. We do not assume every additional route becomes profitable simply because it carries the Jumia name.
4. Sellers arrive before the revenue
International seller growth is easy to overstate when the number being discussed is seller onboarding rather than actual sales.
A supplier considering Africa may begin with small inventory commitments. It needs to learn which products sell, which prices work, and which markets justify more capital. A relationship can therefore exist long before it becomes financially important.
Dufay told investors that newly onboarded Chinese vendors can take more than a year, sometimes two years or longer, to deliver meaningful volume and margin. The international growth visible in 2026 reflected several years of work. As sellers learn the markets, they commit more inventory and working capital.
This lag is relevant to the forecast. Seller recruitment does not instantly create revenue, but a maturing supplier base can support growth after the initial onboarding expense has already occurred.
International gross items sold reached 4.9 million in Q1 and 5.8 million in Q2. The Q2 figure was 96% above the prior year on the adjusted perimeter. That measures items sold through international sellers, not the number of sellers and not the number of distinct products in the catalog.
The financial opportunity extends beyond commissions. International suppliers using Jumia’s storage infrastructure create warehousing revenue. Sellers competing for visibility create advertising demand. A broader and better-priced assortment can also make customer-acquisition spending more productive.
Q2 advertising revenue reached approximately $3.5 million, up 88%, while value-added services revenue increased 61%. The latter includes services such as warehousing. These revenues are still small in absolute dollars, but they are becoming more consequential within Jumia’s gross profit.
Advertising adoption reached 26% of sellers, compared with 19% a year earlier. That leaves room for further adoption, although participation alone does not determine how much sellers can profitably spend.
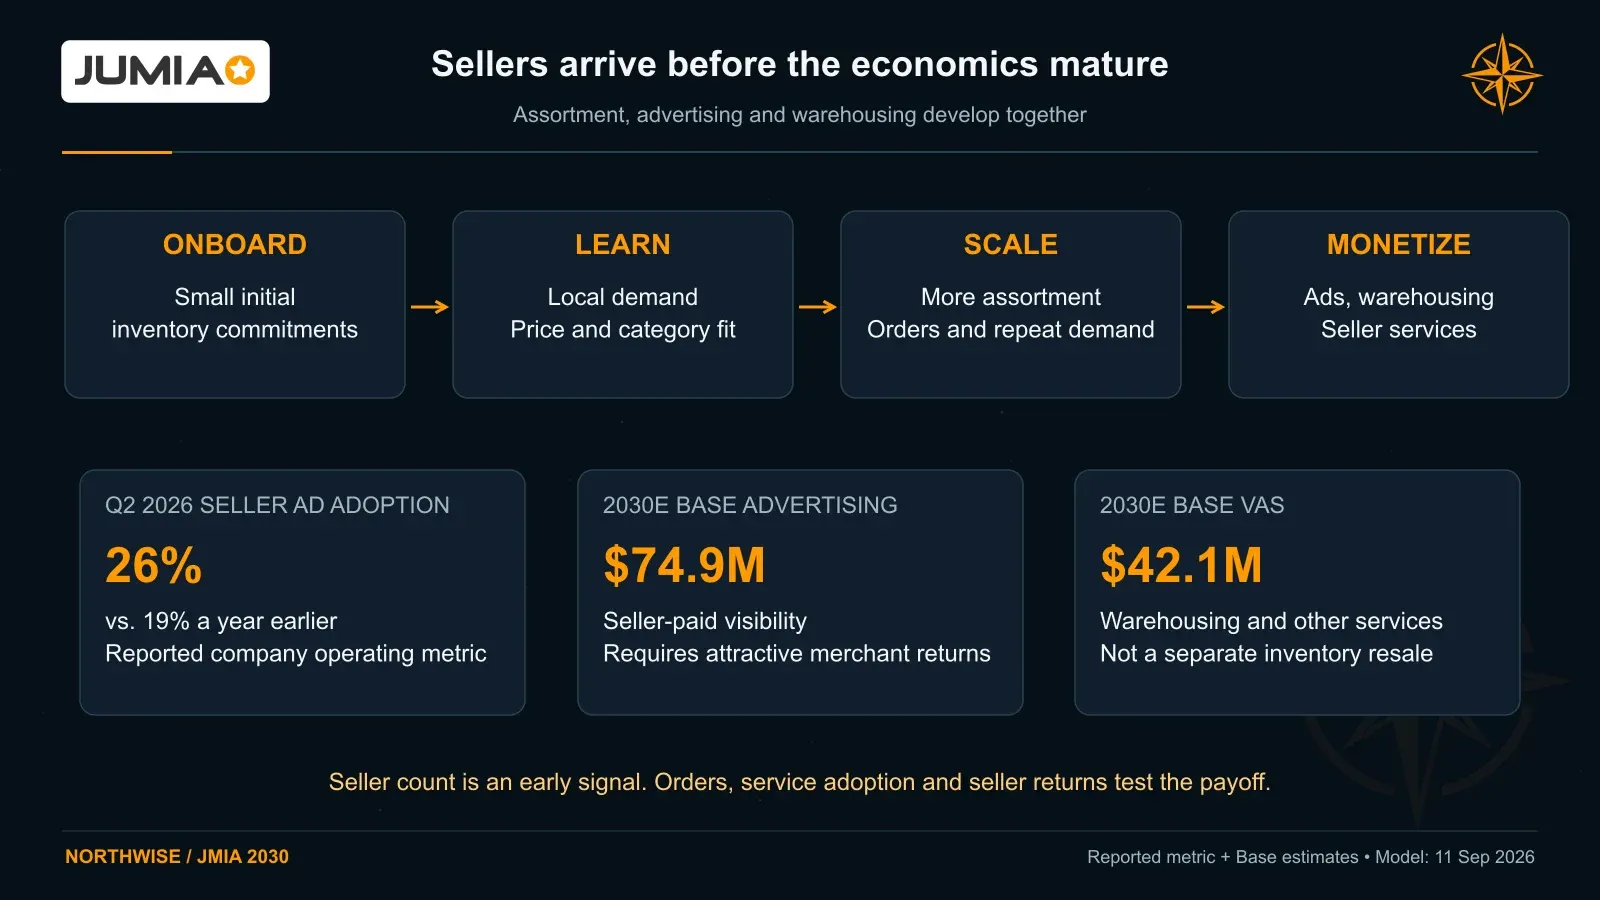
Seller onboarding can take more than a year to generate meaningful volume. Advertising adoption reached 26% in Q2 2026; Base advertising and VAS revenue reaches $117.0 million in 2030.
The practical limit is the seller’s return. Advertising can become a durable business when merchants earn enough from incremental sales to keep bidding. Excessive monetization that undermines seller economics would eventually damage assortment, pricing, or participation.
Our Base case therefore does not rely on continually increasing commissions at the pace seen during the 2026 reset. More of the improvement comes from services attached to a larger marketplace.
Base-case revenue composition, US$M | 2026E | 2027E | 2028E | 2029E | 2030E |
|---|---|---|---|---|---|
Third-party revenue | 109.1 | 136.8 | 181.5 | 240.3 | 311.2 |
Advertising | 14.0 | 22.6 | 35.1 | 53.4 | 74.9 |
Value-added services | 8.7 | 13.2 | 19.6 | 28.8 | 42.1 |
First-party sales | 104.8 | 118.1 | 147.1 | 182.3 | 220.1 |
Other marketplace revenue | 1.7 | 1.9 | 2.5 | 3.3 | 4.2 |
Incremental external logistics | 0.0 | 1.5 | 4.0 | 11.0 | 21.0 |
Total revenue | 238.4 | 294.1 | 389.9 | 519.0 | 673.6 |
All forecasts in this report are Northwise estimates from the Jumia 2026–2030 financial model. Figures may not sum precisely because of rounding. The forecast incorporates reported first-half 2026 results and extends through December 2030.
By 2030, advertising and value-added services contribute approximately $117 million in Base. They become substantial businesses without requiring Jumia to own the goods underlying every transaction.
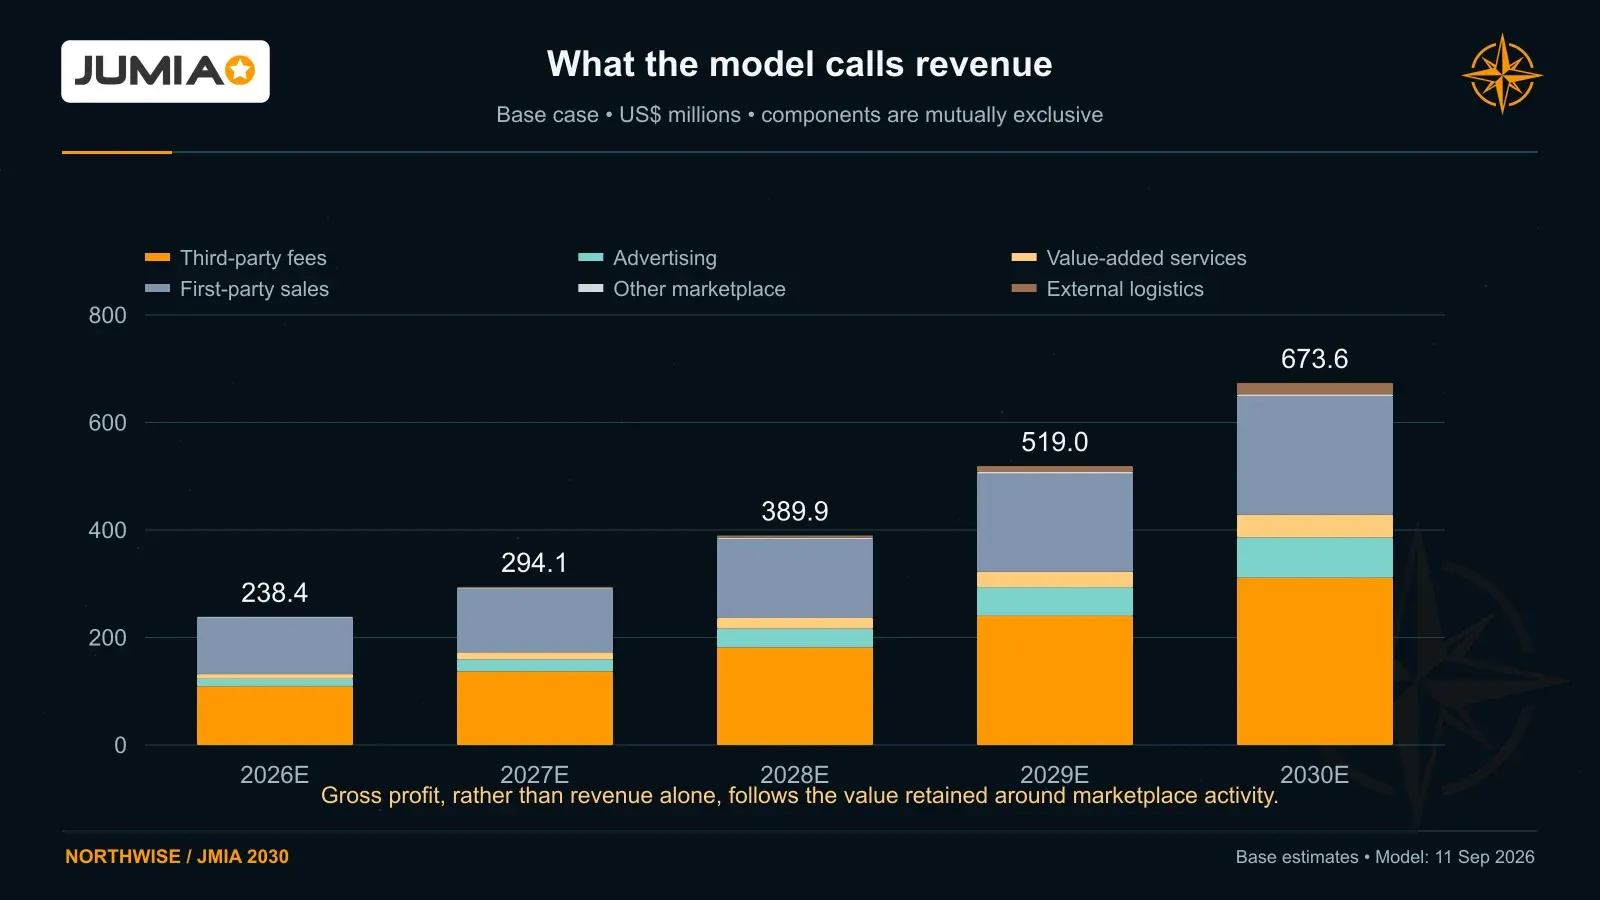
Base revenue increases from $238.4 million in 2026 to $673.6 million in 2030, with advertising and value-added services becoming a larger part of the mix.
First-party sales still grow in dollars. We do not assume inventory ownership disappears. It can remain useful for securing important products or commercial relationships. The requirement is that retail activity earns an adequate margin after the capital and operating effort it consumes.
5. Eight markets, not one African average
The continental opportunity becomes more credible when it is broken into countries, not when country differences are ignored.
Nigeria’s growth cannot be explained by the same variables as Ivory Coast’s. Egypt’s reported revenue has a different relationship with GMV because its sales mix differs. Ghana can expand quickly and still need additional logistics capacity. Smaller markets may contribute useful regional scale without becoming independent growth engines of comparable size.
The first-half revenue figures show why a common revenue yield would be misleading.
Country | H1 2026 reported revenue | FY2026 Base revenue | FY2030 Base revenue |
|---|---|---|---|
Nigeria | $24.6M | $57.4M | $175.3M |
Ivory Coast | 26.4 | 61.5 | 117.7 |
Kenya | 13.6 | 31.8 | 93.2 |
Ghana | 8.6 | 20.1 | 78.8 |
Egypt | 15.4 | 35.5 | 99.4 |
Morocco | 6.4 | 14.9 | 34.1 |
Senegal | 3.3 | 7.8 | 18.2 |
Uganda | 3.7 | 8.5 | 17.4 |
Jumia reports country revenue in its interim financial statements. Country GMV allocations, first-party versus service revenue, and country profitability require estimates where disclosure does not provide the full detail. Our 2026 forecasts begin with the reported first half and add an explicit second-half forecast.
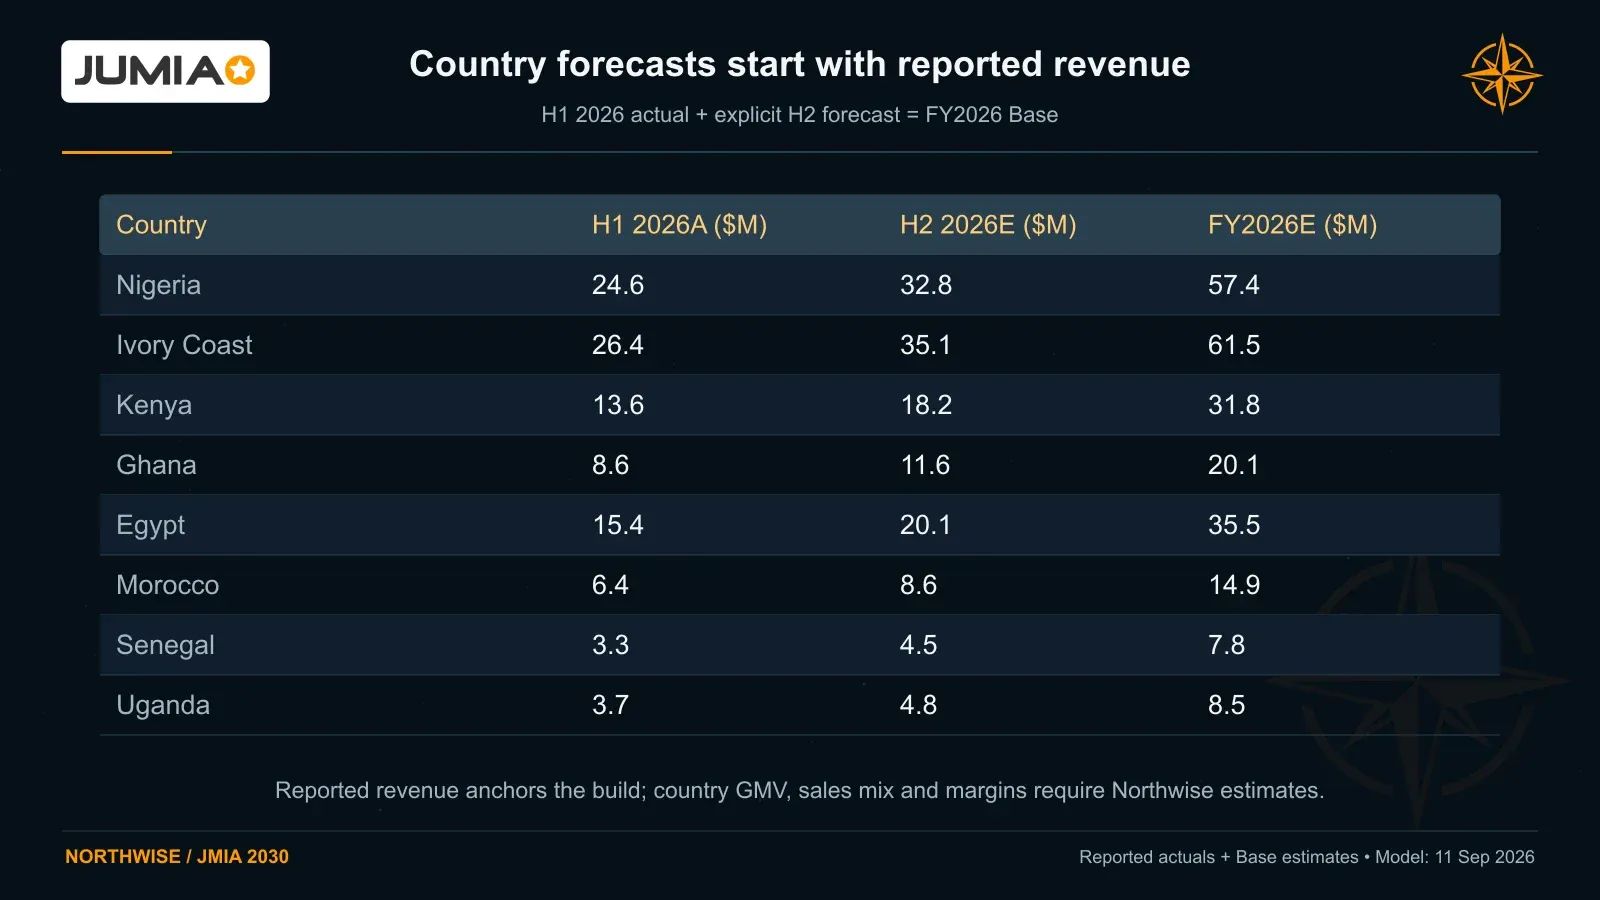
Country revenue forecasts reconcile reported first-half 2026 revenue with explicit second-half estimates, including Egypt’s $15.4 million actual first half and $35.5 million full-year Base estimate.
Nigeria carries the largest long-term burden in our forecast. Physical-goods GMV grew 42% in Q1 and 36% in Q2. Management connected that growth to broader supply, home and living, and expanded distribution outside the main cities. More than 80 pickup stations were added during the first quarter.
We expect Nigeria to remain the largest contributor to Jumia’s 2030 GMV. The opportunity is attractive because the existing organization can serve more of the country, but the concentration also matters. A prolonged Nigerian demand or currency problem would affect the consolidated result far more than a setback in a smaller market.
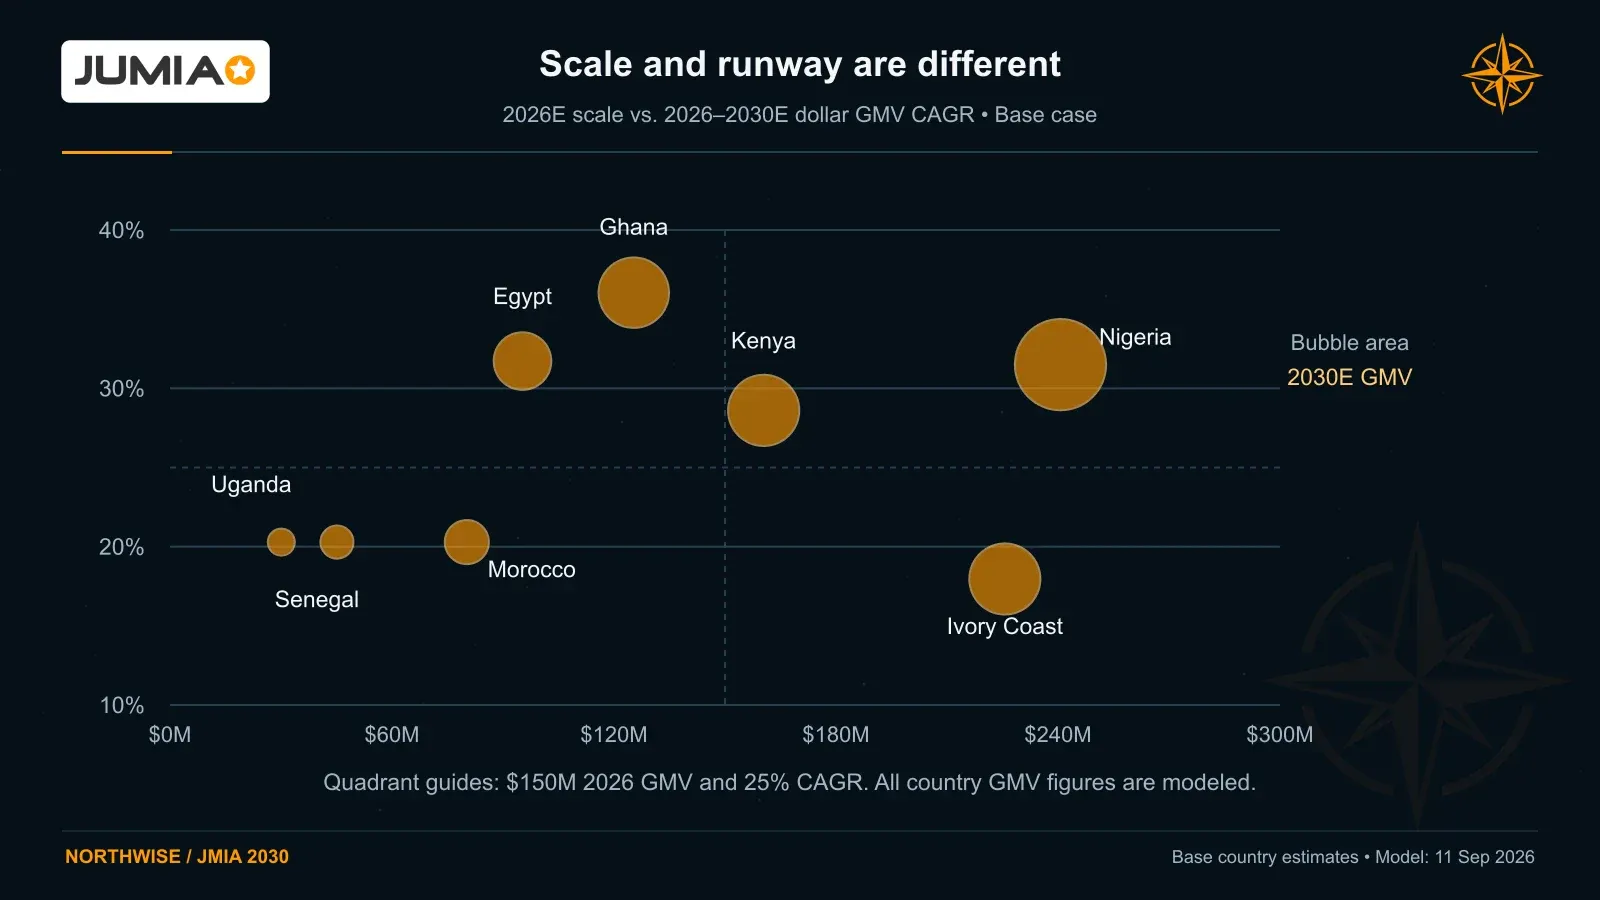
A country bubble chart sizes Jumia’s markets by 2030 Base GMV and compares 2026 scale with projected growth. Nigeria is the largest; Ghana has the highest modeled growth rate.
Ghana is the faster-growing, less mature counterpart. Physical-goods GMV increased 142% in Q1 and 77% in Q2. Management described logistics capacity as an area requiring continued investment to support that expansion.
We do not extend those growth rates indefinitely. Base assumes a substantial moderation while still allowing Ghana to become a much more important market. The challenge is to expand capacity without losing the customer experience or cost discipline that made the growth attractive in the first place.
Ivory Coast offers a useful corrective to the idea that a mature local position guarantees stability. Its physical-goods GMV grew 16% in Q1 and declined 1% in Q2. In May, management described a sharp reduction in cocoa farm-gate prices as a purchasing-power shock for customers outside the major cities, alongside supply disruption in important categories.
A well-developed network does not protect household income. Our Base case assumes growth recovers, but that recovery is an underwriting judgment. The country remains material enough that a longer period of weak demand would matter.
Egypt requires a different reading. Its Q2 physical-goods GMV rose 45% on the reported comparison and 50% excluding corporate sales. Earlier decisions to reduce corporate activity complicate the historical comparison, while the remaining business continues to recover.
Its revenue contribution is larger than its GMV share alone would suggest. That does not automatically make Egypt the most profitable country. A higher first-party sales mix can produce more reported revenue per dollar of GMV without producing proportionately more contribution.
We estimate $35.5 million of Egyptian revenue in 2026, including approximately $20.1 million in the second half, and $99.4 million by 2030 in Base. The forecast allows the business to grow while separately recognizing that its sales mix may evolve.
Kenya sits between the large growth markets and the smaller regional operations. Physical-goods GMV grew approximately 49% in Q1 and 23% in Q2. Management identified home and living, international fashion supply, and expansion outside the main cities as important drivers.
In our Base case, Kenya becomes almost as large as Ivory Coast in GMV by 2030. That is a meaningful expansion of its role, not merely a continuation of its current share.
Morocco, Senegal, and Uganda remain smaller contributors. We retain each separately because their revenue mix and operating exposures should not disappear into a consolidated average. Where detailed GMV growth is not separately disclosed, their allocations remain assumptions rather than claimed observations.
Uganda also illustrates a risk that rarely appears in a smooth growth curve. Management reported an internet blackout lasting nearly a week during Q1. The market still grew, but the incident shows how a digital business can be disrupted by infrastructure or policy conditions outside its control.
The eight markets give Jumia breadth. They do not create a single frictionless market. Common technology, seller relationships, and operating experience can be shared; consumer purchasing power, customs, currencies, and local delivery economics still have to be earned country by country.
Country revenue source: Note 21.
6. The growth we are underwriting
Our Base case takes GMV from approximately $1.0 billion in 2026 to $2.79 billion in 2030. Most of that increase comes from the existing footprint.
Base-case GMV, US$M | 2026E | 2027E | 2028E | 2029E | 2030E |
|---|---|---|---|---|---|
Nigeria | 240.7 | 311.9 | 420.5 | 560.5 | 719.6 |
Ivory Coast | 225.6 | 255.0 | 300.9 | 364.0 | 436.8 |
Kenya | 160.4 | 202.8 | 267.1 | 346.4 | 438.9 |
Ghana | 125.4 | 174.5 | 245.4 | 331.9 | 429.3 |
Egypt | 95.3 | 125.3 | 170.1 | 225.1 | 286.8 |
Morocco | 80.2 | 95.1 | 115.6 | 140.5 | 168.0 |
Senegal | 45.1 | 53.5 | 65.0 | 79.0 | 94.5 |
Uganda | 30.1 | 35.7 | 43.4 | 52.7 | 63.0 |
Tanzania | 0.0 | 0.0 | 25.0 | 70.0 | 150.0 |
Algeria residual activity | 2.0 | 0.0 | 0.0 | 0.0 | 0.0 |
Total | 1,004.8 | 1,253.8 | 1,653.0 | 2,170.1 | 2,786.9 |
The existing eight countries account for approximately 95% of Base-case 2030 GMV. Tanzania adds another source of growth, but it does not carry the forecast.
Country outcomes differ meaningfully across the three scenarios:
2030 GMV, US$M | Bear | Base | Bull |
|---|---|---|---|
Nigeria | 428.6 | 719.6 | 973.3 |
Ivory Coast | 322.4 | 436.8 | 502.6 |
Kenya | 306.7 | 438.9 | 596.7 |
Ghana | 247.9 | 429.3 | 624.8 |
Egypt | 178.1 | 286.8 | 401.7 |
Morocco | 118.9 | 168.0 | 225.1 |
Senegal | 66.9 | 94.5 | 126.6 |
Uganda | 44.6 | 63.0 | 84.4 |
Tanzania | 10.0 | 150.0 | 250.0 |
Angola marketplace | 0.0 | 0.0 | 85.0 |
Total | 1,724.1 | 2,786.9 | 3,870.2 |
These dollar forecasts incorporate currency assumptions rather than assuming that local growth translates intact into reported results.
Nigeria, for example, grows 39% in local currency in our 2028 Base case. A modeled 3% translation drag reduces dollar growth to approximately 34.8%:
1.39 × 0.97 − 1 = 34.8%
Nigeria, Ghana, and Egypt carry modeled currency translation drags of 4%, 3%, 2%, and 2% from 2027 through 2030. Kenya carries smaller drags. We assume no dollar translation drag for Ivory Coast and Senegal. These are scenario inputs, not assurances about future exchange rates.
The growth profile also requires more purchasing activity, not simply larger baskets.
Base-case demand and operating measure | 2026E | 2027E | 2028E | 2029E | 2030E |
|---|---|---|---|---|---|
Physical-goods orders, millions | 28.3 | 35.8 | 47.3 | 61.6 | 78.2 |
Implied average quarterly active customers, millions | 2.92 | 3.54 | 4.45 | 5.53 | 6.70 |
Quarterly orders per active customer | 2.42 | 2.53 | 2.66 | 2.79 | 2.92 |
Average order value | $35.50 | $35.00 | $34.95 | $35.20 | $35.64 |
Gross profit per order | $5.01 | $5.17 | $5.36 | $5.62 | $5.90 |
The active-customer figures describe the average customer base active during a quarter. They are not unique annual customers. The same person may be active in several quarters.
They are also the customer levels implied by our order and frequency assumptions, rather than the output of a statistically estimated acquisition model. They make the adoption requirement visible: Base needs a substantially larger customer base that purchases more often.
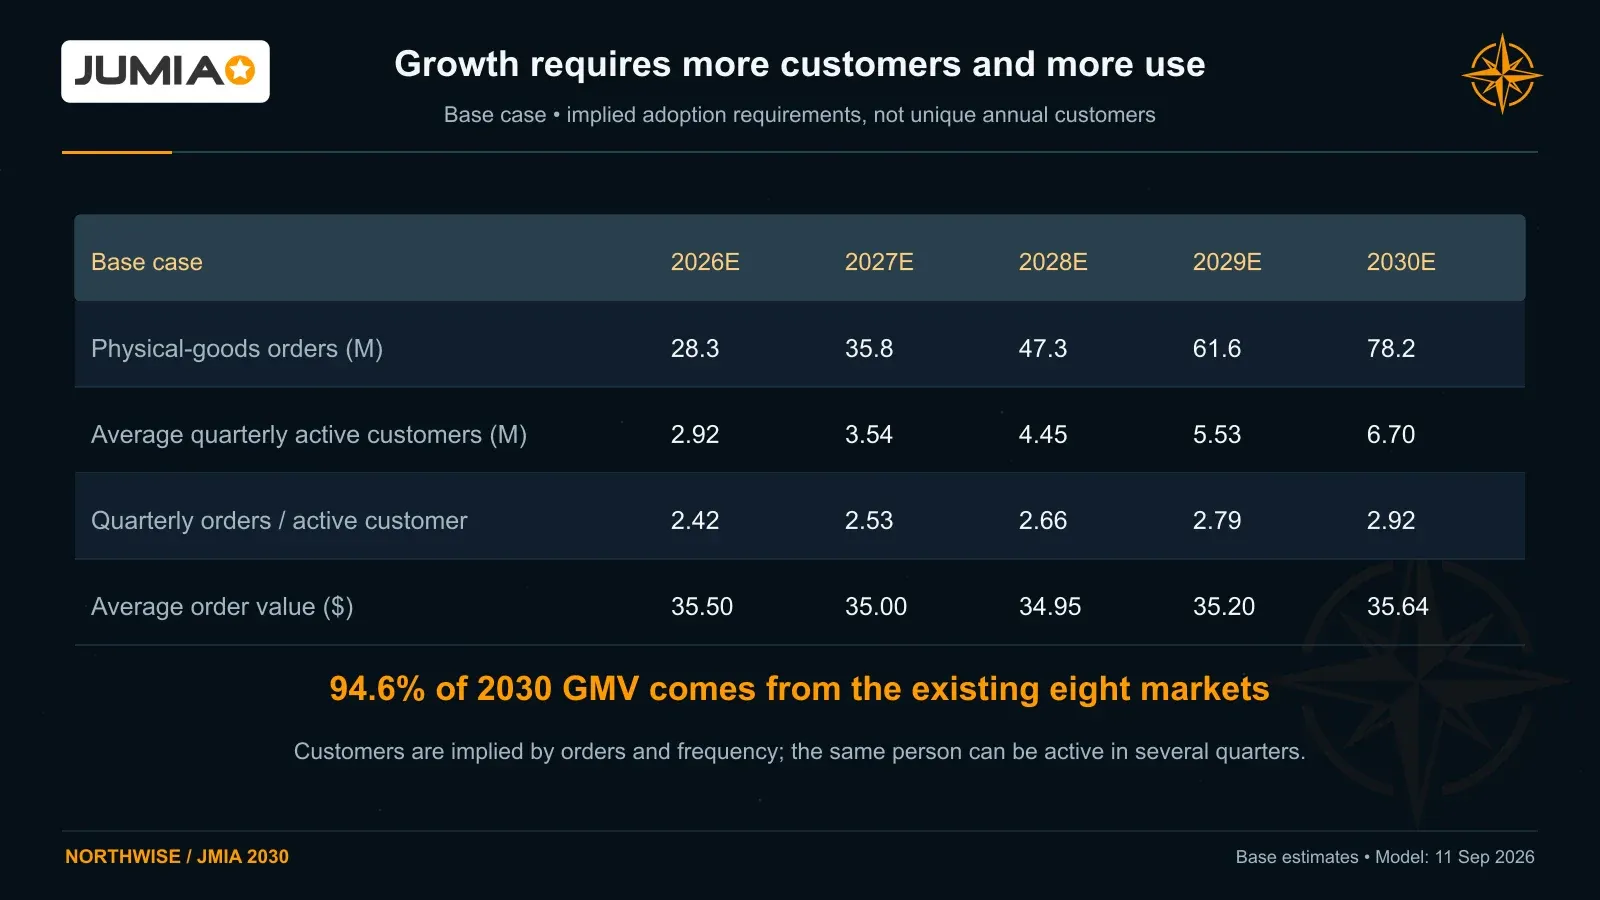
Base forecasts 78.2 million physical-goods orders and 6.70 million average quarterly active customers in 2030, with quarterly orders per active customer increasing to 2.92.
We consider that achievable if distribution, assortment, and service quality continue to improve. It is still a demanding forecast. Base GMV compounds at approximately 29% annually from 2026 through 2030, with faster growth in 2028 and 2029 as the reinvestment program and supplier maturation contribute.
That acceleration is central to our view. It should be evaluated as a claim about the returns available from the next investment cycle, rather than treated as a routine extension of the latest quarter.
7. The spending that follows self-funding
A successful turnaround can produce two very different companies.
One becomes a smaller, consistently profitable operation that limits investment to protect its margin. The other develops enough financial strength to pursue opportunities it previously could not afford.
We expect Jumia to move toward the second outcome, provided its spending continues to produce attractive customer and seller economics.
The Base forecast increases annual sales and marketing expense from approximately $25 million in 2026 to $89 million in 2030. Technology and product investment also expands after the initial efficiency reset. This is a larger business with a larger budget, not an assumption that the organization can support unlimited activity at today’s cost.
The incremental growth program is explicit:
Base-case incremental investment, US$M | 2026E | 2027E | 2028E | 2029E | 2030E |
|---|---|---|---|---|---|
Additional core-market marketing | 0.0 | 2.5 | 9.0 | 16.8 | 26.4 |
New-market marketing | 0.0 | 0.0 | 1.5 | 2.8 | 4.5 |
Additional product and seller investment | 0.0 | 2.0 | 7.0 | 12.0 | 20.0 |
Regional operating investment | 0.0 | 0.0 | 3.5 | 5.5 | 6.3 |
Incremental growth operating expense | 0.0 | 4.5 | 21.0 | 37.1 | 57.2 |
Additional growth capital expenditure | 0.0 | 2.0 | 6.0 | 9.0 | 12.0 |
Combined incremental deployment | 0.0 | 6.5 | 27.0 | 46.1 | 69.2 |
The zero in 2026 means there is no separate post-turnaround investment overlay. Routine marketing and other growth-supporting spending remain in that year’s operating budget.
Across 2027–2030, Base deploys approximately $149 million of incremental growth operating expense and growth capital expenditure. Those amounts are additional to routine operating costs, maintenance investment, and working-capital requirements.
We charge the operating expenditure as it occurs. The forecast does not remove marketing or product costs from earnings simply because they are intended to create future value.
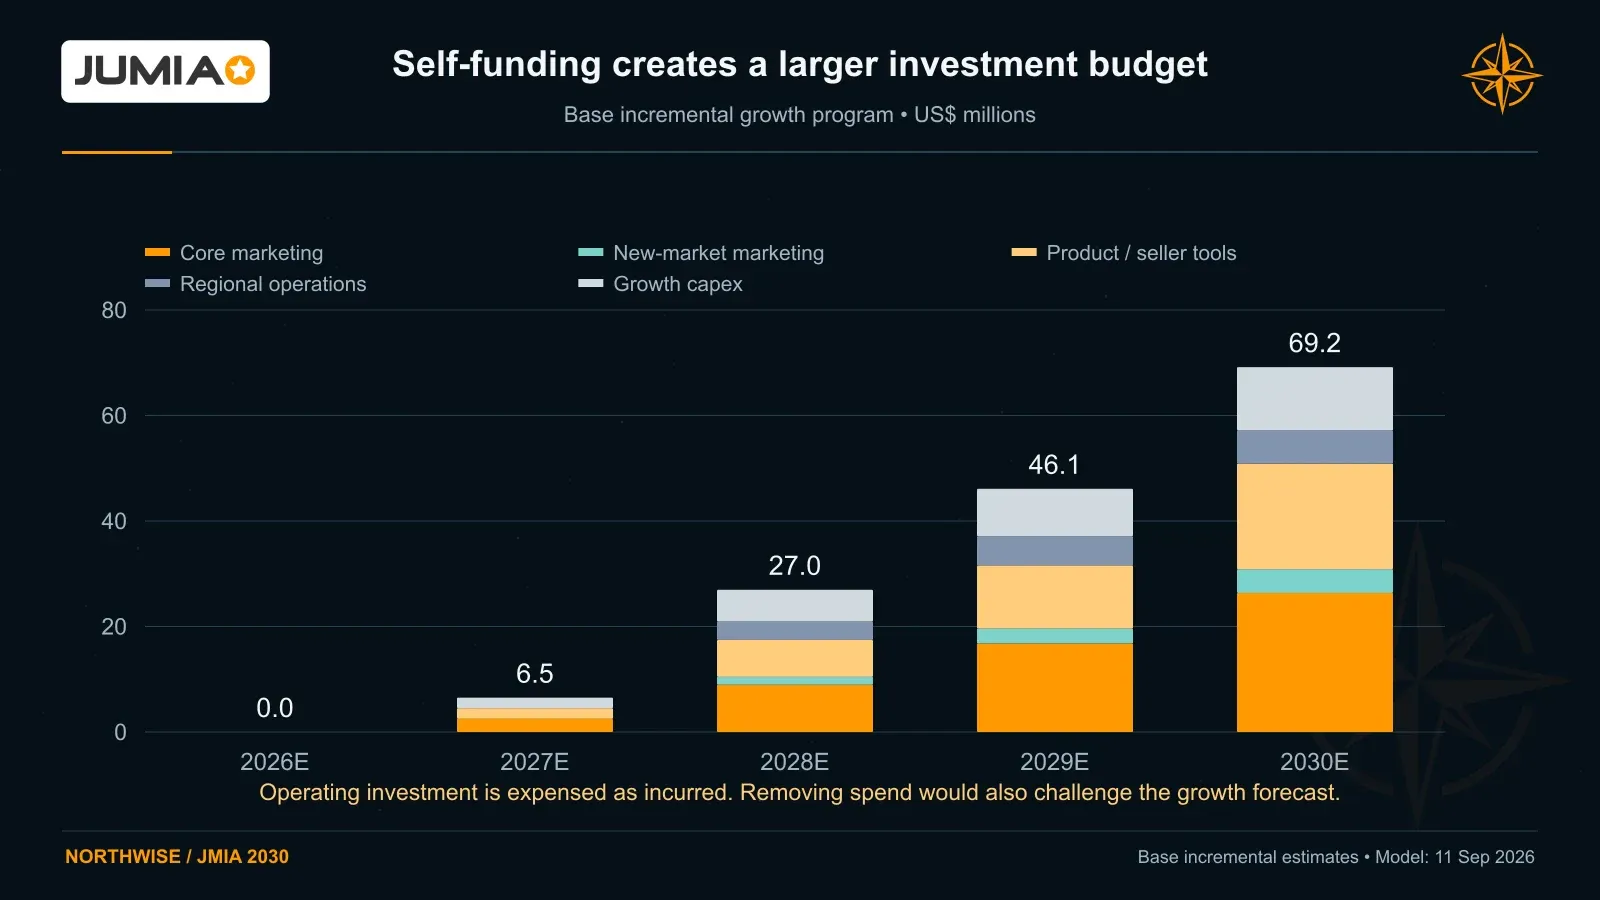
The Base model deploys about $149 million of incremental growth operating expense and capex across 2027–2030, beyond routine spending and working capital.
By 2030, Base spends approximately $1.14 on customer sales and marketing per order, compared with approximately $0.89 in 2026. Contribution per order still improves from about $2.09 to $3.18 because gross profit rises and fulfillment becomes more efficient.
That is a stronger test than assuming every cost ratio declines together.
The ability to adjust spending is also relevant. Dufay described online marketing budgets as flexible enough to reallocate daily or weekly when conditions change. That does not make the spending riskless, but it gives management more control than a fixed national expansion program whose costs continue regardless of demand.
Our forecast nevertheless requires the investment to work. Reducing the budget while leaving the same customer growth in place would not demonstrate that Jumia can achieve the outcome more cheaply. The operational payoff must be judged from subsequent orders, retention, contribution, and cash generation.
8. Tanzania, Angola, and Ethiopia
The prospect of a continental platform naturally invites a map of future launches. It is more useful to begin with the question of how a new market would pay for itself.
Our expansion research identifies Tanzania as the clearest reentry candidate, Angola as a more conditional opportunity, and Ethiopia as a market where logistics services could precede a consumer marketplace. Tanzania offers potential continuity with Jumia’s East African operations and a more developed digital-payment environment than during its earlier attempt. Angola carries greater macro uncertainty, while Ethiopia introduces substantial regulatory, security, and operating complexity.
The forecast translates that sequence into different commitments:
Expansion initiative | Bear | Base | Bull |
|---|---|---|---|
Tanzania marketplace | Small launch in 2030 | Launch in 2028 | Launch in 2028 with faster scaling |
Angola external logistics | Not included | Launch in 2029 | Launch in 2028 |
Angola marketplace | Not included | Not included through 2030 | Launch in 2029 |
Ethiopia external logistics | Not included | Not included through 2030 | Launch in 2029 |
Ethiopia marketplace | Not included | Not included | Not included |
All dates and financial contributions in this table are Northwise assumptions. They are not confirmed launch commitments.
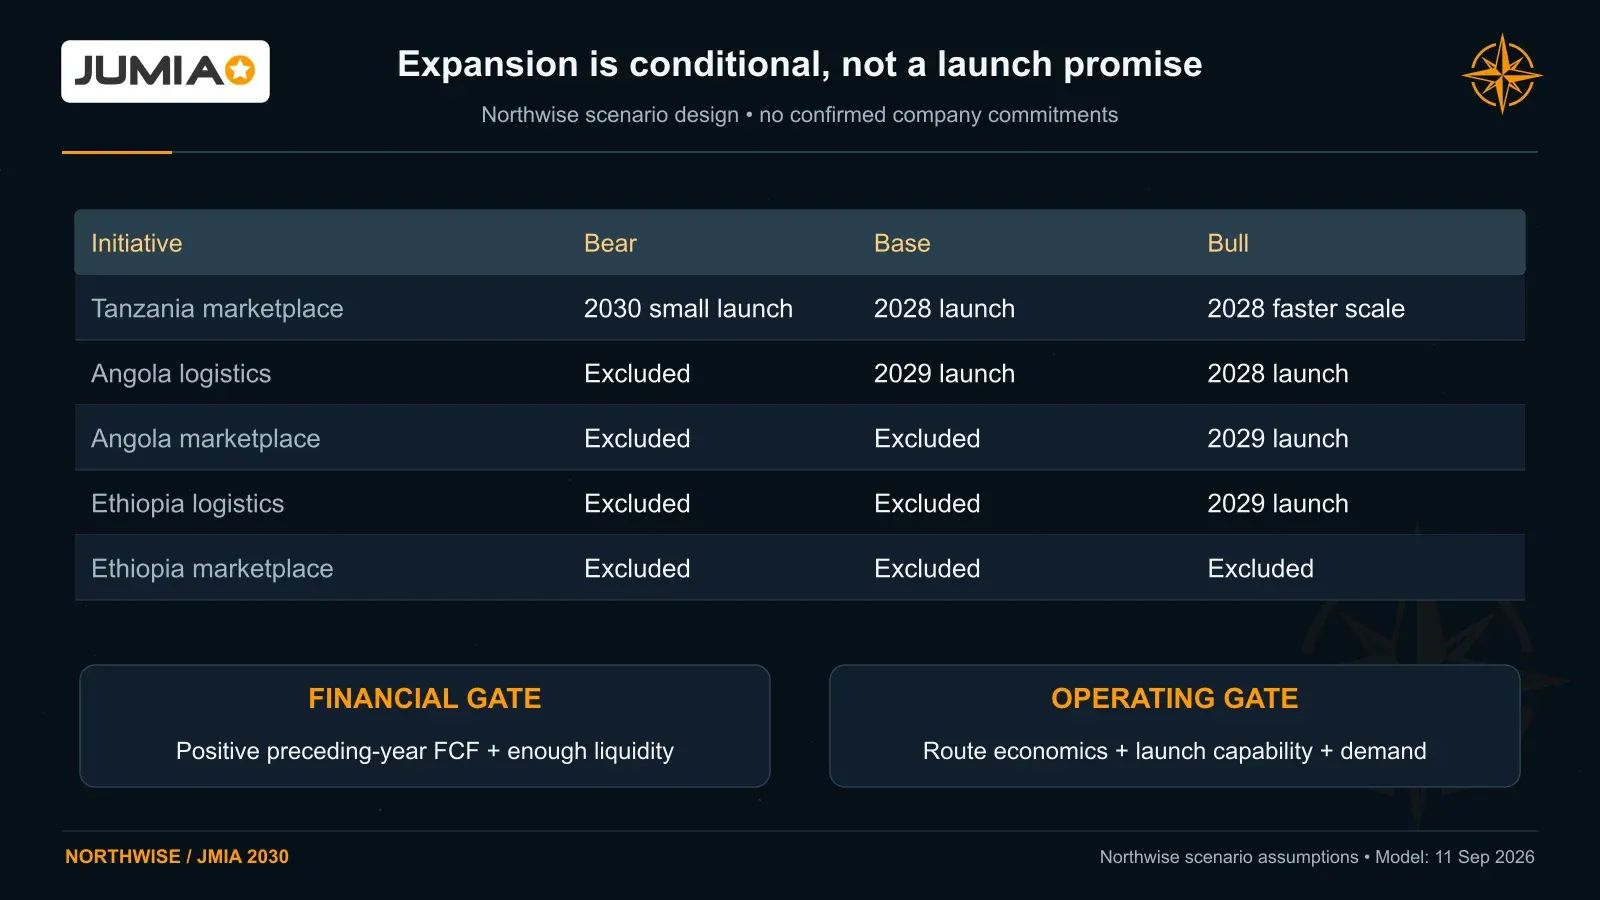
Tanzania launches in 2028 in Base and Bull; Angola logistics starts in 2029 in Base, and Ethiopia logistics appears only in Bull from 2029. Ethiopia marketplace is excluded.
Tanzania reaches $25 million of GMV in its first Base-case year, $70 million in 2029, and $150 million in 2030. The first year carries higher fulfillment costs and heavier marketing relative to sales than the established countries. Initial contribution is negative before regional launch costs.
That is an important part of the economics. Jumia may bring experience, systems, and supplier relationships, but it still has to build local demand and reliable distribution.
In Base, Tanzania’s fulfillment cost starts at $3.00 per order and declines to $2.20 by its third year. Marketing begins at 6% of GMV and falls to 3% as the business develops. These are meaningful improvements, and their timing matters.
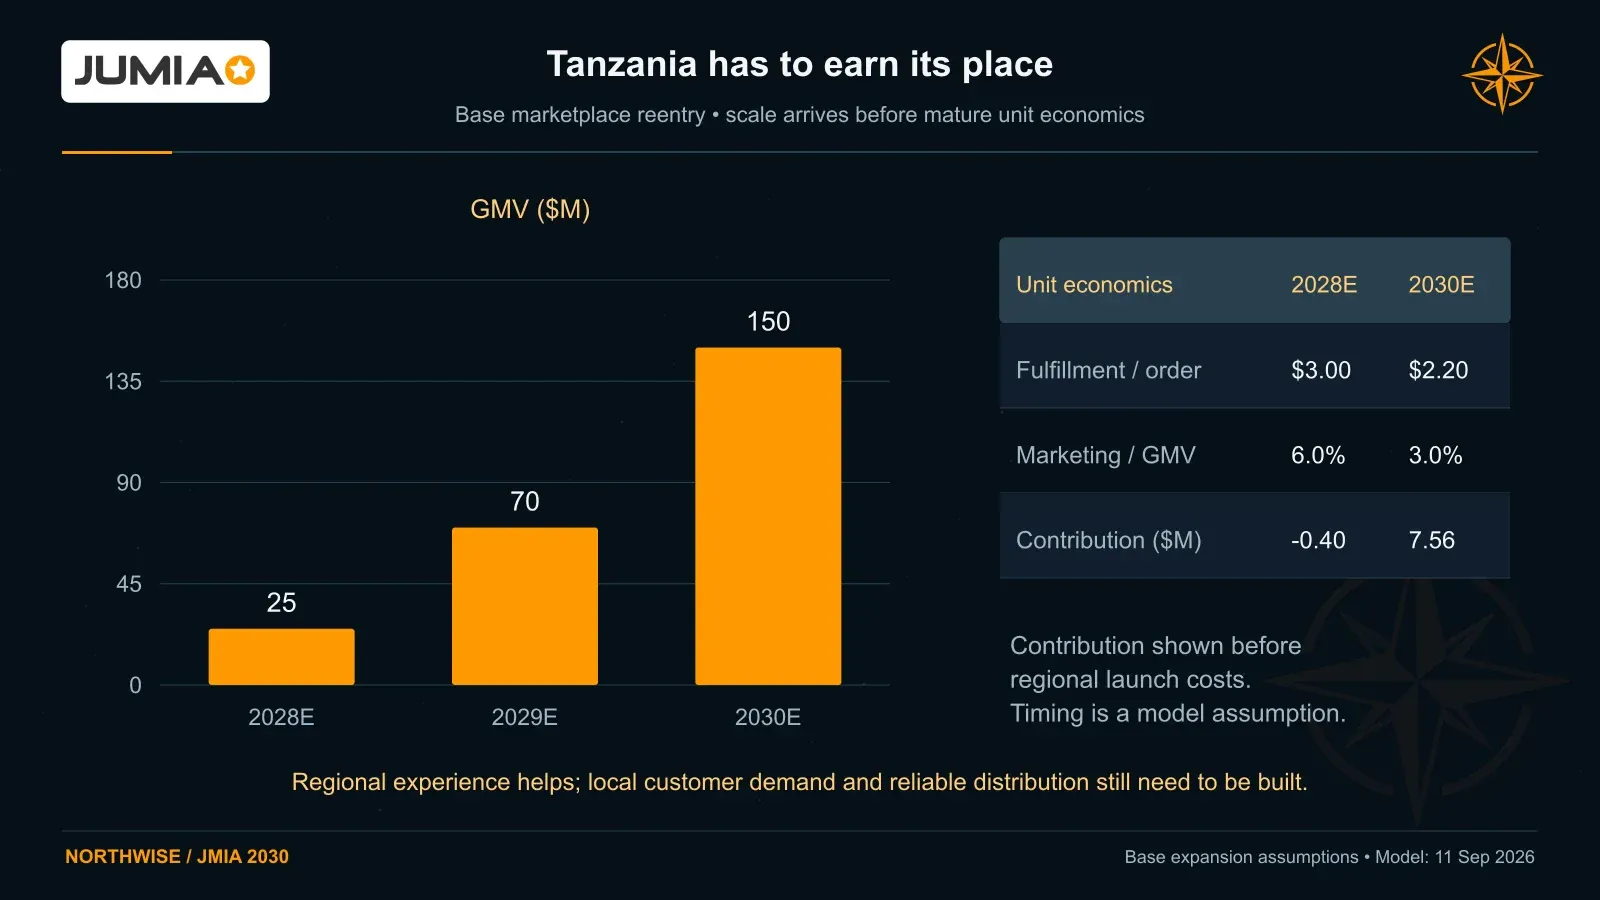
Tanzania Base GMV ramps from $25 million in 2028 to $150 million in 2030. Fulfillment cost falls from $3.00 to $2.20 per order; initial contribution is negative.
Angola enters the Base case through services to external merchants rather than through a consumer marketplace. That approach can test route economics and establish merchant relationships without immediately funding the full customer-acquisition program of a marketplace launch.
The service revenue remains separate from GMV. Merchandise delivered for an outside merchant is not added to Jumia’s marketplace volume merely because Jumia handles the package.
Incremental external logistics revenue, US$M | 2026E | 2027E | 2028E | 2029E | 2030E |
|---|---|---|---|---|---|
Bear | 0.0 | 0.5 | 1.5 | 3.0 | 5.0 |
Base | 0.0 | 1.5 | 4.0 | 11.0 | 21.0 |
Bull | 0.0 | 3.0 | 11.0 | 28.0 | 52.0 |
Base’s $21 million in 2030 includes $15 million of incremental external logistics revenue from the existing footprint and $6 million from Angola. Bull reaches $52 million across existing markets, Angola, and Ethiopia.
The forecast charges the associated service costs. External logistics is not valued as a costless extension of infrastructure already paid for by marketplace customers.
Launches also depend on funding capacity. Our timing requires positive preceding-year free cash flow and sufficient liquidity. A delayed self-funding transition consequently delays optional expansion rather than allowing the same schedule to continue regardless of the cash available.
This leaves Jumia with a meaningful expansion opportunity while preserving the central role of its current countries. We would rather see a successful company deepen its existing network than open a new country to prove that it still has ambition.
9. What the balance sheet can support
Jumia’s August financing belongs in the investment case without either embarrassment or celebration.
The company announced a $50 million capital raise at $5.52 per ADS, involving approximately 9.1 million new ADSs and anchored by the International Finance Corporation. Management described the proceeds as supporting growth, efficiency, and the integrated marketplace and logistics network.
The timing was significant. Jumia had $48.3 million of liquidity at the end of June, so the gross proceeds were approximately equal to the liquidity already on hand. The financing increased shareholders’ funding capacity and diluted their ownership at the same time.
Our forecast uses $47.5 million of estimated net proceeds after transaction costs. That is a modeling assumption, not a disclosed final net-proceeds figure. The post-financing basic share base is approximately 133.6 million ADSs, and our year-end diluted count begins at 134.3 million.
The financing provides room to complete the transition. It does not itself establish self-funding. That requires operations to cover taxes, capital expenditure, leases, working capital, and other cash obligations without counting new equity proceeds as operating success.
Base reaches that point in 2027, but the cushion is small:
Base-case 2027 cash bridge | US$M |
|---|---|
Adjusted EBITDA | 18.61 |
Cash taxes | (2.50) |
Capital expenditure | (6.00) |
Cash lease payments | (7.50) |
Working-capital investment | (1.50) |
Cash interest income | 2.50 |
Other cash costs | (1.00) |
Free cash flow after reinvestment | 2.61 |
A company generating $18.6 million of adjusted EBITDA can therefore have only $2.6 million left after its cash requirements. The difference explains why we do not treat EBITDA breakeven as the conclusion of the funding analysis.
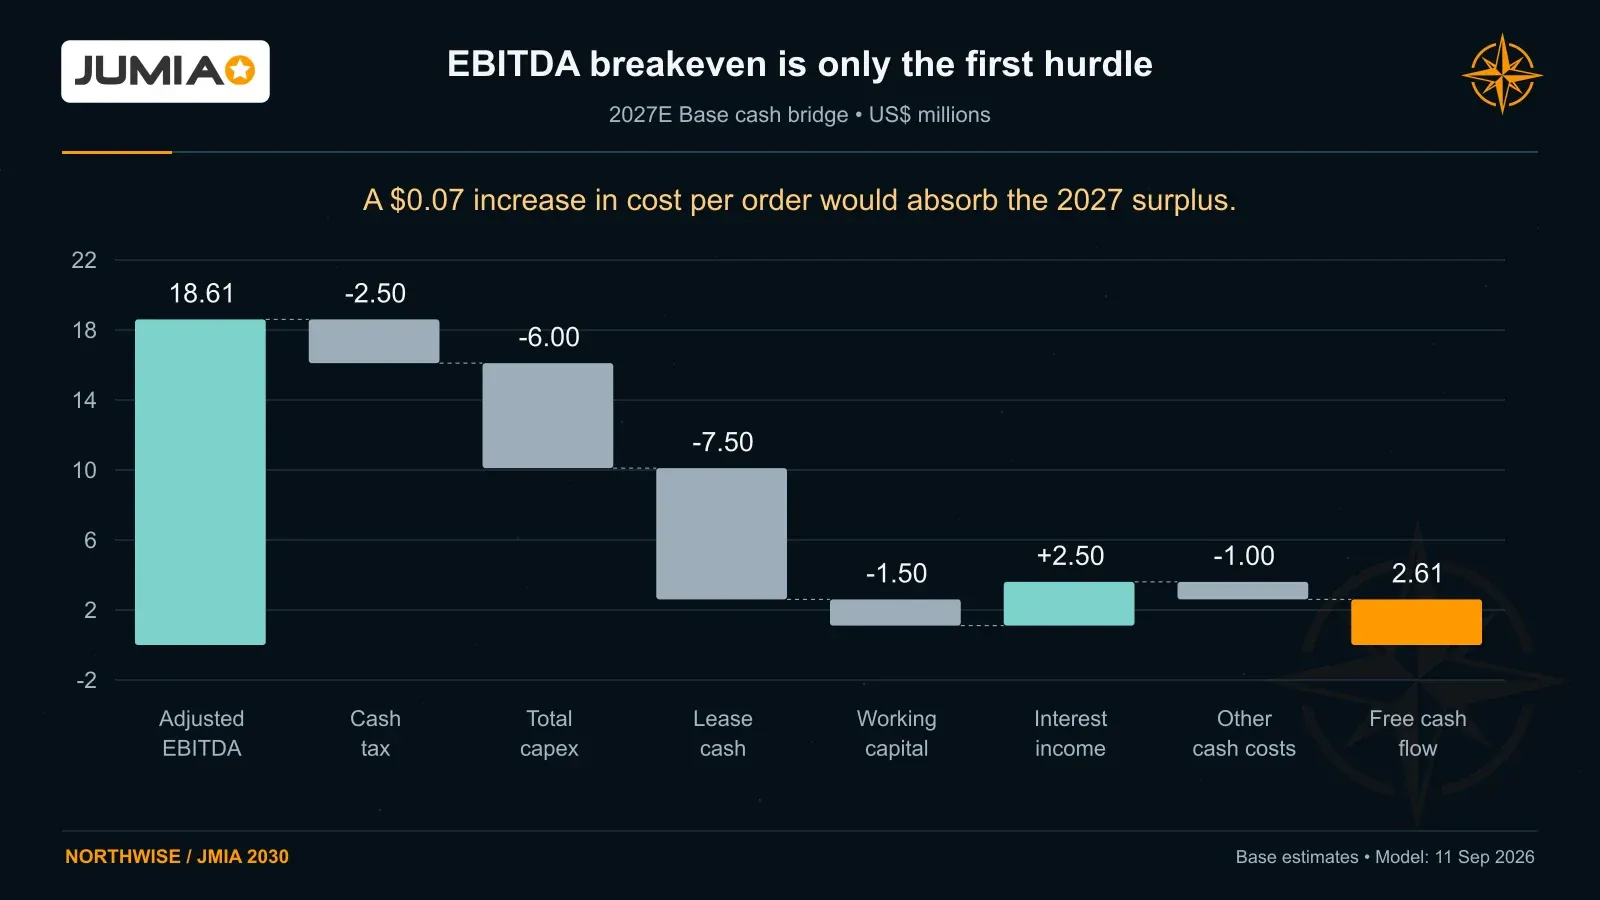
The Base 2027 cash bridge starts with $18.61 million adjusted EBITDA and ends with $2.61 million free cash flow after tax, capex, leases, working capital, interest and other cash costs.
Working capital is especially important around the seasonal fourth quarter. Inventory, supplier advances, receivables, and merchant settlements can move before or after revenue recognition. A profitable trading period can consume cash, while a seasonal release of working capital can make a quarter look unusually strong.
Our Base forecast produces approximately negative $0.56 million of adjusted EBITDA in Q4 2026, alongside positive post-investment cash flow. It is near breakeven on earnings, not above zero. Part of the cash improvement comes from working-capital release.
For the full year, management continues to target positive adjusted EBITDA and cash flow in 2027. That is the more demanding milestone because it must absorb the weaker seasonal periods as well.
The three baseline scenarios assume no further primary equity issuance after the 2026 financing. They do include continuing award dilution. By 2030, diluted ADSs reach 143.5 million in Bear, 141.5 million in Base, and 142.5 million in Bull.
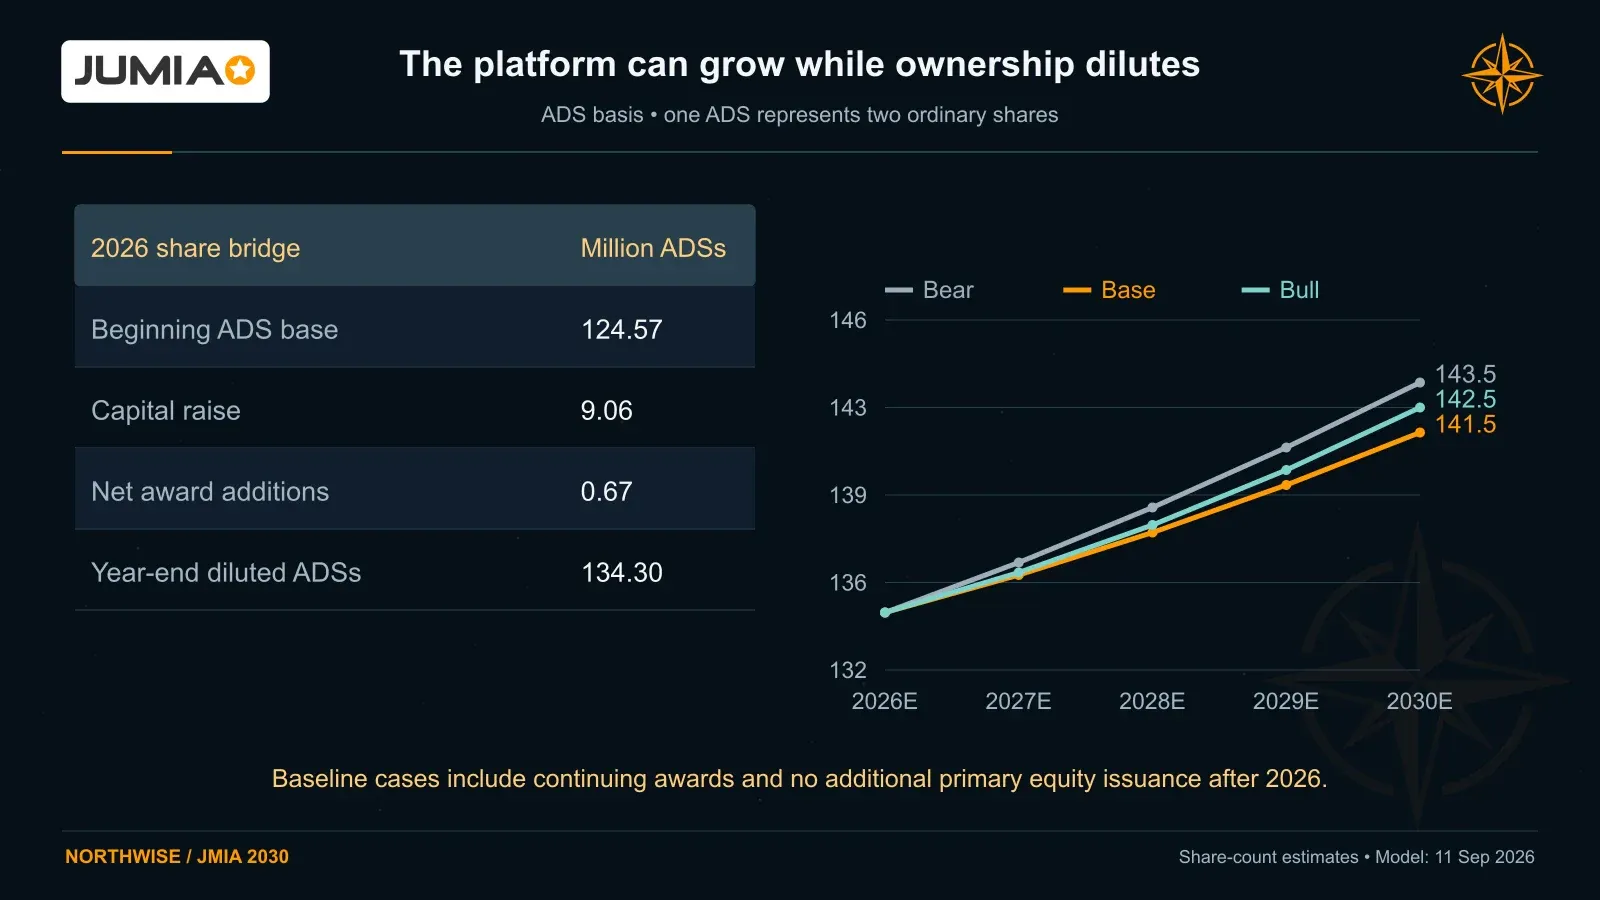
The 2026 share bridge adds about 9.06 million ADSs from the raise and 0.67 million from awards. Year-end diluted ADSs reach 141.5 million in 2030 Base.
Base also retains an operating liquidity reserve rising to $85 million by 2030. Cash needed to support the business should not be treated as immediately distributable shareholder surplus. The remaining liquidity provides the capacity to absorb shocks or make additional investments.
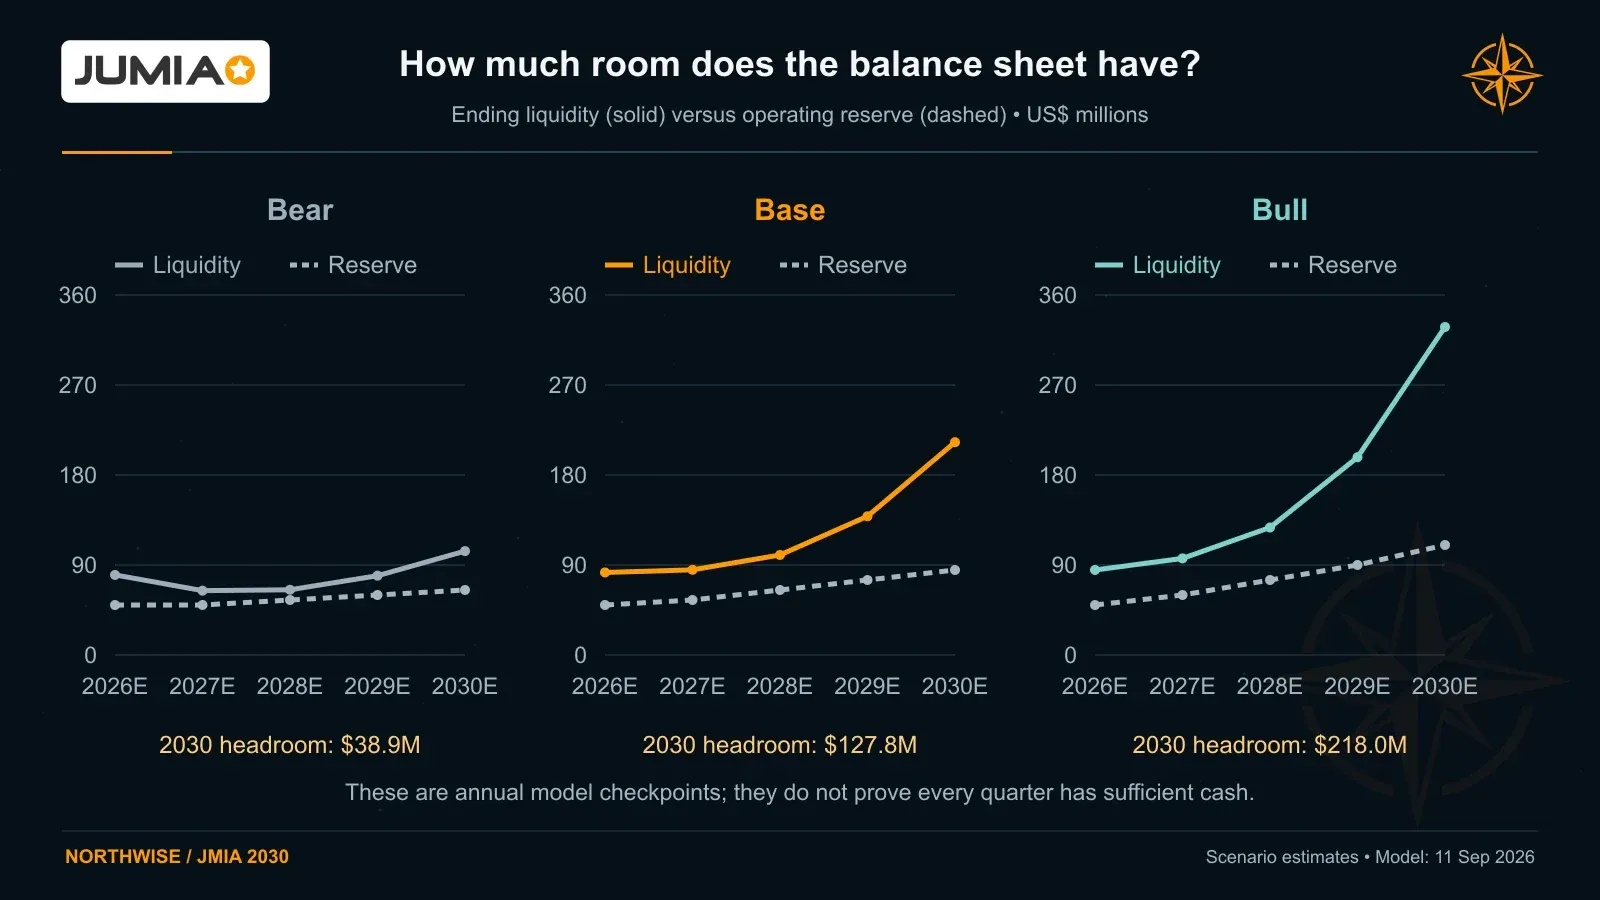
All three baseline scenarios retain liquidity above their annual reserves; Base ends 2030 with $212.8 million liquidity against an $85 million reserve.
10. Bear case: progress without a full transformation
Our Bear case is not a forecast of corporate collapse. Jumia grows, improves its unit economics, and eventually generates cash. It simply takes longer to establish the financial capacity and operating momentum required for a more ambitious expansion.
GMV compounds at approximately 15% annually between 2026 and 2030. Advertising and seller services improve, but not enough to produce the larger contribution gains seen in Base and Bull. Management keeps the investment program smaller, and Tanzania does not begin until 2030.
All financial amounts in the following scenario tables are US$ millions unless otherwise indicated. Orders and ADS counts are also in millions. Expenses are shown as positive cost amounts; parentheses denote losses or cash outflows.
Bear-case operating forecast | 2026E | 2027E | 2028E | 2029E | 2030E |
|---|---|---|---|---|---|
GMV | 984.7 | 1,107.7 | 1,283.1 | 1,493.3 | 1,724.1 |
Physical-goods orders | 27.7 | 30.9 | 35.4 | 40.9 | 46.5 |
Revenue | 233.6 | 259.9 | 303.4 | 354.1 | 409.5 |
Gross profit | 139.1 | 158.0 | 188.1 | 223.5 | 262.8 |
Fulfillment expense | 56.3 | 61.3 | 66.3 | 73.6 | 81.5 |
Sales and marketing expense | 24.8 | 24.9 | 30.2 | 35.8 | 42.6 |
Contribution after fulfillment and marketing | 57.9 | 71.8 | 91.7 | 114.0 | 138.8 |
Technology and product investment | 35.7 | 33.0 | 35.0 | 38.0 | 43.0 |
G&A and regional costs, excluding SBC | 64.2 | 53.0 | 52.0 | 56.0 | 60.5 |
Adjusted EBITDA | (30.3) | (2.2) | 17.2 | 34.0 | 50.3 |
Stock-based compensation | 6.0 | 7.0 | 8.0 | 9.0 | 10.0 |
Net income | (48.2) | (20.2) | (2.8) | 10.4 | 21.6 |
Estimated EPS per ADS | $(0.377) | $(0.150) | $(0.020) | $0.074 | $0.152 |
Capital expenditure | 3.5 | 3.5 | 5.0 | 7.0 | 8.0 |
Free cash flow after reinvestment | (44.3) | (15.7) | 0.9 | 14.1 | 24.6 |
Ending liquidity | 80.1 | 64.4 | 65.2 | 79.3 | 103.9 |
Operating liquidity reserve | 50.0 | 50.0 | 55.0 | 60.0 | 65.0 |
Year-end diluted ADSs | 134.3 | 136.3 | 138.5 | 140.9 | 143.5 |
Adjusted EBITDA includes the relevant depreciation add-back and other operating income. Net income then recognizes depreciation, stock-based compensation, finance items, and tax. EPS uses weighted-average ADSs rather than the year-end count.
Bear reaches positive annual free cash flow in 2028. Liquidity remains positive throughout the baseline, but management has less room to pursue optional investment during the intervening period.
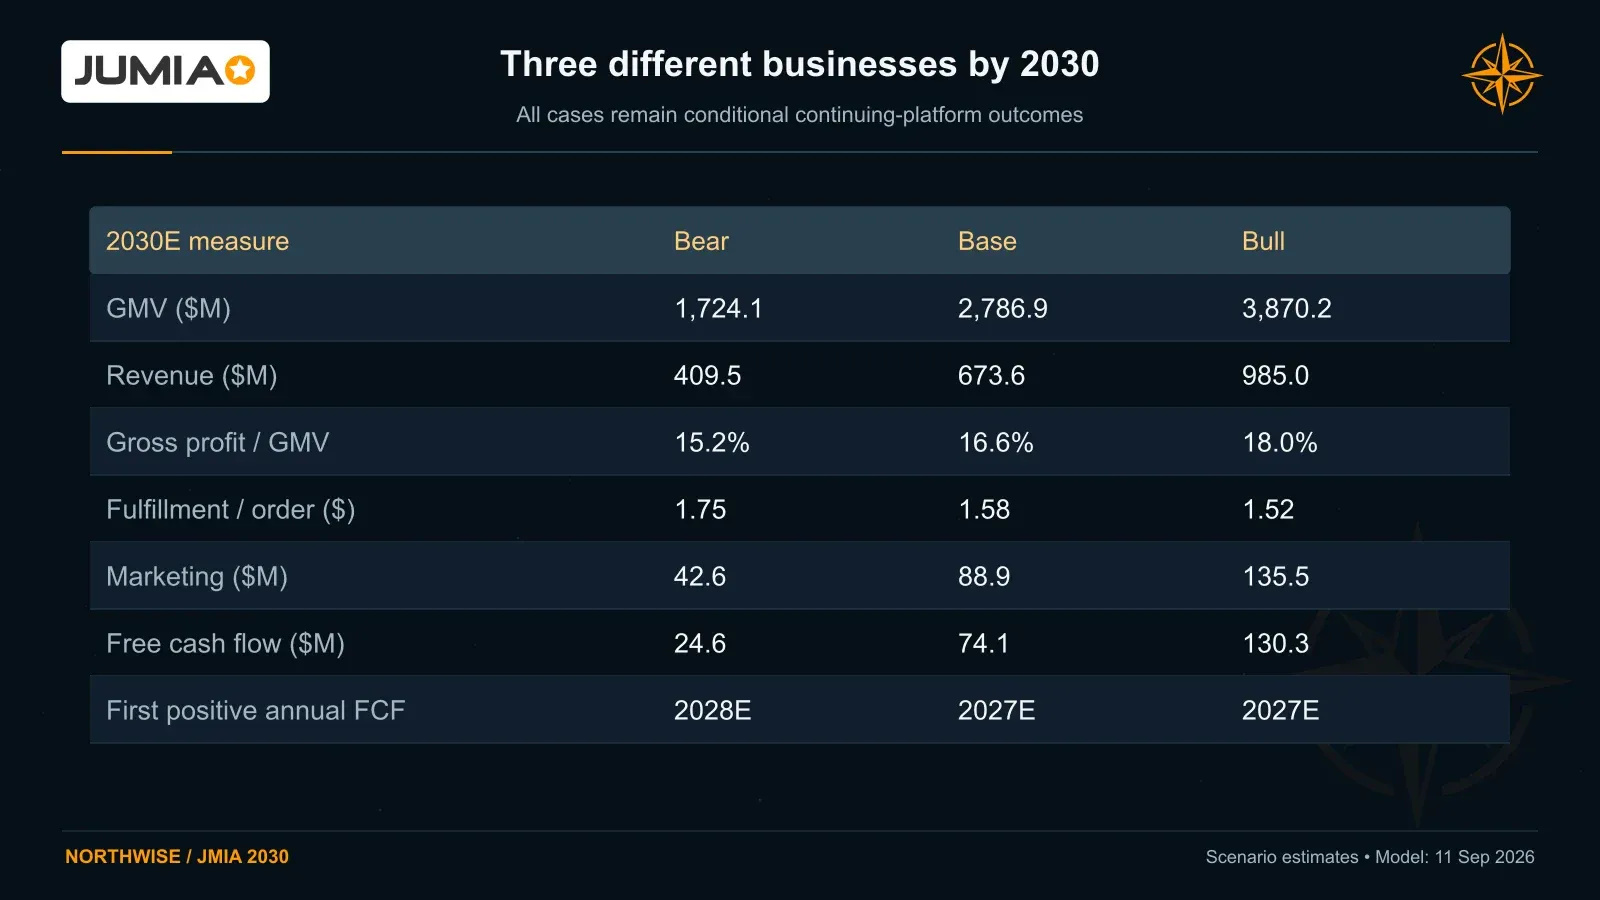
Bear, Base and Bull reach 2030 GMV of $1.72 billion, $2.79 billion and $3.87 billion, with annual self-funding beginning in 2028, 2027 and 2027 respectively.
This outcome would still represent meaningful progress from the loss-making business of recent years. It would not establish the same growth duration or reinvestment capacity as our central thesis.
11. Base case: the existing footprint finances a larger business
Base assumes Jumia completes the transition into annual self-funding in 2027 and gradually earns room for a larger investment program.
The eight current markets remain the foundation. Nigeria scales toward $720 million of GMV, while Kenya, Ivory Coast, and Ghana each become businesses generating more than $425 million. Tanzania contributes another $150 million.
The business does not achieve this by raising average basket values materially. Orders rise to approximately 78 million, supported by more customers and higher purchasing frequency. Advertising and services then produce more gross profit around that activity.
Base-case operating forecast | 2026E | 2027E | 2028E | 2029E | 2030E |
|---|---|---|---|---|---|
GMV | 1,004.8 | 1,253.8 | 1,653.0 | 2,170.1 | 2,786.9 |
Physical-goods orders | 28.3 | 35.8 | 47.3 | 61.6 | 78.2 |
Revenue | 238.4 | 294.1 | 389.9 | 519.0 | 673.6 |
Gross profit | 141.9 | 185.2 | 253.4 | 346.4 | 461.7 |
Fulfillment expense | 57.5 | 64.5 | 82.0 | 101.5 | 123.8 |
Sales and marketing expense | 25.3 | 30.1 | 46.3 | 65.8 | 88.9 |
Contribution after fulfillment and marketing | 59.1 | 90.6 | 125.1 | 179.1 | 249.1 |
Technology and product investment | 35.7 | 35.0 | 43.0 | 53.0 | 66.0 |
G&A and regional costs, excluding SBC | 62.9 | 49.0 | 55.5 | 61.5 | 67.3 |
Adjusted EBITDA | (27.8) | 18.6 | 39.6 | 79.6 | 132.8 |
Stock-based compensation | 6.0 | 7.5 | 10.0 | 13.0 | 17.0 |
Net income | (45.7) | 0.7 | 14.7 | 41.7 | 77.1 |
Estimated EPS per ADS | $(0.358) | $0.005 | $0.108 | $0.301 | $0.549 |
Capital expenditure | 3.5 | 6.0 | 11.0 | 15.0 | 19.0 |
Free cash flow after reinvestment | (41.8) | 2.6 | 14.9 | 38.7 | 74.1 |
Ending liquidity | 82.6 | 85.2 | 100.1 | 138.8 | 212.8 |
Operating liquidity reserve | 50.0 | 55.0 | 65.0 | 75.0 | 85.0 |
Year-end diluted ADSs | 134.3 | 135.8 | 137.5 | 139.4 | 141.5 |
The 2030 adjusted EBITDA figure includes approximately $57 million of incremental growth operating expense. We expect the company to remain an active investor in its own development even after profitability becomes established.
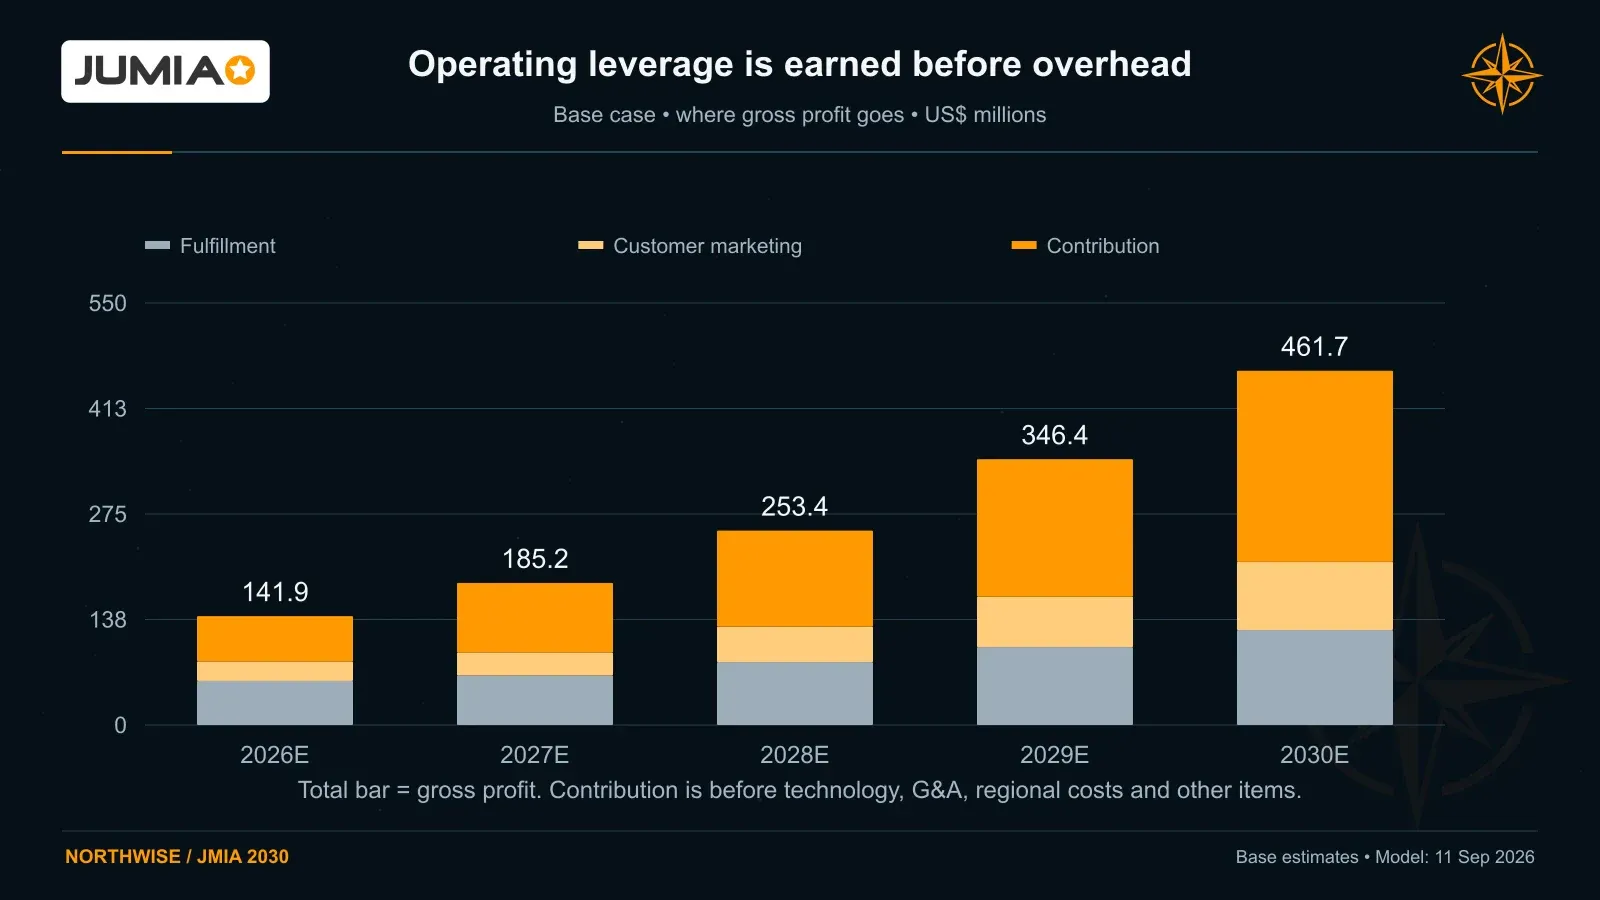
Base gross profit funds fulfillment and customer marketing before contribution supports corporate costs. Contribution grows to $249.1 million in 2030 despite higher marketing spend.
The relationship between scale and retained earnings is important. Gross profit reaches approximately $462 million, but the company retains only part of it after delivery, marketing, product development, and administration. Net income reaches $77 million after depreciation, stock compensation, finance items, and taxes.
We do not regard that investment spending as evidence of weak earning power if it is producing the modeled customer and supplier growth. We would regard it differently if spending increased while adoption and contribution stalled.
Free cash flow rises to approximately $74 million in 2030. The forecast retains that cash rather than assuming dividends or buybacks, producing approximately $213 million of year-end liquidity. With an $85 million operating reserve, about $128 million remains above the assumed needs of the business.
That is the financial capacity underlying our expansion thesis. It develops over several years; it does not arrive all at once when a single quarter crosses breakeven.
12. Bull case: reinvestment earns its return
Bull requires stronger adoption across the existing footprint, faster seller monetization, and a more successful expansion program.
GMV reaches approximately $3.87 billion in 2030, with growth remaining unusually strong through the later forecast years. Tanzania reaches $250 million of GMV, Angola’s marketplace reaches $85 million, and external logistics becomes a larger business across both existing and new markets.
The spending requirement is correspondingly higher. Annual sales and marketing reaches approximately $135 million by 2030. Technology and product investment reaches $100 million, including the additional product program.
Bull-case operating forecast | 2026E | 2027E | 2028E | 2029E | 2030E |
|---|---|---|---|---|---|
GMV | 1,044.9 | 1,398.6 | 1,987.5 | 2,819.2 | 3,870.2 |
Physical-goods orders | 29.4 | 40.2 | 57.3 | 80.9 | 110.1 |
Revenue | 247.8 | 332.5 | 486.2 | 708.9 | 985.0 |
Gross profit | 147.6 | 212.3 | 322.5 | 487.3 | 697.3 |
Fulfillment expense | 59.8 | 71.1 | 96.2 | 129.7 | 166.9 |
Sales and marketing expense | 26.3 | 35.0 | 58.9 | 91.9 | 135.5 |
Contribution after fulfillment and marketing | 61.5 | 106.2 | 167.4 | 265.6 | 394.9 |
Technology and product investment | 35.7 | 37.0 | 48.0 | 69.0 | 100.0 |
G&A and regional costs, excluding SBC | 62.8 | 50.0 | 65.0 | 79.5 | 88.0 |
Adjusted EBITDA | (25.3) | 31.7 | 69.4 | 136.1 | 230.9 |
Stock-based compensation | 6.0 | 8.0 | 12.0 | 18.0 | 26.0 |
Net income | (43.2) | 10.9 | 34.4 | 77.7 | 139.8 |
Estimated EPS per ADS | $(0.339) | $0.080 | $0.251 | $0.560 | $0.990 |
Capital expenditure | 3.5 | 7.5 | 15.0 | 23.0 | 32.0 |
Free cash flow after reinvestment | (39.3) | 11.6 | 30.9 | 70.2 | 130.3 |
Ending liquidity | 85.0 | 96.6 | 127.5 | 197.7 | 328.0 |
Operating liquidity reserve | 50.0 | 60.0 | 75.0 | 90.0 | 110.0 |
Year-end diluted ADSs | 134.3 | 135.9 | 137.8 | 140.0 | 142.5 |
This outcome requires considerably more than an eventual recovery in smartphones. It requires a larger customer base using Jumia more frequently, sellers purchasing more services, and fulfillment costs improving even as the network expands.
Gross profit reaches approximately 18% of GMV, compared with about 16.6% in Base. Contribution after fulfillment and marketing reaches approximately $395 million.
The company is still spending approximately $114 million annually on the incremental growth operating program in 2030. Bull therefore represents a platform that can finance an increasingly ambitious business while generating cash, rather than a mature retailer maximizing its final-year margin.
It is the most attractive operating outcome. It is also the one requiring the strongest sustained execution.
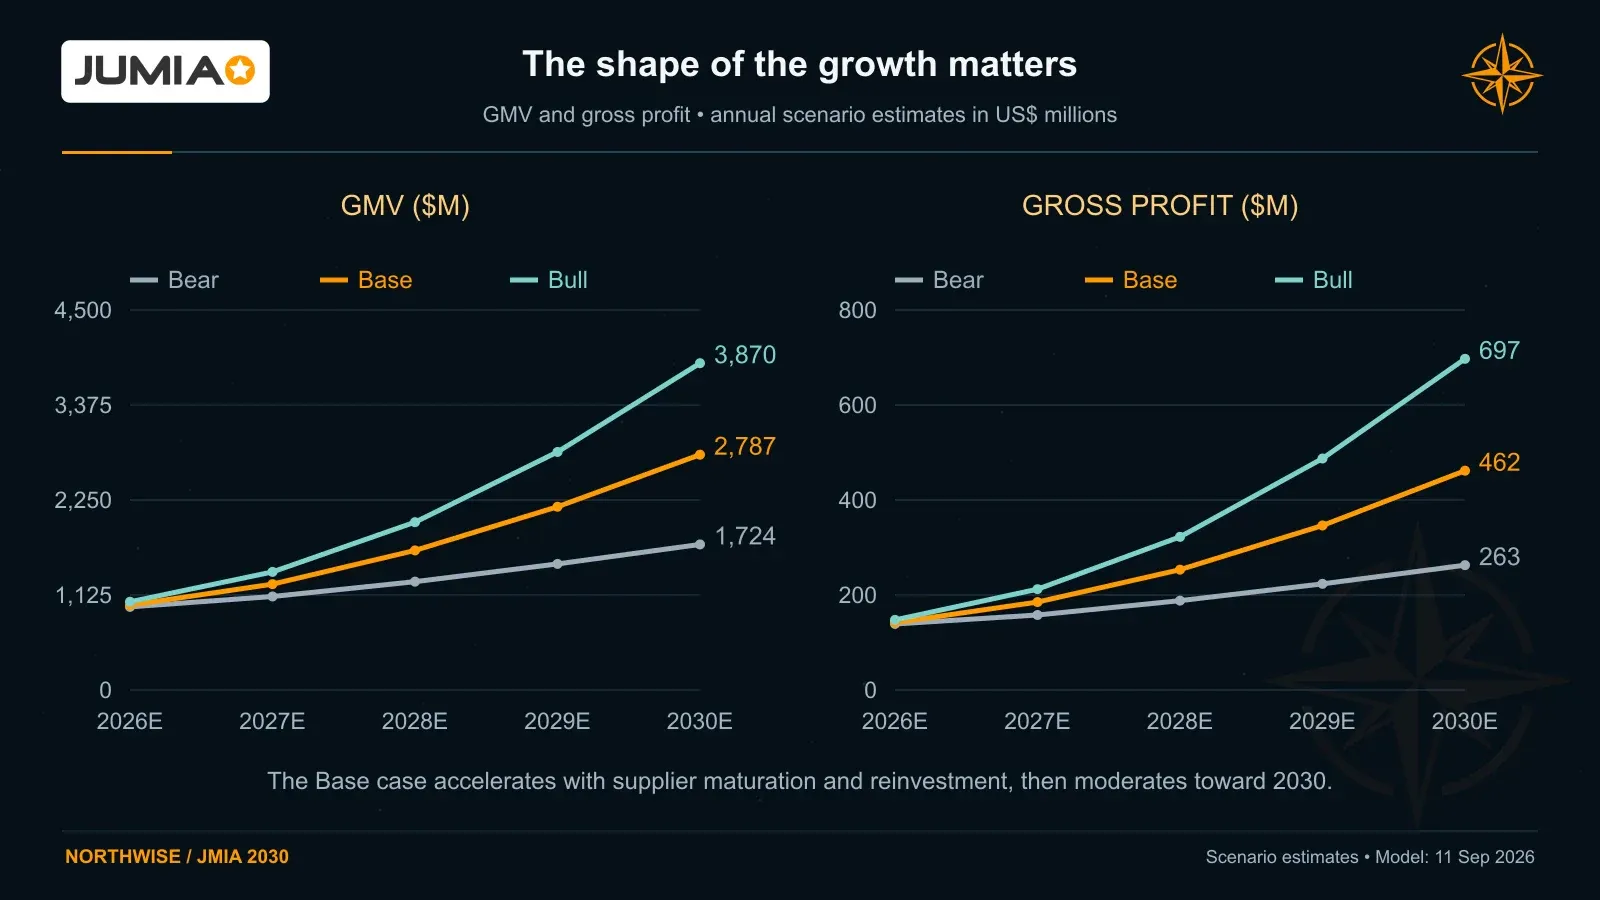
Annual GMV and gross-profit charts show the different growth paths through 2030; Base gross profit rises from $141.9 million in 2026 to $461.7 million in 2030.
13. How the evidence informs our scenario weights
The three scenarios describe possible businesses. Assigning weight to them requires a separate judgment about what the evidence supports.
We begin with observed demand, monetization, fulfillment efficiency, and contribution growth. The calculation then makes explicit assumptions about how much of those trends persists and how uncertain the future should be.
Evidence measure | Recent observed average | Persistence assumption | Forecast center |
|---|---|---|---|
Physical-goods order growth | 29.5% | 100% | 29.5% |
Dollar GMV growth | 27.5% | 100% | 27.5% |
Annual improvement in gross profit / GMV | 1.26 percentage points | 50% | 0.63 percentage points |
Annual reduction in dollar fulfillment cost per order | 3.5% | 100% | 3.5% |
Contribution growth after fulfillment and marketing | 52.0% | 75% | 39.0% |
The centers use the selected recent observation window. The calculation also considers available historical variation and applies explicit uncertainty floors. Order and GMV history extend across more quarters than some of the unit-economic measures.
We halve the recent improvement in gross-profit yield because part of 2026’s gain reflects a commission reset. Repeating that full increase every year would confuse a discrete pricing action with a recurring source of growth. Advertising and seller services support further improvement, but not necessarily at the same pace.
We also retain only 75% of recent contribution growth in its forecast center. The business is improving from a low starting point, and maintaining the full rate over several years would be a demanding assumption.
The forecast distributions are compared with the operating requirements of Bear, Base, and Bull. Orders and GMV are grouped together so that two related demand measures do not receive two full votes. Demand, monetization, logistics, and contribution each receive one-quarter of the aggregate weight.
That grouping and the equal category importance are Northwise judgments. The distributions are normal approximations used to express uncertainty, not observed probability laws for Jumia’s next four years.
Scenario | Evidence-informed weight |
|---|---|
Bear | 37.73% |
Base | 30.04% |
Bull | 32.23% |
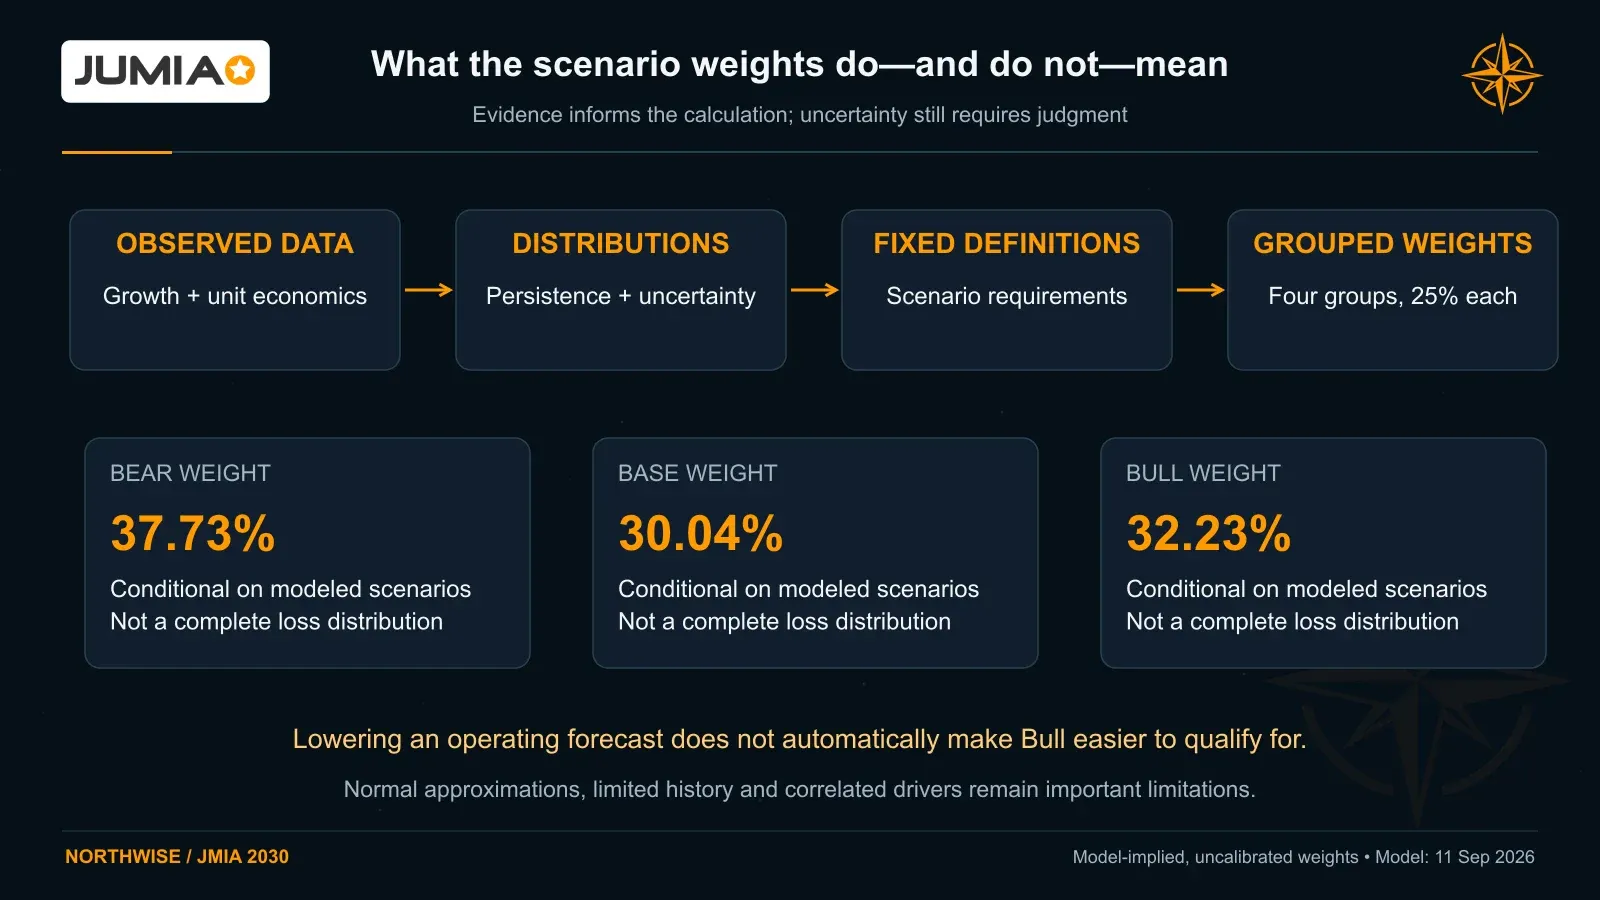
Evidence is grouped into demand, monetization, logistics and contribution. Calculated weights are 37.73% Bear, 30.04% Base and 32.23% Bull; these are not calibrated probabilities.
The result is not centered overwhelmingly on Base. Demand and monetization support substantial upside, while the fulfillment improvement required by the stronger cases is more demanding than recent dollar-denominated results alone would suggest.
This is a useful tension within the evidence. It prevents an attractive customer-growth story from automatically receiving full credit for future logistics efficiency.
Ordinary operating stress tests keep the issued scenario definitions fixed. Lowering a forecast does not automatically make Bull easier to achieve and increase its weight. New evidence can change the assessment; a weaker forecast by itself should not be mistaken for stronger evidence.
These remain evidence-informed, model-implied weights. Several measures have limited histories, quarterly growth observations overlap, and the underlying drivers are related. They are not empirically calibrated probabilities that every assumption in a complete scenario will occur together. Expansion success and the valuation assigned by investors require further judgments.
14. Where the operating plan is vulnerable
The largest near-term vulnerability is the narrow margin around initial self-funding.
In Base, approximately $2.6 million of free cash flow in 2027 is spread across almost 36 million physical-goods orders. Holding everything else constant, roughly seven cents of additional cost per order would absorb that surplus.
That is why the following operating tests matter:
Isolated change from the approved assumptions | Base 2027 free cash flow |
|---|---|
Baseline | $2.61M |
Core local-currency growth lower by five percentage points annually | $(0.91)M |
Additional annual FX drag of five percentage points | (2.01) |
Fulfillment cost higher by $0.25 per order | (6.35) |
Advertising yield lower by 0.50 percentage points | (3.63) |
Incremental growth spending 50% higher, demand unchanged | (0.65) |
Additional working-capital investment of $10M annually | (7.39) |
These are deterministic sensitivities, not separately assigned probabilities. They show how a modest change in unit economics can postpone the funding milestone without necessarily destroying the long-term business.
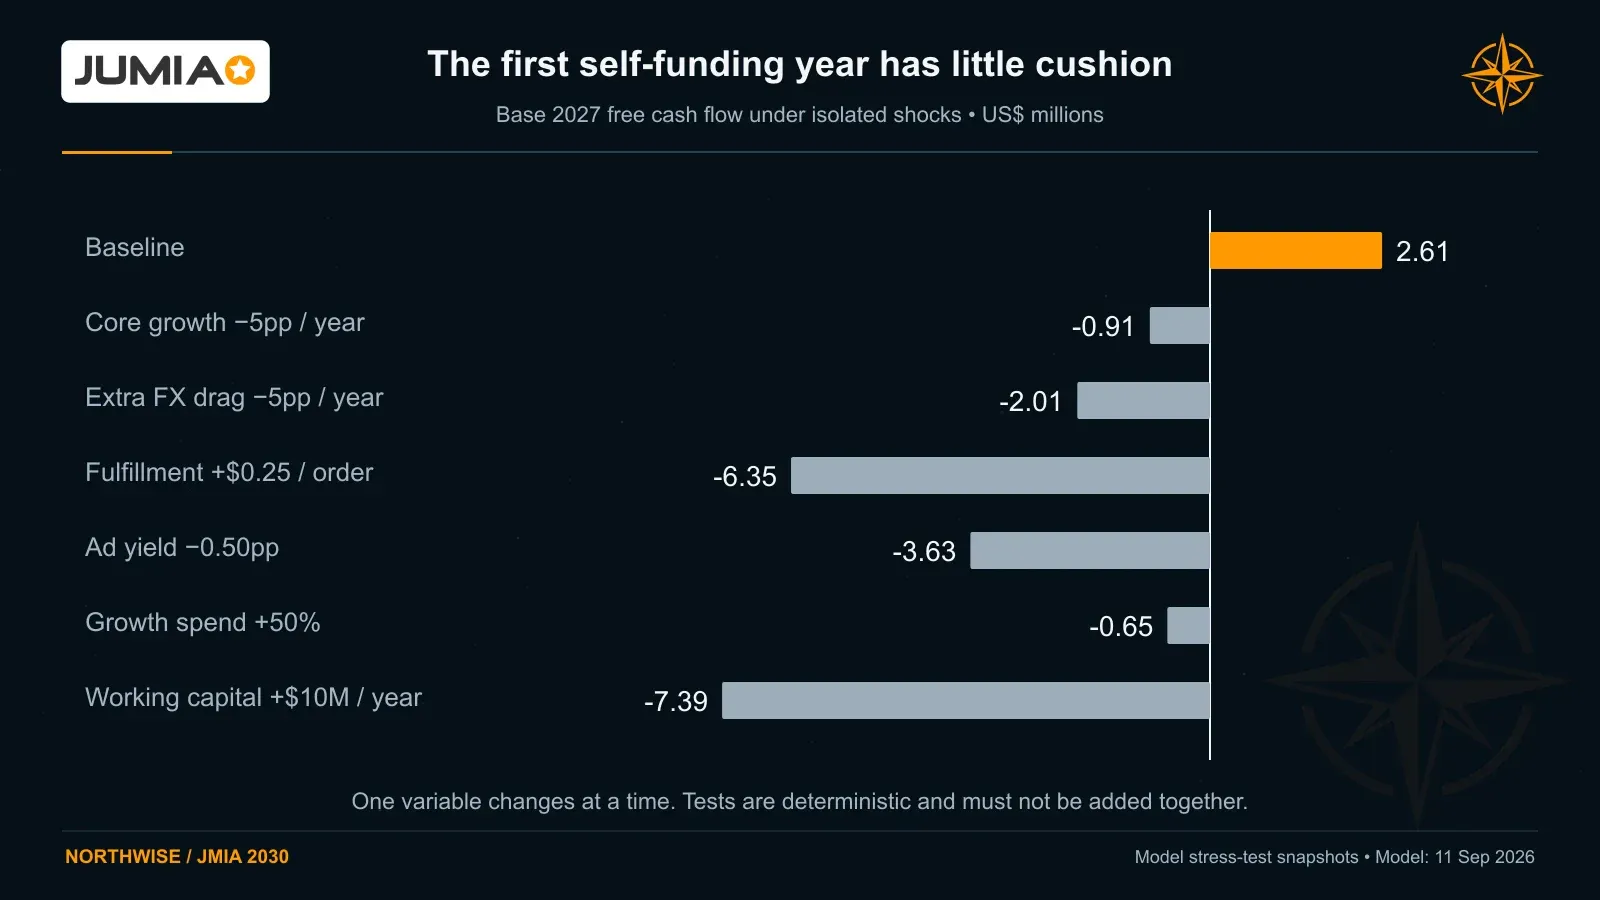
Base 2027 free cash flow of $2.61 million turns negative under modest growth, FX, fulfillment, advertising, spending or working-capital shocks.
The appropriate response could be to slow a launch, change marketing allocation, reduce working-capital commitments, or retain a smaller investment budget until cash generation improves. Management has choices, but those choices can affect growth.
Competition is another source of pressure. A continental footprint does not ensure the best price in every category or the strongest service in every city. Local merchants can offer immediate possession and established customer relationships. Cross-border platforms can compete through assortment and price without reproducing Jumia’s entire organization.
Dufay reported subdued competitive intensity during Q1 and suggested that shipping and regulatory friction were creating difficulties for some nonresident platforms. We treat that as management’s assessment of conditions at the time, not evidence that competition has permanently weakened.
The more durable defense would be a combination customers and sellers find difficult to replace: suitable products, competitive landed prices, dependable delivery, useful local payment options, and enough repeat demand to keep merchants engaged.
Currency creates risk on both sides of the transaction. Local demand can grow while dollar GMV disappoints. Imported merchandise can become less affordable, while some locally incurred costs translate into fewer dollars. The net result depends on pricing, sourcing, and the ability of customers to absorb the change.
Tax and regulatory complexity also remain country-specific. Our tax forecast uses an overlay for minimum cash taxes, profitable activity, and payment timing. It is not a fully disclosed country-by-country tax-loss schedule. Profitable subsidiaries can face taxes before the consolidated group produces substantial earnings.
Finally, the three operating cases do not cover every possible outcome. A combined deterioration in growth, monetization, fulfillment, and investment efficiency eventually produces a funding shortfall in the unfunded Bear stress path. Continuing to spend through that shortfall would require financing or a different operating plan.
Jumia’s progress gives management more flexibility. It does not remove the consequences of weak capital allocation.
Evidence and model notes
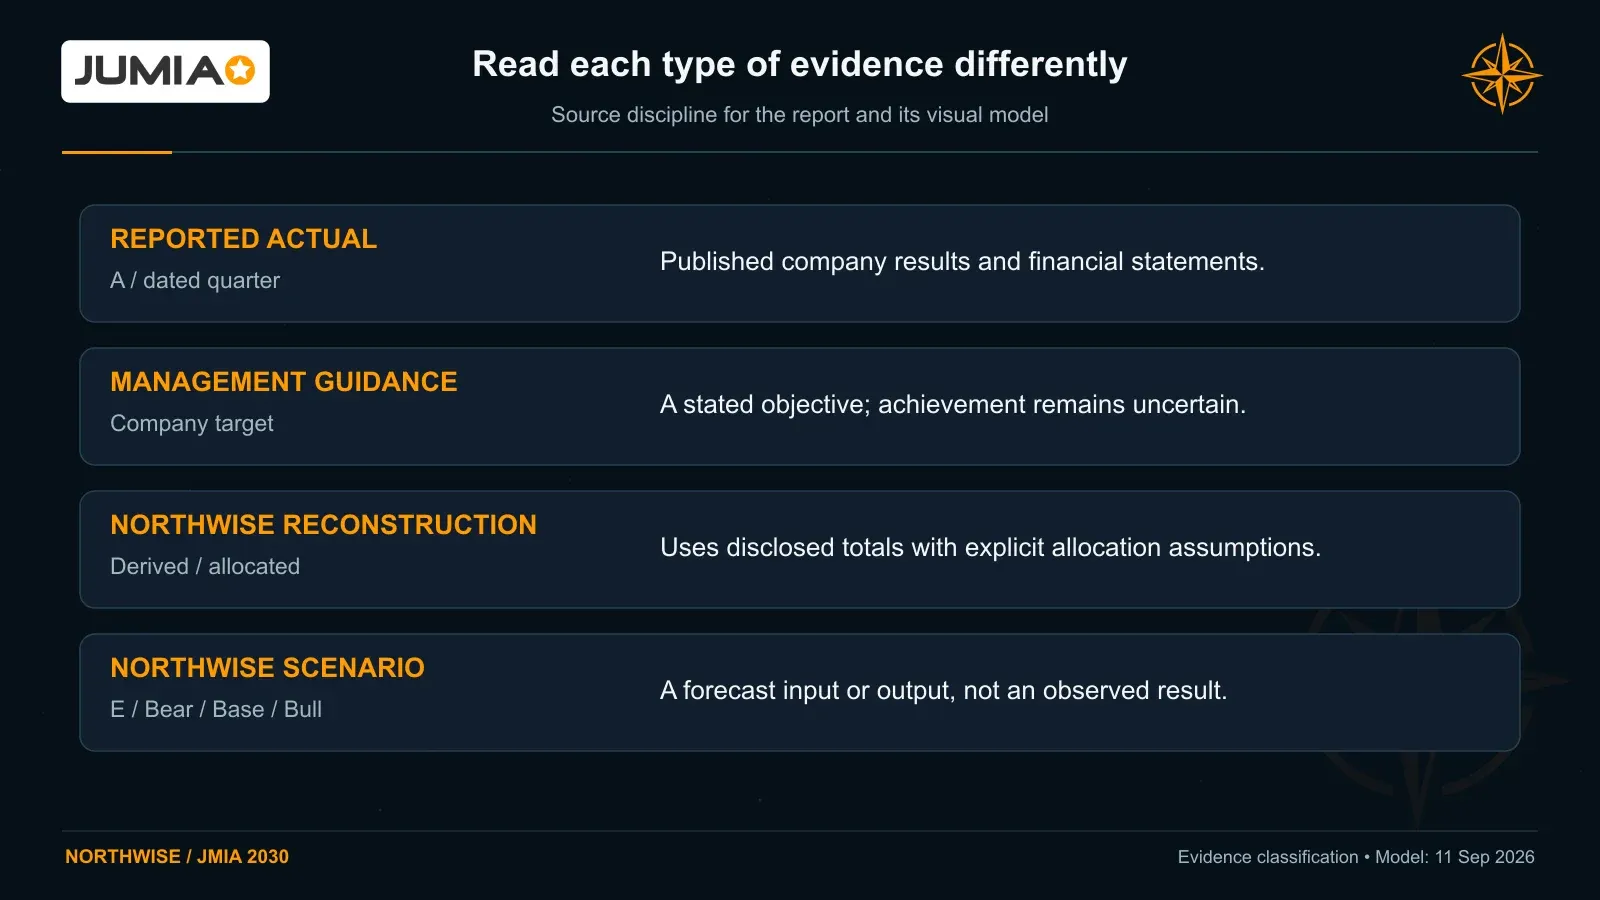
The report distinguishes company-reported actuals, management guidance, Northwise reconstructions and Northwise scenario assumptions; forecasts and launch dates are not company commitments.
All forecasts are Northwise estimates from the supplied client model. The $7.28 comparison price is a fixed model reference, not a live quote. The valuation date is September 11, 2026. Actuals, reconstructed allocations, guidance and scenarios have different evidentiary status. Country launches and underwriting multiples are assumptions. The featured scene is an AI-generated editorial illustration, not a photograph of a specific Jumia facility.
- Jumia Q1 2026 results
- Jumia Q2 2026 results and announced capital raise
- Jumia H1 2026 interim financial statements
- Northwise: Where Will Jumia Expand Next?
15. The milestones that deserve attention
The next results should be read in sequence.
First, Jumia needs to approach the fourth-quarter earnings objective without relying on a deterioration in service quality or an unsustainable reduction in growth investment. Positive seasonal cash flow will be welcome, but the full-year 2027 result will provide the stronger test.
Second, higher marketing spending needs to be accompanied by customer behavior that justifies it. Order growth, repeat purchase, and contribution after fulfillment and marketing should develop together. Growth that disappears when promotions stop would support a different interpretation.
Third, international seller activity needs to continue moving from onboarding into inventory commitment, orders, advertising, and warehousing revenue. Seller count alone is insufficient.
The country mix will also matter. Nigeria must continue carrying a large share of growth, Ghana must absorb expansion without degrading execution, Ivory Coast needs a recovery in demand, and Egypt’s reported revenue must be interpreted alongside its changing retail and marketplace mix.
We are bullish because Jumia has several opportunities to improve the business using capabilities it already possesses. The case does not require an immediate launch in every attractive market. It requires management to keep converting better economics into productive investment.
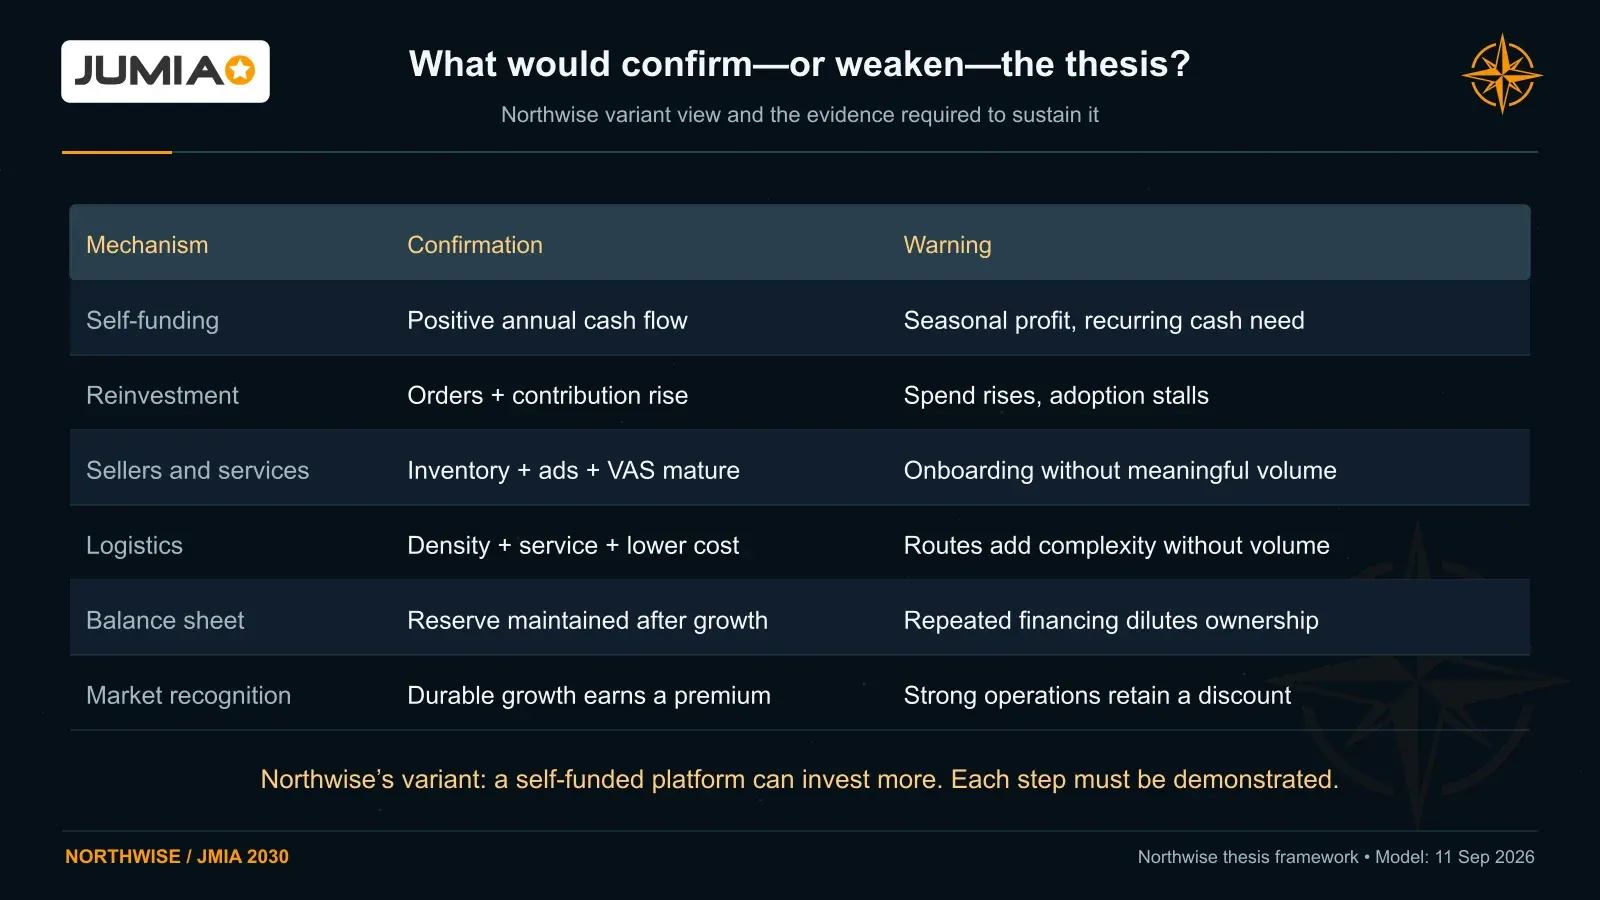
The Northwise thesis depends on sustained self-funding, productive reinvestment, seller monetization and logistics efficiency; renewed financing needs or weak returns on spending would undermine it.
The full country schedules, annual financial statements, funding assumptions, dilution paths, and scenario calculations are available in the Northwise Jumia 2026–2030 model.
The downloadable workbook is available with Northwise Premium.
Continue with Northwise Premium
The operating forecast establishes what Jumia could become and what it must spend to get there. The investment decision also requires a price.
Northwise Premium continues below with our valuation framework, annual per-ADS targets, evidence-weighted outcome, valuation stress tests, and the entry prices required to earn our target returns through December 2030.
Northwise Premium
Choose how to continue with Northwise
Join Northwise Premium
Unlock the rest of this report, its complete valuation, the downloadable model, portfolios, and action framework.
Join Northwise PremiumCreate a Free Account
Continue across Free Northwise research, follow companies, save reports, and receive updates.
Create a Free Account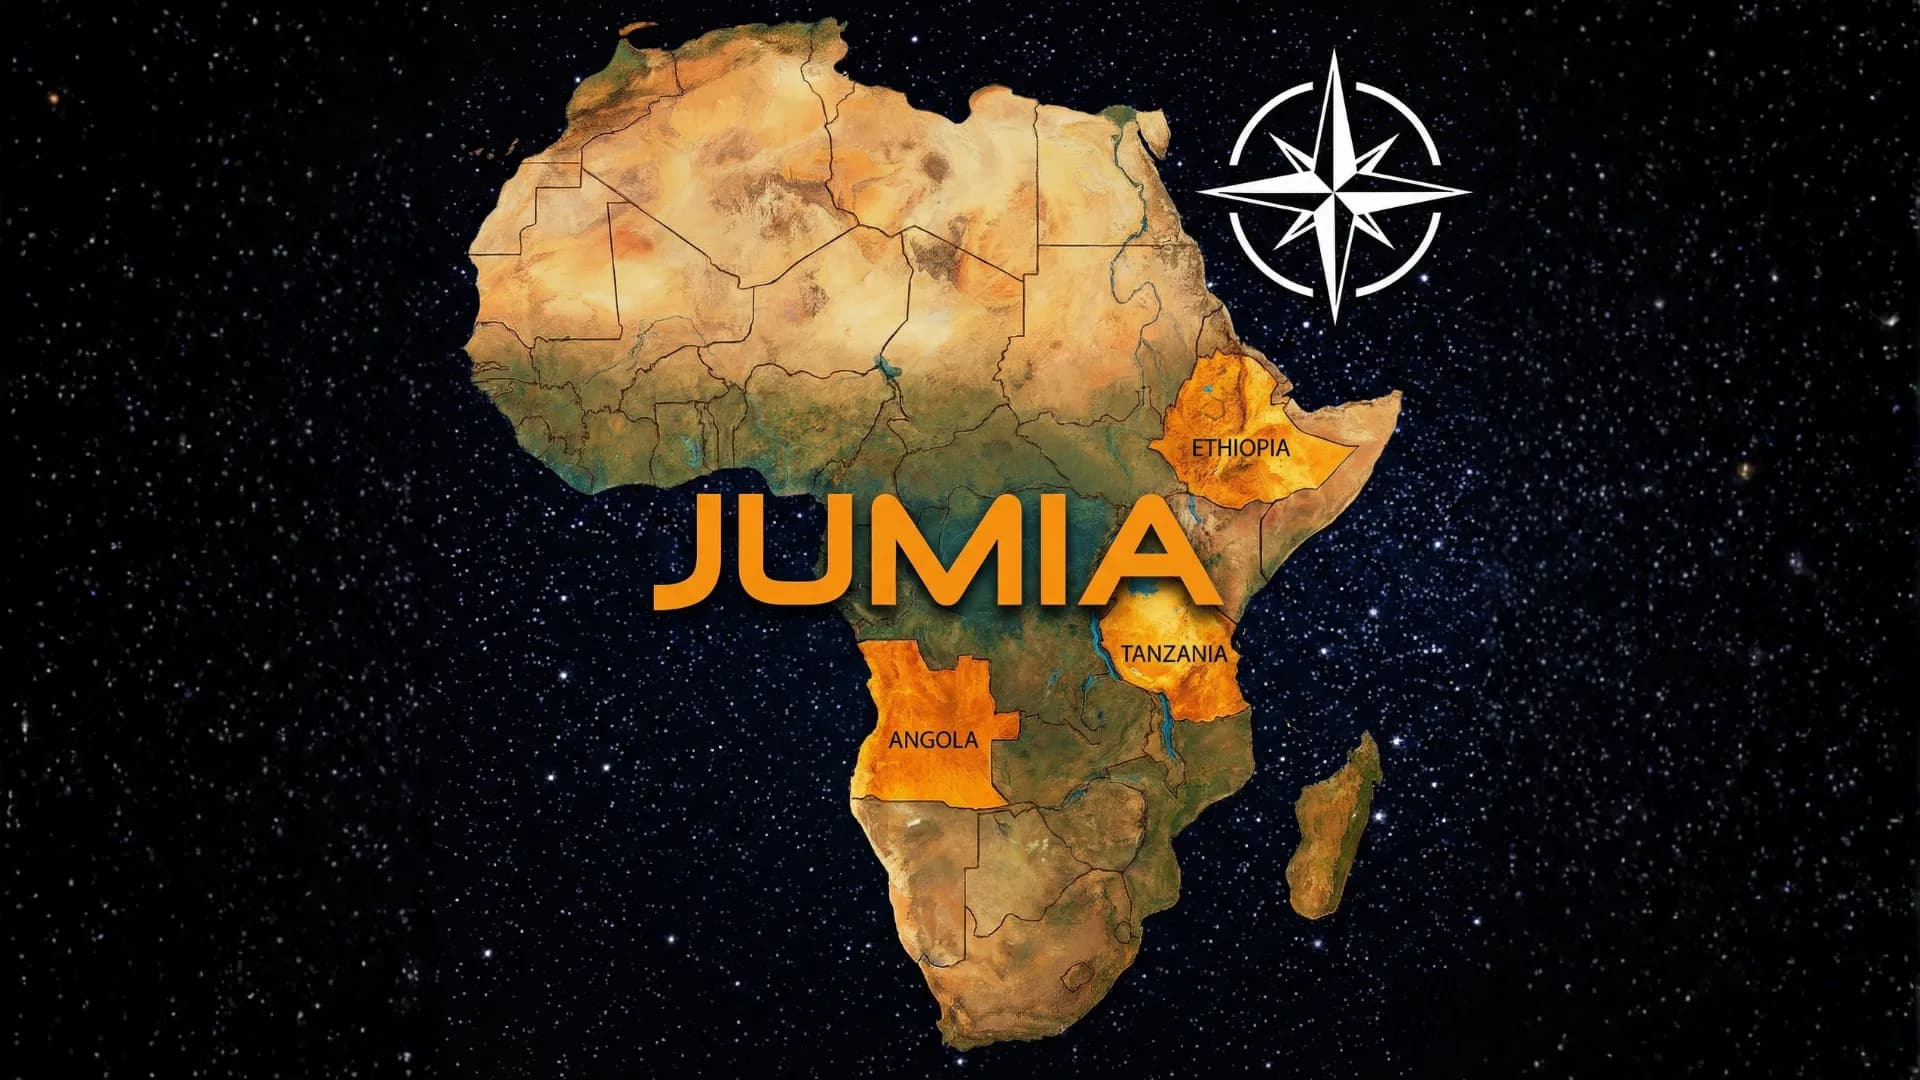
Where Will Jumia Expand Next?
Where will Jumia expand next after profitability? We examine Tanzania, Angola, and Ethiopia as post-2027 growth options.

Jumia Uganda
Jumia Uganda strategic analysis covering logistics, JForce, JumiaPay, 3PL expansion, and the path to 2027 profitability.

Jumia Kenya
Jumia Kenya analysis covering rural growth, tax risks, China sourcing and path to 2027 profitability in East Africa.
Northwise Portfolios
See how the research becomes real decisions
Reader discussion
Discuss the research
Premium access is required to join this report's discussion.
Join Northwise Premium
No comments yet. Start a thoughtful discussion.