
Where Will Jumia Expand Next?
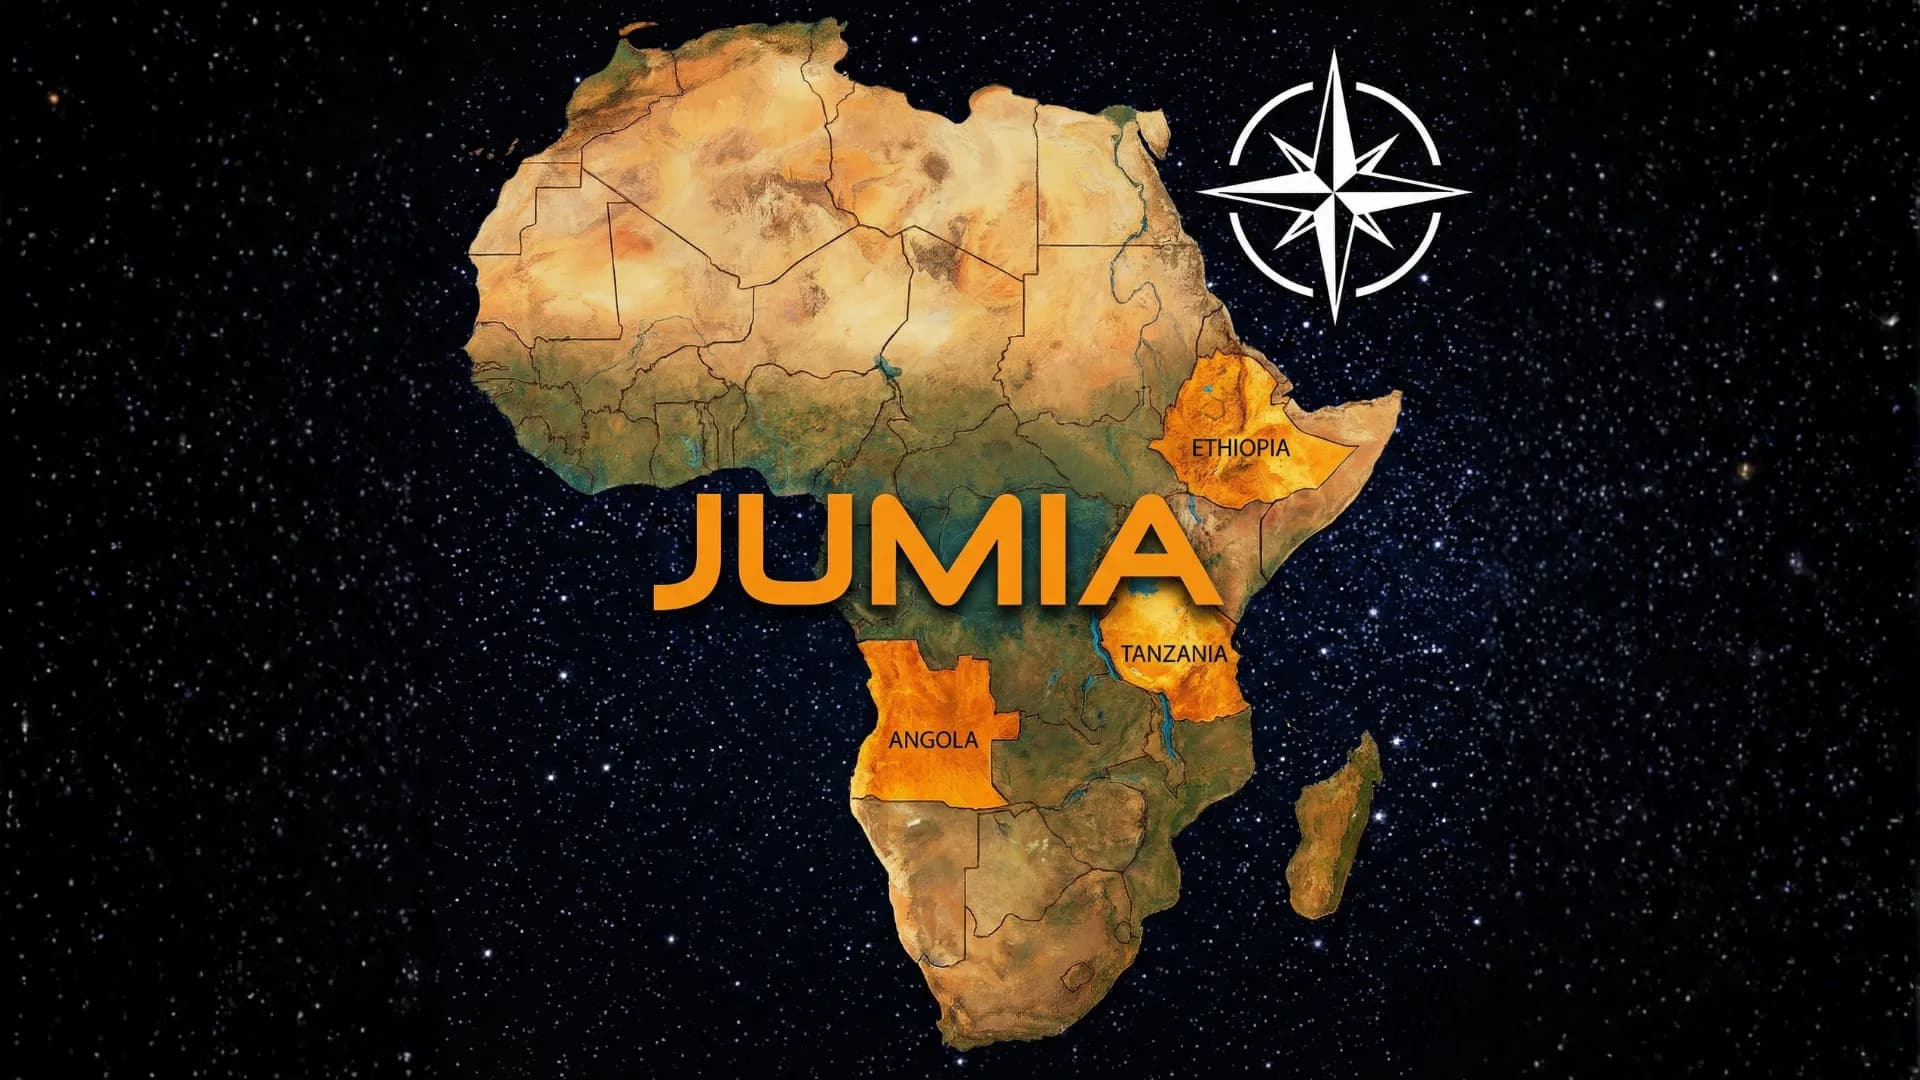
Where will Jumia expand next after profitability? We examine Tanzania, Angola, and Ethiopia as post-2027 growth options.
In this article
An institutional analysis of Jumia’s post-profitability expansion path in the form of the question: where will Jumia expand next, evaluating Tanzania reentry, Angola optionality, and Ethiopia’s regulatory frontier.
1. From Retrenchment to Re-Expansion
Jumia’s next geographic chapter begins with contraction, not expansion.
Between 2024 and early 2026, the company exited South Africa through the Zando divestiture, withdrew from Tunisia, and most recently shut down operations in Algeria. These were not marginal adjustments. They were structural amputations designed to stabilize the operating core.
Algeria illustrates the logic. In 2025, the country contributed roughly 2% of group GMV while consuming disproportionate management bandwidth. Restrictive trade policies, heavy reliance on cash payments, and regulatory friction created an environment where scale did not translate into operating leverage. Capital deployed there produced activity, but not durable contribution margin.
This period of retrenchment marked the practical beginning of the Dufay era.
The Profitability Gate
Under CEO Francis Dufay, Jumia re-centered the company around unit economics, logistics efficiency, and cash discipline. The financial data from FY 2025 shows the early results of that pivot.
- Revenue increased 34.4% year over year to $61.4M
- GMV grew 35.6% to $279.5M
- Adjusted EBITDA loss narrowed 46.7% to $(7.3M)
- Operating loss contracted 39%
For the full year 2025:
Metric | FY 2025 |
|---|---|
Revenue | $188.93M |
GMV | $818.6M |
Adjusted EBITDA Loss | $(50.5M) |
Loss Before Income Tax | $(60.1M) |
Liquidity Position | $77.8M |
Active Customers (Physical Goods) | 3.0M |
Fulfillment expense per order declined from $2.24 to $1.97 in Q4, a 12.1% improvement. That decline represents more than cost cutting. It signals density gains inside the network.
Jumia now targets:
- Adjusted EBITDA breakeven in Q4 2026
- Full-year profitability and positive free cash flow in 2027
These are not aspirational milestones. They function as gates. Management has stated clearly that no new country entries will occur until the company is self-funding and capable of absorbing two to three years of upfront investment in a new geography.
Expansion requires cash reserves. Cash reserves require operating leverage. Operating leverage requires density.
Drop Density as Structural Foundation
The core concept underpinning re-expansion is drop density.
In Lagos, Jumia layers third-party parcel volume onto existing routes. Each additional package reduces marginal cost per stop. The delivery van becomes more efficient with every incremental parcel, similar to how a fiber network becomes more valuable as more users plug into it.
In Ivory Coast, approximately 351 pickup stations support positive contribution margins even on lower average order values. These pickup stations operate as capillaries in the logistics system. They reduce failed deliveries, lower last-mile friction, and compress fulfillment expense.
The company also deliberately reduced corporate sales exposure in Egypt throughout 2024 and 2025. Corporate transactions inflated GMV but carried thinner margins. By shifting back toward marketplace-first consumer transactions, Jumia improved gross profit quality rather than simply reporting higher volumes.
This repositioning matters for expansion.
The earlier Jumia expanded on GMV momentum. The new Jumia expands on margin durability.
Why Retrenchment Precedes Growth
A marketplace entering a new country resembles a power plant construction project. The upfront capital outlay is heavy. Warehousing, staff, marketing, seller onboarding, regulatory compliance, and payment integration create a front-loaded cost curve. Revenue scales gradually.
Management now assumes a 24 to 36 month runway before contribution margin positivity in a new geography. That runway must be financed internally.
Liquidity stood at $77.8M at the end of FY 2025, down from $120.6M the prior year due to operating losses and restructuring. Breakeven in 2026 and positive cash flow in 2027 rebuild that buffer. Only after that rebuild does expansion move from theoretical to executable.
This sequencing defines the post-2027 expansion narrative.
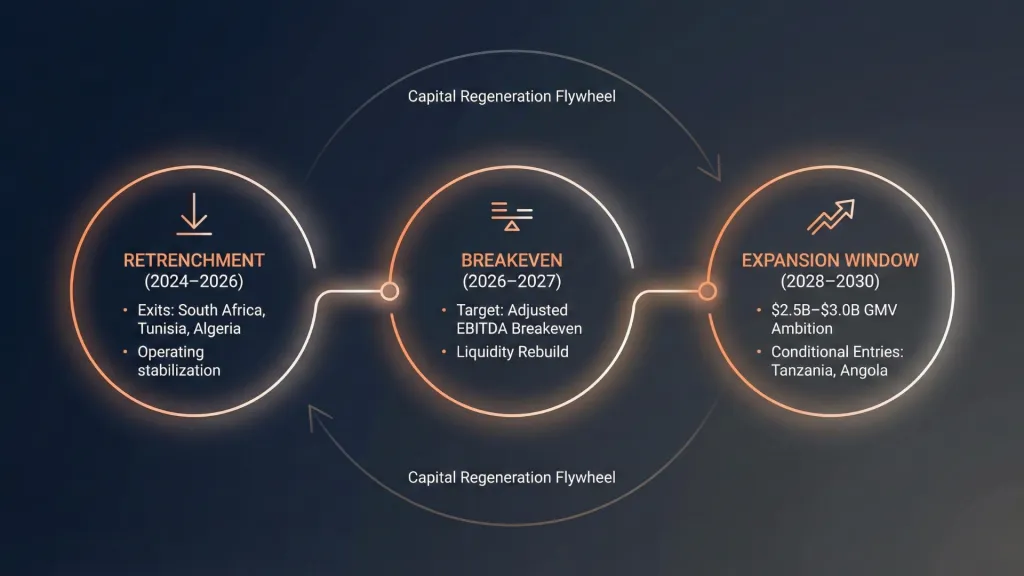
The exits from South Africa, Tunisia, and Algeria were strategic sacrifices designed to create operating leverage inside Nigeria, Egypt, Kenya, Morocco, Ivory Coast, Senegal, Ghana, and Uganda. Those core markets now form the earnings engine that could finance Tanzania reentry, Angola activation, or Ethiopian frontier entry later in the decade.
The expansion question therefore shifts from survival to selectivity.
The next phase of Jumia’s geographic growth will not resemble its earlier land acquisition strategy. It will resemble a capital allocation decision governed by strict internal gates.
2. The 2025 Investor Day and the 2030 Expansion Map
November 13, 2025 marked the moment Jumia moved from recovery story to capital allocator.
At the Investor Day in London, CEO Francis Dufay and EVP Antoine Maillet-Mezeray presented a five-year roadmap that reframed the company’s trajectory. The discussion centered less on operational cleanup and more on scale ambition. The headline target was clear: GMV of $2.5B to $3.0B by 2030.
To contextualize that figure, FY 2025 GMV totaled $818.6M. Reaching the midpoint of the 2030 target implies a sustained compound growth rate near 25% annually over five years. That growth cannot be achieved solely through efficiency improvements in existing markets. Geographic optionality re-enters the discussion.
Yet the tone was disciplined.
Official Expansion Candidates
During the presentation, management formally identified Tanzania and Angola as long-term growth options. The phrasing was deliberate. These markets were positioned as conditional expansions, not imminent launches.
The company outlined three structural preconditions before entry could be sanctioned:
- Breakeven achieved ahead of or on schedule
- Positive free cash flow generation
- Excess liquidity beyond operating buffer requirements
Expansion before 2030 would require what management described as favorable circumstances, such as earlier-than-expected cash generation or faster margin expansion in core markets.
The message was calibrated. Tanzania and Angola are on the map, though the timing is subordinated to capital discipline.
Recalibrating the Portfolio
The Investor Day roadmap also clarified how Jumia now views its operating footprint.
The core portfolio consists of:
- Nigeria
- Egypt
- Kenya
- Morocco
- Ivory Coast
- Senegal
- Ghana
- Uganda
Within this structure, markets serve different roles. Nigeria drives volume and brand presence. Ivory Coast contributes efficiency. Kenya and Egypt anchor scale in East and North Africa. Uganda operates as a satellite corridor extension.
Expansion will occur from this base outward, not from scratch.
The 2030 Ambition in Context
The 2030 financial outline presented several structural targets beyond GMV growth:
Target Area | 2030 Objective |
|---|---|
GMV | $2.5B–$3.0B |
CAGR (2025–2030) | ~25% |
Take Rate Expansion | +2.0 to +2.5 percentage points |
Advertising Revenue | Increase from 1% to 2% of GMV |
Automated Pricing | Live margin optimization implementation |
Take rate expansion reflects monetization rather than pure transaction growth. Advertising scaling from 1% to 2% of GMV effectively doubles a high-margin revenue stream. Automated pricing introduces algorithmic margin management into first-party retail.
Each lever improves internal cash generation, which in turn funds optional expansion.
Capital Before Geography
The 2025 presentation subtly inverted the historical sequence of Jumia’s growth. Earlier phases emphasized geographic presence first, unit economics later. The current strategy reverses that order.
Geography now follows capital.
The company projects:
- Adjusted EBITDA breakeven in Q4 2026
- Positive free cash flow in 2027
- Sustainable expansion funding window opening in 2028
This sequencing establishes 2028 to 2030 as the realistic horizon for new country deployment.
In this framework, Tanzania and Angola function as conditional expansion nodes. Ethiopia sits as a frontier opportunity outside the formal roadmap, though structurally relevant due to scale and regulatory shifts.
The 2025 Investor Day did not announce a launch date. It established a capital hierarchy. Expansion exists at the top of that hierarchy, though only after margin durability and liquidity sufficiency are achieved.
With the roadmap clarified, the next step is understanding the institutional filters governing entry decisions.
We move next to the Five Gates of Expansion.
3. The Five Gates of Expansion: Where will Jumia Expand Next?
Expansion in the next phase of Jumia’s life will not be driven by optimism or headline growth rates. It will be governed by internal filters that function more like credit underwriting standards than marketing ambition.
Management has formalized five gates that must be cleared before a new country entry is approved. These gates institutionalize capital discipline and convert geographic expansion into a structured investment decision.
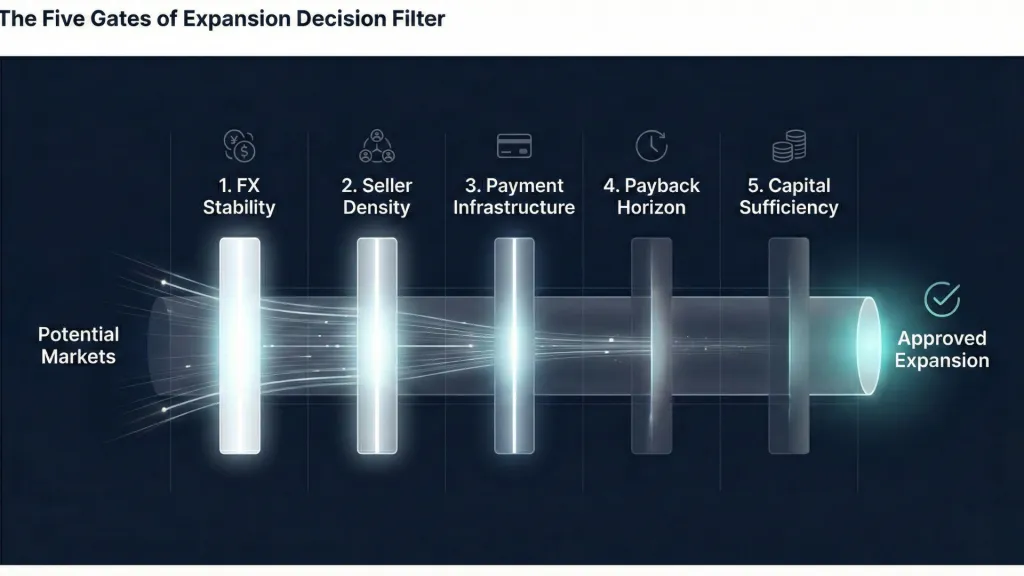
Each prospective market must pass through all five.
Foreign Exchange Stability
Currency volatility previously eroded Jumia’s margins in multiple markets. Devaluations inflated import costs while compressing consumer purchasing power. The impact was immediate on first-party inventory and indirect on marketplace volumes.
A new market must demonstrate a relatively predictable FX regime. This does not imply a fixed currency or zero volatility. It requires a macro environment where sudden double-digit devaluations are unlikely to impair sourcing economics.
In practical terms, FX stability determines whether the company can model gross margin with confidence over a 24 to 36 month horizon.
Partner Density and Seller Ecosystem
Marketplace depth requires local seller supply. Variety and competitive pricing depend on a healthy third-party ecosystem.
Jumia’s Yiwu sourcing office in China serves as a structural supplement, though it does not replace local merchant density. As of September 2025:
- 24,000 China-based sellers were active on the platform
- 2.2M China-sourced items were stocked in African warehouses
This external pipeline provides assortment breadth and pricing flexibility. Still, a new geography must exhibit sufficient domestic merchant participation to sustain repeat transactions and category expansion.
Without local seller depth, marketing expense per order rises and customer retention weakens.
Payment Infrastructure Penetration
Digital payment rails represent one of the most critical thresholds.
Cash-on-delivery remains common across Africa. It supports trust in early-stage e-commerce markets, though it introduces failed delivery risk and working capital friction.
Management now evaluates digital payment penetration as a leading indicator of viability. Mobile money saturation, instant payment systems, and interoperability across banks reduce failed deliveries and compress fulfillment costs.
In core markets, improvements in payment infrastructure have contributed to higher repurchase rates and lower per-order losses.
A candidate market must show digital rails capable of scaling transaction volume without excessive reliance on cash.
Payback Horizon Discipline
The internal financial model assumes that a new geography should approach contribution-margin positivity within 24 to 36 months.
This assumption reflects a shift in philosophy. Earlier expansion waves tolerated prolonged loss periods under a growth-first framework. The current structure emphasizes capital efficiency.
Each new market must demonstrate:
- Sufficient population density in primary cities
- Logistics corridor feasibility
- Marketing cost per order trending toward sustainability
- Clear path to drop density optimization
If the modeled payback period exceeds the threshold, entry is deferred.
Capital Sufficiency
The final gate is liquidity.
At the end of FY 2025, liquidity stood at $77.8M. Breakeven targeted in Q4 2026 and full-year profitability in 2027 serve to rebuild internal reserves.
Expansion requires the ability to fund:
- Warehouse setup
- Local staffing
- Marketing ramp
- Seller onboarding infrastructure
- Regulatory compliance
- Working capital for inventory
Management has indicated that expansion should not require a return to equity markets. Capital must be generated internally.
The earliest realistic funding window for a new geography aligns with sustained positive free cash flow in 2027 and incremental reserve accumulation into 2028.
These five gates transform expansion into a sequential filter.
A market may possess strong GDP growth, though fail on FX stability. Another may exhibit digital payment maturity, though lack seller density. A third may satisfy operational conditions, though require capital beyond internal reserves.
Tanzania, Angola, and Ethiopia must therefore be evaluated through this framework rather than through headline demographics alone.
We move next to Tanzania, the most structurally executable reentry candidate.
4. Tanzania: The Reentry Candidate
Tanzania represents the most structurally executable expansion within Jumia’s post-2027 horizon.
The company exited the market in 2019 under what was then described as portfolio optimization. At the time, scale and digital infrastructure were insufficient to justify continued capital allocation. The Tanzania of 2026 is materially different.
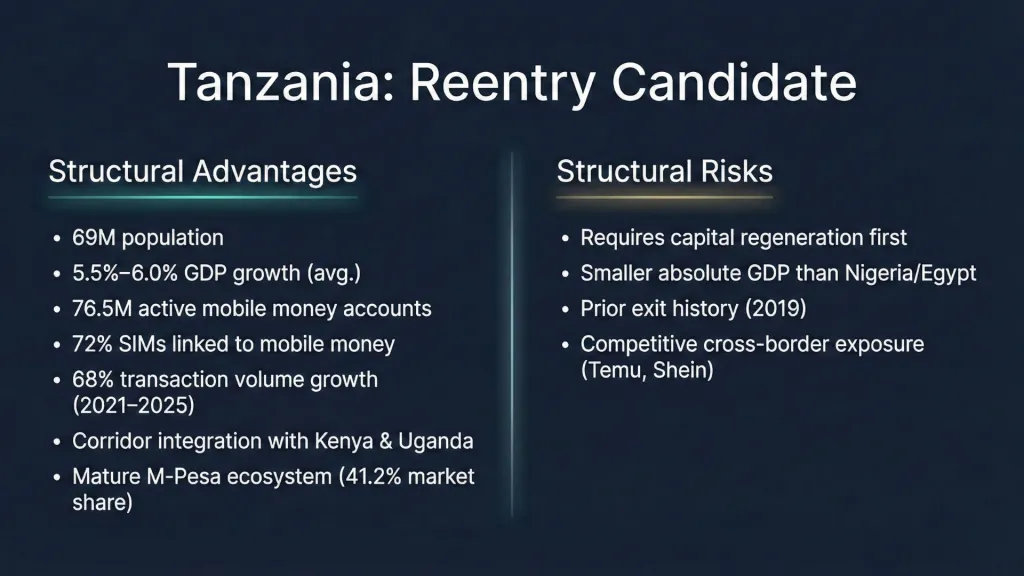
The country now has a population of approximately 69M and a GDP of $79B. Real GDP growth has averaged between 5.5% and 6.0%, placing Tanzania among the faster-growing economies on the continent. Growth alone does not justify marketplace entry, though it provides the macro tailwind required for consumption expansion.
Digital Payment Penetration
The most significant structural shift since Jumia’s exit is mobile money saturation.
By the end of 2025:
- 72% of SIM cards were linked to mobile money services
- Active mobile money subscriptions reached 76.5M
- SIM penetration reached 131%
- Transaction volumes increased 68% between 2021 and 2025
Market share within mobile money is concentrated:
- Vodacom’s M-Pesa holds 41.2%
- Yas, formerly Tigo, holds 28.1%
- M-Pesa Super App users reached 6.7M
These figures materially alter the payment gate assessment. The trust and settlement friction that constrained early e-commerce attempts has weakened. Digital wallet ubiquity reduces failed delivery rates and compresses working capital cycles.
A marketplace functions more efficiently when the payment rail is already embedded in daily consumer behavior. Tanzania has crossed that threshold.
Market Structure and Urban Density
Urban concentration provides another advantage. Dar es Salaam operates as the commercial core. Secondary cities such as Arusha and Mwanza add incremental density without requiring full national logistics buildout at launch.
The economics of drop density improve in such environments. A delivery network resembles a circulatory system. When nodes cluster tightly, each incremental package lowers the average cost of circulation. Sparse geography produces friction. Concentrated demand produces leverage.
Tanzania’s corridor alignment strengthens this effect.
The Uganda-Kenya Corridor Strategy
Jumia already operates in Kenya and maintains Uganda as a satellite market benefiting from shared infrastructure. Tanzania geographically anchors the East African corridor.
A reentry strategy could leverage existing cross-border logistics flows rather than constructing a fully isolated supply chain. Warehousing, inventory routing, and procurement relationships built in Kenya and Uganda reduce incremental capital requirements.
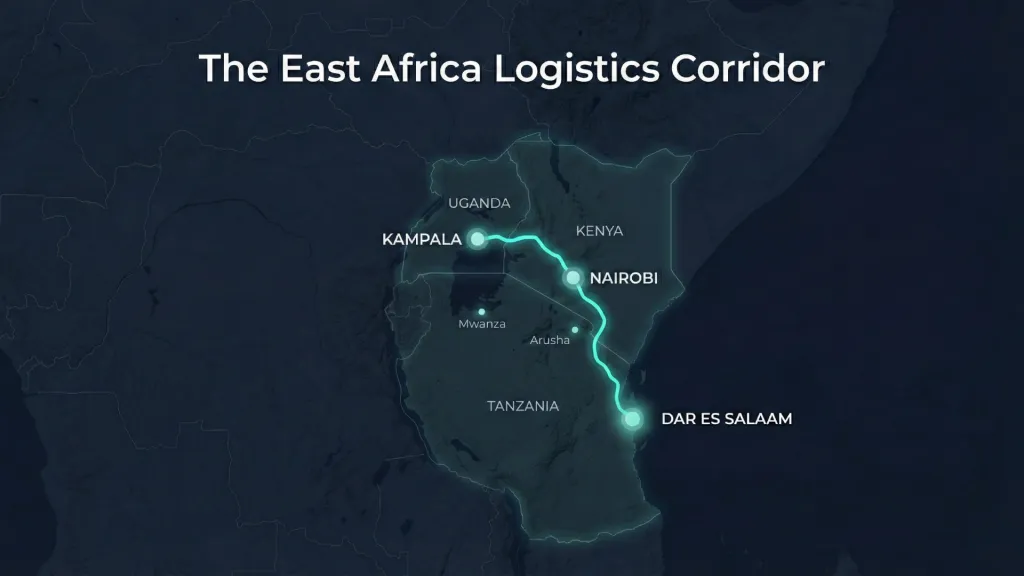
This corridor approach limits upfront fixed investment and accelerates the path toward the 24 to 36 month contribution margin threshold defined by management.
Tanzania Then and Now
The contrast between 2019 and 2026 centers on three variables:
Indicator | 2021 | 2025 |
|---|---|---|
Population | 61M | 69M |
GDP Growth | 4.8% | 6.0% |
Active Mobile Money Accounts | 35.3M | 76.5M |
SIM Penetration | ~82% | 131% |
Mobile money accounts more than doubled. SIM penetration expanded materially. GDP growth accelerated.
The payment gate and density gate both appear closer to clearance than during Jumia’s first attempt.
Capital and Timing
Despite favorable structural shifts, Tanzania remains conditional on capital sufficiency. Entry before sustained free cash flow generation would reintroduce balance sheet strain.
If Jumia achieves breakeven in Q4 2026 and positive free cash flow in 2027, 2028 becomes the earliest realistic reentry window. By that stage, accumulated reserves could finance warehouse setup, marketing launch, and seller onboarding without equity dilution.
Among the three major candidates, Tanzania offers the cleanest alignment with the five gates. Digital payment penetration is high. GDP growth is steady. Corridor integration reduces capital intensity. The regulatory environment is comparatively stable.
Tanzania appears executable rather than speculative.
The next market, Angola, presents a different calculus.
5. Angola: The Long-Duration Option
Angola occupies a different quadrant of the expansion map.
Where Tanzania offers payment maturity and corridor integration, Angola presents higher per capita income alongside macro volatility. It is structurally attractive, though conditionally executable.
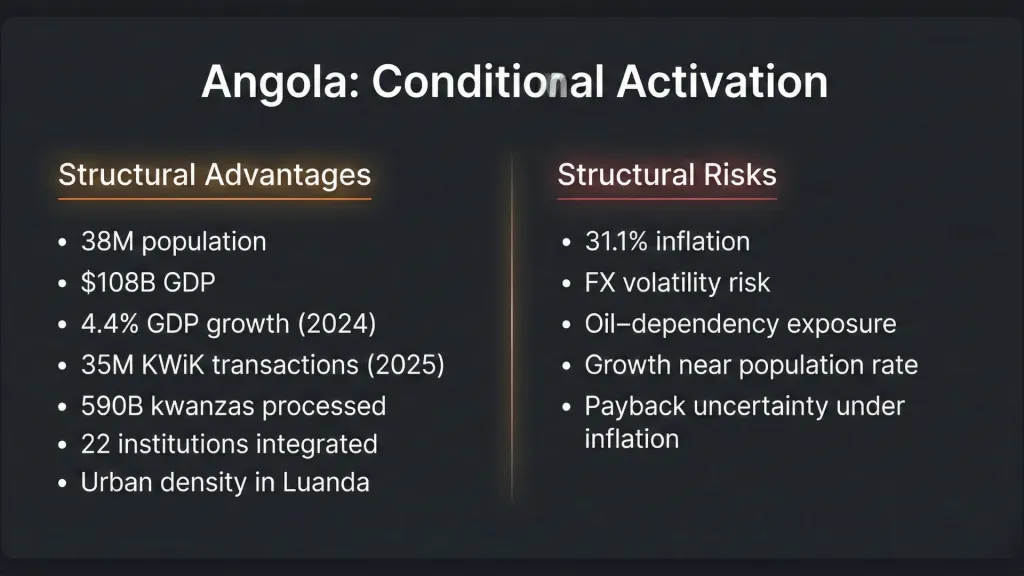
The country has a population of approximately 38M and a GDP of $108B. Real GDP expanded 4.4% in 2024, marking the strongest performance in five years following oil sector reforms and fiscal stabilization efforts. Growth projections for 2025 and 2026 remain positive, though demographic expansion near 3% annually dilutes per capita gains.
Angola therefore offers consumption potential, layered with inflation risk.
Payment Infrastructure Acceleration
The most material development in Angola over the past two years has been digital financial infrastructure buildout.
The KWiK instant payment system, developed by EMIS in partnership with the National Bank of Angola, processed:
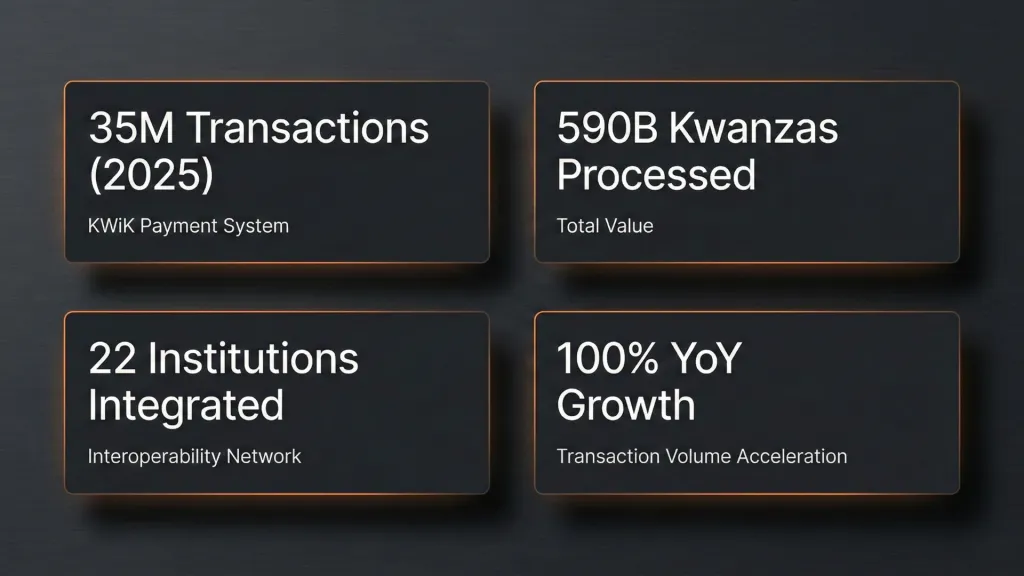
Interoperability now includes 22 financial institutions across banking and non-banking entities.
Additionally, Unitel Money launched as a digital money platform targeting the unbanked population, providing deposit, withdrawal, and transfer capabilities without requiring a traditional bank account. Angola’s population is approximately 31M adults, many of whom remain underbanked.
From a payment gate perspective, Angola has moved from constraint to acceleration.
Inflation and Consumption Risk
The primary macro friction remains inflation. Late 2025 estimates place inflation near 31.1%. Elevated inflation pressures purchasing power and complicates inventory pricing models.
A marketplace relies on predictable price elasticity. In high inflation environments, consumer behavior becomes episodic. Basket sizes fluctuate. Promotional effectiveness weakens. Sourcing cost modeling grows less stable.
Foreign exchange volatility adds another layer of risk. Angola’s historical reliance on oil revenue introduces exposure to commodity cycles. A downturn in energy prices could rapidly pressure currency stability.
These factors directly intersect with Jumia’s FX stability gate and payback horizon threshold.
Urban Structure and Density Potential
Luanda operates as Angola’s commercial nucleus. Urban concentration favors initial drop density in primary corridors. Secondary cities offer incremental scale, though infrastructure disparities remain visible.
Angola’s urban logistics environment is more developed than in many lower-income markets. Road quality and commercial warehousing are comparatively stronger, reflecting historical oil wealth concentration in the capital.
The structural challenge lies less in physical infrastructure and more in macro volatility and consumer income dispersion.
Trigger Conditions
Management currently frames Angola as a long-duration option rather than a near-term priority.
Activation likely requires:
- Sustained inflation moderation
- Currency regime stabilization
- Demonstrated persistence in digital payment growth
- Internal capital buffer expansion beyond baseline operating needs
If Tanzania appears executable by 2028 under current projections, Angola requires macro continuity through 2027 before capital deployment becomes rational.
The opportunity exists. The execution window depends on macro stabilization rather than structural absence of infrastructure.
Among the three candidate markets, Angola carries moderate upside with higher macro sensitivity.
Ethiopia, by contrast, presents scale of a different magnitude.
6. Ethiopia: The Frontier Market
Ethiopia introduces a different category of opportunity.
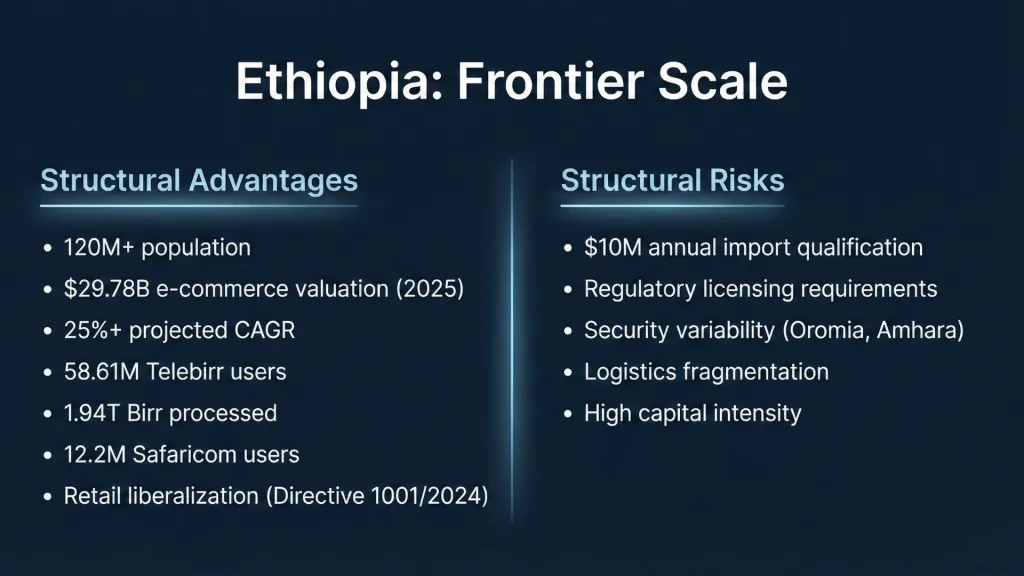
With a population exceeding 120M, it is one of the largest untapped consumer markets on the continent. The scale alone shifts the conversation from incremental expansion to structural repositioning. Entry into Ethiopia would not resemble a satellite launch. It would resemble a new operating pillar.
Until recently, this market remained closed to foreign retail and wholesale participation. That changed between 2024 and 2025.
Regulatory Liberalization
The Ethiopian Investment Board’s Directive No. 1001/2024 opened retail and wholesale trade to foreign investors under defined capital requirements.
Key thresholds include:
- $200,000 minimum capital for wholly owned projects
- $150,000 minimum capital for joint ventures
- $10M annual import value qualification for non-manufacturing importers
- Supermarket retail requires five 2,000 square meter units within three years
- Hypermarket retail requires two 5,000 square meter units within three years
- E-commerce licensing requires permits under the Electronic Transaction Proclamation
The $10M annual import qualification stands as the most material hurdle for a digital marketplace model.
For Jumia, the Yiwu sourcing office offers a structural pathway to meet import thresholds. With 24,000 China-based sellers and 2.2M China-sourced items already integrated into African warehouses, the company possesses an existing import infrastructure that could be extended into Ethiopia.
Regulatory clearance exists. Operational complexity remains.
Digital Payment Acceleration
The Digital Ethiopia 2025 strategy reshaped the fintech environment.
Telebirr, operated by Ethio Telecom, reached:
- 58.61M registered users by the end of 2025
- 1.94T Birr in transaction value during the first half of fiscal year 2025/26
Safaricom Ethiopia introduced competitive pressure:
- 12.2M active customers by December 2025
- 4G network coverage reaching 57.1% of the population through 3,483 sites
In October 2025, M-Pesa integrated with EthSwitch, connecting the system to more than 30 banks and digital wallets.
Digital rails are forming at scale. The payment gate appears closer to clearance than in previous years.
Market Scale and Growth Trajectory
Ethiopia’s e-commerce market reached an estimated valuation of $29.78B in 2025. Forecasts project a compound annual growth rate exceeding 25% through 2034.
This projection reflects:
- Urbanization
- Digital payment penetration
- Expanding 4G coverage
- Rising youth demographic participation
Scale introduces leverage. It also amplifies execution risk.
Logistics and Security Constraints
Ethiopia’s geography complicates last-mile distribution. Regional corridors such as Oromia and Amhara present security concerns. Rural dispersion increases delivery complexity.
Urban nodes like Addis Ababa offer density potential. Rural penetration requires partnerships with established logistics providers or integration with the Ethiopian Postal Service.
A phased approach appears more plausible than an immediate full marketplace rollout.
Phased Entry Strategy
Ethiopia aligns with the 3PL-first concept.
Rather than launching a consumer-facing marketplace immediately, Jumia could deploy logistics services to local merchants and social commerce sellers. This would build drop density, test route economics, and generate transaction data without committing full marketing capital.
The warehouse and routing network would function as a scaffolding before the platform itself expands.
Given Ethiopia’s scale, capital requirements would exceed those of Tanzania or Angola. A phased model reduces upfront burn while preserving optionality.
Risk and Reward Profile
Ethiopia presents the highest upside among the three markets discussed.
It also carries:
- Regulatory complexity
- Import qualification thresholds
- Security variability
- Infrastructure gaps outside major urban centers
If Tanzania represents executable reentry and Angola represents macro-conditional activation, Ethiopia represents frontier scale with structured barriers.
The five gates framework suggests Ethiopia becomes viable only after sustained profitability and capital reserve accumulation. Entry before internal liquidity stabilizes would compress strategic flexibility.
The next structural lever is expansion without marketplace deployment through logistics monetization.
7. Expansion Without Marketplace Entry: The 3PL Strategy
The next phase of Jumia’s geographic strategy may not begin with a homepage.
It may begin with a warehouse.
One of the most consequential shifts under the current leadership has been the monetization of Jumia’s logistics network as a standalone service. Branded as Jumia Delivery, this third-party logistics platform launched in Côte d’Ivoire and expanded into Nigeria in May 2025.
The concept reframes the company’s asset base.
Instead of treating warehouses, pickup stations, and last-mile fleets solely as internal infrastructure, Jumia now positions them as revenue-generating utilities available to external merchants. Social commerce sellers, informal Instagram vendors, and independent retailers can plug into Jumia’s routing network without being marketplace sellers.
This turns logistics into a probe.
Building Density Before Brand
Marketplace entry requires marketing spend, customer acquisition cost, seller onboarding incentives, and inventory positioning. The burn curve is steep in the early quarters.
A 3PL-first model changes that dynamic.
By offering delivery and warehousing services first, Jumia can:
- Build route density in primary cities
- Test drop economics in real time
- Map delivery failure rates
- Assess payment rail friction
- Establish merchant relationships
Density accumulates before consumer-facing launch.
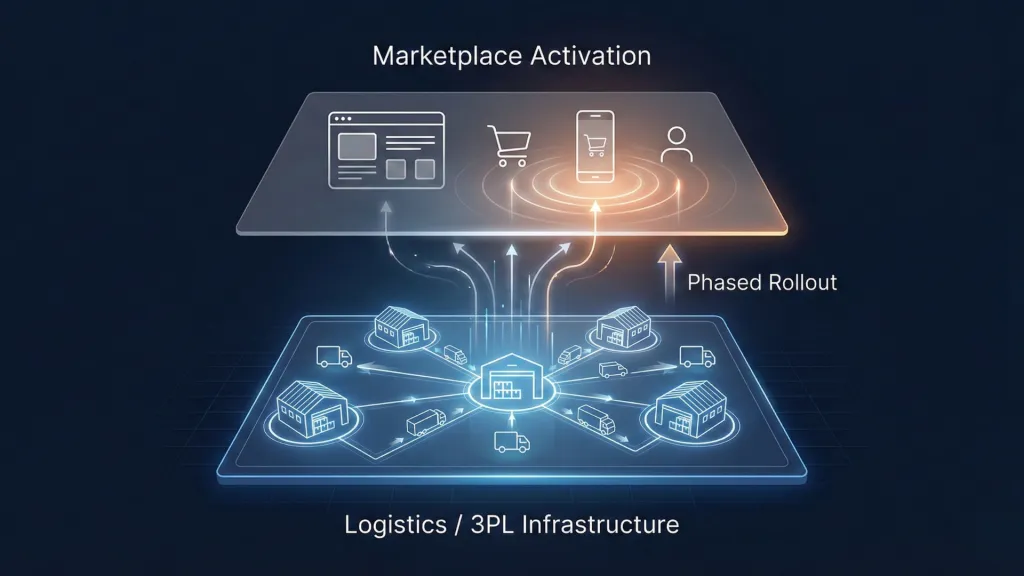
The network strengthens quietly beneath the surface, similar to laying fiber before switching on broadband service. By the time the platform goes live, the logistics backbone already carries throughput.
Quantifying the Efficiency Gains
Operational improvements between 2022 and 2025 illustrate how density compounds efficiency.
Logistic Metric | 2022 | 2025 | 2030 Target |
|---|---|---|---|
Fulfillment Expense per Order | $3.50 | $1.97 – $2.10 | $1.30 – $1.50 |
Marketing Expense per Order | $2.90 | $0.90 | N/A |
Pickup Stations | <1,000 | ~1,500 – 2,380 | N/A |
Warehouse Space | N/A | >110,000 m² | N/A |
Fulfillment cost per order declined by roughly 40% from 2022 levels. Marketing expense per order compressed significantly as brand recognition and seller density improved.
This efficiency trajectory informs the expansion strategy. A new geography that begins with 3PL services benefits from the institutional learning embedded in these metrics.
Ethiopia and Angola as 3PL Candidates
Ethiopia appears particularly suited for phased logistics entry. With 58.61M Telebirr users and accelerating digital rails, merchant demand for reliable delivery infrastructure is likely to increase before formal marketplace penetration reaches maturity.
Angola’s urban concentration in Luanda similarly lends itself to route testing before national expansion.
Under this model, capital deployment becomes incremental rather than front-loaded. Warehousing capacity scales with merchant uptake. Consumer marketing activates once density reaches threshold levels.
The five gates framework intersects here. 3PL-first entry partially clears the density and payback gates before full marketplace exposure.
Strategic Implications
This approach alters the risk profile of expansion.
Traditional entry resembles constructing a stadium and hoping attendance follows. The 3PL-first model resembles hosting events in a smaller venue, measuring turnout, and expanding capacity only when demand proves durable.
The capital curve flattens. Data precedes brand activation. Loss duration compresses.
For a company targeting sustained positive free cash flow in 2027, this sequencing aligns expansion with balance sheet protection.
The marketplace brand becomes the final layer, not the first.
The remaining variable influencing expansion timing is competitive pressure from cross-border platforms.
8. Competitive Pressure: The Temu and Shein Variable
Any discussion of Jumia’s expansion horizon must account for the shifting competitive field.
Chinese ultra-fast-commerce platforms have accelerated their African presence. In South Africa, Temu and Shein captured a combined 37% of the online clothing and textile segment by late 2025. Temu entered Nigeria in 2024 with aggressive advertising and cross-border pricing strategies. By 2025, its cross-border presence was competing directly with established players in major urban corridors.
This dynamic matters for expansion timing.
Cross-border models operate with structural advantages in sourcing scale and pricing aggression. They ship directly from overseas distribution centers, bypassing local warehousing in early phases. Marketing spend substitutes for logistics investment.
Yet these platforms rely heavily on upfront digital payment and extended delivery windows.
Jumia’s Structural Counterweight
Jumia’s positioning differs in several ways.
Payment flexibility remains a differentiator. Cash-on-delivery persists as a preferred option for a large share of consumers in multiple African markets. While digital penetration is rising, trust in upfront payment remains uneven across income segments.
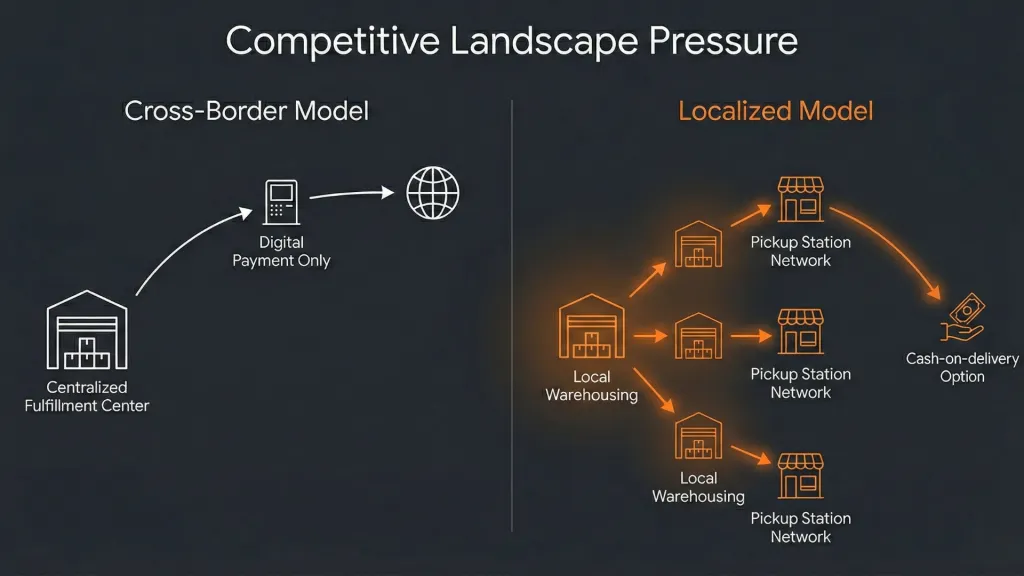
Last-mile reach offers another structural edge. The company operates more than 1,500 pickup stations across its footprint. In areas where formal addressing systems are inconsistent, pickup networks function as fixed distribution nodes. They reduce delivery failure and compress cost variability.
Sourcing diversification also narrows the pricing gap.
By September 2025:
- 24,000 China-based sellers were active on Jumia’s platform
- 2.2M China-sourced items were stocked in African warehouses
This sourcing pipeline allows competitive pricing while preserving local logistics control.
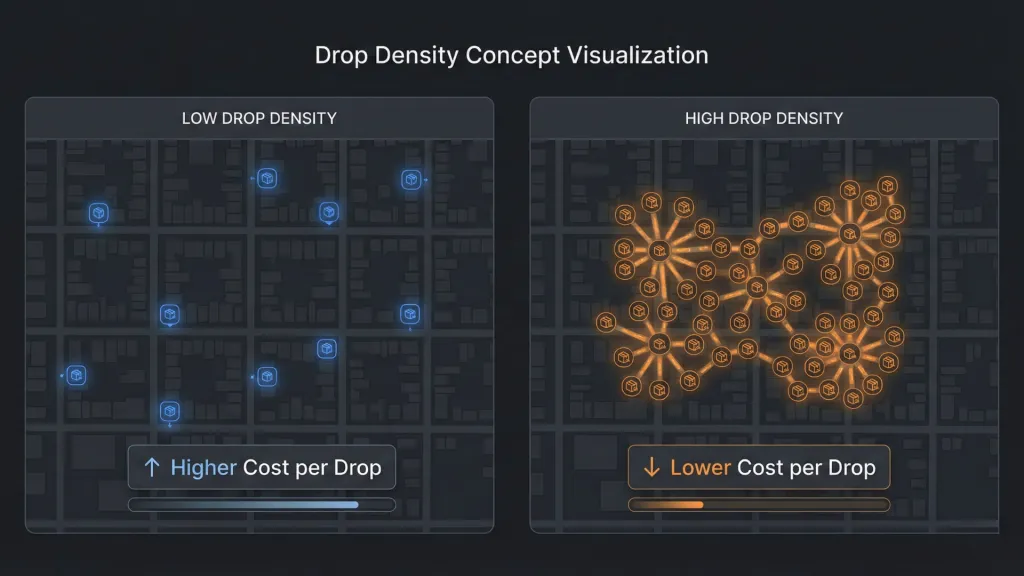
Customer retention metrics support the moat thesis. Jumia’s 90-day repurchase rate reached 46% in Q4 2025, up from 42% the prior year. Repeat purchasing signals trust accumulation and category expansion rather than one-time promotional transactions.
Expansion Timing Under Competitive Pressure
Competitive intensity influences entry sequencing in two ways.
First, cross-border platforms may stimulate category awareness in new markets. Consumers exposed to online fashion and electronics through Temu or Shein campaigns become familiar with digital purchasing behavior. This can lower customer acquisition cost for later marketplace entrants with localized fulfillment advantages.
Second, rapid cross-border penetration compresses the window for local players to establish brand recognition and logistics density.
In Tanzania, Angola, or Ethiopia, expansion timing intersects with this pressure. A delayed entry risks ceding early digital mindshare. An accelerated entry without sufficient capital risks repeating earlier expansion errors.
The decision therefore balances density readiness, capital sufficiency, and competitive encroachment.
Jumia’s local infrastructure and payment flexibility create a moat. The durability of that moat depends on execution speed once the capital gates clear.
Beyond these three headline markets, optionality exists within the existing footprint.
We turn next to satellite markets and portfolio calibration.
9. Satellite Markets and Portfolio Optionality
The expansion conversation often centers on Tanzania, Angola, and Ethiopia. The portfolio itself contains embedded optionality that requires less capital and carries lower execution risk.
Uganda illustrates this structure.
The country operates as a satellite market within the East African corridor. Shared infrastructure with Kenya reduces incremental fixed costs. Logistics routing, procurement relationships, and regional warehousing overlap. Uganda benefits from Kenya’s density while contributing incremental volume.
This corridor-based expansion model reduces the capital intensity typically associated with full country entry.
Cameroon and Rwanda Reentry Considerations
Jumia exited Cameroon and Rwanda in 2019 alongside Tanzania. The rationale at the time centered on insufficient scale and prolonged path to profitability.
Rwanda has since experienced fintech innovation and drone delivery experimentation. Its population, however, remains approximately 14M. Even with strong digital infrastructure, the absolute market size constrains volume density required for a high-throughput marketplace model.
Cameroon presents greater population scale, though macro volatility and infrastructure variability introduce complexity.
Reentry into these markets appears structurally lower priority relative to Tanzania or Ethiopia. The return profile likely fails to justify capital allocation before larger, more scalable markets are addressed.
Core Markets as Expansion Engine
The recalibrated portfolio consists of eight primary markets:
- Nigeria
- Egypt
- Kenya
- Morocco
- Ivory Coast
- Senegal
- Ghana
- Uganda
Each market plays a distinct role.
Nigeria contributes volume and brand gravity. Ivory Coast generates logistics efficiency. Egypt anchors North African presence. Kenya stabilizes the East African corridor.
These markets collectively produce the operating leverage required to finance future geographic expansion.
Markets that generate efficiency subsidize markets that generate learning. Markets that generate scale subsidize frontier experiments.
This internal cross-subsidization forms the financial base of the 2028 to 2030 expansion window.
Portfolio Discipline Going Forward
The earlier iteration of Jumia prioritized geographic footprint breadth. The current iteration prioritizes return on invested capital within a concentrated footprint.
Satellite expansion will likely follow corridor logic rather than standalone country logic. Geographic adjacency reduces warehousing duplication and compresses route buildout time.
Tanzania aligns with Kenya and Uganda. Angola sits adjacent to West African flows though less directly integrated. Ethiopia would require more substantial capital, though scale justifies the complexity.
Portfolio optionality exists. Capital sequencing determines activation order.
The final question becomes timeline realism.
We move next to the 2026 to 2030 execution window.
10. The Real Timeline: 2026 to 2030
Expansion is a function of cash generation rather than narrative momentum.
The roadmap presented at the 2025 Investor Day anchors the timeline:
- Q4 2026: Adjusted EBITDA breakeven target
- 2027: First full year of profitability and positive free cash flow
- 2030: $2.5B to $3.0B GMV ambition
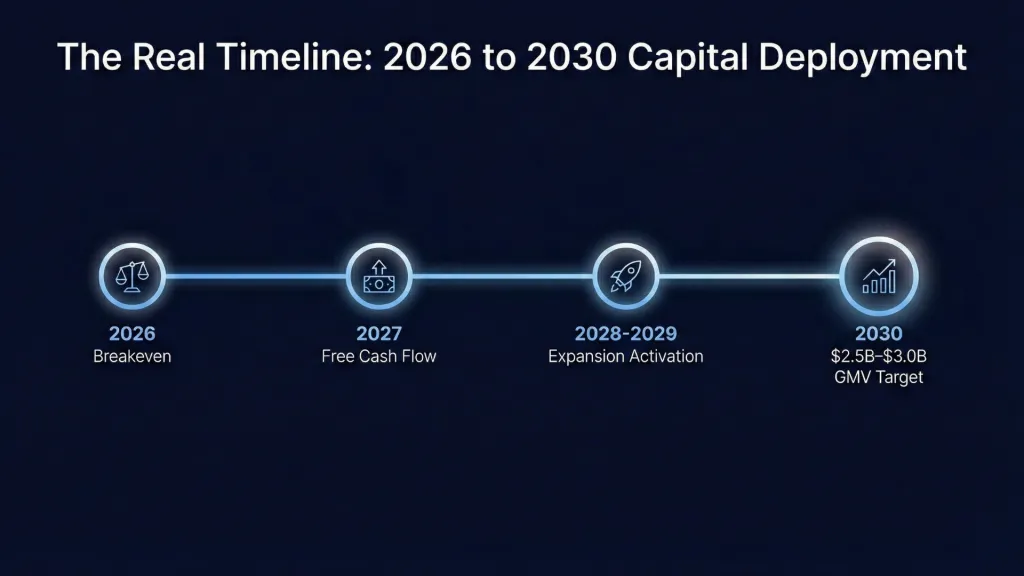
These milestones create a sequencing constraint. Geographic expansion before sustained free cash flow would compress the balance sheet at precisely the moment margin durability is being proven.
2026: The Operating Leverage Test
The year 2026 functions as a proving ground.
Fulfillment expense per order has already declined from $3.50 in 2022 to roughly $2.00 in 2025. Marketing expense per order fell from $2.90 to $0.90 over the same period. Pickup stations expanded from under 1,000 to roughly 1,500 to 2,380 depending on classification.
These metrics must hold while GMV scales beyond the $818.6M recorded in FY 2025.
Breakeven in Q4 2026 signals that drop density, take rate expansion, and advertising monetization are compounding rather than offsetting each other.
2027: Capital Regeneration
Full-year profitability in 2027 marks the inflection from stabilization to regeneration.
Positive free cash flow rebuilds liquidity beyond the $77.8M reported at the end of FY 2025. Advertising revenue rising from 1% of GMV toward 2% contributes incremental high-margin cash. A 2.0 to 2.5 percentage point take rate expansion compounds marketplace economics.
By the end of 2027, the company would ideally possess:
- Stable operating cash generation
- Sufficient liquidity buffer
- Visibility into margin durability
Only then does expansion shift from conceptual to executable.
2028 to 2030: The Deployment Window
The years 2028 through 2030 form the realistic expansion band.
Under a 25% compound annual growth trajectory, GMV must nearly triple from 2025 levels to reach the lower bound of the 2030 target. Core markets alone may deliver a significant portion of that growth, though selective geographic additions increase probability.
The sequencing likely unfolds as follows:
- Corridor-aligned reentry, most plausibly Tanzania
- Conditional activation of Angola if macro stability persists
- Phased 3PL-first probe in Ethiopia before marketplace launch
Each activation increases fixed cost base temporarily before density absorbs overhead.
The timing also intersects with competitive pressure. Temu and Shein campaigns may accelerate consumer digital adoption in frontier markets during this window, indirectly lowering acquisition friction for localized platforms.
Capital as the Constraint Variable
The constraint remains capital sufficiency rather than opportunity scarcity.
A marketplace resembles a utility grid. Expansion requires laying distribution lines before demand peaks. Deploy too early and capital sits idle. Deploy too late and competitors claim demand nodes.
Jumia’s roadmap attempts to align deployment with internally generated funding rather than external equity reliance.
The 2026 to 2030 window therefore represents a controlled expansion phase rather than a speculative growth sprint.

Jumia Stock Forecast 2030: The Business Beyond Breakeven
Explore Northwise’s Jumia stock forecast for 2030: country growth, unit economics, cash flow, dilution and three valuation scenarios, with a financial model.

Jumia Uganda
Jumia Uganda: a growing revenue contribution from a smaller base, customer retention and the economics of expanding delivery coverage.

Jumia Kenya
Jumia Kenya: current revenue growth, marketplace trust, delivery efficiency and the limits of country-level financial disclosure.
Northwise Portfolios
See how the research becomes real decisions
Reader discussion
Discuss the research
Create a Free account to join the discussion with a display name.
Create a Free Account
No comments yet. Start a thoughtful discussion.