
SPCX Stock Forecast 2030: The Cost of Building 23 Gigawatts
A ground-up SpaceX 2030 model of AI capacity, Starlink, launch economics, capital needs, dilution, and scenario-weighted value per share.
In this article
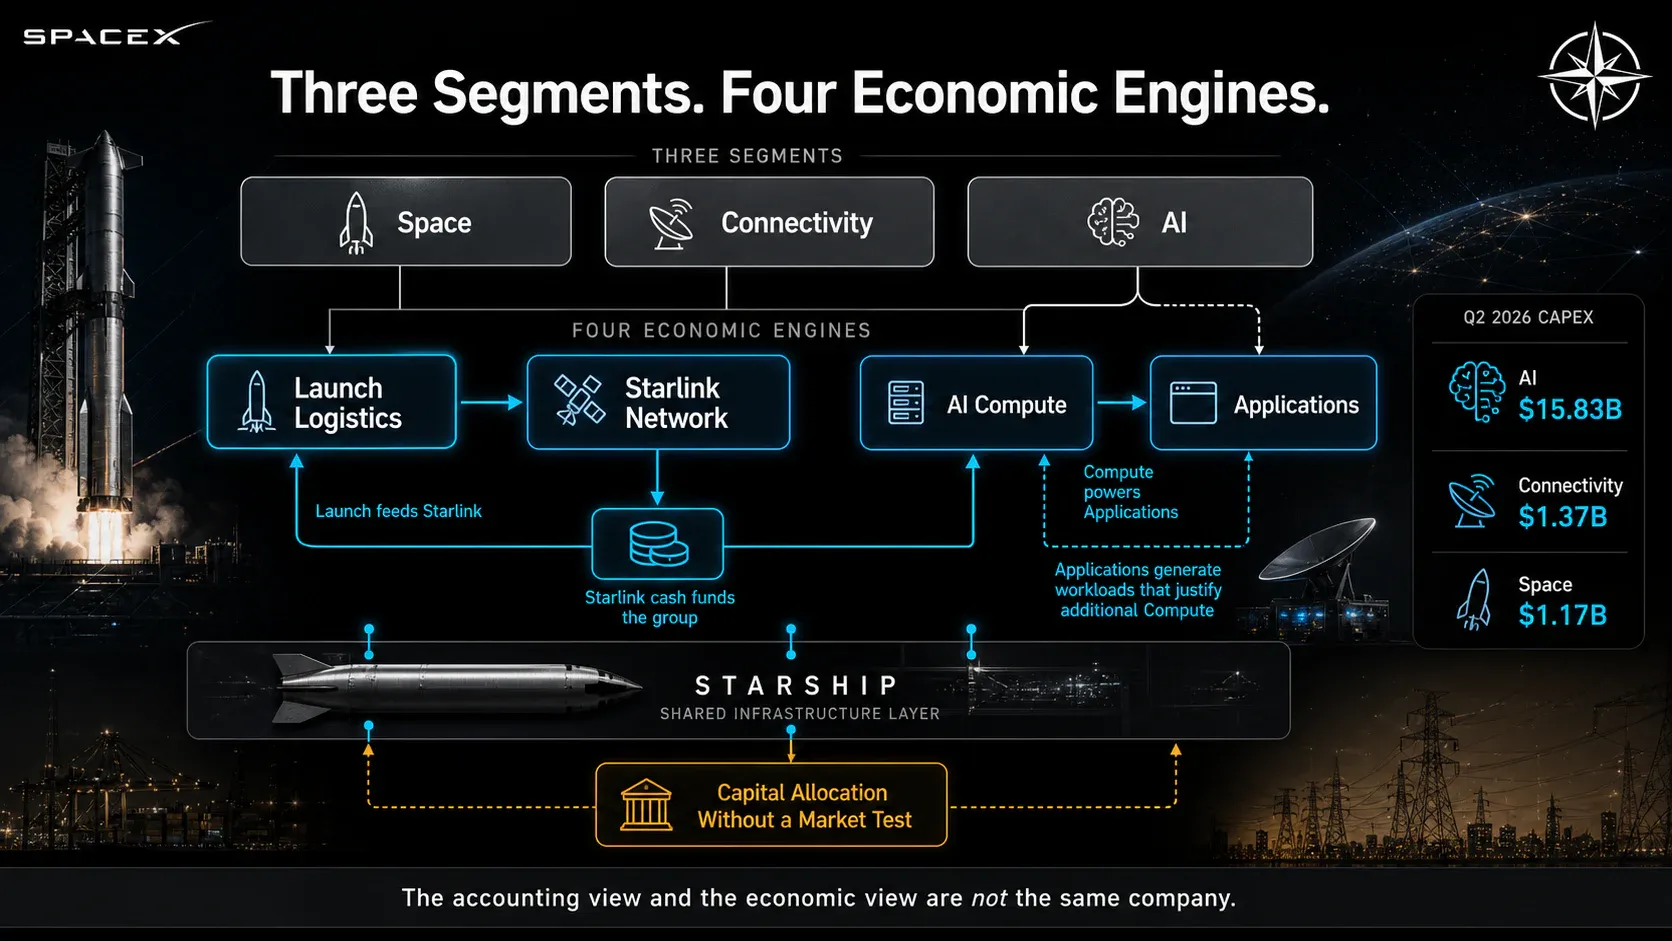
SpaceX reports three segments and runs four businesses. The one that decides the 2030 outcome is the one consuming the capital.
In the second quarter of 2026, SpaceX spent more than twice its revenue on capital equipment. Sales came to $7.81 billion. Capital expenditure came to $18.37 billion, and $15.83 billion of that went into artificial intelligence infrastructure, not into rockets.
One quarter is enough to show why the familiar description of the company has stopped working. Whatever SpaceX is now, it is not primarily a launch business. The reported segments do not settle the question either. Space, Connectivity and AI are three lines in a filing, and underneath them sit four businesses whose economics have almost nothing in common.
The first is a launch platform that mostly serves itself. The second is a satellite network already producing $2.597 billion of quarterly adjusted EBITDA on $4.291 billion of revenue. The third is a compute business consuming capital at a rate no private company has previously attempted. The fourth is a software and applications layer that runs on the third one's hardware and carries none of its capital burden.
Starship sits across all four. A single vehicle can loft a Starlink V3 stack, carry a customer payload, or place orbital compute hardware, and the mission that generates the most economic value is often the one that produces no reported Space revenue at all. Any model that counts internal missions as launch revenue double-counts. Any model that ignores them undercounts the constraint they impose.
Two lenses dominate the current commentary and both are incomplete. The aerospace lens extends a launch franchise, applies a services multiple, and arrives at a number that cannot explain why the company is spending $15.83 billion a quarter on data centre power. The optionality lens treats every announced programme as a call option, sums them, and arrives at a number that cannot be falsified. Neither engages with what actually determines the outcome, which is how much physical infrastructure the company can build, how much of it earns money from someone other than itself, and what the build costs.
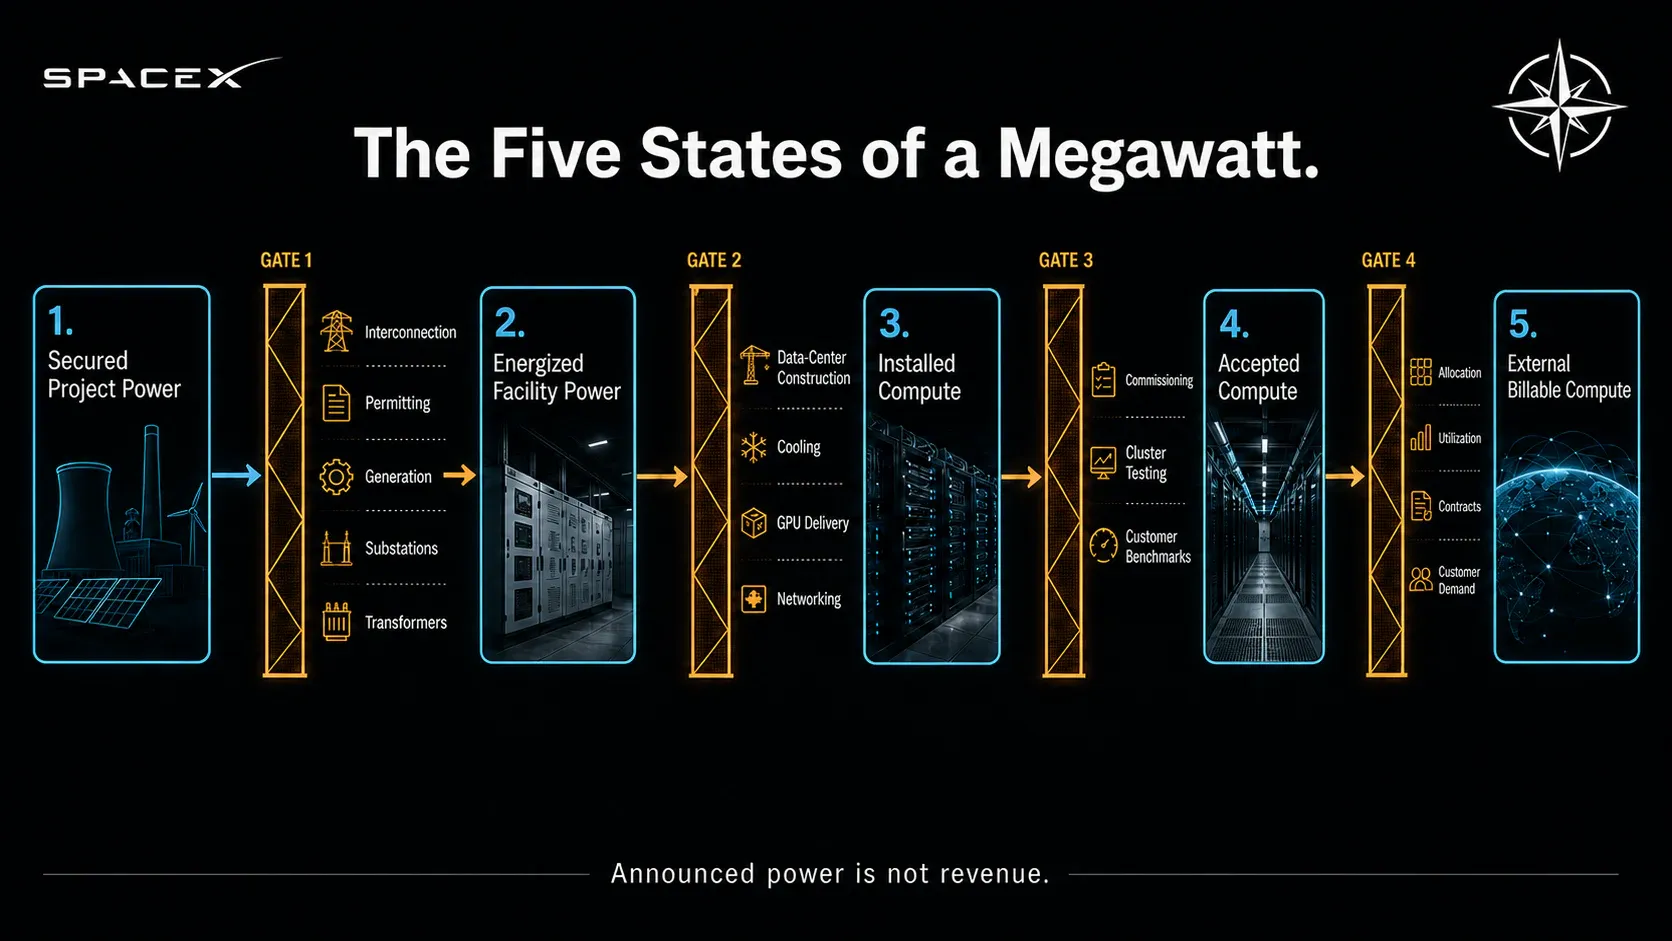
That is the work this report does, and most of it happens in the gaps between four states. Secured power is not installed compute, installed compute is not accepted compute, and accepted compute is not billable compute.
Adjusted EBITDA is not shareholder cash either, since hardware wears out, satellites deorbit, lenders take interest, and equity gets issued to fund the next year of construction.
The consolidated cash picture invites a lazy diagnosis. Free cash flow was deeply negative through 2025 and worse in the first half of 2026, and a reader could stop there. The reason to keep reading is that almost none of that outflow is maintenance.
It is the cost of assembling an asset base that does not yet exist, funded by a business that already generates several billion dollars a year of segment cash. Whether that trade works depends on arithmetic, not on temperament.
How the company was assembled
SpaceX arrived at four engines through roughly two decades of internal reinvestment followed by two years of aggressive corporate action, and the sequence explains the current structure better than any organisational chart.
Falcon and Dragon are the mature layer. They took nearly twenty years to reach a cadence and a cost base that no competitor has matched, and they are now closer to a logistics utility than to a growth business. Their strategic function changed once Starlink existed: internal launch became the cheapest way in the world to put mass in orbit, and Starlink was built on that advantage, never on a customer's price list.
The xAI combination added the third and fourth engines at once. It brought terrestrial AI infrastructure, the Colossus campuses and the power projects behind them, together with Grok and X as applications running on that infrastructure. The June 2026 initial public offering then changed the funding picture completely, raising roughly $85.7 billion net and leaving about $100.0 billion of cash and securities on the balance sheet at the end of the second quarter. The Cursor acquisition closed on August 14, 2026, adding a software distribution layer and issuing approximately 391.0 million Class A shares at closing.
The flywheel argument is real and we carry it.
Launch feeds Starlink. Starlink cash feeds the group. Compute feeds applications, and applications create workloads that justify more compute. Each of those links is real.
The counterweight is equally real and we carry that too. A structure where one engine's cash reliably funds another engine's construction is a structure where capital allocation decisions are made without a market test, and where a controlled shareholder can direct enormous sums between businesses that would otherwise raise money on their own merits. Equity is simultaneously the residual claim and the acquisition currency, so every share issued to buy a company hands someone else a claim on the infrastructure the rest of the group is building. We treat that as a discount, not as a footnote.
What the reported numbers already prove
Before forecasting anything, it helps to be precise about which engines make money today, since the answer is less obvious than either the bull or the bear framing suggests.
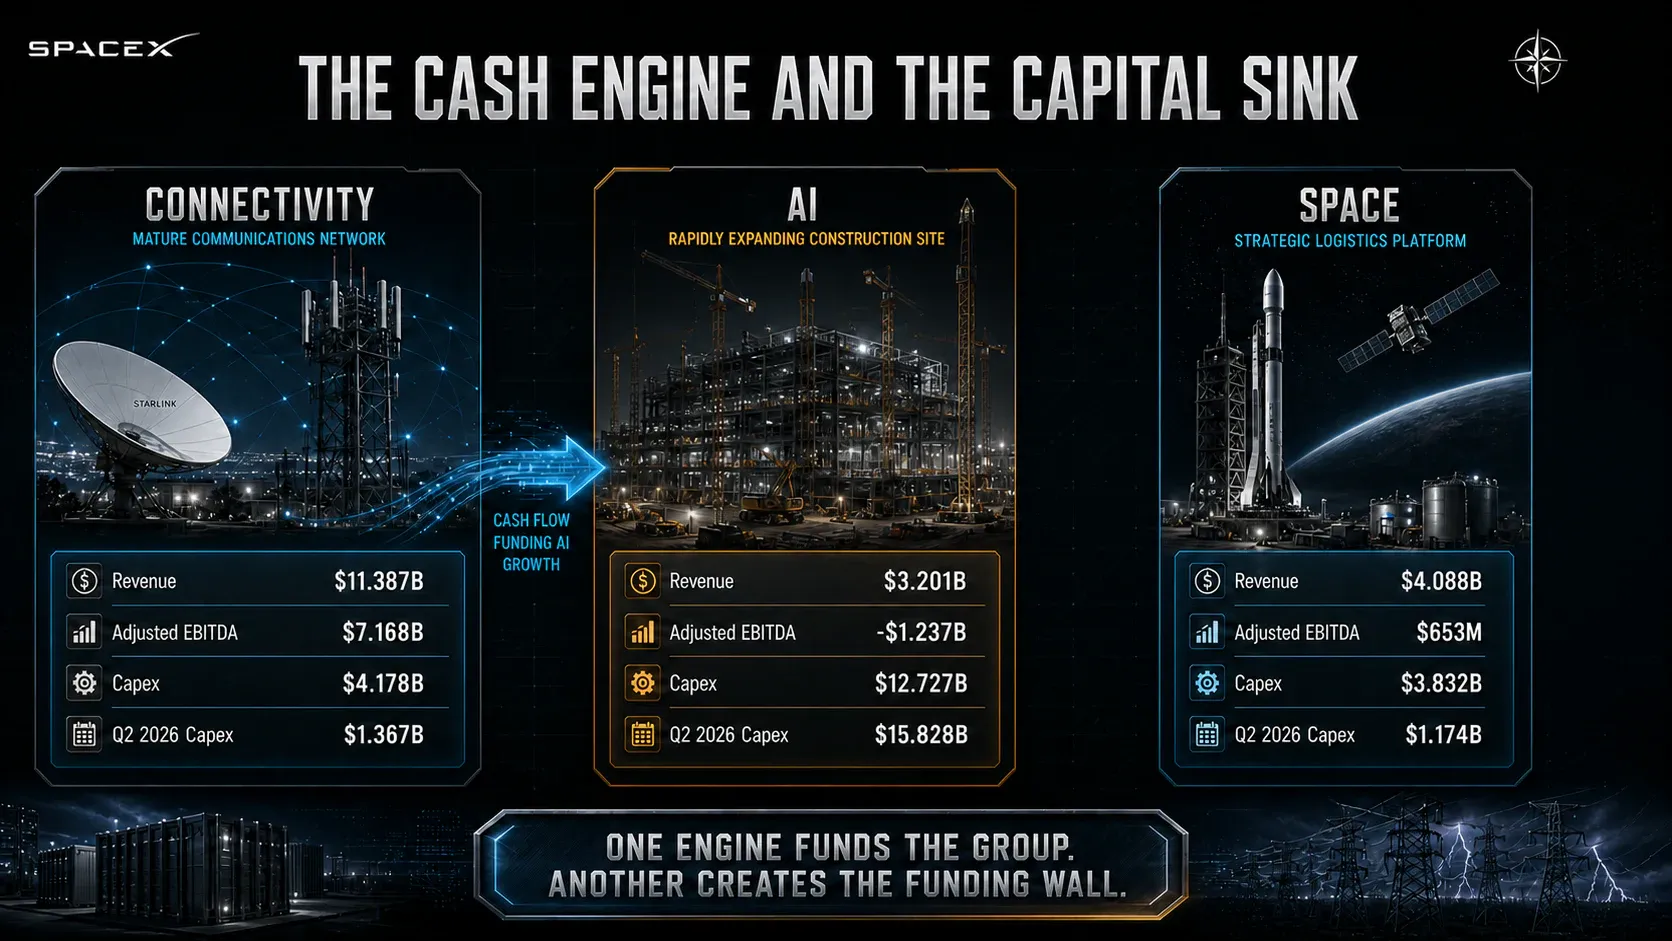
Connectivity is the funding engine and it is already large. Segment revenue reached $11.387 billion in 2025 against $7.168 billion of adjusted EBITDA, a margin near 63%, and the second quarter of 2026 produced $4.291 billion and $2.597 billion on the same measures. This is a mature, cash-generative network business that happens to sit inside a company most people describe as a rocket manufacturer.
AI is the opposite in every respect. Segment revenue was $3.201 billion in 2025 against negative $1.237 billion of adjusted EBITDA, and it crossed into positive territory only in the second quarter of 2026, at $2.561 billion of revenue and $1.146 billion of EBITDA. That crossing happened while the segment absorbed $12.727 billion of capital in 2025 and $15.828 billion in the second quarter of 2026 alone.
Space is the smallest and the most misread. Revenue of $4.088 billion in 2025 produced $653 million of adjusted EBITDA, and the quarterly figures turn negative as internal missions crowd out customer work. A segment that loses money while flying the vehicles that deploy Starlink and, later, orbital compute is not a failing business. It is a cost centre whose output is priced at zero and whose value appears in other segments' revenue lines.
The 2025 and second-quarter figures make the funding asymmetry explicit.
$mm | 2025 revenue | 2025 adj. EBITDA | 2025 capex | Q2 2026 capex |
|---|---|---|---|---|
Connectivity | 11,387 | 7,168 | 4,178 | 1,367 |
AI | 3,201 | (1,237) | 12,727 | 15,828 |
Space | 4,088 | 653 | 3,832 | 1,174 |
One engine funds the group. A different engine creates the entire future funding wall, and the ratio between the two columns is why this report spends most of its length on AI.
The obvious bear reading, that consolidated free cash flow is deeply negative, is incomplete without separating growth capital from replacement capital. The obvious bull reading, that segment EBITDA is already several billion dollars a year, is incomplete for the mirror-image reason. Hardware bought in 2027 has to be replaced, satellites deorbit on a schedule, and interest accrues on the debt raised to fund both. We adjust for all three before any multiple is applied.
Reading the guidance
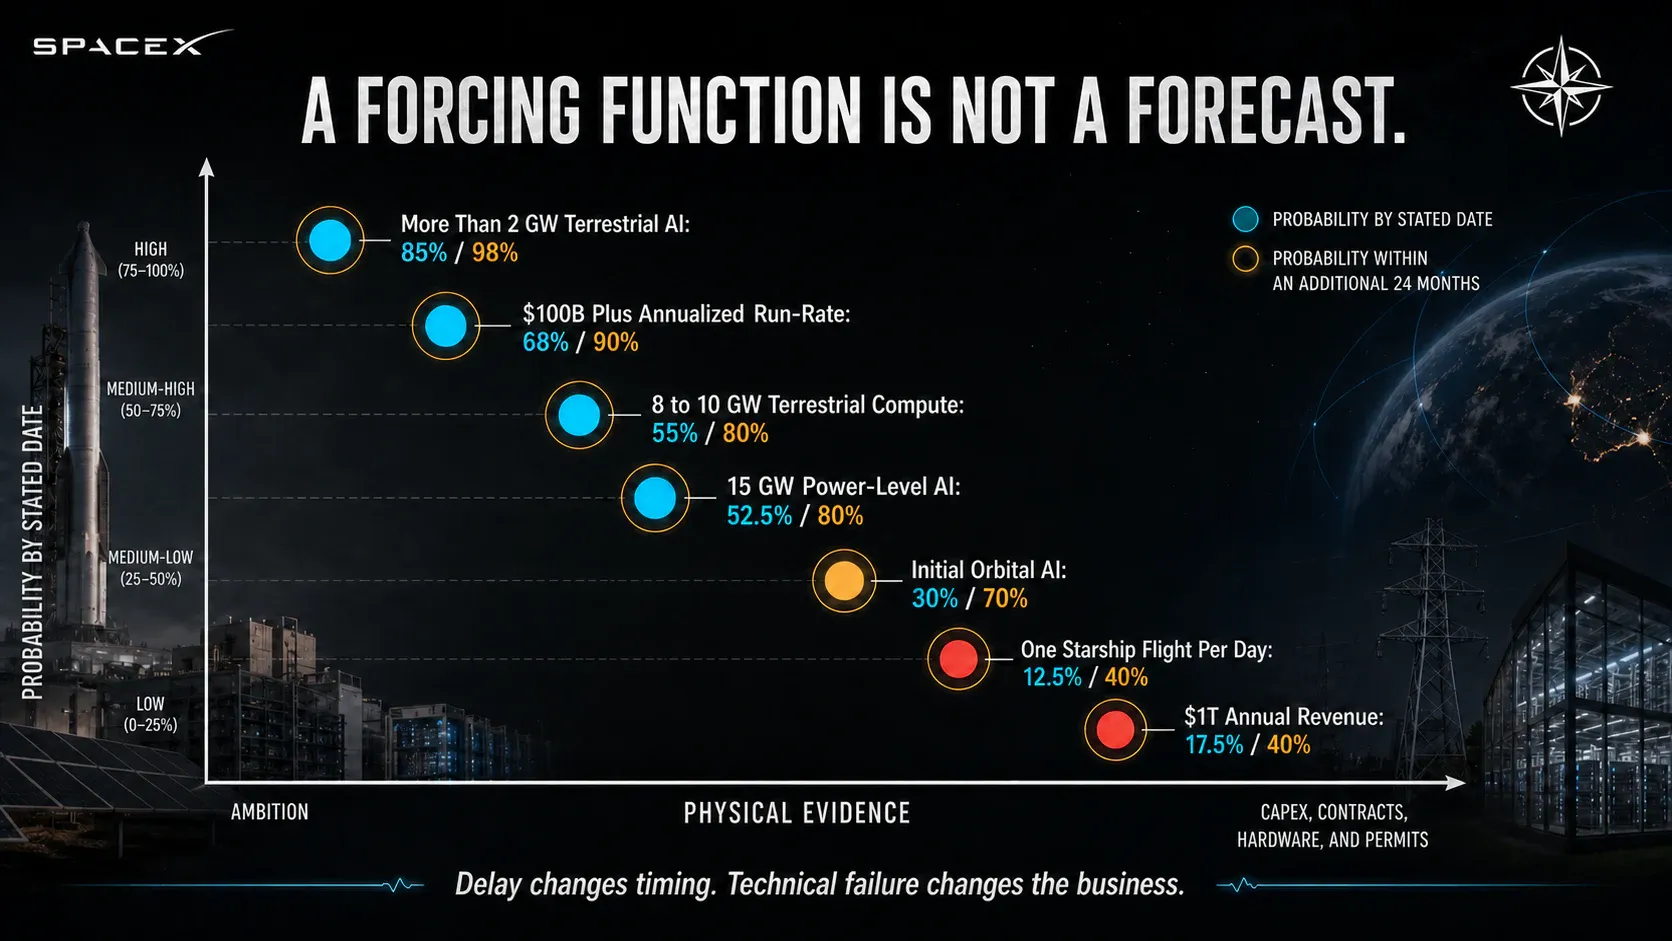
SpaceX generates more public targets than almost any company of its size, and those targets get quoted constantly without any stated method for weighting them. We set ours out before using a single one.
Our working rule is that an aggressive date from this management team is an engineering forcing function first and a forecast second. That distinction has real analytical content, since a timing miss and a technical failure have different consequences. A programme that arrives two years late still produces the asset, still earns revenue, and still services the debt raised against it. A programme that cannot work at all destroys the capital spent on it.
We therefore score every milestone twice, once for the stated date and once for delivery within an additional 24 months.
Confidence rises with physical evidence. Targets backed by disclosed capital expenditure, signed contracts, delivered hardware, filed permits and visible construction earn high probabilities. Targets backed by a slide and an ambition do not, regardless of how often they are repeated.
Applying that to the milestones that matter for this model produces a wide spread.
Milestone | Target | Stated date | Within +24 months |
|---|---|---|---|
More than 2 GW terrestrial AI compute | YE 2026 | 85% | 98% |
$100B+ annualised revenue run-rate | Dec 2026 | 68% | 90% |
8 to 10 GW terrestrial compute | YE 2027 | 55% | 80% |
15 GW power-level AI infrastructure | YE 2027 | 52.5% | 80% |
Initial orbital AI launches | 2027 | 30% | 70% |
At least one Starship flight per day | Aug 2027 | 12.5% | 40% |
$1 trillion annual revenue | 2030 | 17.5% | 40% |
The pattern is consistent. Near-term compute targets sit high, since the capital has already been spent and the campuses are visible. The 2027 power targets sit near a coin flip, since they depend on interconnection queues and transformer supply that SpaceX does not control. The daily Starship flight rate and the trillion-dollar revenue figure sit low, and both are aspirations expressed as dates.
Scenario probabilities do not come from multiplying these together, since the milestones are heavily correlated and the product of correlated probabilities collapses toward zero for no defensible reason. We weight seven independent drivers instead: AI physical scale, AI economics, Starship execution, Starlink demand capture, financing and capital structure, applications monetisation, and governance. That produces weights of 27.4% Bear, 52.8% Base and 19.8% Bull, and every scenario in this report inherits them.
The practical test for a reader is whether a missed date changes the shape of the business or only its timing. A 2027 power target slipping to 2029 compresses returns and raises the financing burden without breaking the thesis. Starship failing to reach a cadence that supports both Starlink replacement and orbital deployment breaks two engines at once, and we treat those two events very differently.
The physical engine behind SpaceX AI
Every gigawatt figure quoted about this company means one of five different things, and the differences are where the money is.
The chain runs in one direction.
Secured or gross project power is what has been contracted, permitted or announced. Energised facility power is what is actually delivering electricity to a building, and installed compute is the all-in nameplate draw of the GPUs sitting in that building. Accepted compute is what has passed customer acceptance and is available to run work. External billable compute is the portion a paying third party is using.
Each step loses something, and a model that jumps from the first number to the last will overstate the business by a wide margin.
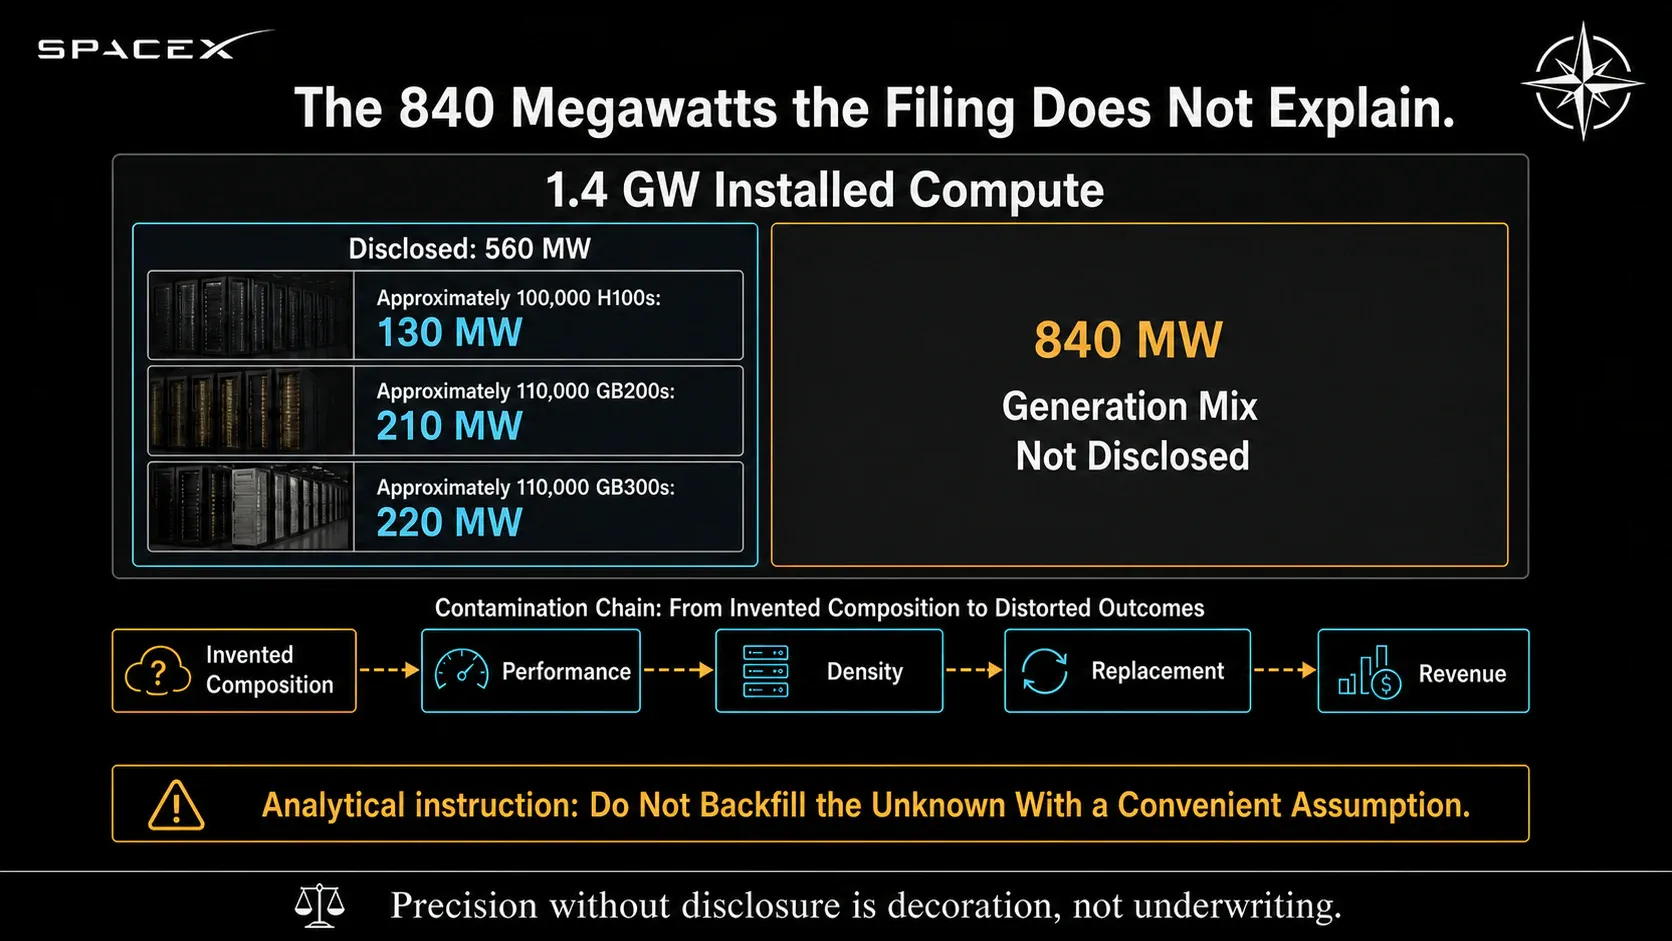
Installed compute is the figure with the cleanest disclosure history. It ran 0.3 GW at the end of 2024, 0.8 GW at the end of 2025, 1.0 GW in the first quarter of 2026 and 1.4 GW in the second. That is a fleet roughly doubling every two to three quarters, which is fast even by the standards of this cycle.
What is known about the composition of that fleet is thinner than the headline suggests. Three cohorts are disclosed: approximately 100,000 H100s drawing around 130 MW, approximately 110,000 GB200s at around 210 MW, and approximately 110,000 GB300s at around 220 MW. A further expansion of at least 220,000 GB300s and more than 400 MW has been referenced. Adding the named cohorts accounts for roughly 560 MW of the 1.4 GW installed at the end of the second quarter, which leaves about 840 MW whose generation mix has never been disclosed.
We do not fill that gap. Assigning a generation mix to 840 MW would let us produce a precise-looking figure for fleet performance and rack density that rests on nothing, and the resulting number would then propagate through every later calculation. The undisclosed portion stays undisclosed, and we use SpaceX's own empirical kilowatts per GPU from the named cohorts in place of vendor thermal design figures, since the observed draw is what the electricity bill responds to.
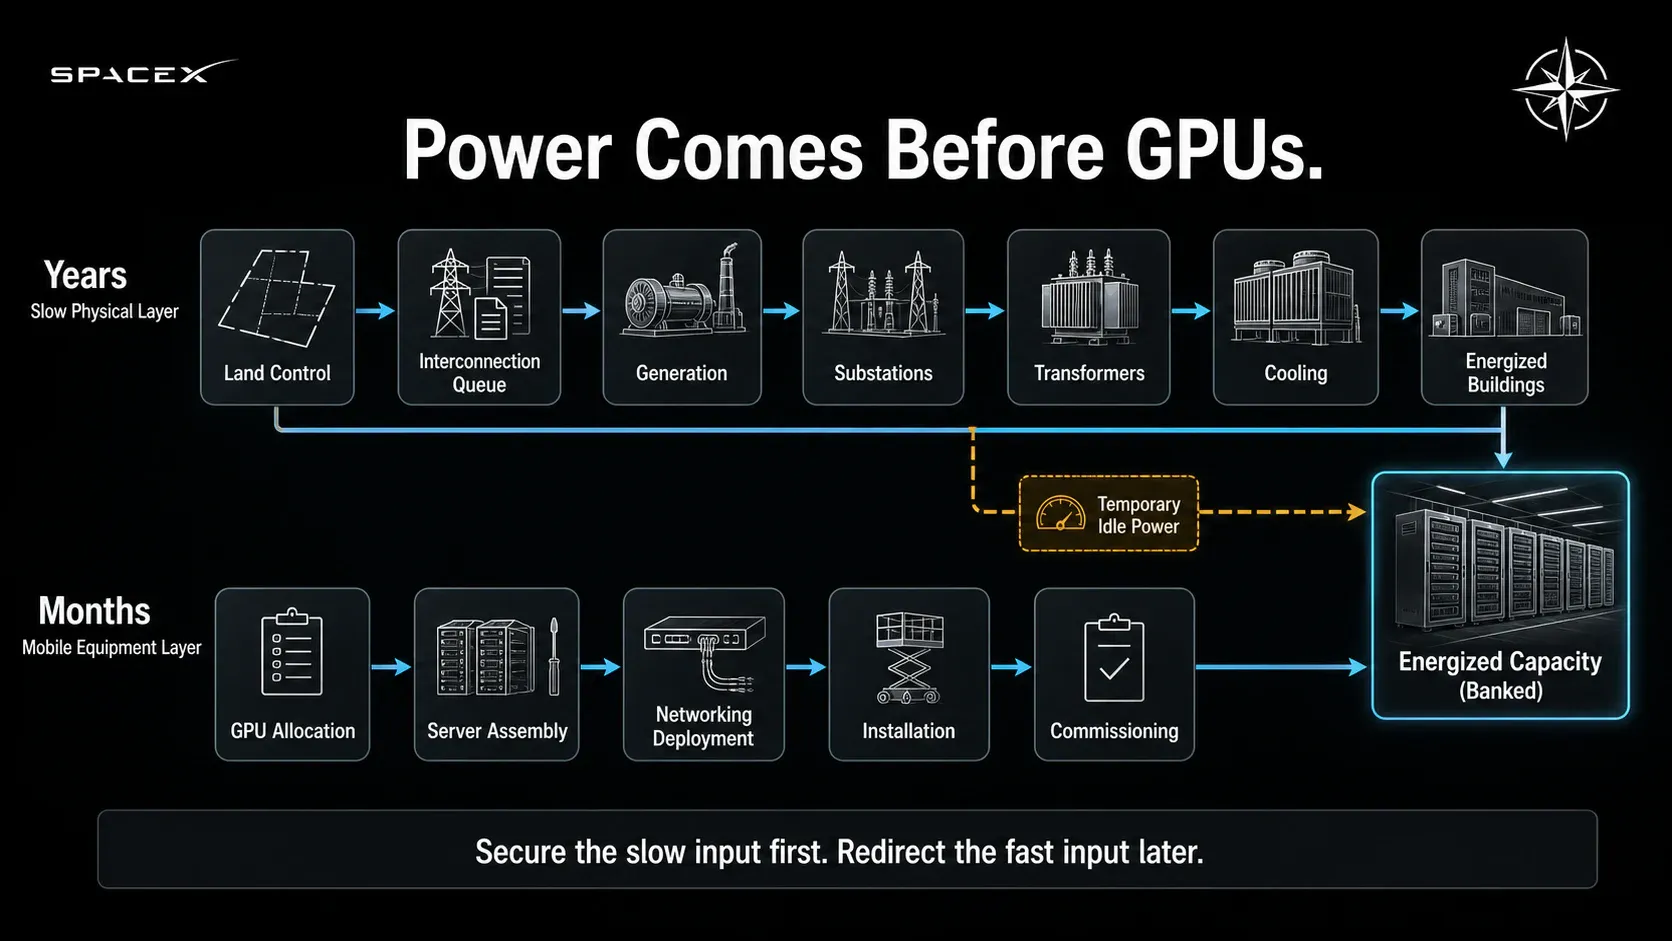
Power runs ahead of GPUs in this build, and that ordering is rational. Grid interconnection, substations, transformers and permanent generation take years to secure and cannot be accelerated with money once a queue position is set. GPUs take months and can be redirected. A company racing for capacity therefore secures the slow input first and accepts that some of it will sit idle, and energised power will keep running ahead of installed compute for that reason.
The permitting disclosures require the same discipline. The Southaven permanent generation permit covers roughly 1.24 GW, and a separate Memphis project envelope of roughly 1.563 GW has been referenced. These may overlap, and no public load mapping resolves whether they describe the same electrons. We do not add them.
Where 23 gigawatts comes from
The 2030 compute figure in this model is not chosen. It falls out of a physical bridge that starts with a project set management has already described.
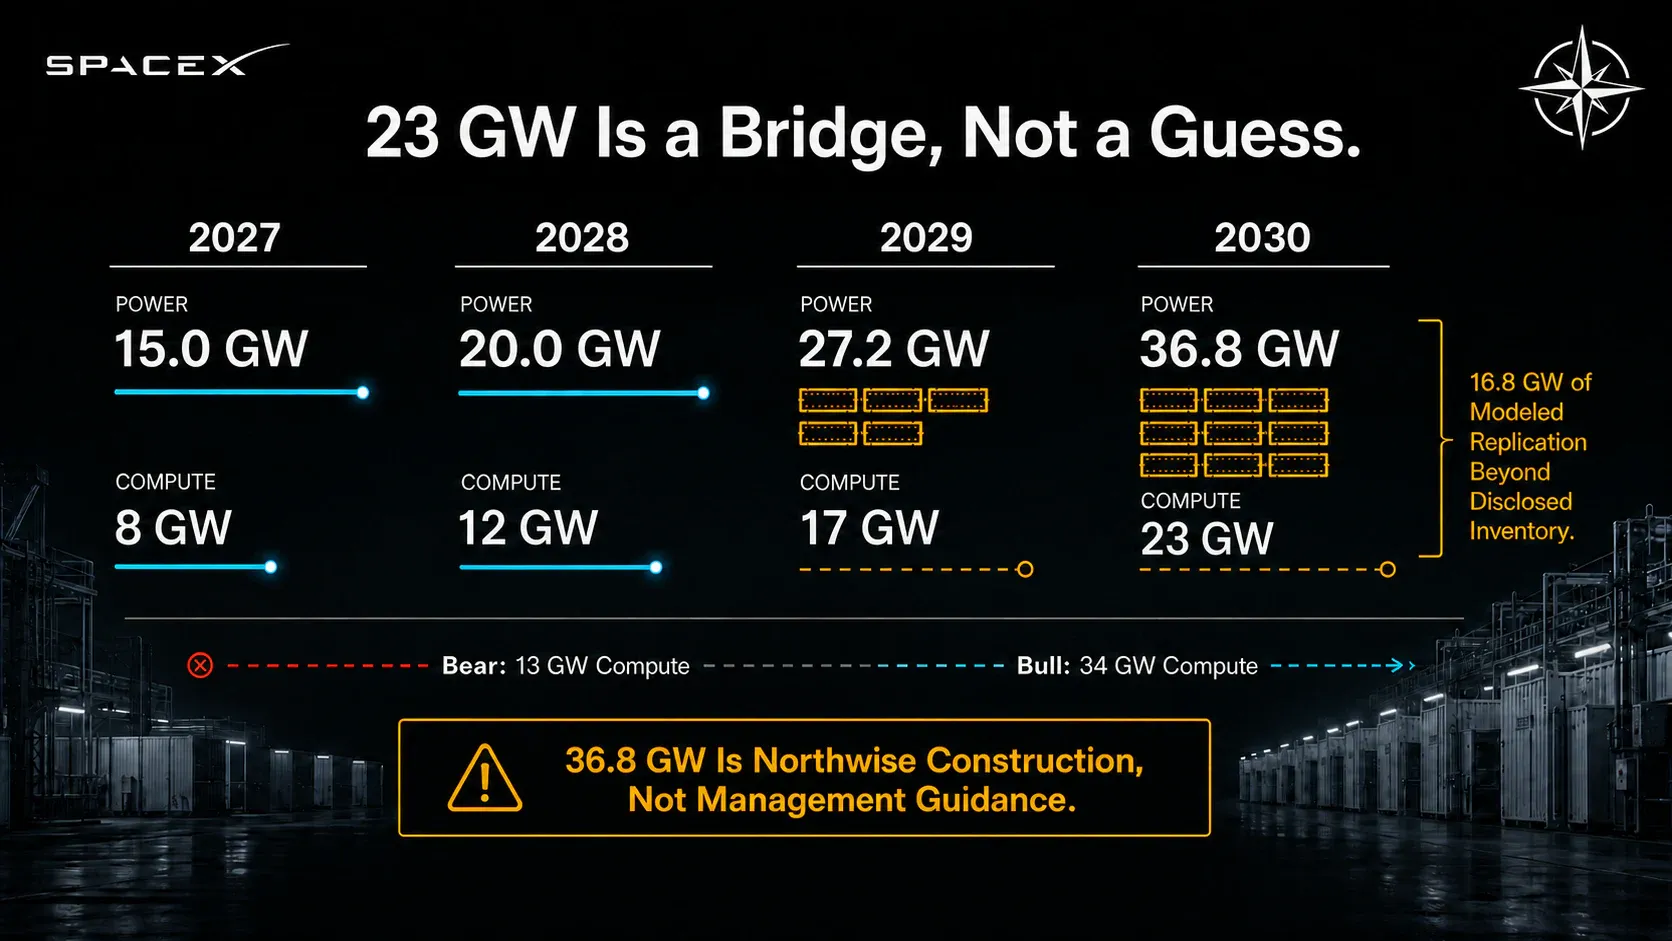
The starting point is the roughly 20 GW power, cooling and electrical project inventory referenced for the end of 2027. Our Base case realises 15.0 GW of that in 2027, which matches the haircut management itself applied to the same project set. The remaining disclosed inventory reaches service through 2028, taking Base power to 20.0 GW.
Only after the original set is exhausted do we add replication cohorts, and those cohorts are anonymous. We do not invent campus names for capacity that has not been sited.
Base power, cooling and electrical capacity therefore runs 15.0 GW in 2027, 20.0 GW in 2028, 27.2 GW in 2029 and 36.8 GW in 2030. Applying the power-to-compute conversion, which reaches 62.5% by 2029, produces installed compute of 8 GW, 12 GW, 17 GW and 23 GW.
The honest way to read that curve is through what it demands after 2028. Base requires 7.2 GW of new replication in 2029 and 9.6 GW in 2030, a total of 16.8 GW beyond the disclosed inventory. At the roughly 1.2 GW primary-power module scale management has described, that is about 14 additional modules across two years. MACROHARDRR and the existing Greater Memphis campuses establish that multi-campus gigawatt-scale replication is a thing this company does, and turbine procurement running through 2029 gives the schedule some physical support.
It remains the weakest link in the physical case, and we carry it as a critical risk, in the open. The post-2027 replication cohort is not site-specific and not contracted. A reader who believes replication stalls at the disclosed inventory should run the Bear bridge, which reaches 22 GW of power and 13 GW of compute by 2030. A reader who believes the module cadence accelerates should run Bull at 55 GW and 34 GW.
The spread between 13 GW and 34 GW is the honest width of the physical uncertainty, and it is wide for a simple reason: the evidence supports a wide range.
One clarification gets lost in secondary commentary: management did not guide to 36.8 GW. That figure is our construction, built from a disclosed project set plus modelled replication, and it should be attributed accordingly.
What the Anthropic and Google contracts prove
Capacity earns nothing until somebody pays for it, and two disclosed contracts do most of the work of showing what SpaceX compute is currently worth.
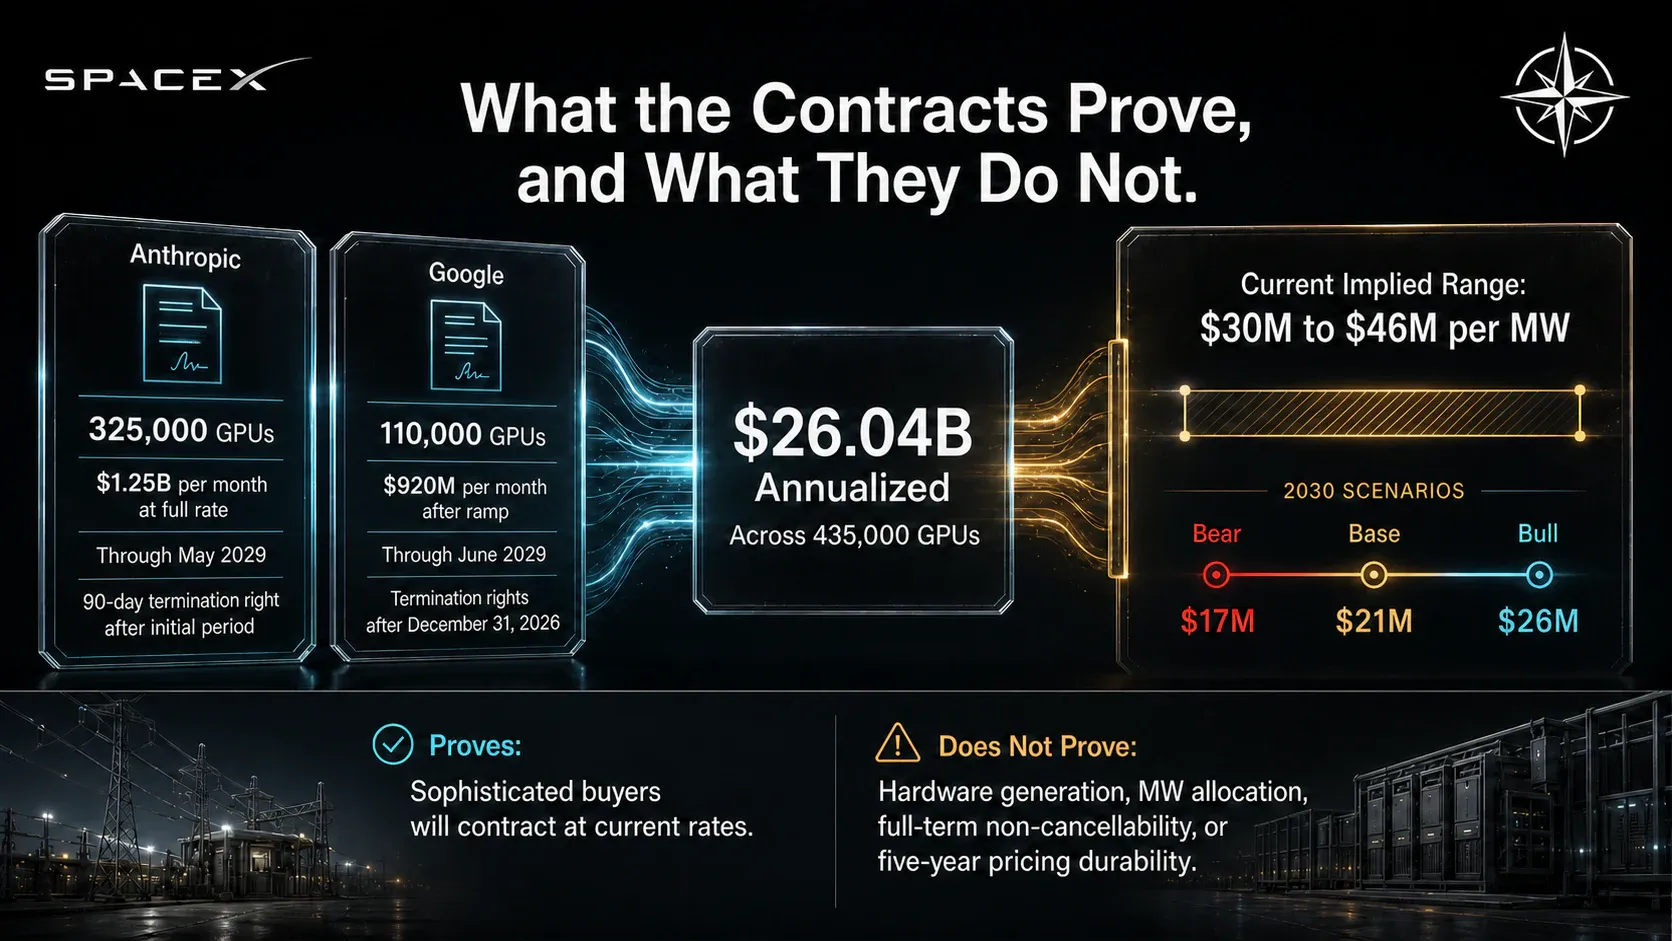
The Anthropic agreement covers approximately 325,000 GPUs at a full rate of $1.25 billion per month, running through May 2029, with a 90-day termination right after an initial period. The Google agreement covers approximately 110,000 GPUs at $920 million per month after ramp, through June 2029, with termination rights available after December 31, 2026. Together they represent roughly $26.04 billion of annualised revenue across 435,000 GPUs at full rate.
Revenue per GPU is the hard unit here, since neither contract discloses the GPU generation or the megawatt allocation. Converting to a per-megawatt figure requires SpaceX's own empirical power draw, and across reasonable bounds the named contracts imply somewhere between $30 million and $46 million of annual revenue per megawatt. That is a range, and it should be presented as one.
A second distinction prevents a common error. Second-quarter hosting and cloud revenue of roughly $1.6 billion was earned while both contracts were still ramping, spread across a 1.4 GW installed fleet. Dividing one by the other produces a fleet-average density far below the contract rate, and that average describes a ramp, not a price. Marginal contract economics and realised fleet economics are different measurements and converge only when the fleet is fully contracted and fully accepted.
Backlog language needs the same care. Both agreements carry termination rights well before their stated end dates, so the full term is not non-cancellable and should never be described that way. What the contracts prove is that two of the most sophisticated buyers of compute in the world signed at these rates in this window. What they do not prove is that the rates hold for five years.
Our Base case assumes they do not. Recognised external density falls from $34 million per megawatt in 2026 to $21 million by 2030, against contract economics currently implying $30 million to $46 million. Bear reaches $17 million and Bull $26 million. Northwise therefore already assumes substantial normalisation from present contract pricing, and a reader who wants to argue the AI case rests on scarcity economics has to argue with a Base case that has removed most of the scarcity premium already.
For context from our own coverage, the Northwise Nebius model carries realised fleet density of $19.18 million per billable megawatt in its 2030 Base and prices new cohorts at $21.02 million. SpaceX Base at $21 million sits alongside that, not above it.
One gigawatt, one economic destination
The most common way to overstate an integrated AI company is to count the same megawatt twice, once as cloud revenue and again as the compute behind a valuable internal application. We allocate accepted compute exactly once.
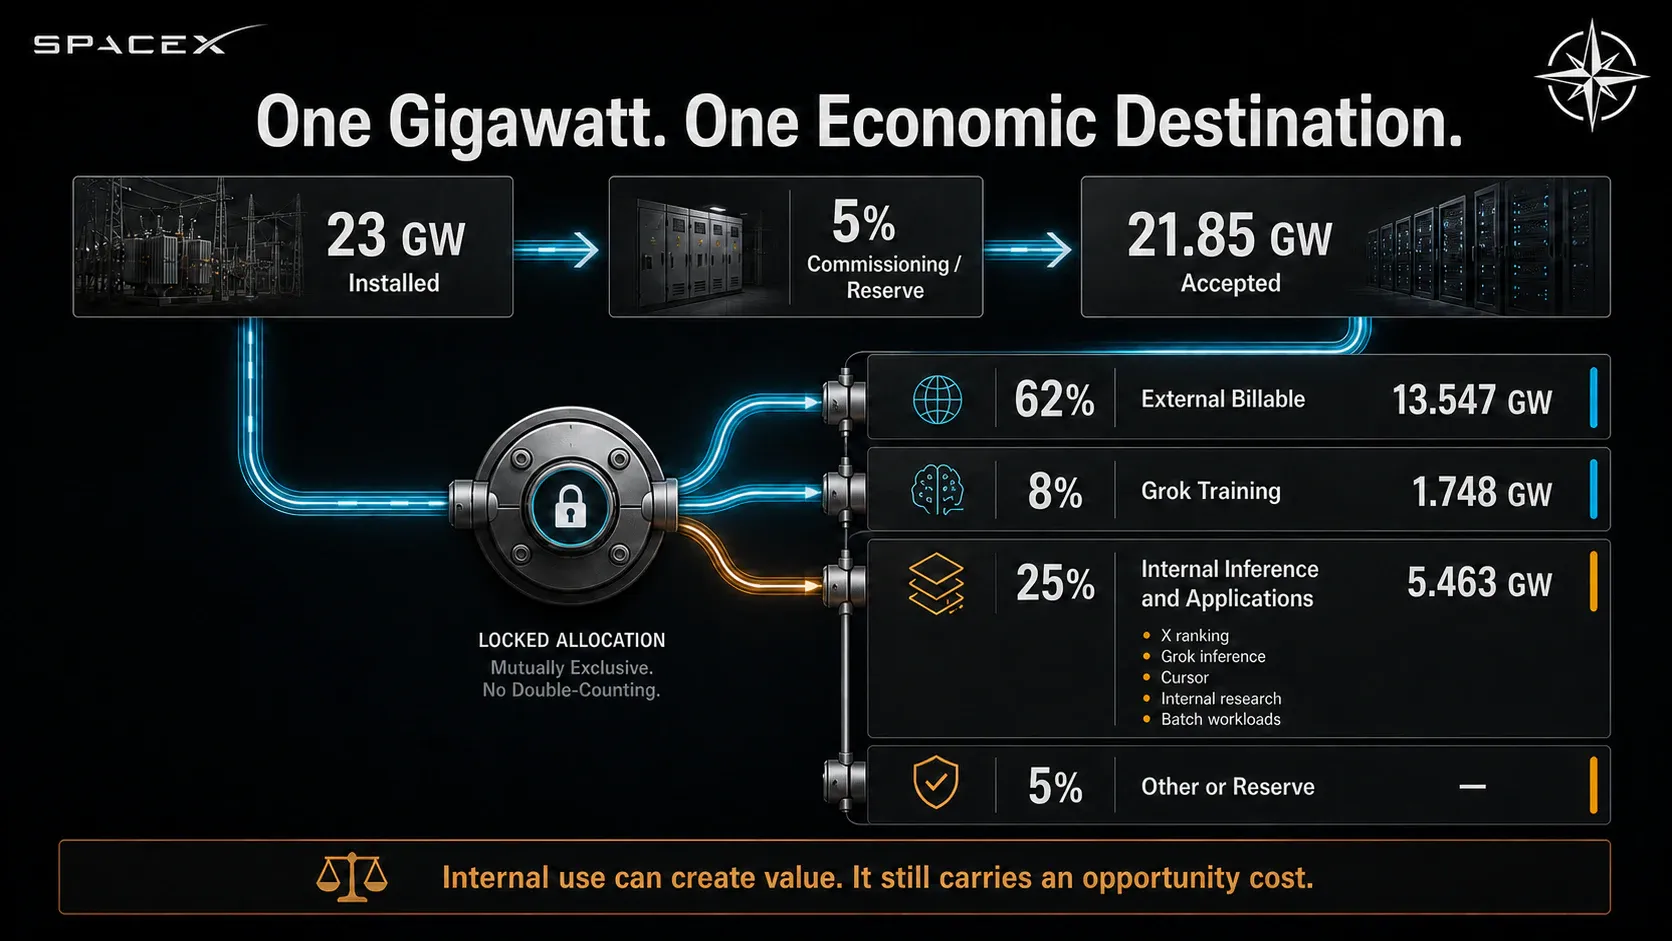
The Base 2030 arithmetic starts with 23 GW installed. A 5% commissioning and reserve haircut leaves 21.85 GW accepted. That accepted capacity then splits four ways: 62% external billable, 8% Grok training, 25% internal inference and applications, and 5% other or reserve. In megawatts, external billable ends the year at 13.547 GW and averages 12.022 GW across it, Grok training takes 1.748 GW, and internal inference and applications take 5.463 GW.
The management heuristic that frontier training runs at roughly 10% of capacity is often read as implying that the other 90% is available for external cloud. It does not. X ranking and moderation, Grok inference, Cursor, internal research and the reserve required to absorb demand spikes all consume real capacity, and the internal inference layer alone is larger than the training layer by a factor of three in our Base case.
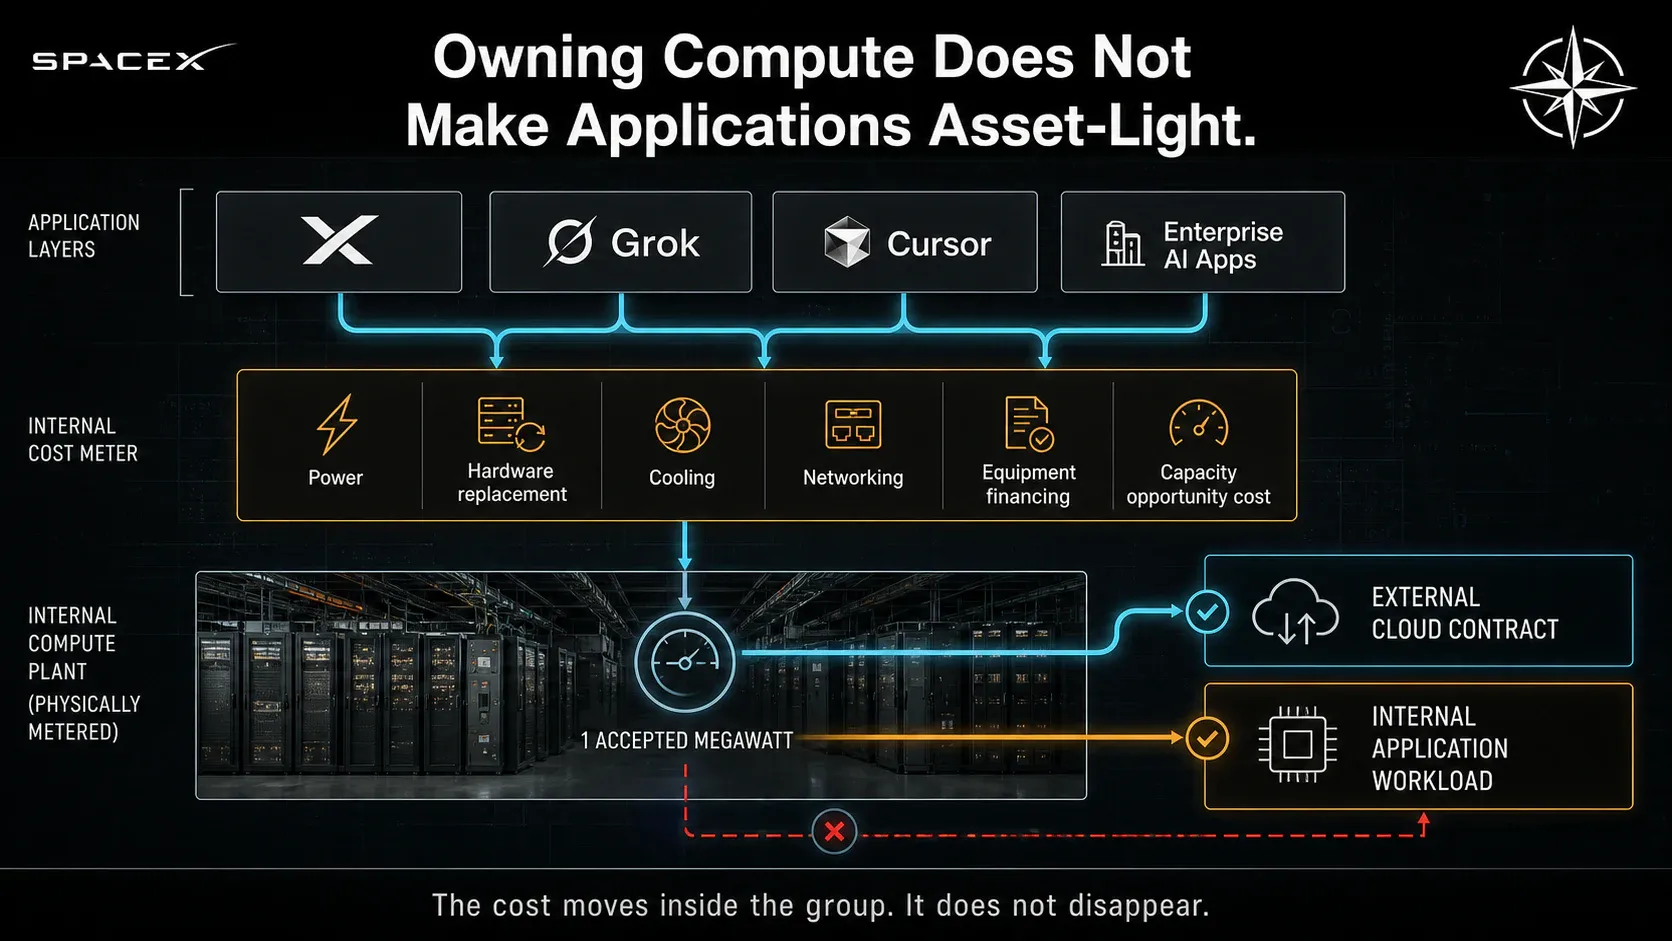
Internal workloads receive no imputed third-party cloud revenue in this model. They also do not run for free. Applications bear the economic cost of the compute they consume, and where internal use displaces capacity a contracted customer would have taken, the opportunity cost is treated separately. Bear allocates 58% of accepted compute externally and Bull 63%, and all three scenarios reconcile to 100% in every year.
That framing carries a consequence. Rising internal demand can reduce external cloud revenue while increasing total company value, if the applications built on that capacity are worth more per megawatt than the cloud contract they displaced. It can also do the opposite. Which way it resolves is an empirical question about application economics, not a strategic assertion, and it is why the application layer is valued separately.
The application layer
AI applications at SpaceX means X advertising, X Premium and Grok subscriptions, Grok API and enterprise, data licensing, and Cursor. Third-party cloud revenue is excluded entirely, since it belongs to the compute engine and is valued there.
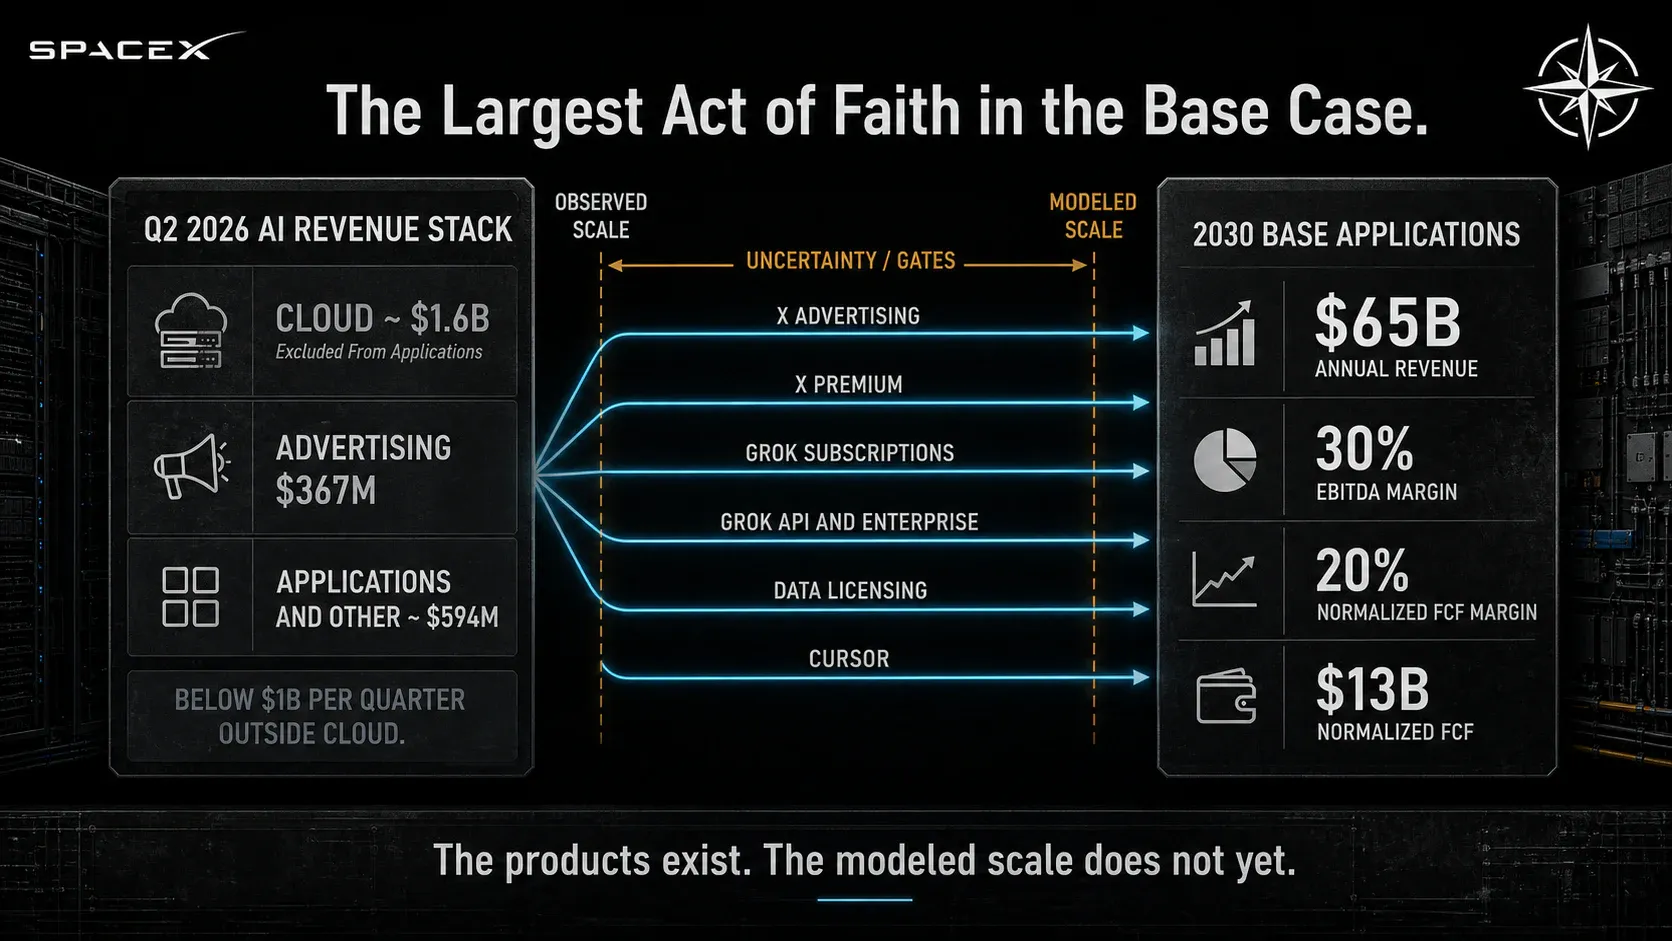
The disclosed history is early. Second-quarter AI revenue of roughly $2.561 billion breaks down into $367 million of advertising, approximately $1.6 billion of cloud, and roughly $594 million of applications and other. An engine that we carry at $65 billion of Base revenue in 2030 is currently running below $1 billion a quarter outside cloud, and the gap between those two figures is the single largest act of faith in the applications case.
Base 2030 applications revenue holds at $65 billion, with Bear at $40 billion and Bull at $100 billion. Margins run 15%, 30% and 40% at the EBITDA line and 10%, 20% and 30% on normalised free cash flow, reflecting a business with real operating leverage and modest capital intensity once the compute cost is charged to it. Base application free cash flow of $13 billion is deducted from total normalised AI free cash flow so that compute economics can be isolated cleanly.
Cursor closed in August 2026 and issued approximately 391.0 million Class A shares. We do not convert that transaction value into forward revenue, and we do not assign Cursor a standalone revenue line, since none has been disclosed. What the acquisition does is dilute the residual claim on everything else the group owns, and that appears in the share count.
The question that decides this engine is whether owning the compute confers a durable cost advantage or simply relocates capital intensity from the application to the infrastructure it rents. Our position is that it relocates more than it saves, which is why applications are valued on their own cash economics.
The capital cost of an AI factory
Building 23 GW of compute requires a quantity of capital that is difficult to hold in the mind, and the accounting for it is where most external models go wrong.
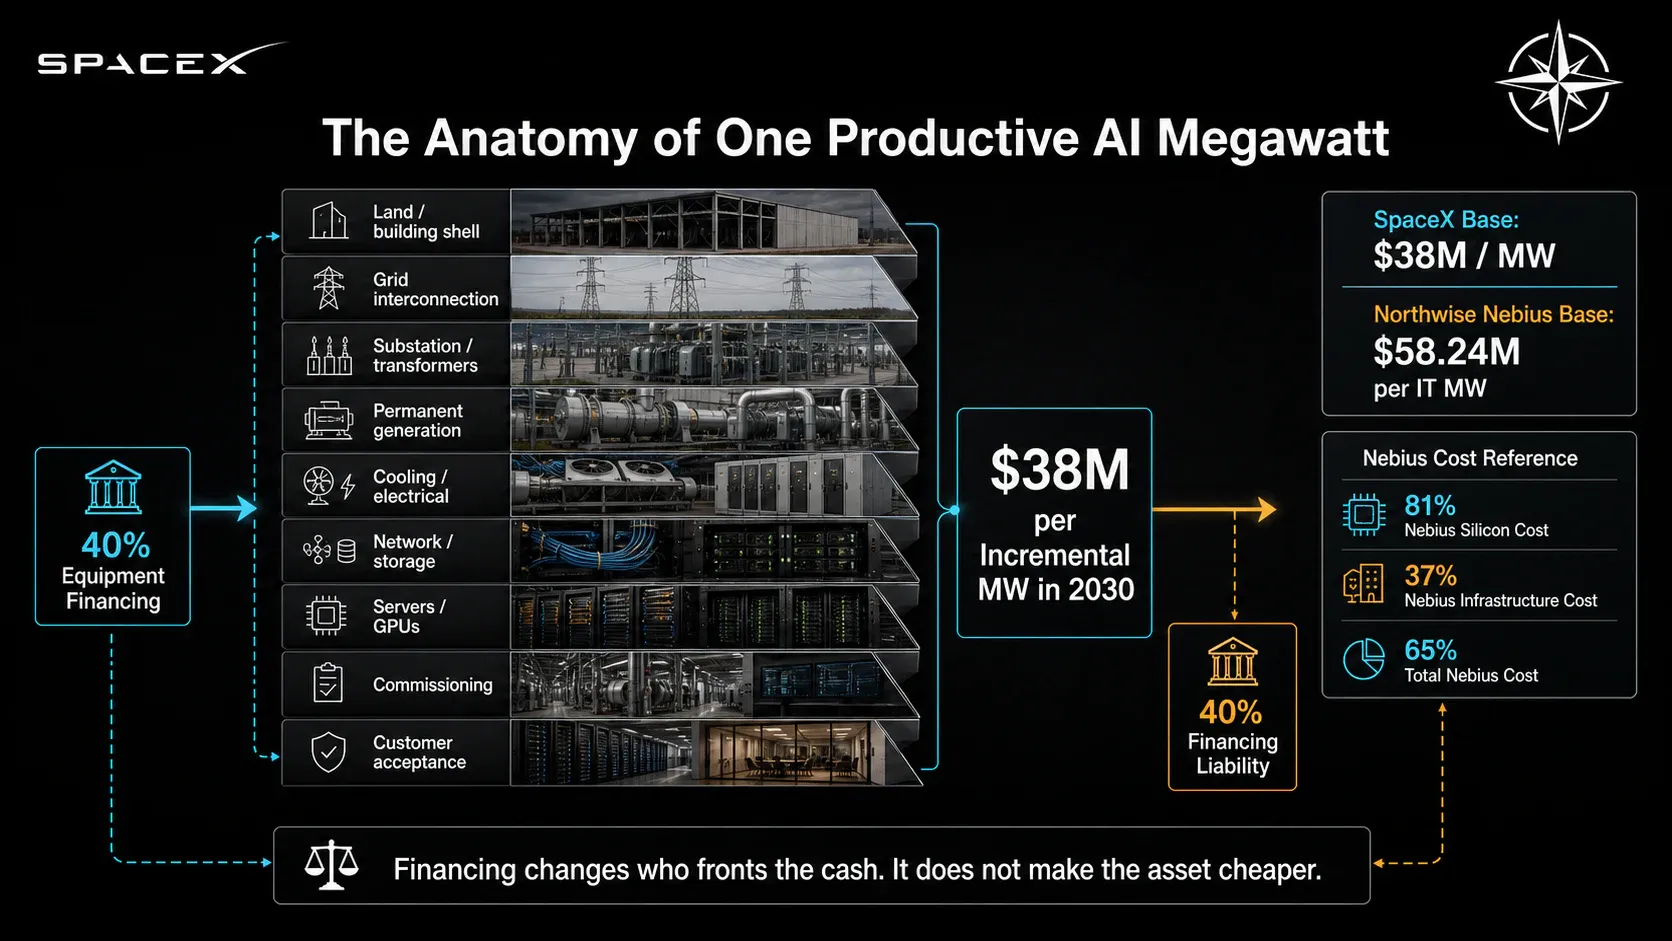
Economic capital expenditure here means everything required to make a megawatt productive: land, shell, power, interconnection, cooling and electrical, networking, servers and GPUs. Financing determines who fronts that money. It does not reduce it. Equipment financing covering 40% of eligible spend leaves the economic capital unchanged and creates a claim that has to be serviced and repaid, and a model that treats financed assets as cheaper assets will produce a valuation that cannot survive its own balance sheet.
Base economic capital per incremental megawatt runs $32 million in 2026, rising to $38 million by 2030. The 2026 anchor is grounded in reported spend: $32 million against 1,400 MW of incremental installed compute implies roughly $44.8 billion of full-year AI capital, against $23.55 billion already reported in the first half. The upward path from there reflects three forces.
Rack density is rising, so newer systems cost more per megawatt. Construction inflation applies to the infrastructure layer. And the cost advantage behind the current campuses comes substantially from speed-optimised temporary infrastructure, which does not scale to 23 GW of permanent grid-connected capacity requiring substations, interconnection and fixed cooling.
Our own neocloud coverage provides the reference point. The Northwise Nebius model carries $37.69 million of compute and networking plus $20.55 million of infrastructure per IT megawatt in its 2030 Base, a total of $58.24 million. SpaceX Base at $38 million sits at 65% of that: roughly 81% of Nebius on silicon, where SpaceX has real procurement scale but buys from the same vendor, and 37% on infrastructure, where vertical integration and self-supplied power do pay.
A discount exists. A discount of the size some SpaceX models assume does not.
Those assumptions produce cumulative 2026 to 2030 economic AI asset additions of $497.5 billion in Bear, $799.0 billion in Base and $1,102.8 billion in Bull. Equipment financing at 30%, 40% and 50% of eligible spend originates $119.4 billion, $255.7 billion and $441.1 billion respectively across the period, leaving 2030 equipment debt balances of $77.3 billion, $176.2 billion and $313.5 billion after amortisation.
The residual decides whether this build is financeable. After AI operating cash and equipment financing, cumulative sponsor cash requirements reach $253.9 billion in Bear, $230.6 billion in Base and $88.3 billion in Bull. Bear and Base converge, since the Bear case builds less and earns far less against it, while Bull outgrows its own capital need by 2028.
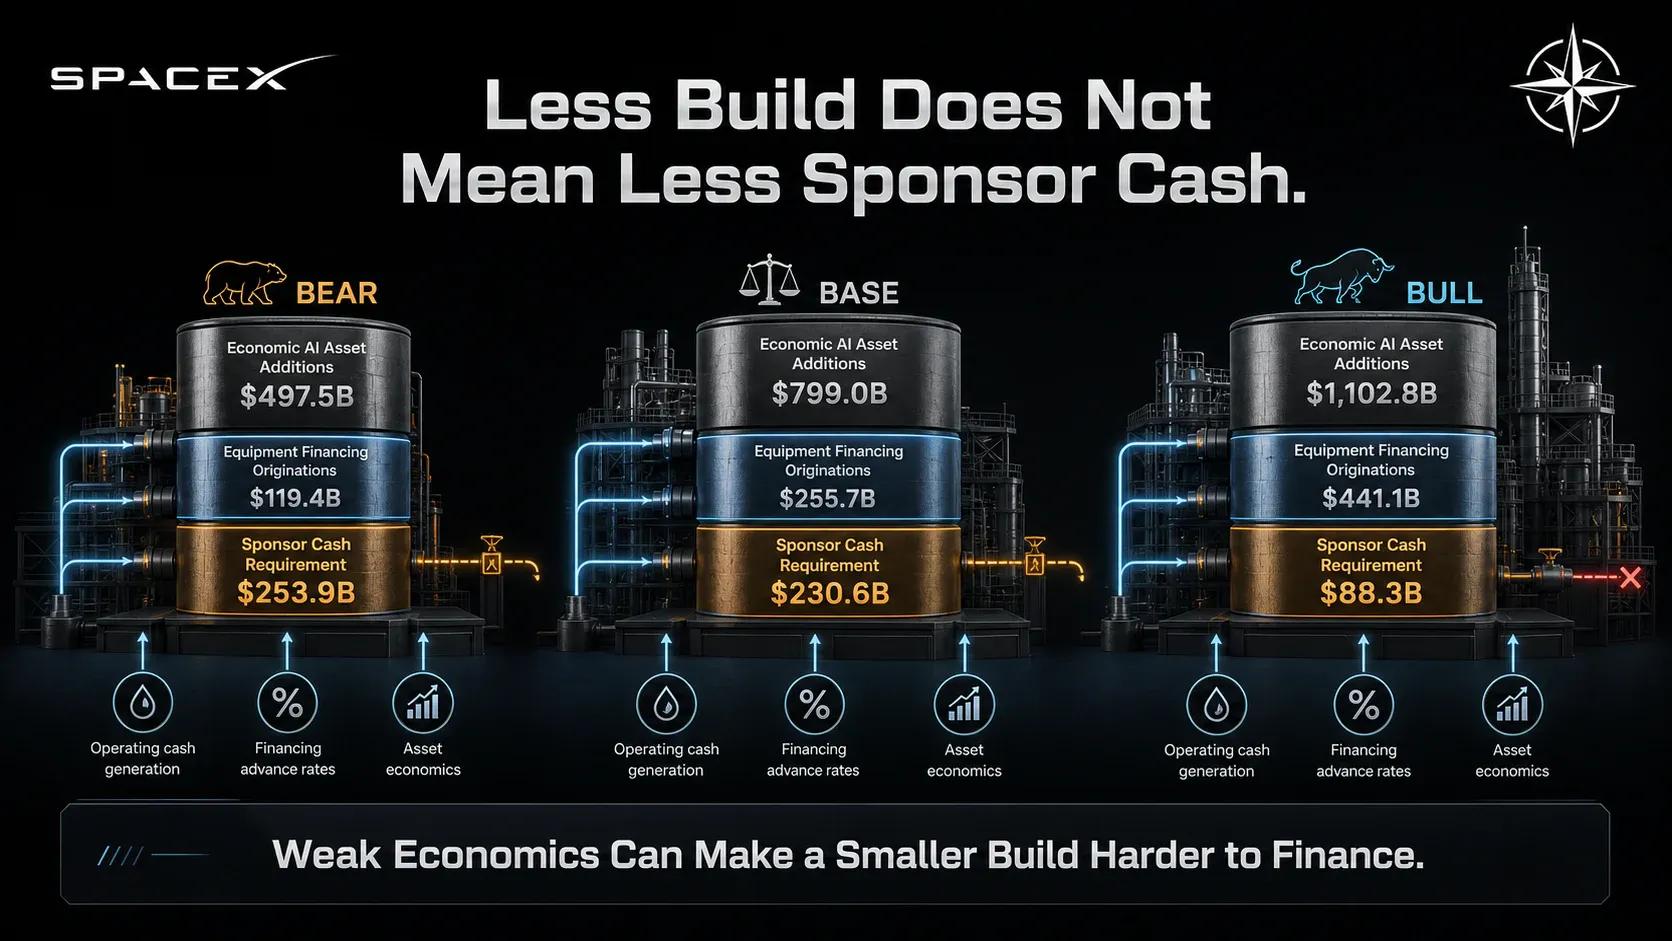
No customer prepayment is assumed anywhere in this model, since none has been disclosed. Nebius funds a meaningful share of its build through prepayments and CoreWeave through leases, and both structures materially reduce sponsor cash. If SpaceX discloses prepayment terms, the funding wall shrinks quickly. Until then, the conservative treatment is that the sponsor funds it.
The GPU cascade
The single largest cost in an AI infrastructure business is replacing hardware, and the way that cost is modelled decides most of the valuation. Two concepts do the work here, and conflating them produces an answer that is wrong by tens of billions of dollars a year.
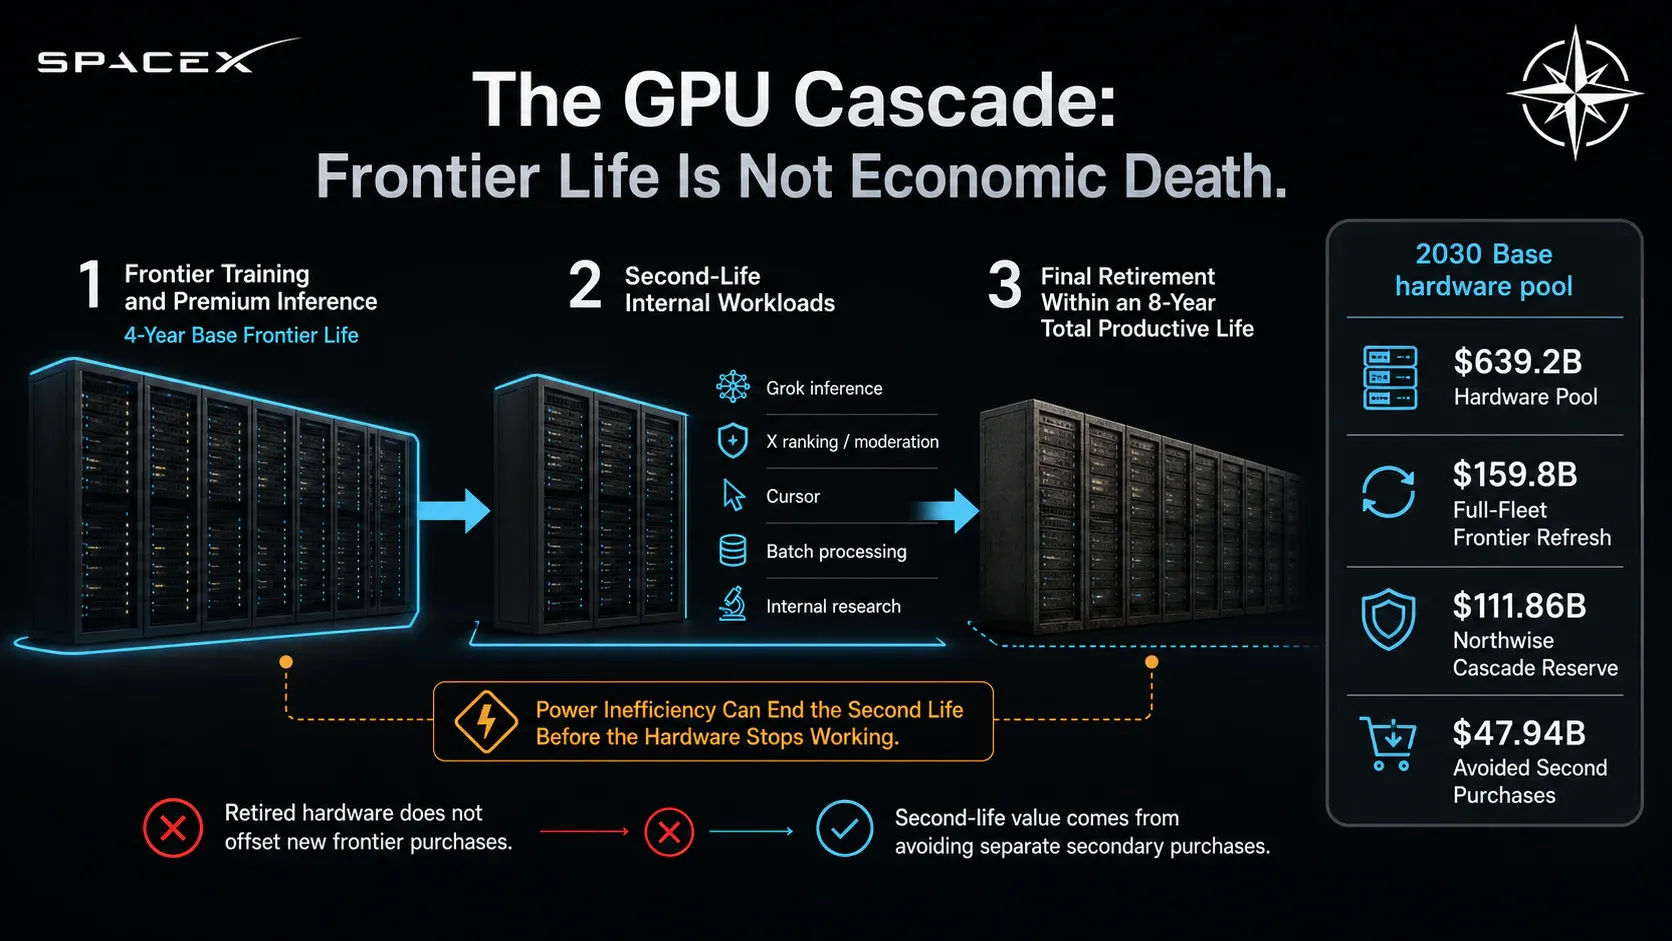
Frontier service life is how long a GPU stays competitive for the work that pays the most, which is large-scale training and premium inference. Total productive life is how long it can do useful work of any kind. We carry frontier life at 3, 4 and 5 years across Bear, Base and Bull, and total productive life at 6, 8 and 10 years. Retained useful capacity when a chip leaves frontier duty runs 50%, 65% and 75%.
The distinction has physical support. CoreWeave has recontracted A100 capacity into productive service roughly six years after those chips were current, which is direct evidence that frontier obsolescence and economic death are separated by years. Our Nebius model reaches the same conclusion from the same evidence, carrying a 7-year economic compute life against a 5-year accounting life.
What that buys is narrower than it first appears, and the model is deliberate about the limit. A frontier refresh remains a full cash outflow. Retired hardware receives no credit against the cost of buying new frontier systems, since a customer paying for current-generation training will not accept three-year-old silicon. The benefit is entirely in avoided second purchases: refreshed hardware migrates into inference, X ranking and moderation, Grok serving, Cursor and batch work, so SpaceX does not buy separate machines for those jobs.
That credit is also capped. The secondary pool has its own final retirement requirement, and redeployment credit can never exceed it, so old GPUs cannot manufacture unlimited residual value. In all three scenarios the cascade supply covers modelled secondary retirement by 2030, which makes the binding annual burden frontier refresh alone.
The Base arithmetic runs as follows. Cumulative AI economic asset additions of $799.0 billion at an 80% compute-hardware share produce a $639.2 billion hardware pool, and with 70% of that pool in frontier workloads on a 4-year cycle, the gross frontier refresh requirement is $111.86 billion a year.
Secondary final-retirement need of $23.97 billion is fully covered by cascade supply of $72.71 billion, so the net normalised hardware replacement reserve stays at $111.86 billion. Modelling the whole fleet on a frontier cycle would demand $159.8 billion, so the cascade saves $47.94 billion a year in Base.
The cascade has two failure modes. If old GPUs become power-inefficient enough that running them costs more in electricity and cooling than buying new hardware for the same job, the second-life thesis fails on economics even though the hardware still works. And if internal workloads grow more slowly than the retirement schedule, the cascade supply exceeds the need and the credit stops binding. We treat the first as a high risk and the second as the reason redeployment credit is capped.
The 2030 AI scenario set
The scenarios below are constructed so that no case stacks every assumption in the same direction. A Bear that assumes the worst outcome on physical scale, pricing, utilisation, margin and financing simultaneously is not a downside case, it is an arithmetic exercise, and the same applies in reverse.
Base is the 23 GW thesis at $21 million of recognised density. Bear reaches 13 GW of installed compute and holds density at $17 million, which is below current contract economics but well above a collapse. Bull reaches 34 GW at $26 million, which is roughly current contract pricing carried forward.
The full 2030 terrestrial AI picture follows from the physical and monetisation chain built above.
2030 | Bear | Base | Bull |
|---|---|---|---|
Installed compute | 13.0 GW | 23.0 GW | 34.0 GW |
External billable, ending | 6.94 GW | 13.55 GW | 20.78 GW |
Recognised density | $17M/MW | $21M/MW | $26M/MW |
External compute revenue | $106.59B | $252.47B | $469.85B |
Applications revenue | $40.00B | $65.00B | $100.00B |
Total AI revenue | $146.59B | $317.47B | $569.85B |
Adjusted EBITDA | $64.50B | $152.38B | $313.42B |
EBITDA margin | 44% | 48% | 55% |
Normalised AI FCF | ($28.14B) | $22.32B | $130.80B |
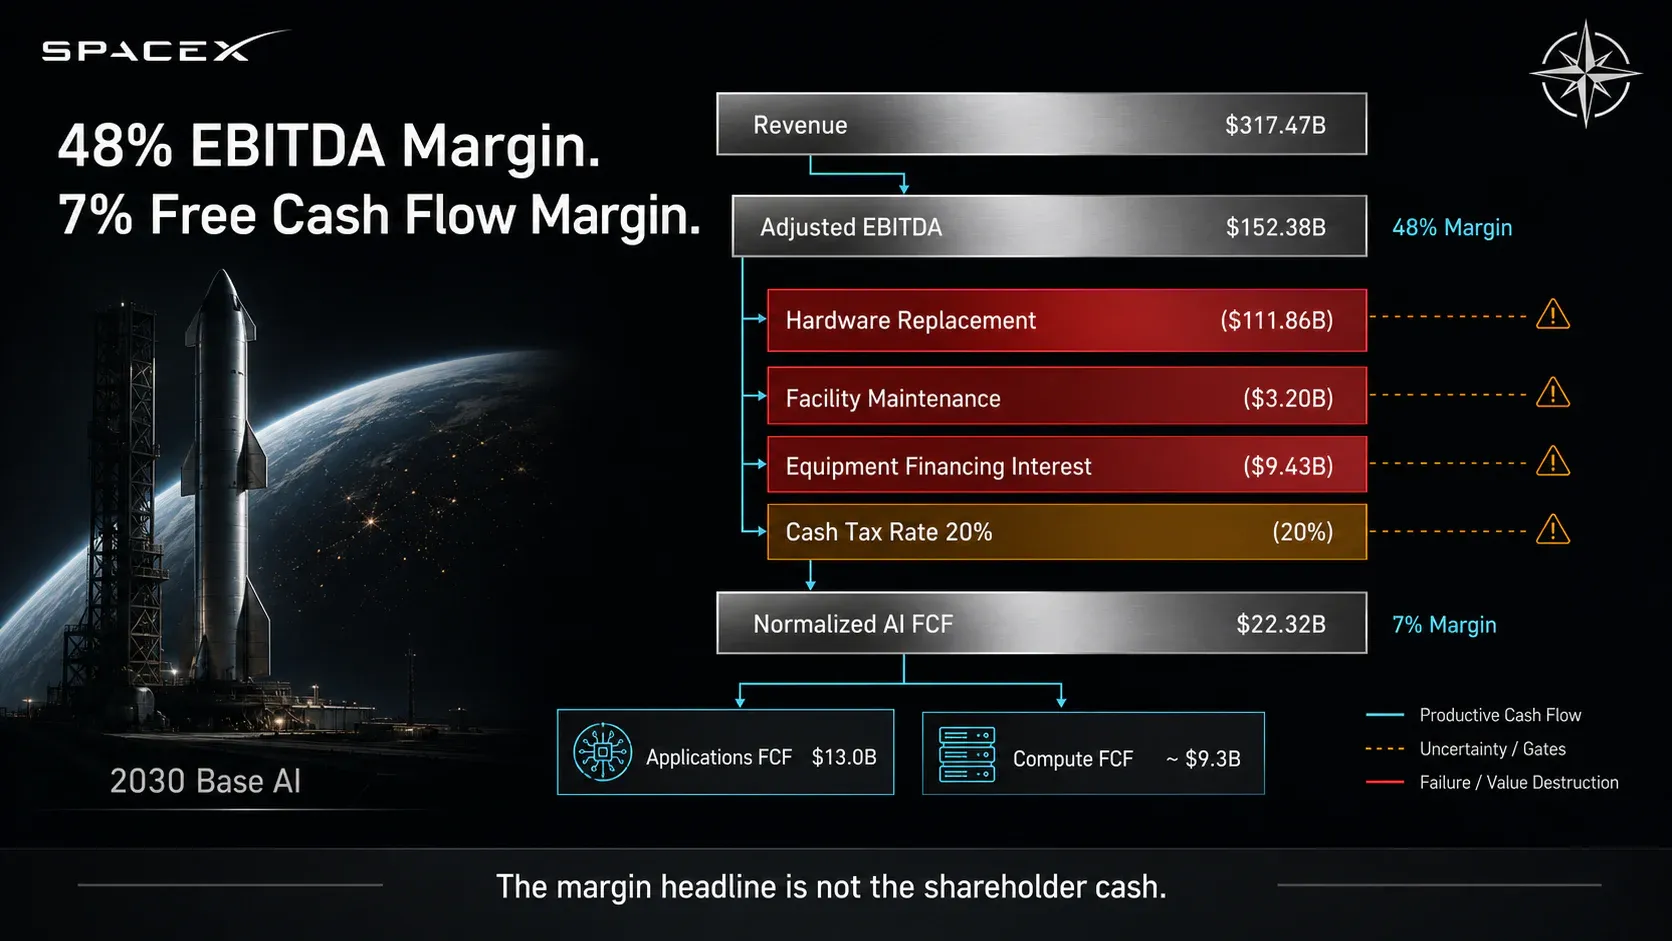
The bottom two rows are where this section earns its place. Base AI revenue of $317.47 billion sits close to the roughly $322 billion figure in Goldman's reported 2030 estimate, which is a useful scale check while remaining underwriter research and not independent validation. Base EBITDA of $152.38 billion is a large number by any standard. And Base normalised free cash flow is $22.32 billion, which is 7% of revenue.
The gap between a 48% EBITDA margin and a 7% free cash flow margin is the entire argument of this report compressed into two figures. Between them sit $111.86 billion of hardware replacement, $3.20 billion of facility maintenance, $9.43 billion of equipment financing interest and a 20% cash tax rate. Subtracting the $13 billion of applications free cash flow isolates the compute engine, which generates roughly $9.3 billion of normalised cash on $252.5 billion of external revenue.
A 48% margin also reconciles better with the density path than a higher figure would. Recognised density falls from $34 million per megawatt in 2026 to $21 million in 2030, and a model that lets margin climb sharply while price per unit falls is asserting that cost per megawatt falls faster than price, across a period when rack density and power draw are both rising. We do not think that holds, and the Base margin path reflects it.
Bear turning free cash flow negative at $146.59 billion of revenue is not a modelling artefact. It is what happens when a company builds 13 GW at Bear capital costs and then earns Bear prices against it, and it is the clearest statement in this model of how much the outcome depends on execution, not on demand.
Orbital compute without the science-fiction multiple
Orbital AI is the part of the SpaceX story most likely to be valued by adjective, so we build it from mass and power.
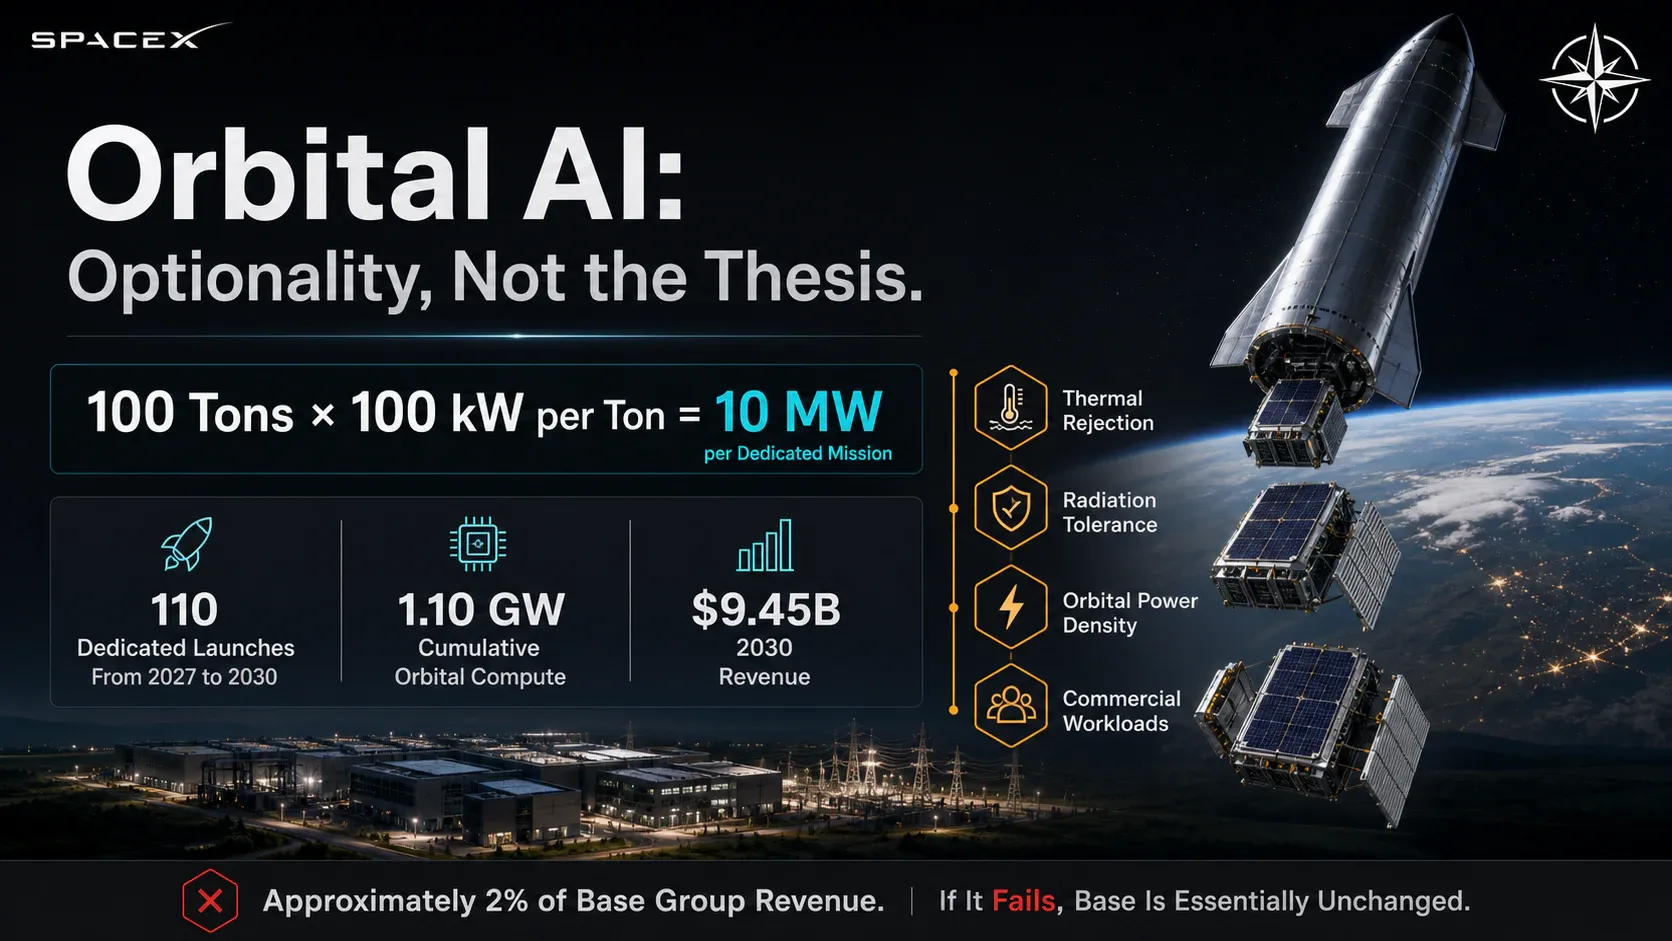
The physics come first. The design target is roughly 100 kilowatts of compute per metric ton of launched hardware. A fully loaded Starship carrying approximately 100 tons therefore corresponds to about 10 megawatts of orbital compute per dedicated mission. Everything else follows from how many such missions fly and how much of the resulting capacity finds a paying workload.
Base carries 110 dedicated orbital AI launches across 2027 to 2030, producing roughly 1.10 GW of cumulative orbital compute and $9.45 billion of 2030 revenue. Bear carries 31 launches for 310 MW and $1.89 billion. Bull carries 380 launches for 3.80 GW and $43.16 billion.
Those revenues are then risked twice before any value is attached, once through a conservative revenue multiple and again through an explicit technical and commercial probability, since thermal rejection in vacuum, radiation tolerance, orbital power density and the commercial case for latency-insensitive compute in space are all unresolved. The valuation treatment sits in the premium sections and it is deliberately small.
The scale check that matters here does not need it. Base orbital revenue of $9.45 billion is roughly 2% of Base 2030 group revenue and under 3% of terrestrial AI revenue. If orbital compute never works at all, the Base case is essentially unchanged, and any reader who suspects this report leans on space-based data centres to reach its conclusion can verify that it does not.
A pair of constraints keeps the Base figure honest. A pilot launch and a commercially monetised megawatt are different milestones, and we score them separately, so monetised share ramps well behind deployed capacity. And every orbital mission competes for the same Starship capacity that Starlink replacement and customer payloads need, which is the subject of a later section.
Starlink becomes a bandwidth business
Satellite count stopped being a useful measure of Starlink the moment V3 entered service, and the physical argument for that is straightforward.
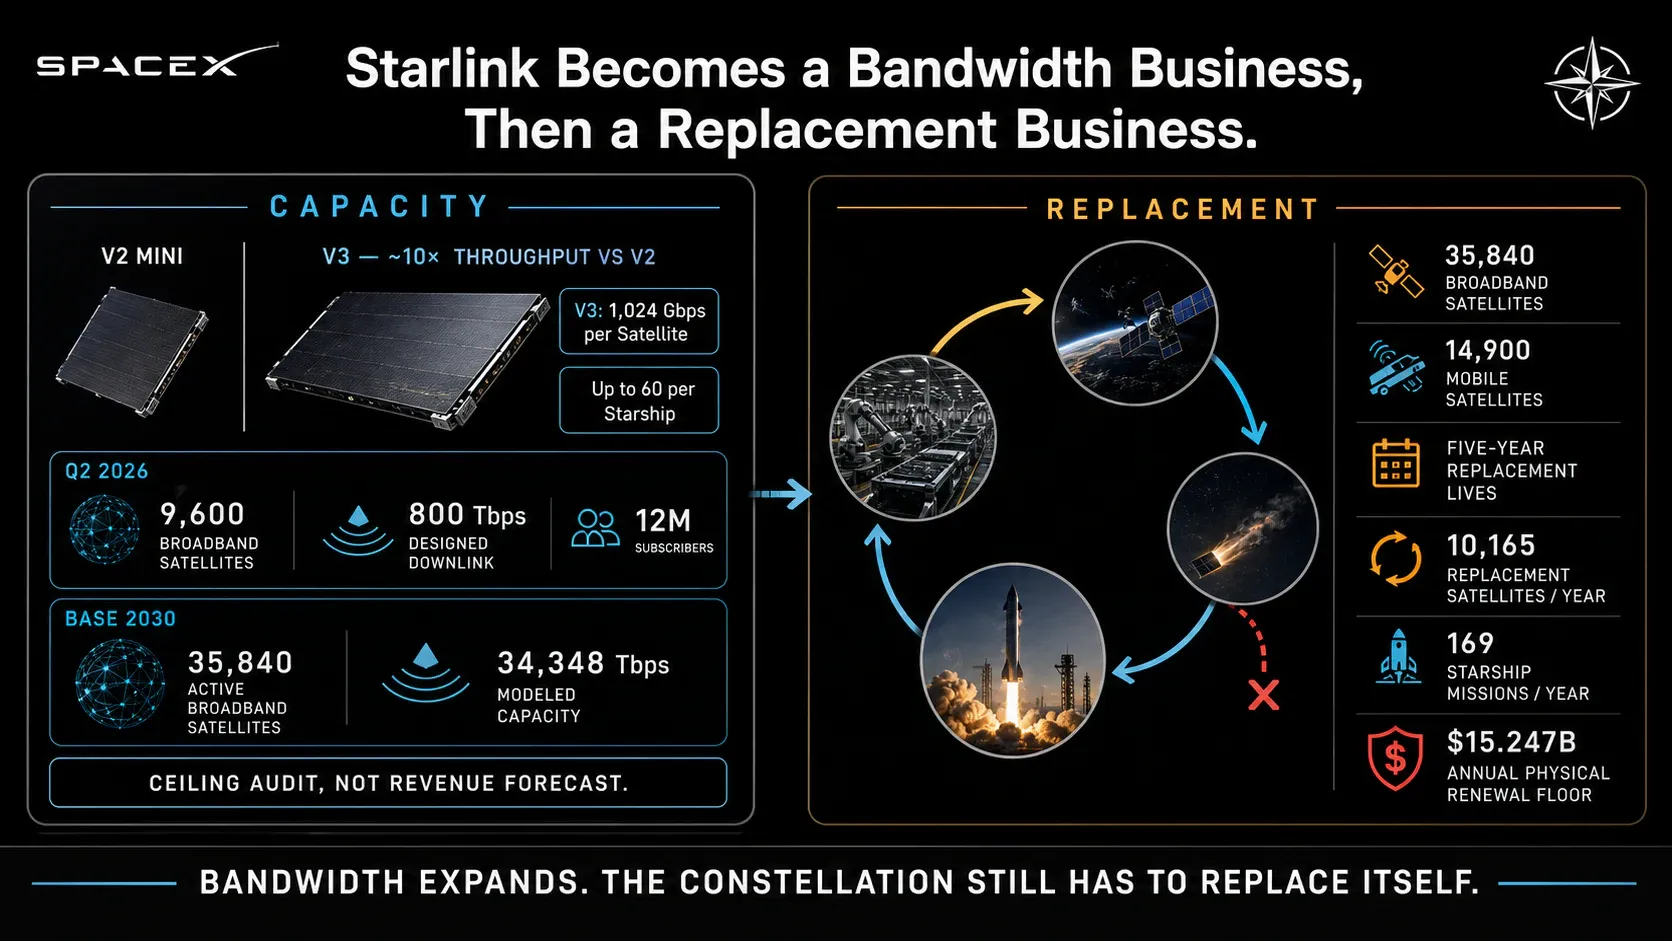
A V2 Mini contributes roughly a tenth of what a V3 contributes on designed throughput. V3 is built around approximately 1,024 gigabits per second per satellite, with up to 60 riding a single Starship. That changes the relationship between fleet size and network capability so completely that a shrinking legacy fleet can coexist with capacity growing by an order of magnitude.
The second quarter of 2026 gives the starting point: roughly 9,600 broadband satellites delivering approximately 800 terabits per second of downlink to about 12 million subscribers. Base carries V3 missions of 2, 40, 100, 175 and 250 across 2026 to 2030, alongside Mobile V2 missions of 0, 10, 40, 80 and 120, arriving at a 2030 broadband fleet near 35,840 active satellites and modelled capacity around 34,348 terabits per second.
That capacity figure is a ceiling audit, not a demand forecast. It exists to test whether the subscriber and revenue assumptions later in this report are physically deliverable, and it answers only that question. Designed throughput also survives contact with routing efficiency, spectrum allocation, gateway capacity and ground segment constraints imperfectly, so realised capacity will run below the modelled figure. We hold that as a high risk and do not convert theoretical bandwidth into revenue anywhere.
Mobile is modelled as a separate constellation with separate physics. Blending direct-to-cell capacity into broadband bandwidth would produce a single meaningless number, since the two serve different spectrum, different terminals and different customers.
The Starlink revenue build
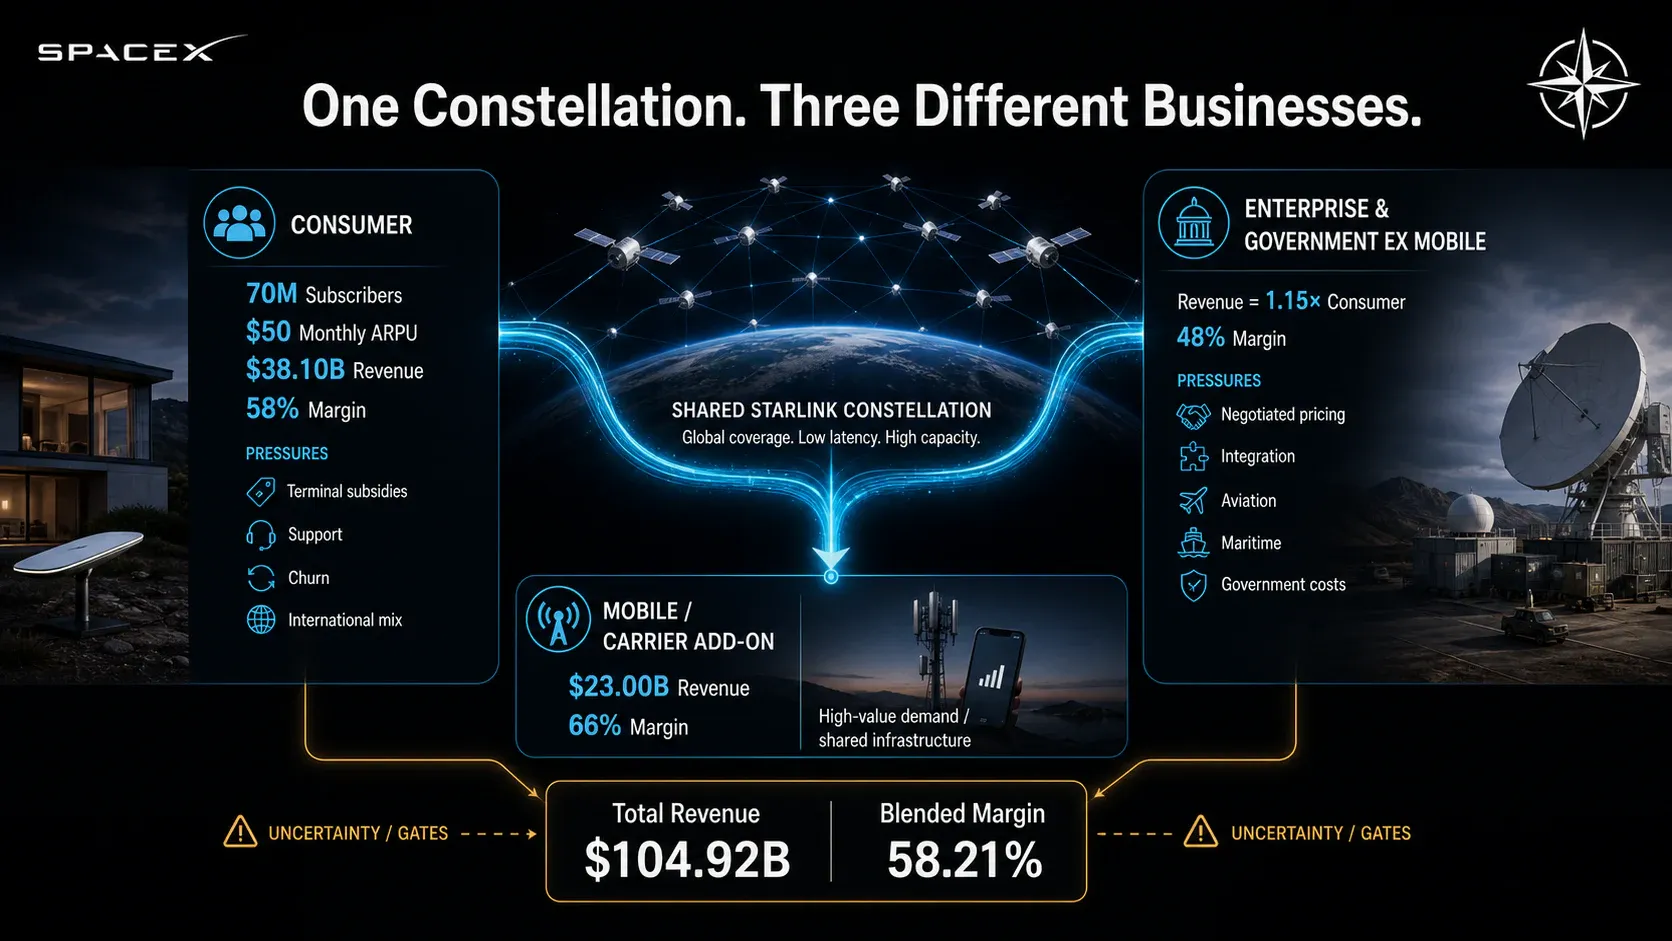
Starlink revenue splits three ways in this model: consumer broadband, enterprise and government excluding mobile, and mobile or carrier add-on. Dense terrestrial telecom substitution is assigned zero revenue throughout, which is the single most important constraint in the section.
The 2030 build assumes competition, not pricing stability. Amazon's Leo constellation reaching commercial service, and terrestrial operators responding, both pressure consumer pricing, and a company adding tens of millions of subscribers across lower-income geographies faces mix pressure regardless of competitive response. Base consumer ARPU therefore falls to $50 per month by 2030 from a starting point above $60.
2030 | Bear | Base | Bull |
|---|---|---|---|
Subscribers | 48M | 70M | 102M |
Consumer ARPU | $47 | $50 | $54 |
Consumer revenue | $25.10B | $38.10B | $58.97B |
Enterprise and government ratio | 1.00x | 1.15x | 1.35x |
Mobile revenue | $10.00B | $23.00B | $38.00B |
Total Connectivity revenue | $60.20B | $104.92B | $176.57B |
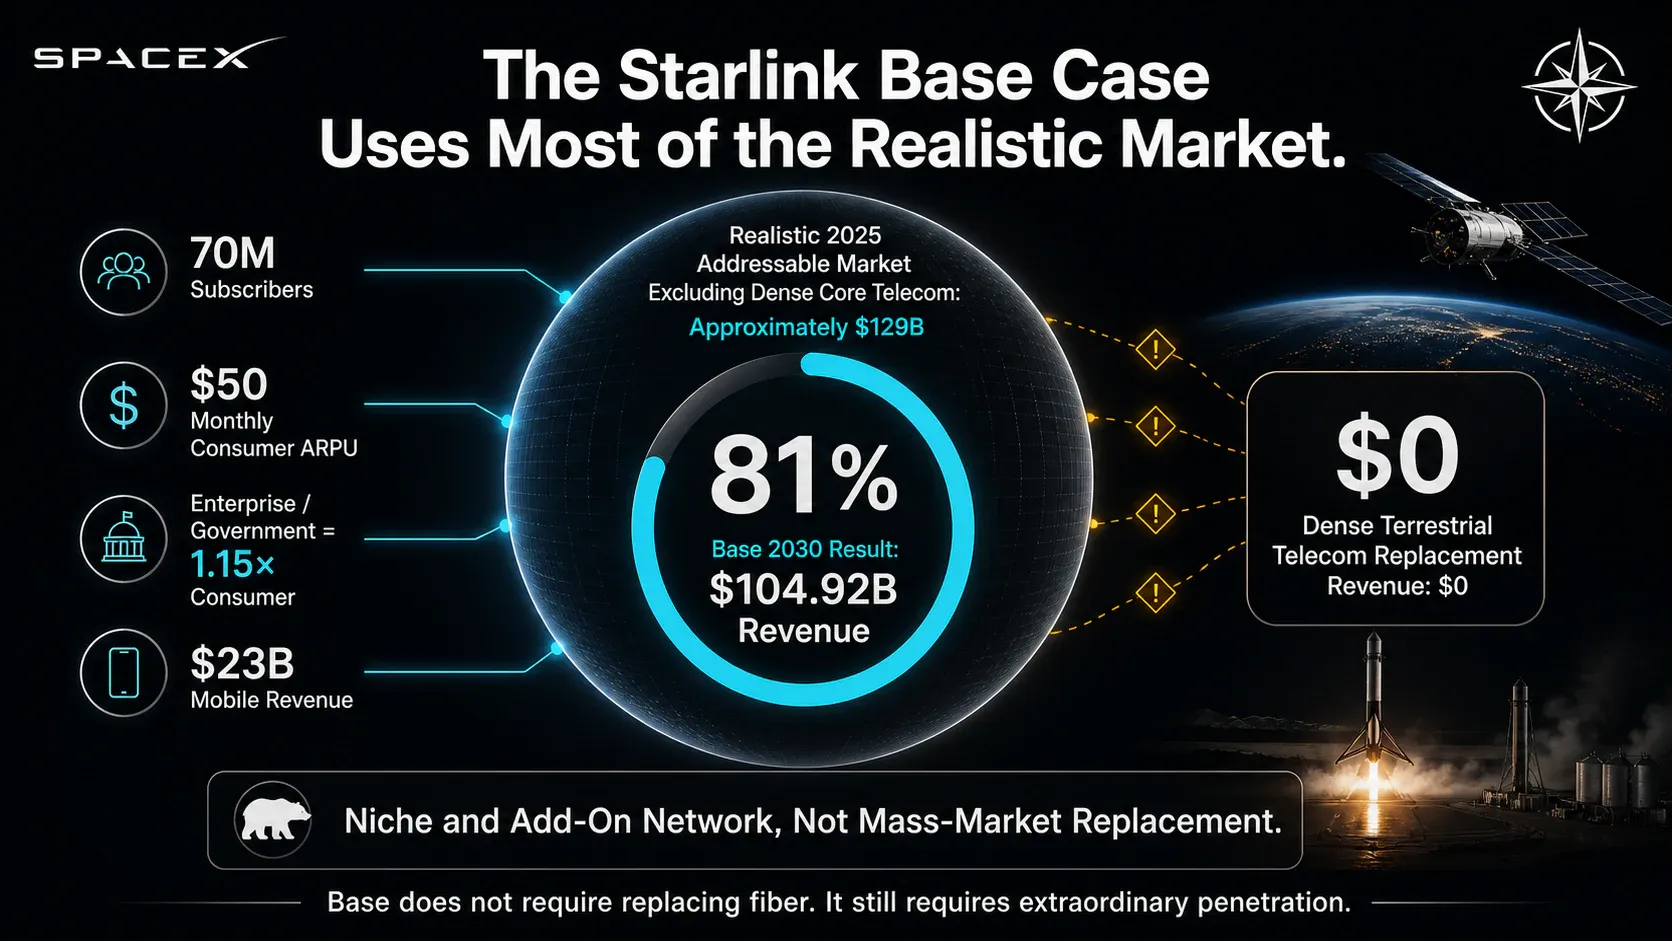
Base therefore asks the network to grow from 12 million subscribers to 70 million while consumer pricing falls by roughly a fifth, and to earn 15% more from enterprise and government than from consumers on the same infrastructure. Both assumptions invite scrutiny, and the second is the more demanding one, since aviation, maritime and enterprise connectivity are markets with incumbent providers and negotiated pricing.
Morningstar's framing, that Starlink is a niche and add-on service, never a mass-market network, remains the most serious version of the bear case, and their roughly $129 billion realistic 2025 addressable market excluding dense core telecom is the right benchmark to argue against. Base Connectivity revenue of $104.92 billion represents about 81% of that pool. That is demanding. It is also achievable without Starlink replacing a single dense terrestrial network, which is the specific claim Morningstar disputes and which this model does not require.
Starlink cash economics
Connectivity is where the largest single modelling improvement in this report sits, and it concerns how the margin is derived, not what it equals.
A single blended margin applied to a business with three structurally different revenue streams hides what a reader most needs to know.
Consumer broadband carries terminal subsidies, high support costs and churn. Enterprise and government excluding mobile carries integration and service costs against negotiated pricing. Mobility and government carries the highest-value contracted demand on infrastructure already built for consumers. Those are three different businesses sharing a constellation.
We therefore carry a margin for each, anchored to what the company actually reports. Solving backwards from the second-quarter 2026 Connectivity margin of approximately 60.5% against the reported revenue mix puts consumer near 62%, enterprise near 52%, and mobility and government near 64% today. Those anchors then move to 2030 on separate paths, with consumer compressing to 58% as ARPU falls and international mix grows, enterprise to 48%, and mobility and government improving to 66%.
The blended margin becomes an output of the revenue mix, no longer a terminal assumption, and it lands at 58.21% in Base for 2030. A reader who disagrees can move any single bucket and watch the blend respond, which is a more useful disclosure than a single number with a paragraph of justification attached.
The replacement burden is audited physically, not taken as a percentage of capital spending. Base carries approximately 35,840 active broadband satellites and 14,900 V2 Mobile satellites on five-year replacement lives, which requires roughly 10,165 replacement satellites a year and 169 Starship missions to deliver them. At Base satellite manufacturing cost and Starship mission cost, that produces a physical renewal floor of $15.247 billion a year.
The model takes the higher of that floor and a conventional percentage-of-capital reserve, and in Base the physical floor binds, at $15.247 billion against a policy reserve of $8.498 billion. In Bear the ordering reverses and the policy reserve binds. Using the higher of the two protects against a common error, which is reserving too little for a network that physically deorbits a fifth of itself every year.
2030 | Bear | Base | Bull |
|---|---|---|---|
Connectivity revenue | $60.20B | $104.92B | $176.57B |
Blended EBITDA margin | 53.8% | 58.2% | 60.3% |
Adjusted EBITDA | $32.38B | $61.07B | $106.56B |
Normalised replacement capital | $8.61B | $15.25B | $21.80B |
Normalised Connectivity FCF | $19.49B | $36.66B | $66.96B |
A normalised free cash flow margin of 34.9% in Base is the number to carry forward. It describes a network that converts roughly a third of revenue into cash the parent can actually use after replacing the satellites that revenue depends on, and it explains why Connectivity remains the funding engine for the group even as AI becomes the larger asset base.
One conservatism runs against us and should be flagged. The physical floor covers satellite manufacturing and launch only. Ground stations, gateway infrastructure, network hardware and terminal subsidies sit outside it, which is precisely why the percentage-of-capital reserve is retained as a second test.
Starship is the shared bottleneck
Three of the four engines depend on the same vehicle, and that dependency is the most correlated risk in this model.
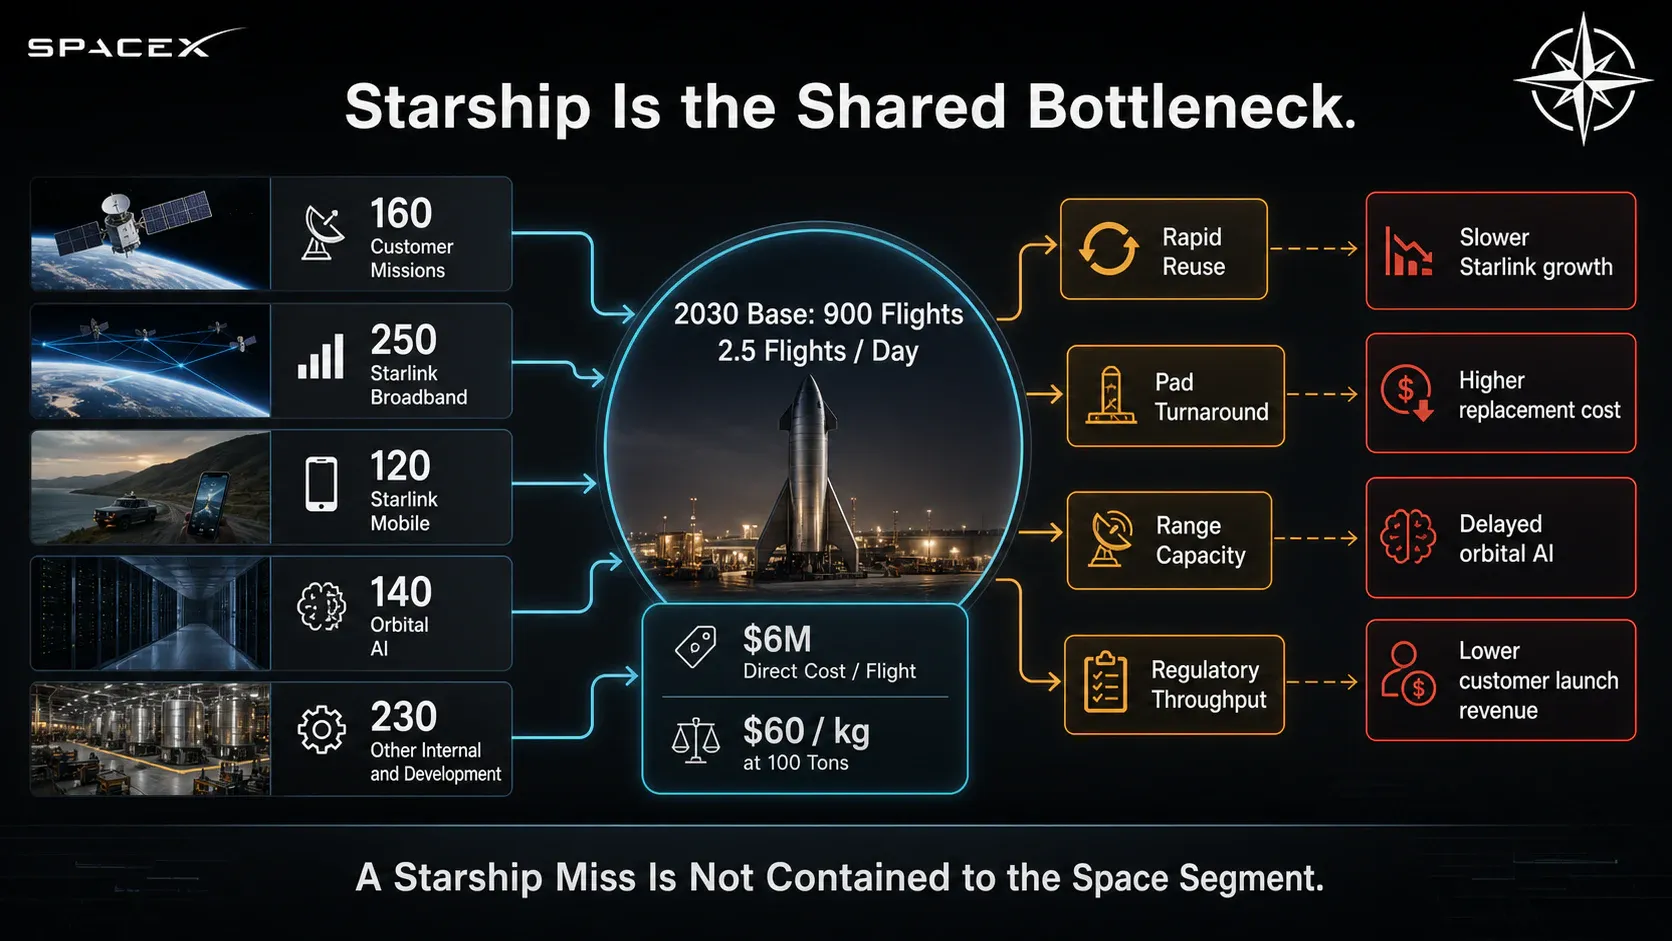
Starlink broadband deployment and replacement, Starlink Mobile deployment, and orbital compute all require Starship missions. So do customer payloads. Every mission flown for one of those purposes is a mission not flown for the others, and the allocation is not a modelling convenience. It is a physical constraint that binds harder as each engine scales.
Base carries 900 Starship launches in 2030, allocated as 160 customer missions, 250 Starlink broadband, 120 Starlink Mobile, 140 orbital AI, and 230 other internal and development flights. Bear carries 350 and Bull 2,500. Falcon meanwhile declines from current cadence toward 45, 20 and 5 launches as Starship absorbs the manifest.
Nine hundred flights a year is roughly two and a half per day. That sits deliberately below management's stated ambition of at least one flight per day, which would imply well over 1,000 annually across a full year of operation, and it remains an extraordinary number against any historical launch programme. Our milestone ledger puts the daily-flight target at 12.5% for the stated August 2027 date and 40% within an additional 24 months, and the 900-flight Base figure at 45% by 2030 and 70% with two more years.
Cost per flight is the other variable that propagates everywhere. Base assumes $6 million of direct cash cost per Starship launch against 100 tons of delivered payload, implying roughly $60 per kilogram. Bear assumes $15 million and Bull $3 million. That figure sets Starlink replacement economics, orbital compute feasibility and Space segment contribution simultaneously, so a cost miss is not contained to one engine.
Cadence turns on two engineering questions. Whether both stages achieve true rapid reuse, since a vehicle that requires significant refurbishment between flights cannot reach these rates at these costs. And whether pads, ranges and regulatory throughput can support multiple launches per day, which is a question about ground infrastructure and airspace management, not about rocketry.
A Starship delay is therefore not a Space segment problem. It slows Starlink capacity growth, raises Starlink replacement cost, delays orbital compute, and reduces customer launch revenue at the same time, in the same direction, for the same reason. We carry cadence as a critical risk and cost as a high one.
Why launch revenue is not the thesis
The most famous product in the company contributes a small fraction of its value, and the reason is structural.
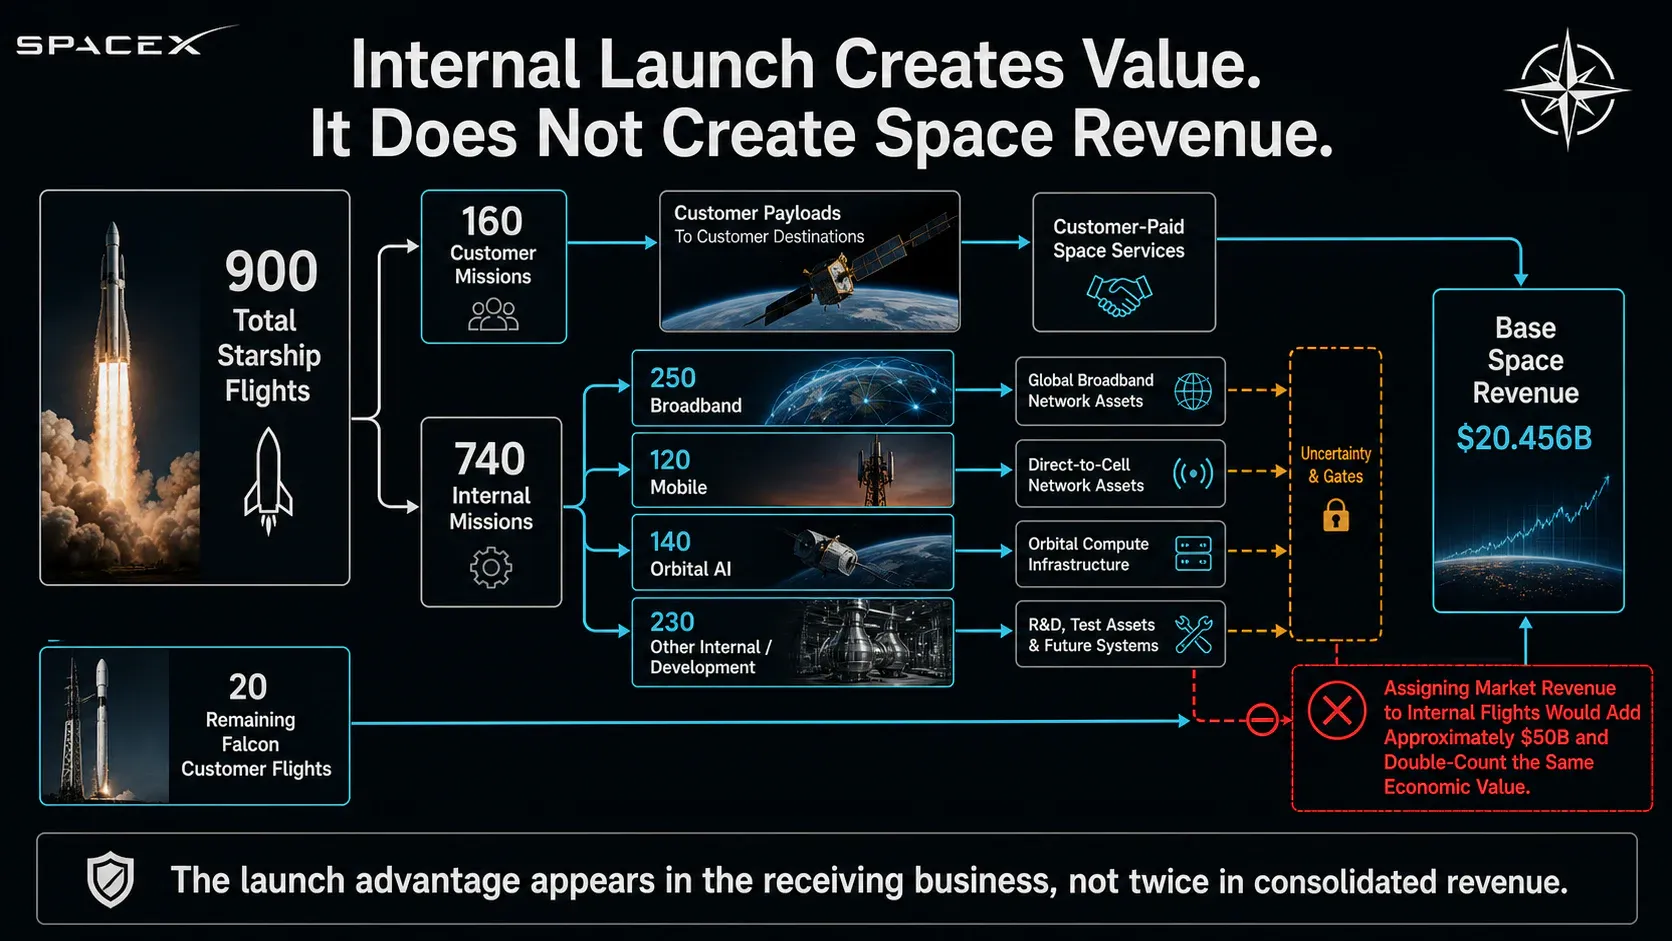
Space segment revenue includes only missions a customer pays for. Base carries $20.456 billion of 2030 Space revenue against 160 customer Starship launches and 20 remaining Falcon flights, with Bear at $9.640 billion and Bull at $34.665 billion. Adjusted EBITDA runs negative $1.700 billion in Bear, $7.788 billion in Base and $19.090 billion in Bull, and normalised free cash flow lands at negative $7.700 billion, $1.910 billion and $10.341 billion.
The 740 internal missions in Base generate no Space revenue whatsoever. Assigning them a market price would inflate Space revenue by roughly $50 billion and then double-count that same value inside Starlink and orbital compute, since those engines are already credited with the capacity those missions deliver. Internal launch appears in this model as a cost advantage in the businesses that consume it, and nowhere else.
Persistent development spending is treated as a real, permanent cost. Moon and Mars programmes, next-generation vehicle work and the long tail of engineering that a company like this never stops funding are held in the segment and never capitalised into a terminal asset. Base Space carries roughly $5.4 billion of normalised maintenance capital against that development load, and the segment's negative EBITDA in 2027 and 2028 reflects exactly this.
The launch business is therefore valued as a logistics utility carrying a permanent development obligation, not as a franchise earning a strategic multiple, and it ends up a low single-digit share of enterprise value. It is the platform on which two much larger engines were built, and the value it created appears in their cash flows.
How SpaceX funds the build
The funding question is where a physically achievable plan can still fail its shareholders, and the model works through it in a fixed order.
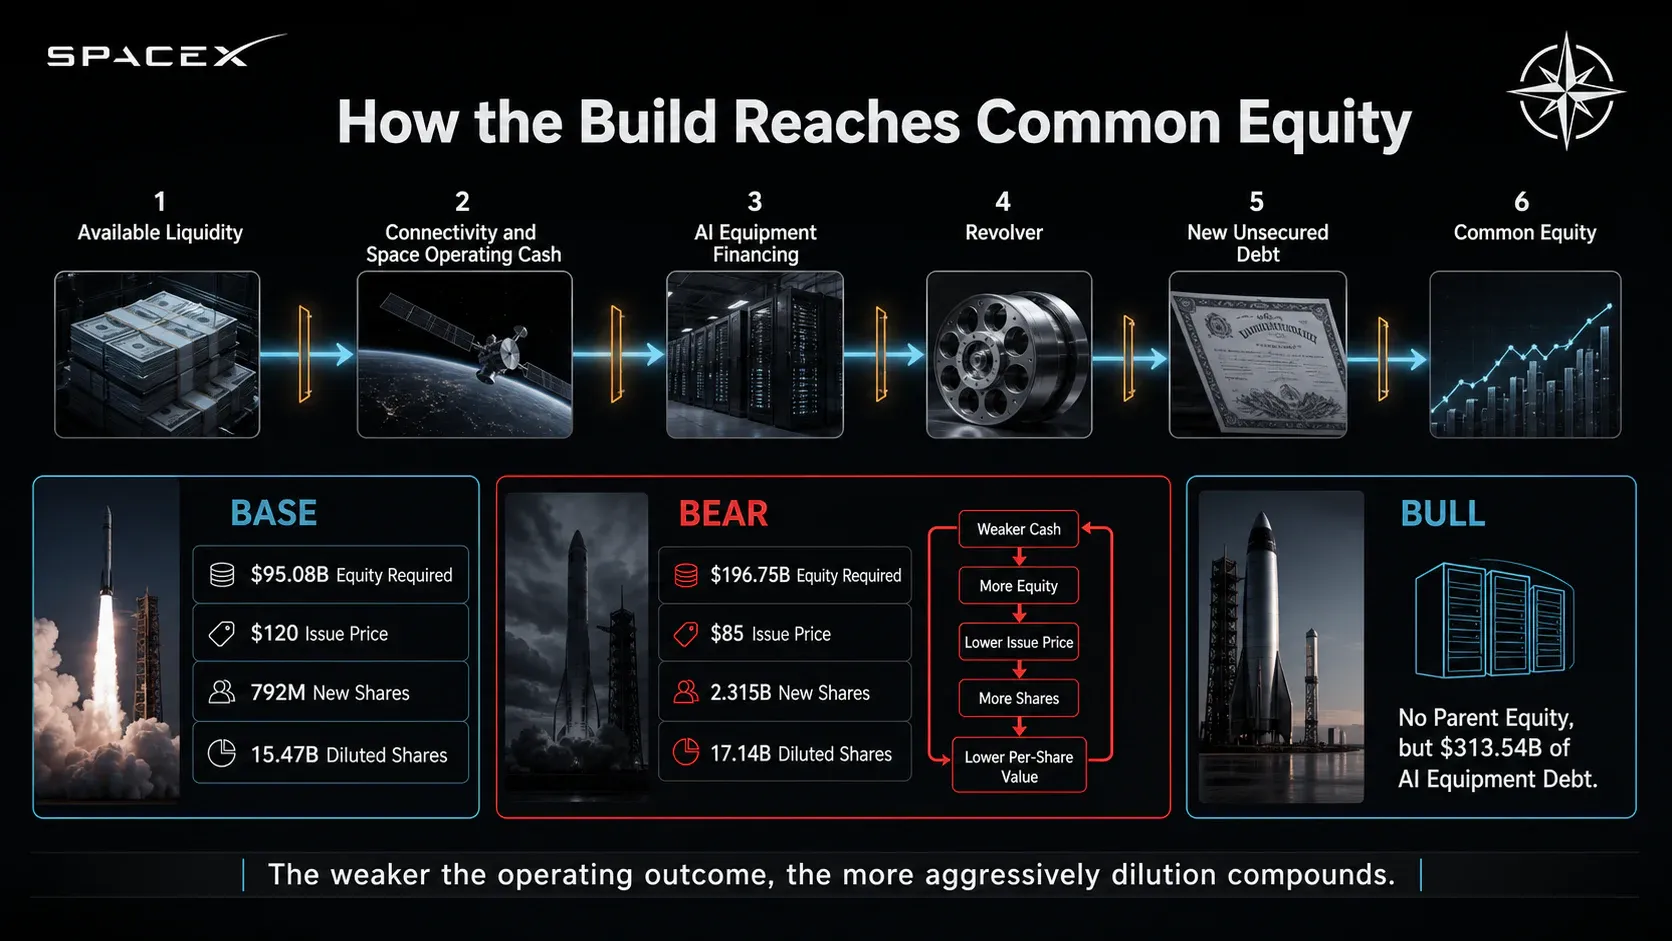
Available liquidity comes first, after minimum operating reserves and scheduled debt service. Connectivity and Space operating cash comes next. Asset-level financing against AI equipment follows. Then the revolver, then incremental unsecured debt at the parent, and common equity only as the residual claim on whatever the previous sources fail to cover.
Applied to the AI build described earlier, that waterfall produces very different outcomes across scenarios.
2030 | Bear | Base | Bull |
|---|---|---|---|
Ending cash and securities | $60.00B | $40.00B | $131.09B |
Cumulative revolver | $5.00B | $5.00B | $5.00B |
Cumulative new unsecured debt | $40.00B | $40.00B | $5.33B |
AI equipment financing debt | $77.28B | $176.17B | $313.54B |
Cumulative equity capital required | $196.75B | $95.08B | nil |
Assumed equity issue price | $85 | $120 | $165 |
Financing shares issued | 2.315B | 792M | nil |
2030 fully diluted shares | 17.14B | 15.47B | 14.54B |
Base requires roughly $95 billion of common equity across the period. That is the direct consequence of a build whose economic capital rises faster than its cash generation, and it dilutes the existing claim by about 5.4%.
The reflexivity in Bear is the more important structure. A scenario with weaker operating cash needs more equity, and a company needing more equity in a weaker environment prices it lower. At $85 per share, $196.75 billion of issuance creates 2.315 billion new shares and carries the diluted count to 17.14 billion. The equity requirement and the price at which it is met move in the same direction, so Bear per-share outcomes fall faster than Bear enterprise value does.
Bull requires no parent equity at all, since AI operating cash outgrows the funding need by 2028. It still carries $313.54 billion of AI equipment debt, and a reader who believes that quantity of asset-level financing cannot be raised on reasonable terms should treat Bull as unreachable regardless of the operating assumptions.
The credit question needs a straight answer. Whether $176 billion of AI equipment debt can be funded depends on advance rates against hardware whose collateral value steps down every generation, and on lenders' willingness to underwrite four-year assets on longer schedules. S&P's downside framing, that sustained heavy investment against slower monetisation forces additional debt and equity, describes precisely the mechanism modelled here. Financing stress in this report therefore attacks advance rates and amortisation schedules, not evidence-backed revenue density.
Everything above is the operating model, and it is complete. Physical capacity, contract economics, compute allocation, the replacement cascade, the full scenario set, Starlink demand and margin structure, the launch constraint and the funding waterfall are all on the page, with the arithmetic shown and every assumption named and sourced.
What none of it does yet is tell you what the business is worth.
The premium sections carry the judgment layer:
The valuation lens applied to each of the four engines, and why each engine earns the lens it gets.
Segment enterprise values, with the platform premium and the governance discount quantified separately, not buried inside a multiple.
The sum-of-the-parts bridge, carrying enterprise value through the 2030 balance sheet and the diluted share count to a value per share.
Bear, Base and Bull per-share outcomes with the probability weights behind them, and the answer to which scenario is actually carrying the expected return.
The Northwise return ladder: the current rating, and the specific price at which each required annual return is met.
Premium members also download the model itself. Not a summary or a PDF of outputs, but the working file behind every figure in this report, with 19 tabs, every formula visible and every assumption editable. Change the density path, the frontier GPU life, the Starlink margin buckets, the equipment financing share or the equity issue price, and the per-share outcome recalculates in front of you. Our numbers are the starting point for your own work, and disagreeing with us is a feature.
We gate that work and not the model above it, on purpose. Reconstructing the physical build is work any patient reader could check against the filings, and we would rather it be checked. Deciding what 23 gigawatts of compute, a 70 million subscriber network and 900 launches a year are worth to a shareholder, after replacement capital, financing and dilution have taken their share, is the work we are paid for.
The free sections establish what SpaceX is building and what it will cost. What follows establishes whether the price already reflects it.
Northwise Premium
Choose how to continue with Northwise
Join Northwise Premium
Unlock the rest of this report, its complete valuation, the downloadable model, portfolios, and action framework.
Join Northwise PremiumCreate a Free Account
Continue across Free Northwise research, follow companies, save reports, and receive updates.
Create a Free Account
NVDA Stock Forecast 2030: Where the Next Wave of Growth Comes From
NVDA stock forecast 2030: examine AI demand, competition, cash flow and financing risk, with Premium valuation scenarios and an editable NVIDIA model.
ASTS Stock Forecast 2030: The Capacity Behind the Coverage
ASTS stock forecast 2030: explore AST SpaceMobile capacity, carrier economics, financing and competition, with Premium scenarios and an editable model.

Celsius Stock Analysis: The Shelf Reset and the Second Growth Curve
Celsius stock analysis of the shelf reset, Alani growth, Pepsi economics and cash flow, with a 2030 model and a Premium valuation and entry-price framework.
Northwise Portfolios
See how the research becomes real decisions
Reader discussion
Discuss the research
Premium access is required to join this report's discussion.
Join Northwise Premium
No comments yet. Start a thoughtful discussion.