
ASTS Stock Forecast 2030: The Capacity Behind the Coverage
ASTS stock forecast 2030: explore AST SpaceMobile capacity, carrier economics, financing and competition, with Premium scenarios and an editable model.
In this article
AST SpaceMobile is building a network in orbit that ordinary phones can use directly. We walk through the technology, the evidence behind it, the competitors closing in, and the carrier partnerships that fund it, then ask how much of that future the share price already holds.
Two views of the same network
Two brokers looked at AST SpaceMobile this week and reached opposite conclusions. Deutsche Bank upgraded it to Buy on October 12. Piper Sandler cut it to Neutral the next day, citing competitive and launch risks. The selling continued the following day: ASTS closed at $42.14 on October 14. For this report and its model, we use the October 15 premarket price of $40.64 at 7:22 a.m. EDT. That is a dated reference, not a continuously updating quote.
The split is a fair summary of where AST sits. Bulls see a company with very large antennas in low Earth orbit, more than 60 mobile operator partnerships, and financing to support the next stage of deployment. Bears see a capital-hungry network that has yet to demonstrate a scaled, paying consumer service, facing rivals with deep resources and increasingly valuable spectrum.
Both camps are looking at real evidence. Our aim here is to lay that evidence out in order, from the physics of the antenna to the terms carriers sign, and to show where each piece pushes the investment case. This forecast builds on our earlier AST SpaceMobile stock analysis; the AST SpaceMobile company page holds the research history and current model.
Our view, developed through the sections below, is that AST's technical lead is real and its commercial position is stronger than the recent selloff implies. The harder question is how much of the network's capacity it can sell, and at what price, once a second large supplier is in the market.
The problem AST is built to solve
Mobile networks stop where towers stop. Building and powering a tower is a fixed cost, and in mountains, deserts, farmland, coastal waters and much of the developing world there are too few customers per square mile to pay it back. The result is a patchwork of dead zones that every carrier knows about and none can close profitably on the ground.
Satellites change that arithmetic. One satellite passing overhead can serve an area that would take hundreds of towers to cover, and the same network that fills rural gaps also keeps phones connected when hurricanes, wildfires or floods knock terrestrial sites offline.
For years the catch was the phone. Satellite phones needed special handsets with bulky antennas, which kept the market small and expensive. AST's founding bet, made in 2017, was that the antenna could move from the handset to the satellite, letting the billions of phones already in pockets connect to space without any change.
The industry has since moved toward that idea. On October 1, AT&T, T-Mobile and Verizon announced their joint venture to support coverage in underserved U.S. areas, including satellite connectivity. The three largest U.S. carriers organizing around the problem is a meaningful demand signal, although the venture does not guarantee AST an award.
How the network works, end to end
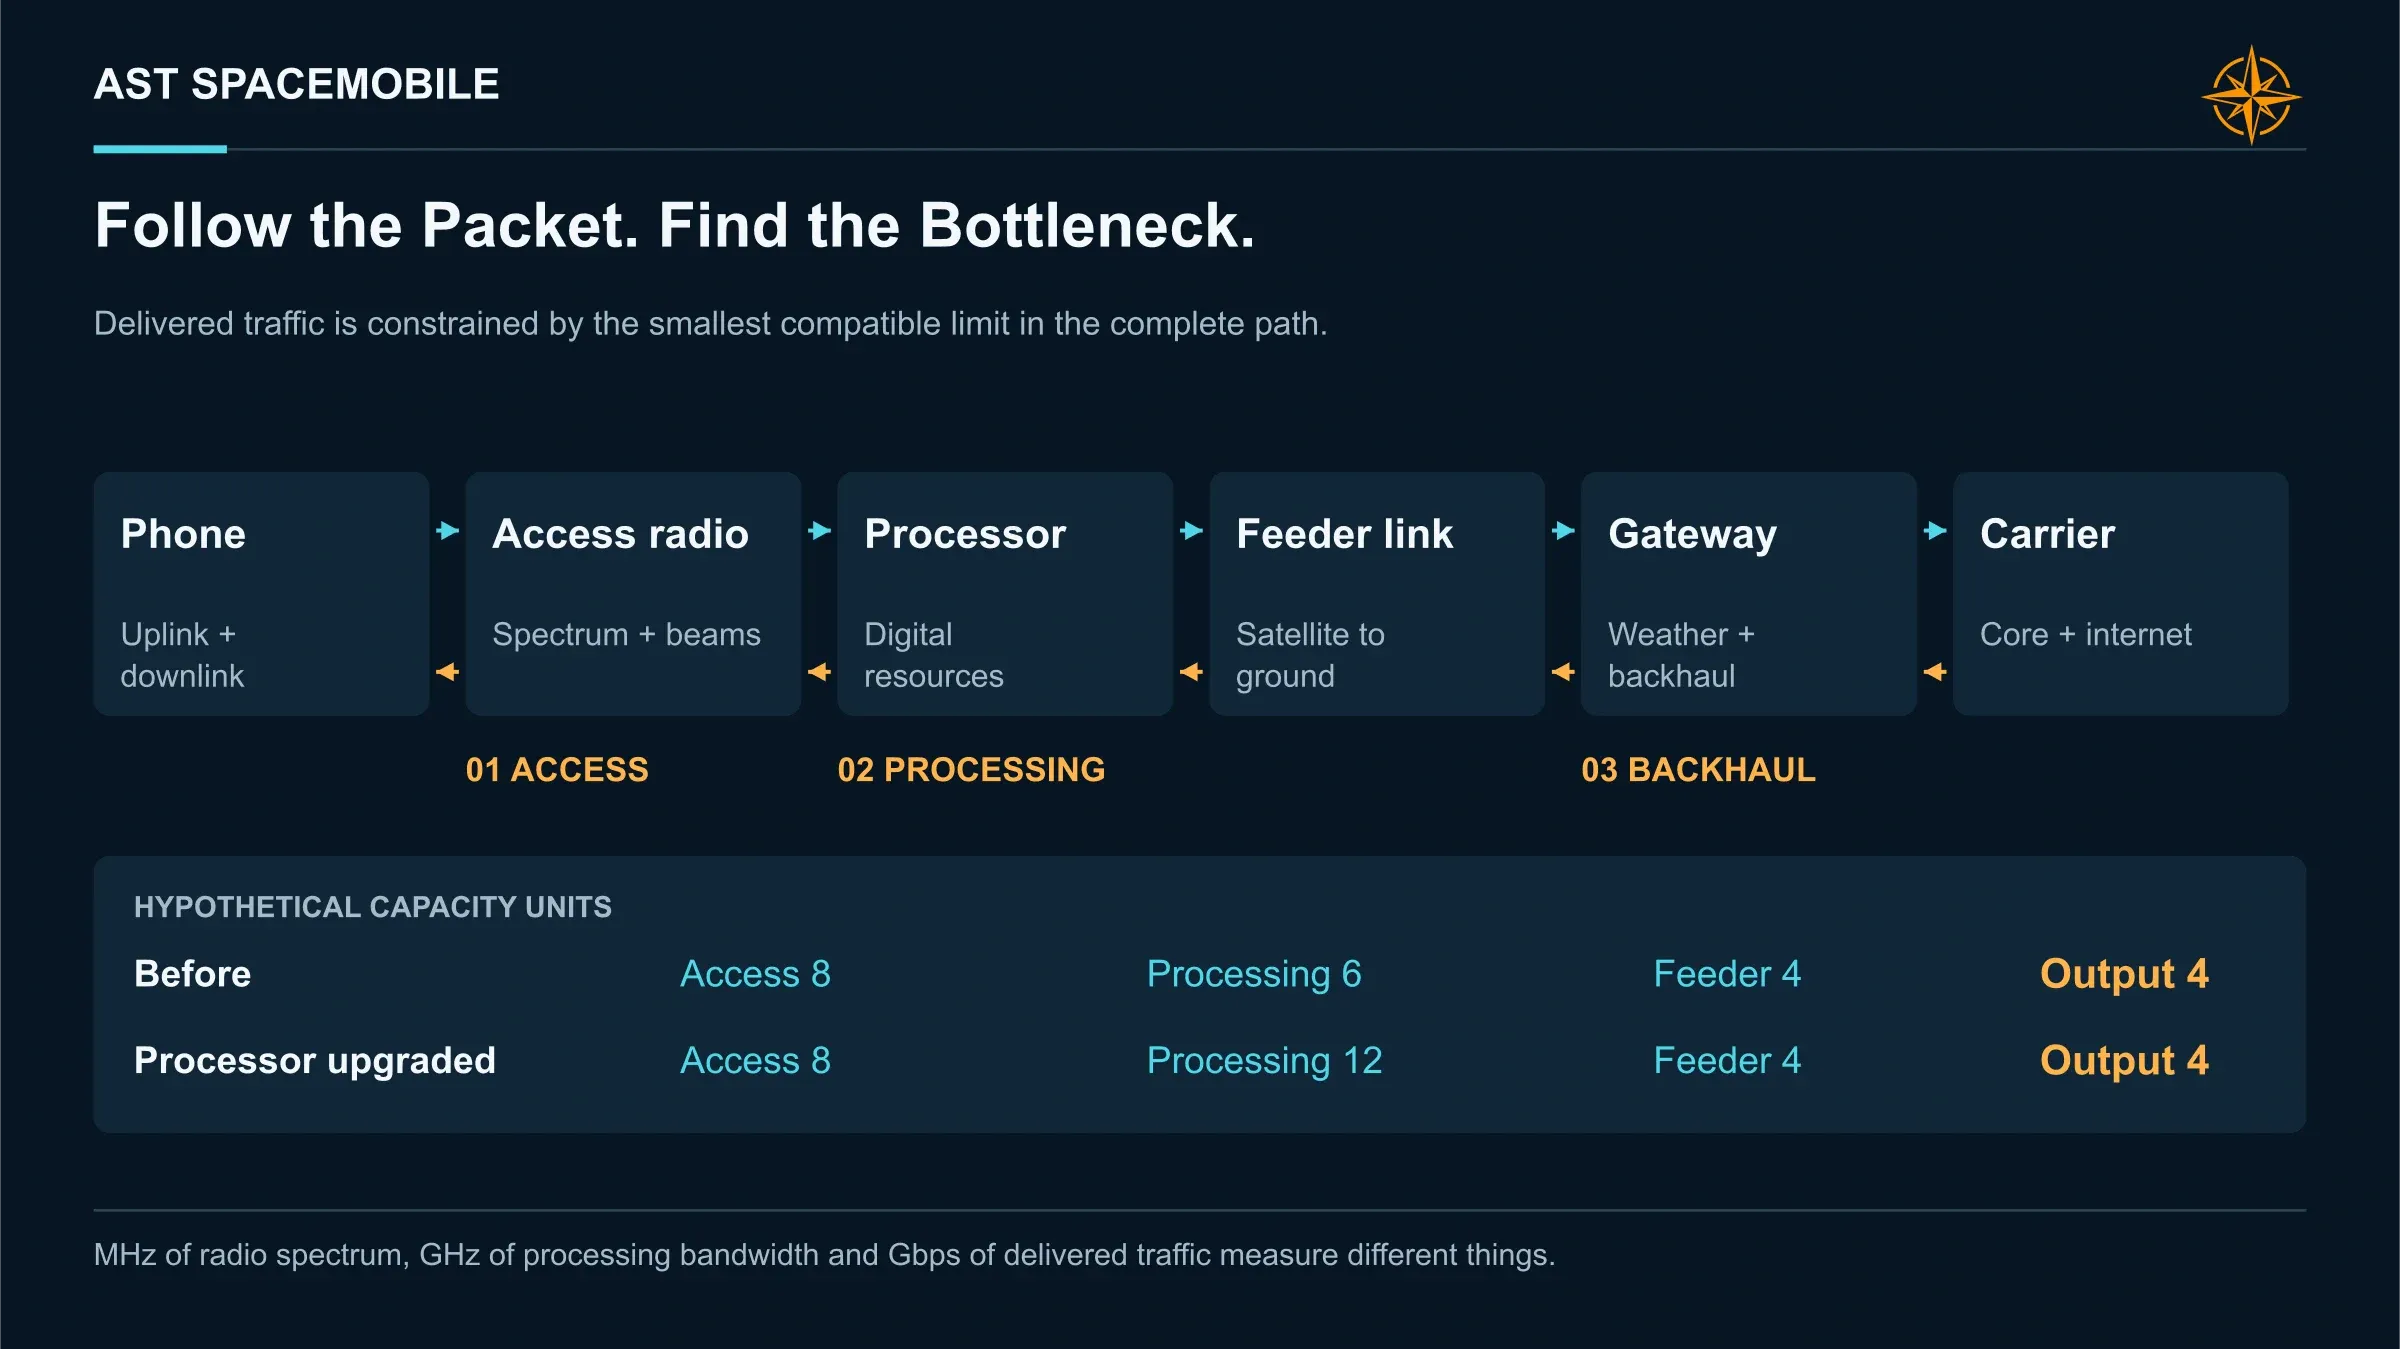
A call over AST's network follows 4 steps. A phone that loses its tower signal reaches up to a BlueBird satellite passing a few hundred miles overhead, using the same carrier spectrum it uses on the ground. The satellite's large antenna picks out that faint signal and relays it down to a gateway, a ground station connected to the internet backbone.
The gateway and ground network perform essential signal and network processing. A fast-moving satellite introduces changing propagation delay and frequency shift. AST compensates for these effects so a compatible ordinary phone can remain connected; it cannot remove the physical travel time of the radio signal. The company reports nearly 50 gateways in various stages of planning, installation and completion.
From the gateway, traffic flows into the partner carrier's core network. To the carrier, AST behaves like a very large cell tower in the sky. The customer keeps their phone, number and plan, and the carrier keeps the billing relationship.
That design shapes the business model. AST sells capacity through carriers, which retain the retail billing relationship. This reduces AST's need to build a consumer distribution and billing operation. Its wholesale prices are negotiated with a relatively small number of large, sophisticated buyers.
The technology stack, layer by layer
AST's system has 5 layers, and each has its own constraint. The constraints matter more than the headline specs, since revenue depends on whichever layer runs out first.
The antenna
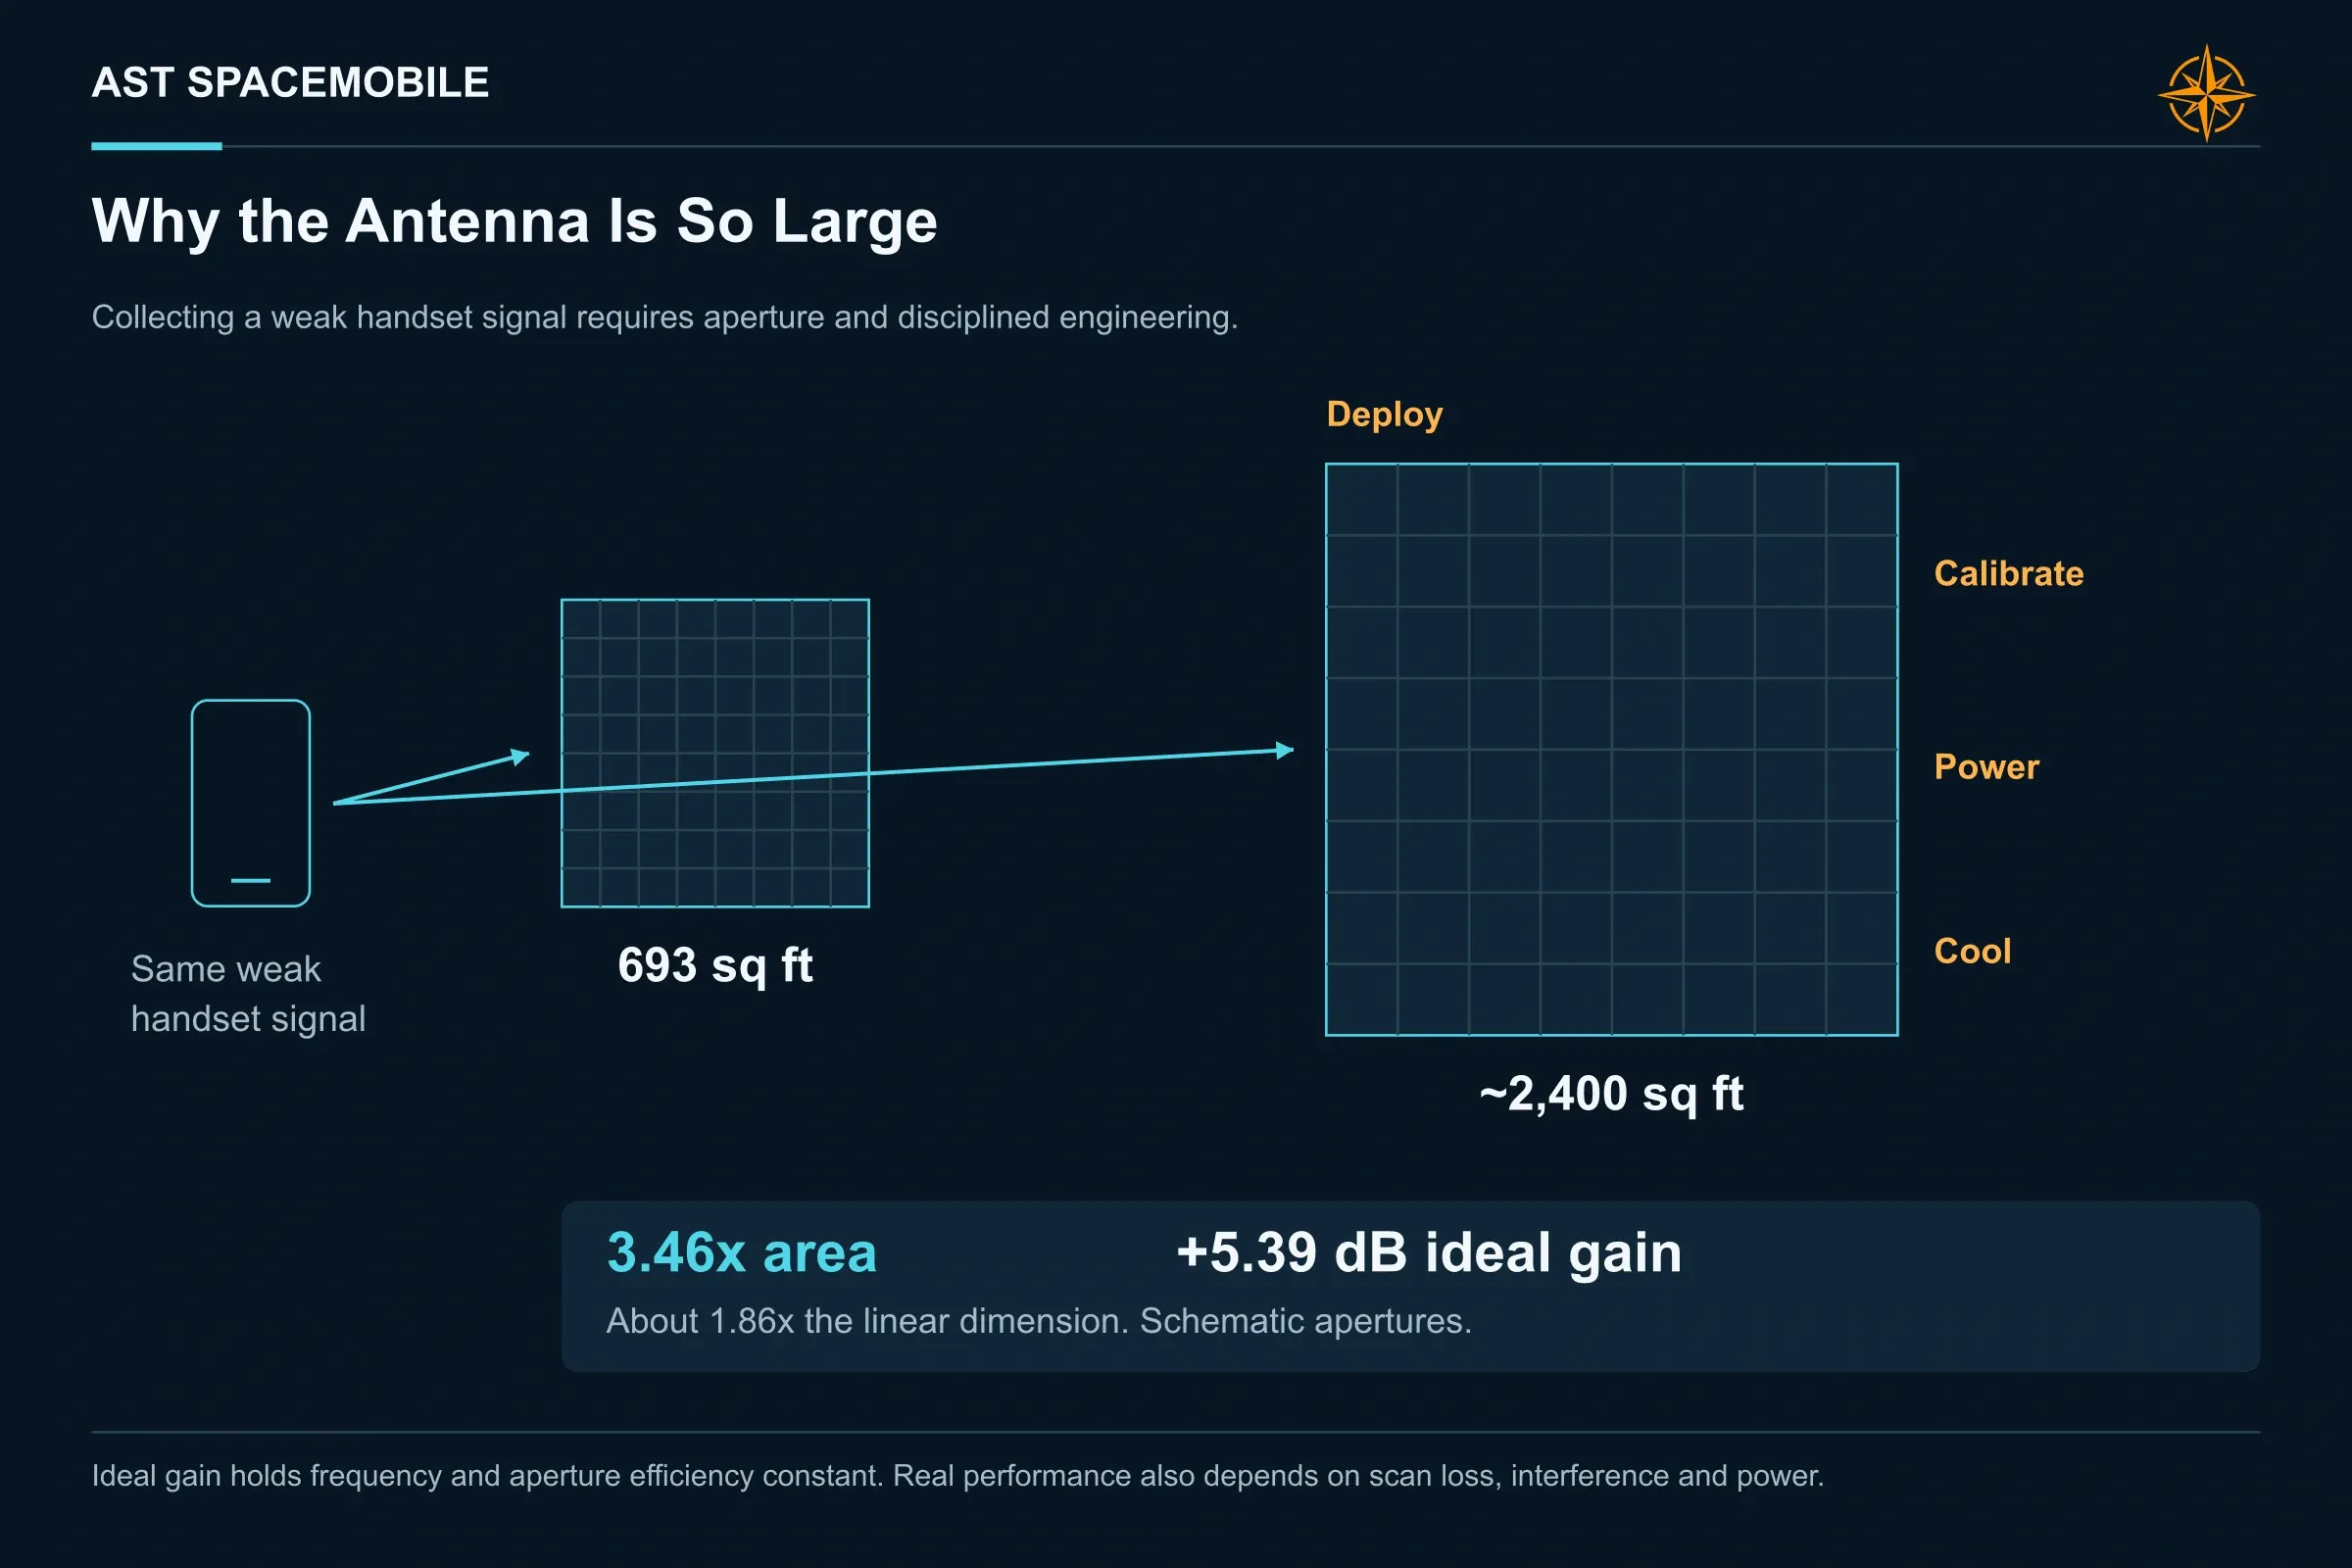
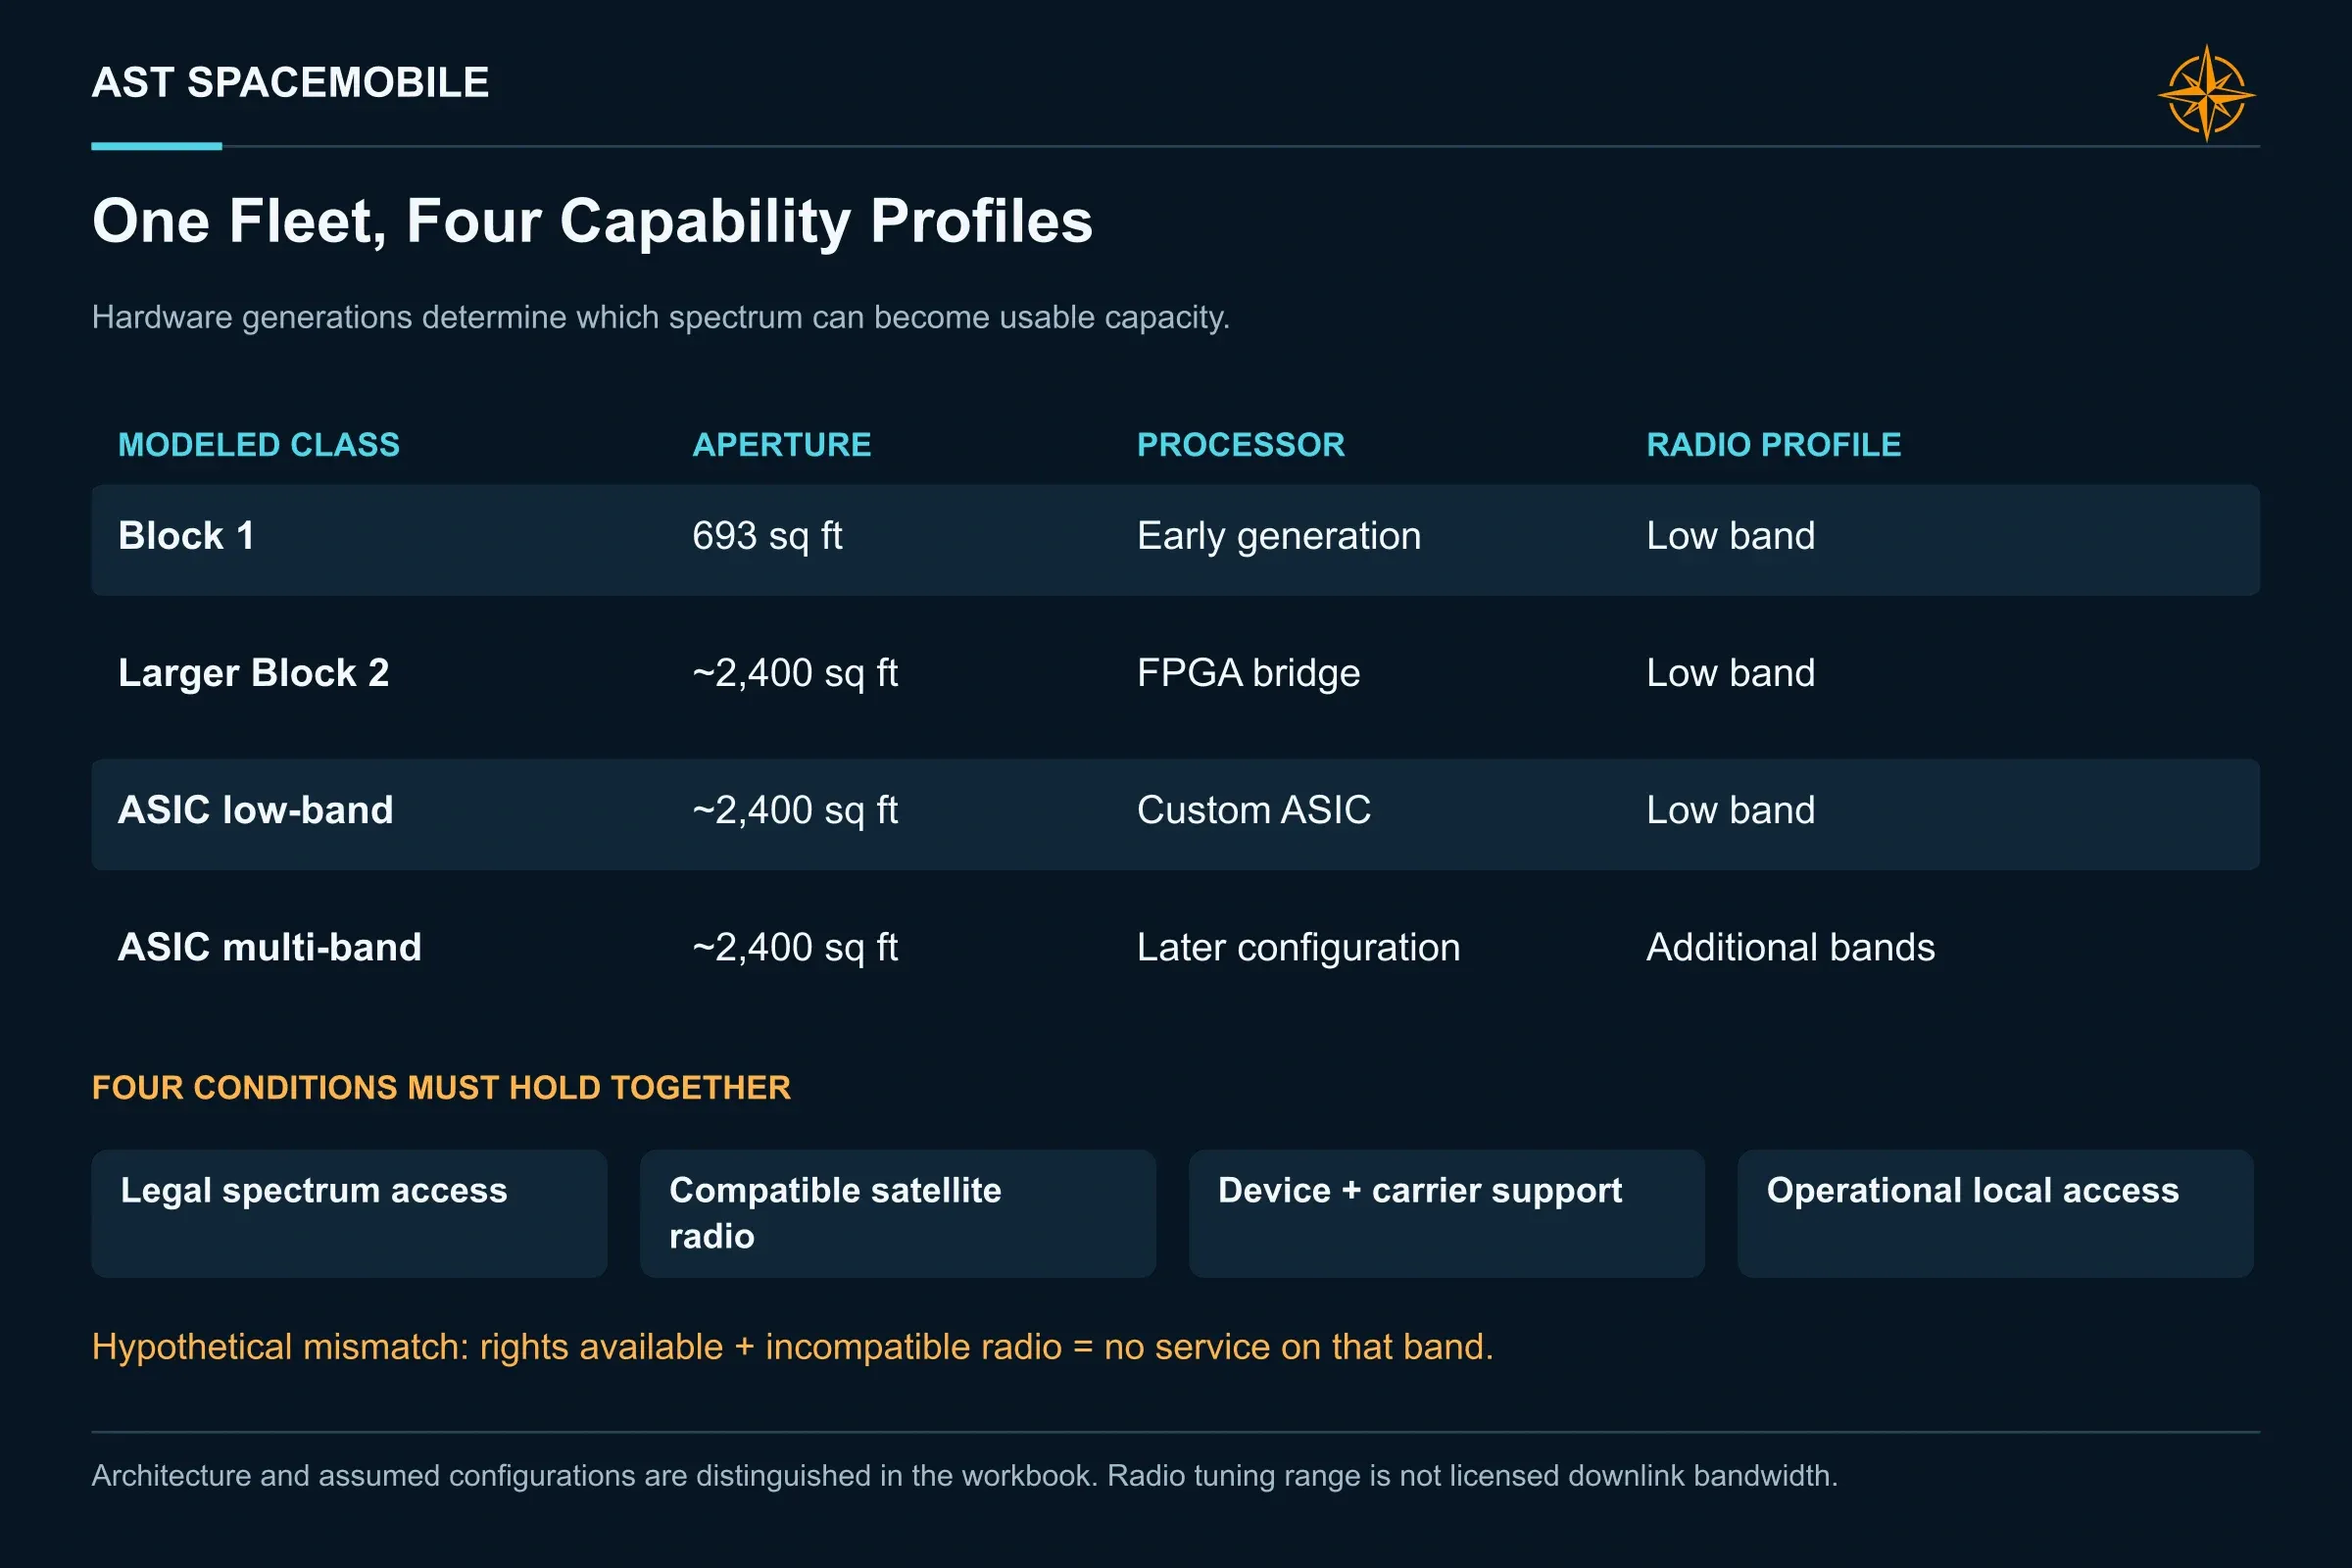
Phones transmit at very low power, so a satellite hundreds of miles away has to collect an extremely faint signal. AST's answer is size. Its 2022 test satellite, BlueWalker 3, proved the concept, and the 5 Block 1 BlueBirds launched in September 2024 each carry a 693 square foot phased array.
The Block 2 BlueBirds unfold to nearly 2,400 square feet, about 3.46 times the area of the early 693-square-foot arrays. At the same frequency and aperture efficiency, the ideal gain improvement is about 5.39 decibels. That can improve the link budget, but does not by itself prove indoor coverage or loaded throughput. A phased array also steers its beams electronically; a coverage-cell count is not a count of beams carrying peak traffic simultaneously.
The processor
Every one of those cells has to be computed on board. AST designed a custom chip, the AST5000, which entered production tape-out with TSMC in 2024 and gives each Block 2 satellite up to 10 GHz of processing bandwidth. The earliest Block 2 satellites were designed to carry programmable FPGA chips as a bridge until the custom chip is qualified, so the fleet arrives in generations with different capability.
In its second-quarter update, AST said it had demonstrated nearly 100 Mbps on a Block 1 BlueBird and expected Block 2 peak rates approaching 200 Mbps. Demonstrated and expected peaks remain different evidence categories. Neither establishes sustained capacity when many users and cells compete for the same satellite resources.
The spectrum
The radio waves themselves are the scarcest input. AST's base layer is borrowed: it uses its carrier partners' low-band spectrum, the same frequencies phones already use, and the satellites can tune across roughly 1,150 MHz of low and mid-band frequencies worldwide.
On top of that, AST has been assembling additional spectrum access. The Ligado arrangements cover up to 45 MHz in the U.S. and Canada, including up to 40 MHz of L-band and a separate 5 MHz block. The June filing describes $550M of contingent consideration, at least $80M of annual L-band payments, additional obligations and remaining closing conditions. AST also acquired international priority rights associated with 60 MHz of S-band spectrum. Rights and regulatory priority still require compatible hardware, local approvals and device support.
Satellites built for mid-band frequencies begin production late this year, with launches from early 2027, and a third-generation chip is in development for L-band, satellite and C-band spectrum.
The ground network
Gateways set a ceiling on how much traffic can flow between orbit and the internet, and they need local permits in every country. AST has about 50 in progress, has more than 3,000 of a planned 5,600 U.S. low-band network cells in place, and is building a sovereign operations center in Europe with Vodafone.
Manufacturing and launch
AST builds most of the satellite itself, from more than 500,000 square feet of facilities with a planned 400,000 square foot expansion in Midland, Texas. It targets 6 finished satellites a month and estimates an average cost of $21M to $23M per satellite including launch once the fleet passes 90.
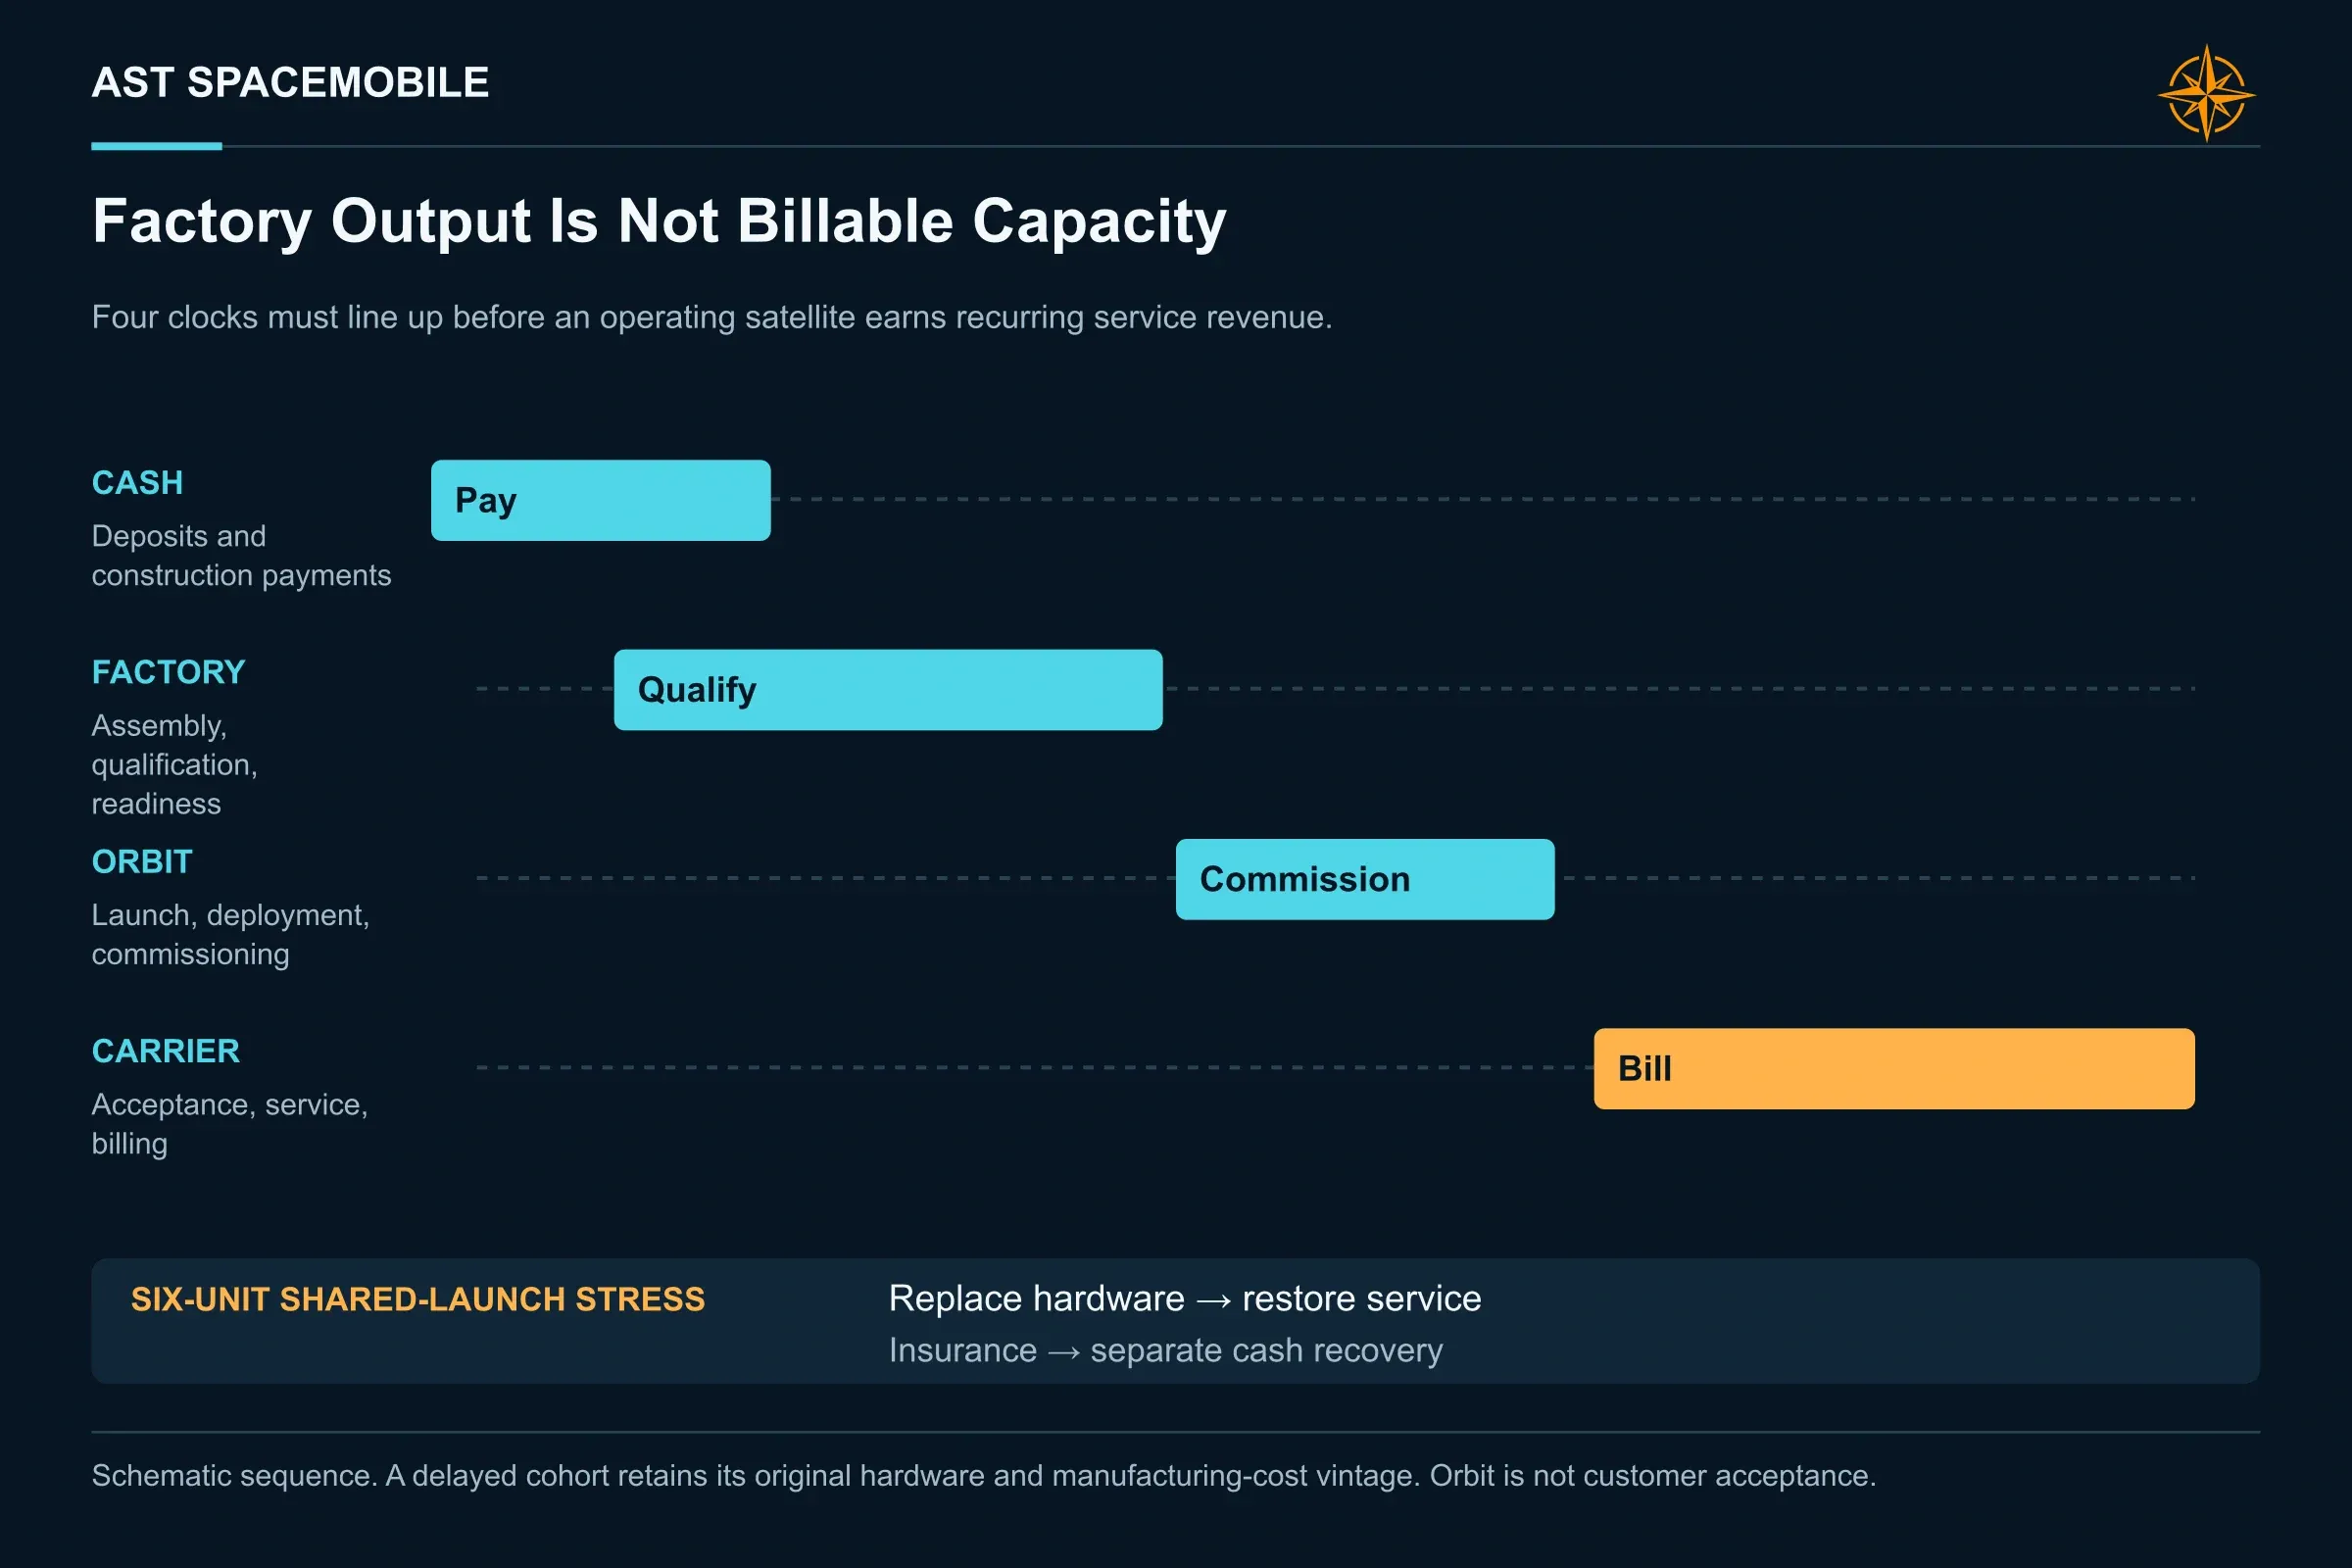
Launch has been a bottleneck. BlueBird 6 flew from India in December 2025. BlueBird 7 reached an off-nominal orbit on New Glenn in April 2026 and was lost. BlueBirds 8 through 13 then launched on Falcon 9 missions in June and August. Qualification, launch, deployment and commissioning each take time, and none alone establishes that a satellite is generating recurring carrier revenue.
Generation | Array size | Processing | Status |
|---|---|---|---|
BlueWalker 3 (test) | Test array | Early prototype | Launched 2022; proved phone-to-satellite calls |
Block 1 BlueBirds 1 to 5 | 693 sq ft | First generation | In orbit since September 2024 |
Block 2, early units | ~2,400 sq ft | FPGA bridge | Launching through 2026 |
Block 2, AST5000 | ~2,400 sq ft | Custom ASIC, up to 10 GHz | Ramping with production |
Mid-band and next chip | Separate arrays per band | Third-generation ASIC | Production from late 2026 |
What the evidence proves, and what it leaves open
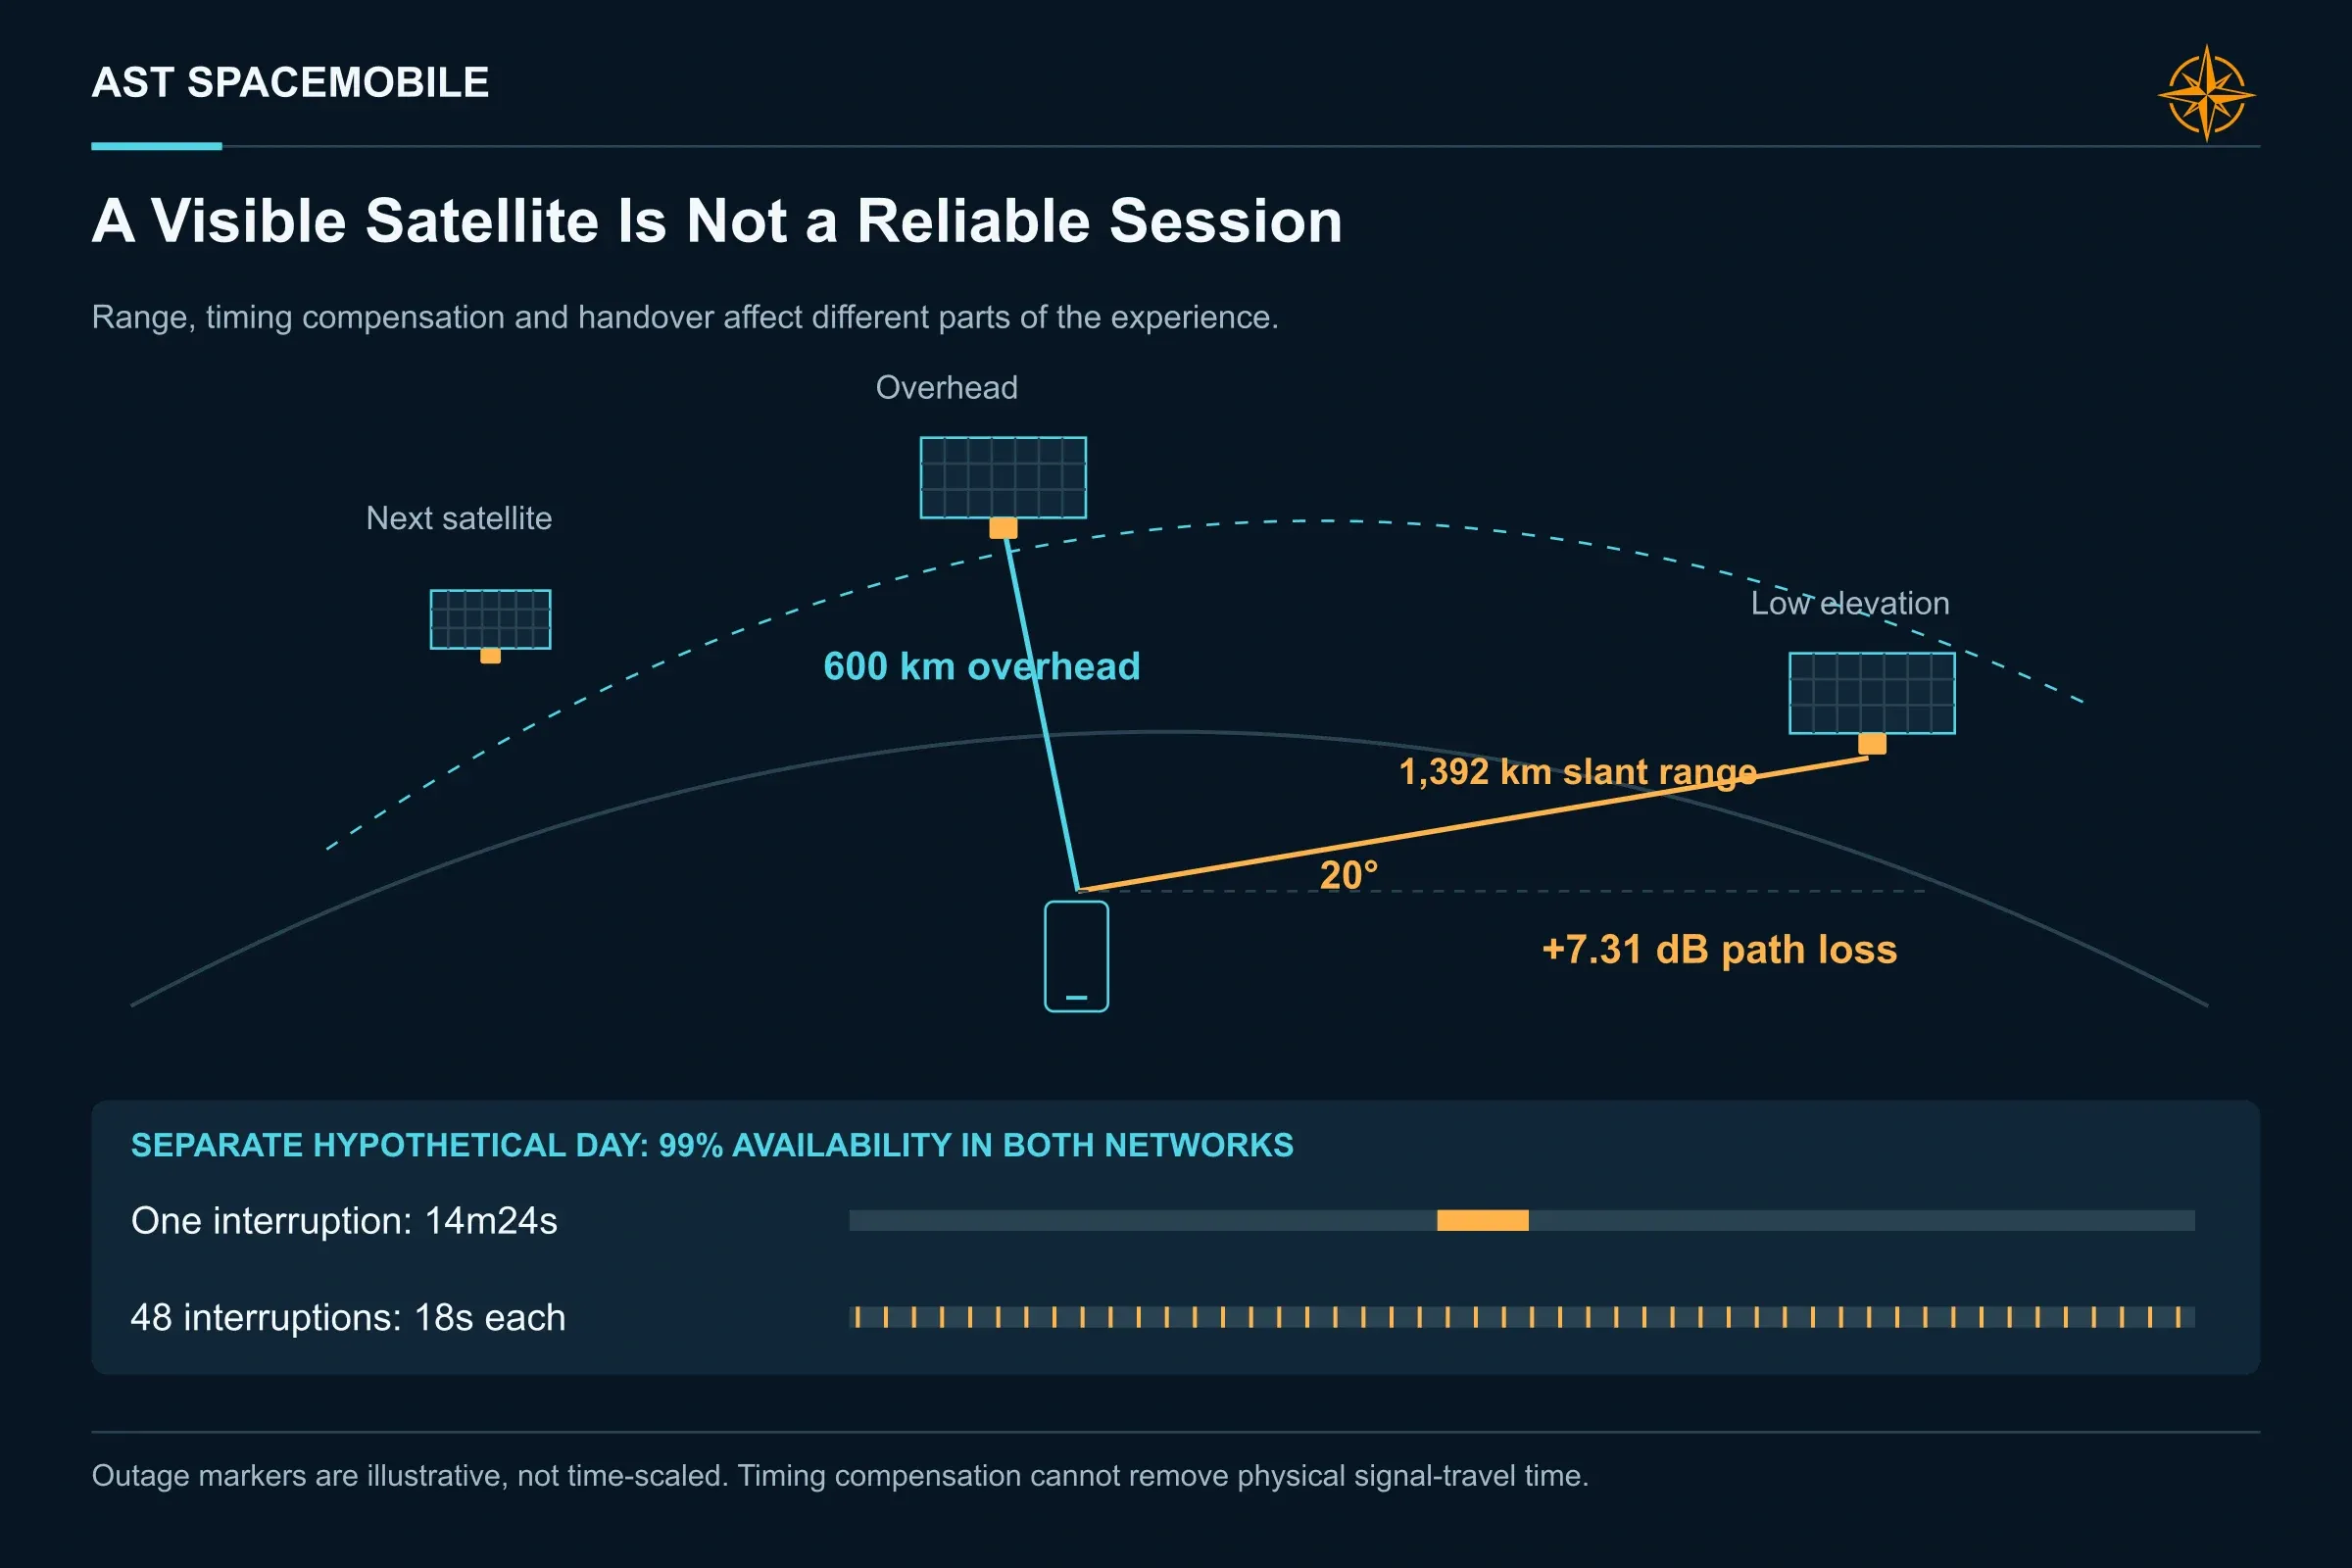
AST has cleared the hardest test a skeptic could set 5 years ago. In 2023 BlueWalker 3 carried what AST described as the first two-way voice call from space to unmodified smartphones. In January 2025 Vodafone made a video call over a BlueBird from a part of rural Wales with no mobile masts, and in February 2025 Verizon completed a live video call between a satellite-connected phone and a terrestrial one under an FCC test approval.
The hardware is also scaling. AST reported 13 spacecraft in orbit and roughly 20,000 square feet of combined aperture in August, with BlueBirds 17 through 46 in production and assembly. Those are company-reported milestones, not a count of commercially accepted, continuously revenue-producing satellites. Carrier investment and the stc prepayment demonstrate financial commitment, while large-scale service economics remain to be established.
What remains unproven is equally specific. Nobody outside the company has seen how a fully loaded satellite performs at 6 p.m. over a busy region, how service holds up as the network grows from demonstration to millions of users, how long Block 2 satellites last in orbit, or what carriers will pay per line once service is commercial. Continuous coverage of the U.S., Europe and Japan needs roughly 45 satellites, which the company targets for early 2027.
Those gaps shaped our model directly. We use the aperture calculation as a physical reference, while allowing for real-world constraints that ideal geometry cannot resolve. Usable capacity is built region by region, capped by access, processing and gateway resources, with headroom reserved for busy-hour conditions. The result is a planning estimate that operating data can revise.
The comparison with SpaceX helps frame the question. A crowdsourced study of Starlink direct-to-cell radio access examined early service on a narrow carrier-spectrum allocation. Its findings describe that tested configuration and period. They cannot establish the relative performance of AST and SpaceX fleets that have not yet been deployed and measured under comparable conditions.
AST's large aperture is a meaningful design choice for receiving a weak phone signal. SpaceX is also changing its hardware and spectrum resources, which is why competition must be assessed by service generation and date.
A market splitting into lanes
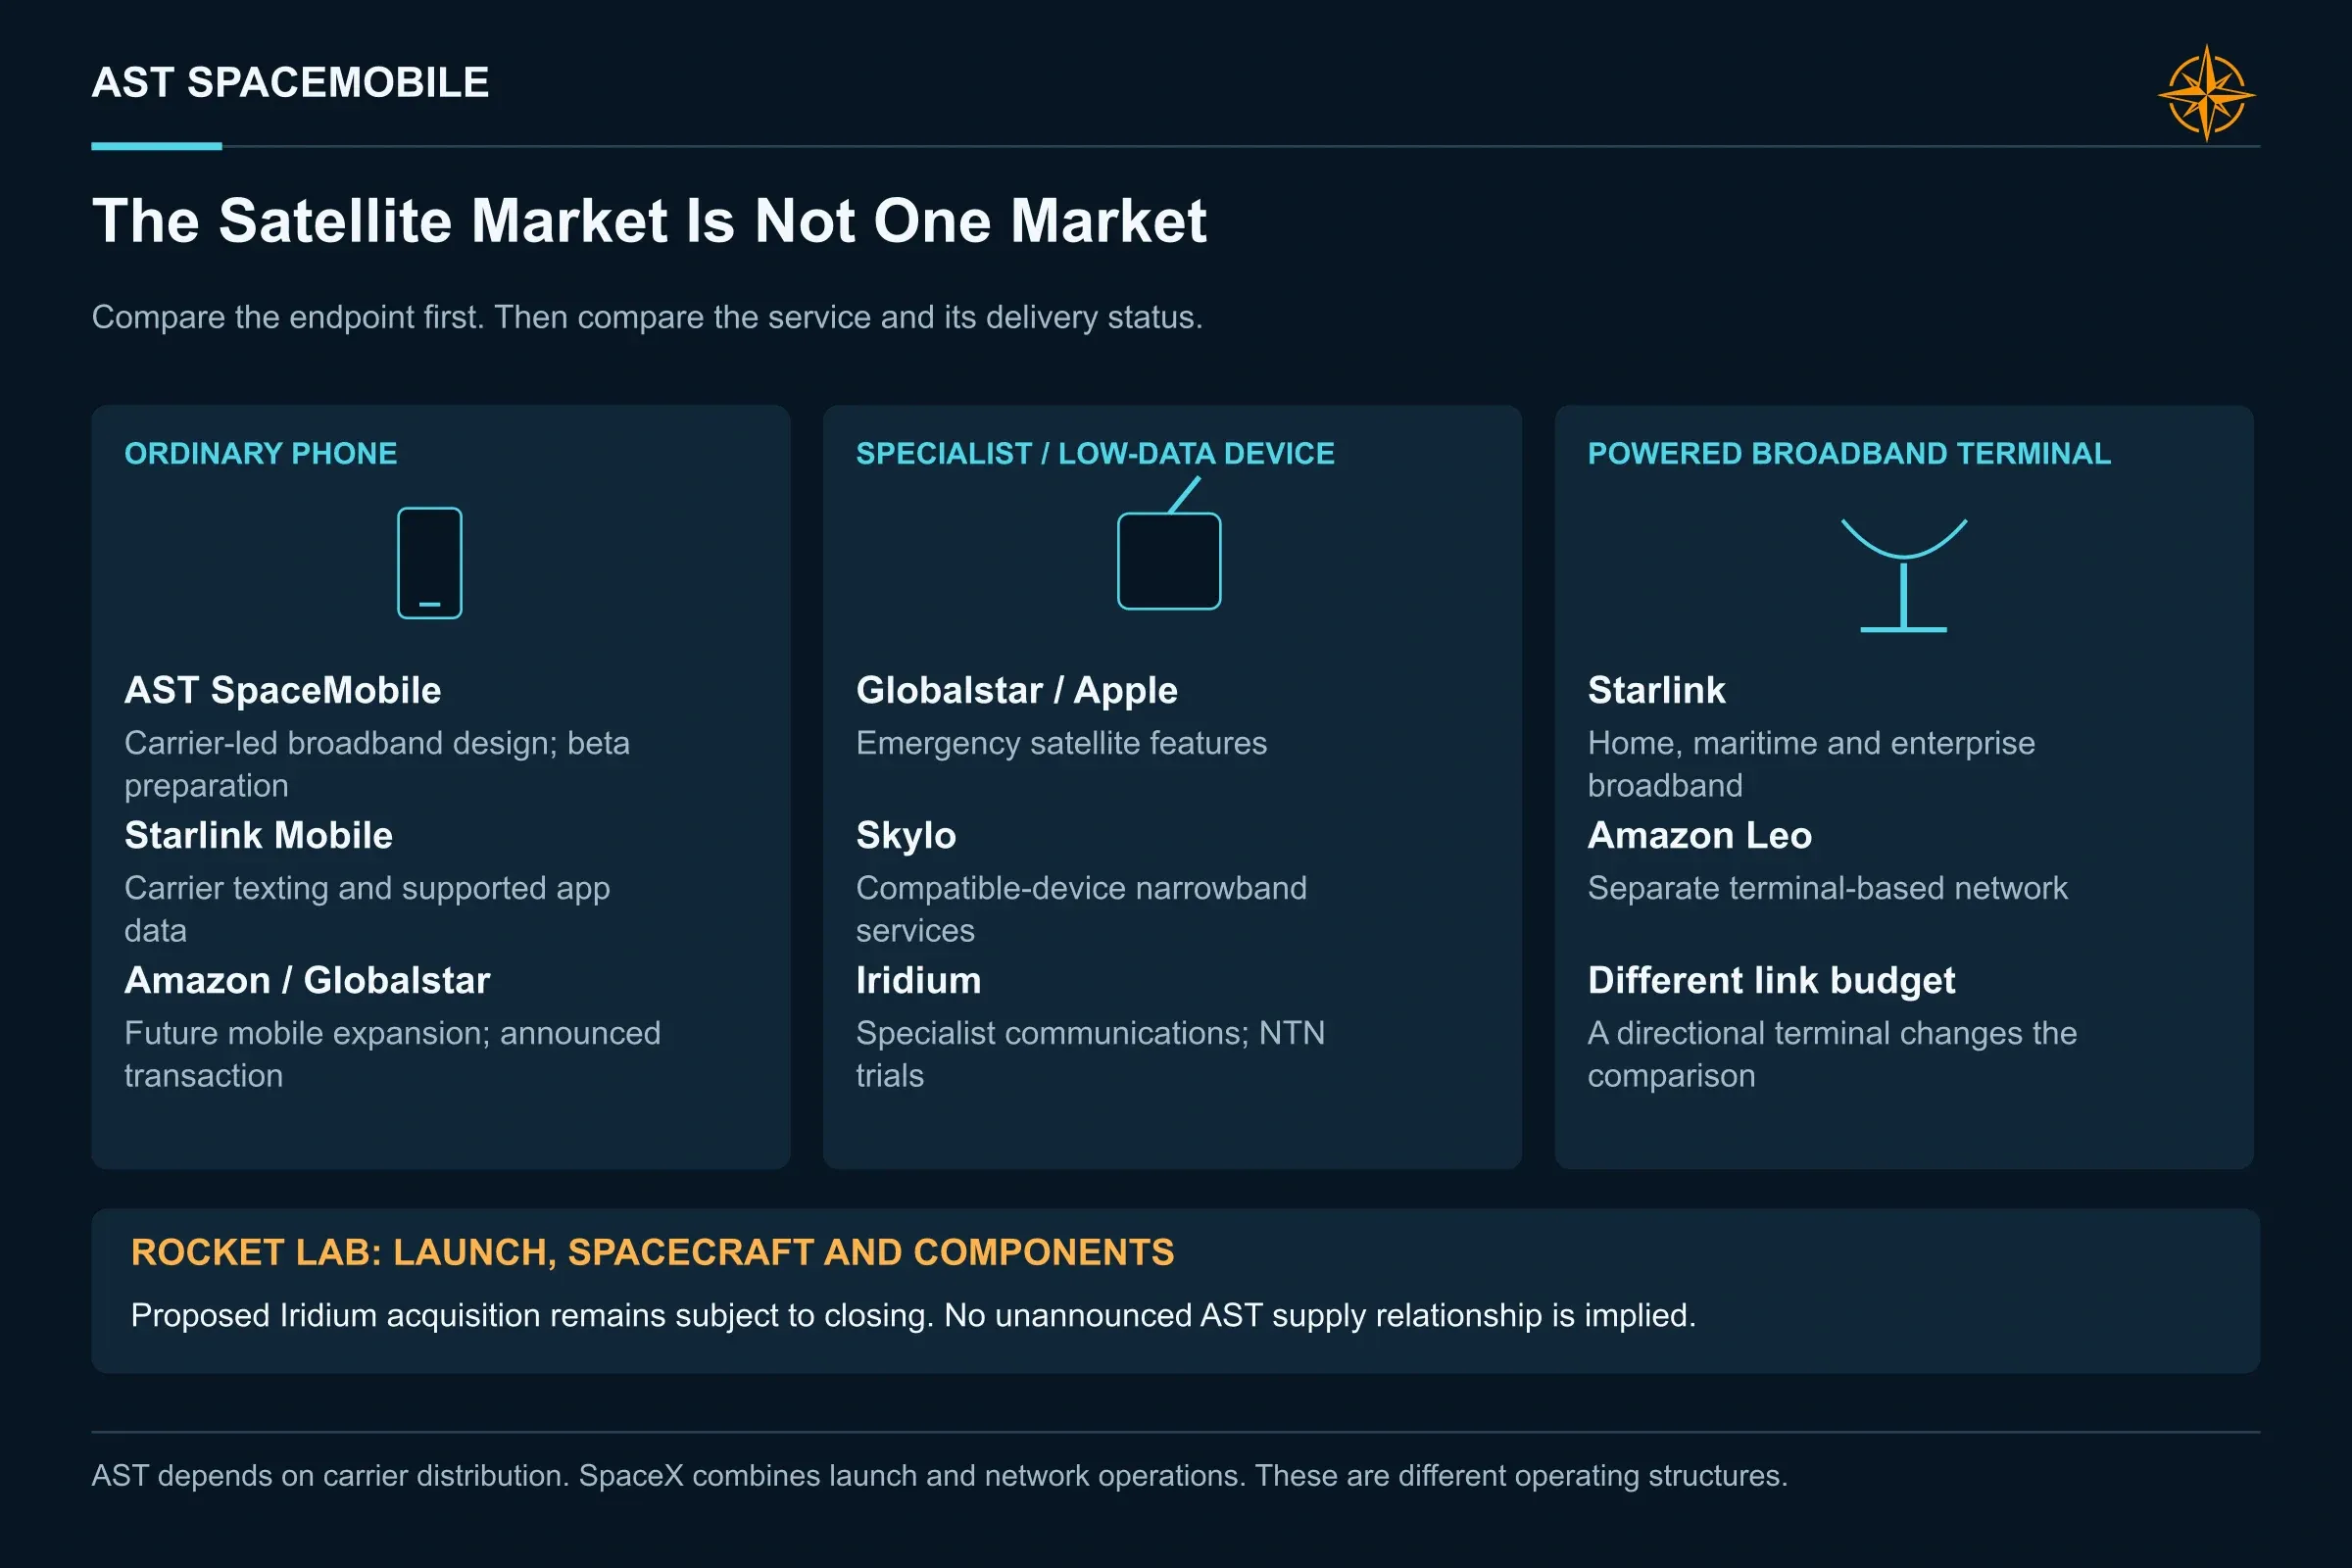
Satellite-to-phone service divides into 4 distinct lanes, separated by what the phone can do and who owns the customer.
Lane | What the user gets | Main players | Spectrum position |
|---|---|---|---|
Emergency messaging and IoT | SOS, short texts, tracking | Apple with Globalstar (Amazon acquisition announced), Skylo, Iridium NTN Direct | Dedicated satellite bands |
Carrier texting and app data | Texts, light app data | SpaceX with T-Mobile; Boost via EchoStar deal | Carrier spectrum; expanded licensed spectrum for future service |
Broadband to unmodified phones | Voice, video, full data through the home carrier | AST, with SpaceX's next generation aiming here | Partner low-band plus AST L-band and S-band |
Dish and terminal broadband | Home, maritime, enterprise internet | Starlink, Amazon Leo | Dedicated satellite bands |
The first lane is the most mature. Apple's Emergency SOS has run on Globalstar since the iPhone 14, Skylo provides narrowband satellite messaging to Android devices, and Iridium began on-air trials of its NTN Direct messaging service this year. These services carry very little data and serve a different need from AST's.
The second lane is where AST faces a live competitor. T-Mobile launched T-Satellite texting in July 2025 and subsequently added data for supported applications. SpaceX reported deploying more than 650 first-generation direct-to-cell satellites. Device compatibility, supported services and coverage conditions matter as much as constellation size.
The past 13 months have reorganized the field around spectrum and network ownership. SpaceX agreed to buy EchoStar spectrum in 2025, and the expanded agreement added AWS-3 licenses. Amazon announced its Globalstar acquisition and a planned direct-to-device deployment from 2028. Rocket Lab agreed to acquire Iridium, whose shareholders approved the transaction in September; closing was still expected by mid-2027, subject to conditions.
The pattern is broader control of the infrastructure and customer relationship. SpaceX combines launch, spacecraft, spectrum and a consumer distribution platform. Amazon combines network development, distribution and financial resources, but Blue Origin is a separate company and launch contracts are not the same as owning a rocket business. AST builds much of its own spacecraft and depends on outside launch providers and carrier distribution.
What AST offers carriers is a wholesale partner whose commercial model depends on those carriers distributing the service. Carriers have reasons to retain more than one viable supplier. That gives AST a strategic role, but it does not guarantee attractive wholesale terms or prevent rivals from winning the same budgets.
The joint venture could also strengthen buyer bargaining power if carriers coordinate procurement. We treat that as a commercial risk to test, rather than assuming that all capacity purchases have already been combined into one contract.
The partners who pay for the build
AST reports more than 60 mobile operator partners serving over 3B subscribers. Among those named are AT&T, Verizon, Vodafone, Rakuten, stc, Bell Canada and Telus. Those agreements range from memoranda of understanding to definitive commercial contracts with prepayments, and investors should weigh them by what has been signed and funded.
The deepest relationships follow the money. AT&T, Verizon and Vodafone are investors as well as customers, alongside Google, Rakuten and American Tower. In Europe, AST and Vodafone own a joint venture, Satellite Connect Europe, based in Luxembourg, which plans 5 European ground stations and has named VodafoneThree as its first UK customer for trials.
The stc agreement shows what a full commercial contract can look like: a 10-year term across Saudi Arabia and regional markets, backed by a $175M prepayment. In Japan, a Rakuten and AST venture received a preliminary selection under a government program worth up to roughly $1B, still subject to approvals and final agreements.
AST reported about $1.3B of aggregate commercial backlog and U.S. government awards in its August update, including more than $125M of government awards. Management sees a larger opportunity. We model the government contribution separately and exclude unsigned program ceilings from the revenue forecast.
From satellites to sellable capacity
A video call proves the link works. It says little about how many phones can share a satellite at 6 p.m. over a busy suburb, which is the number revenue depends on.
We estimate capacity separately for each hardware generation and each region. Usable downlink is limited by whichever of 3 ceilings binds first: the radio link to handsets, onboard processing, and the gateway connection back to the ground. Headroom is then reserved for busy-hour peaks, weather and government traffic.
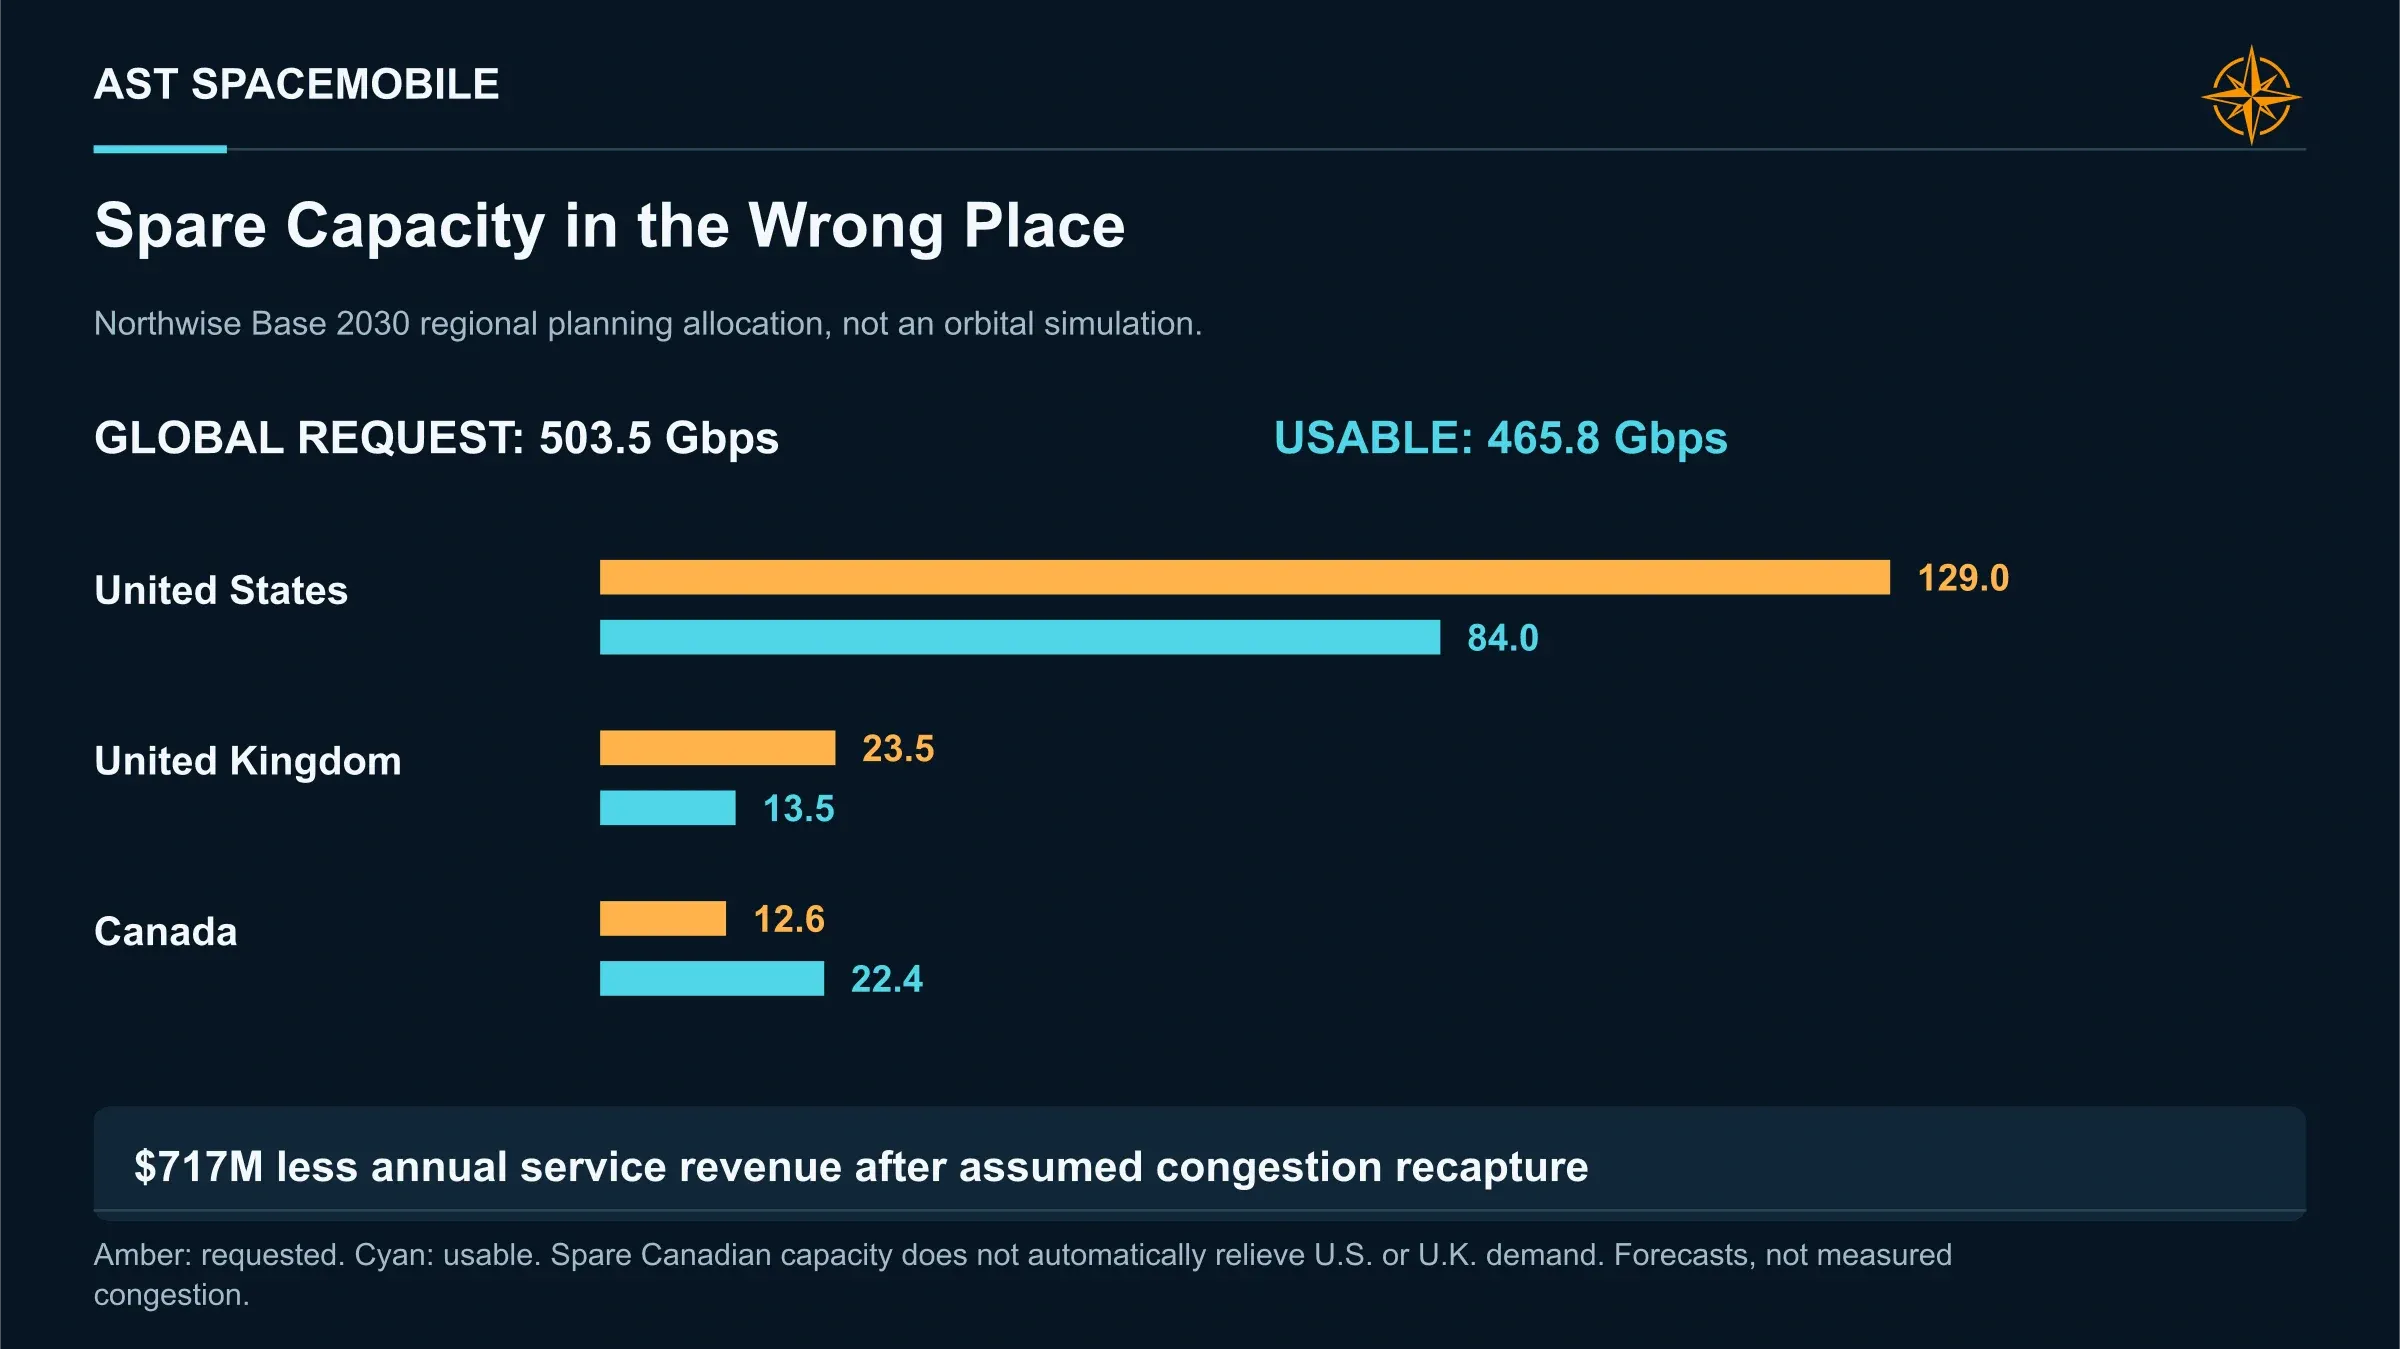
Geography is handled explicitly. Idle capacity over the Pacific cannot relieve congestion over Texas, so spare capacity is never pooled into a single global bucket.
By 2030 our Base case produces 466 Gbps of usable regional downlink against 504 Gbps of busy-hour demand. The global total is short, and the regional imbalances are larger. We assume 40% of otherwise capacity-constrained line demand remains billable under congestion management. Even with that allowance, modeled AST service revenue is about $717M below the unconstrained estimate. This is a forecast of billing behavior, not a claim that the network delivers traffic above its physical limits.
How the network behaves when crowded is one of the least documented variables in the story. AST bills carriers per line, so a busy network tends to slow down before it loses customers. How far carriers will tolerate that before renegotiating will only become visible once the network carries real commercial load.
The commercial engine
Our revenue build starts with country-level ceilings, then applies carrier access, adoption, coverage and capacity. We model 2 products separately. Paid add-ons, where a subscriber opts in, carry higher wholesale prices and heavier usage. Bundled access, where a carrier folds satellite coverage into a broader plan, carries a low price per line and light usage.
In the U.S., our starting assumptions are $3.80 a month of AST wholesale revenue per add-on line and $1.00 per bundled line, with monthly usage of 0.35 GB and 0.035 GB respectively. AST has not disclosed these unit economics. Usage growth and wholesale price erosion then change these starting inputs over the forecast period.
Usage grows 5% a year from 2028 in our central case. Wholesale prices decline 2% a year from 2028 as we allow for stronger competition and carrier bargaining power. Both are analyst assumptions; low initial usage does not guarantee that the coverage product stays light on network resources.
Government revenue is modeled on its own line. We build it from about $130M in 2027 to $310M in 2030, anchored to awards AST has disclosed, and exclude the Japan program until it is signed.
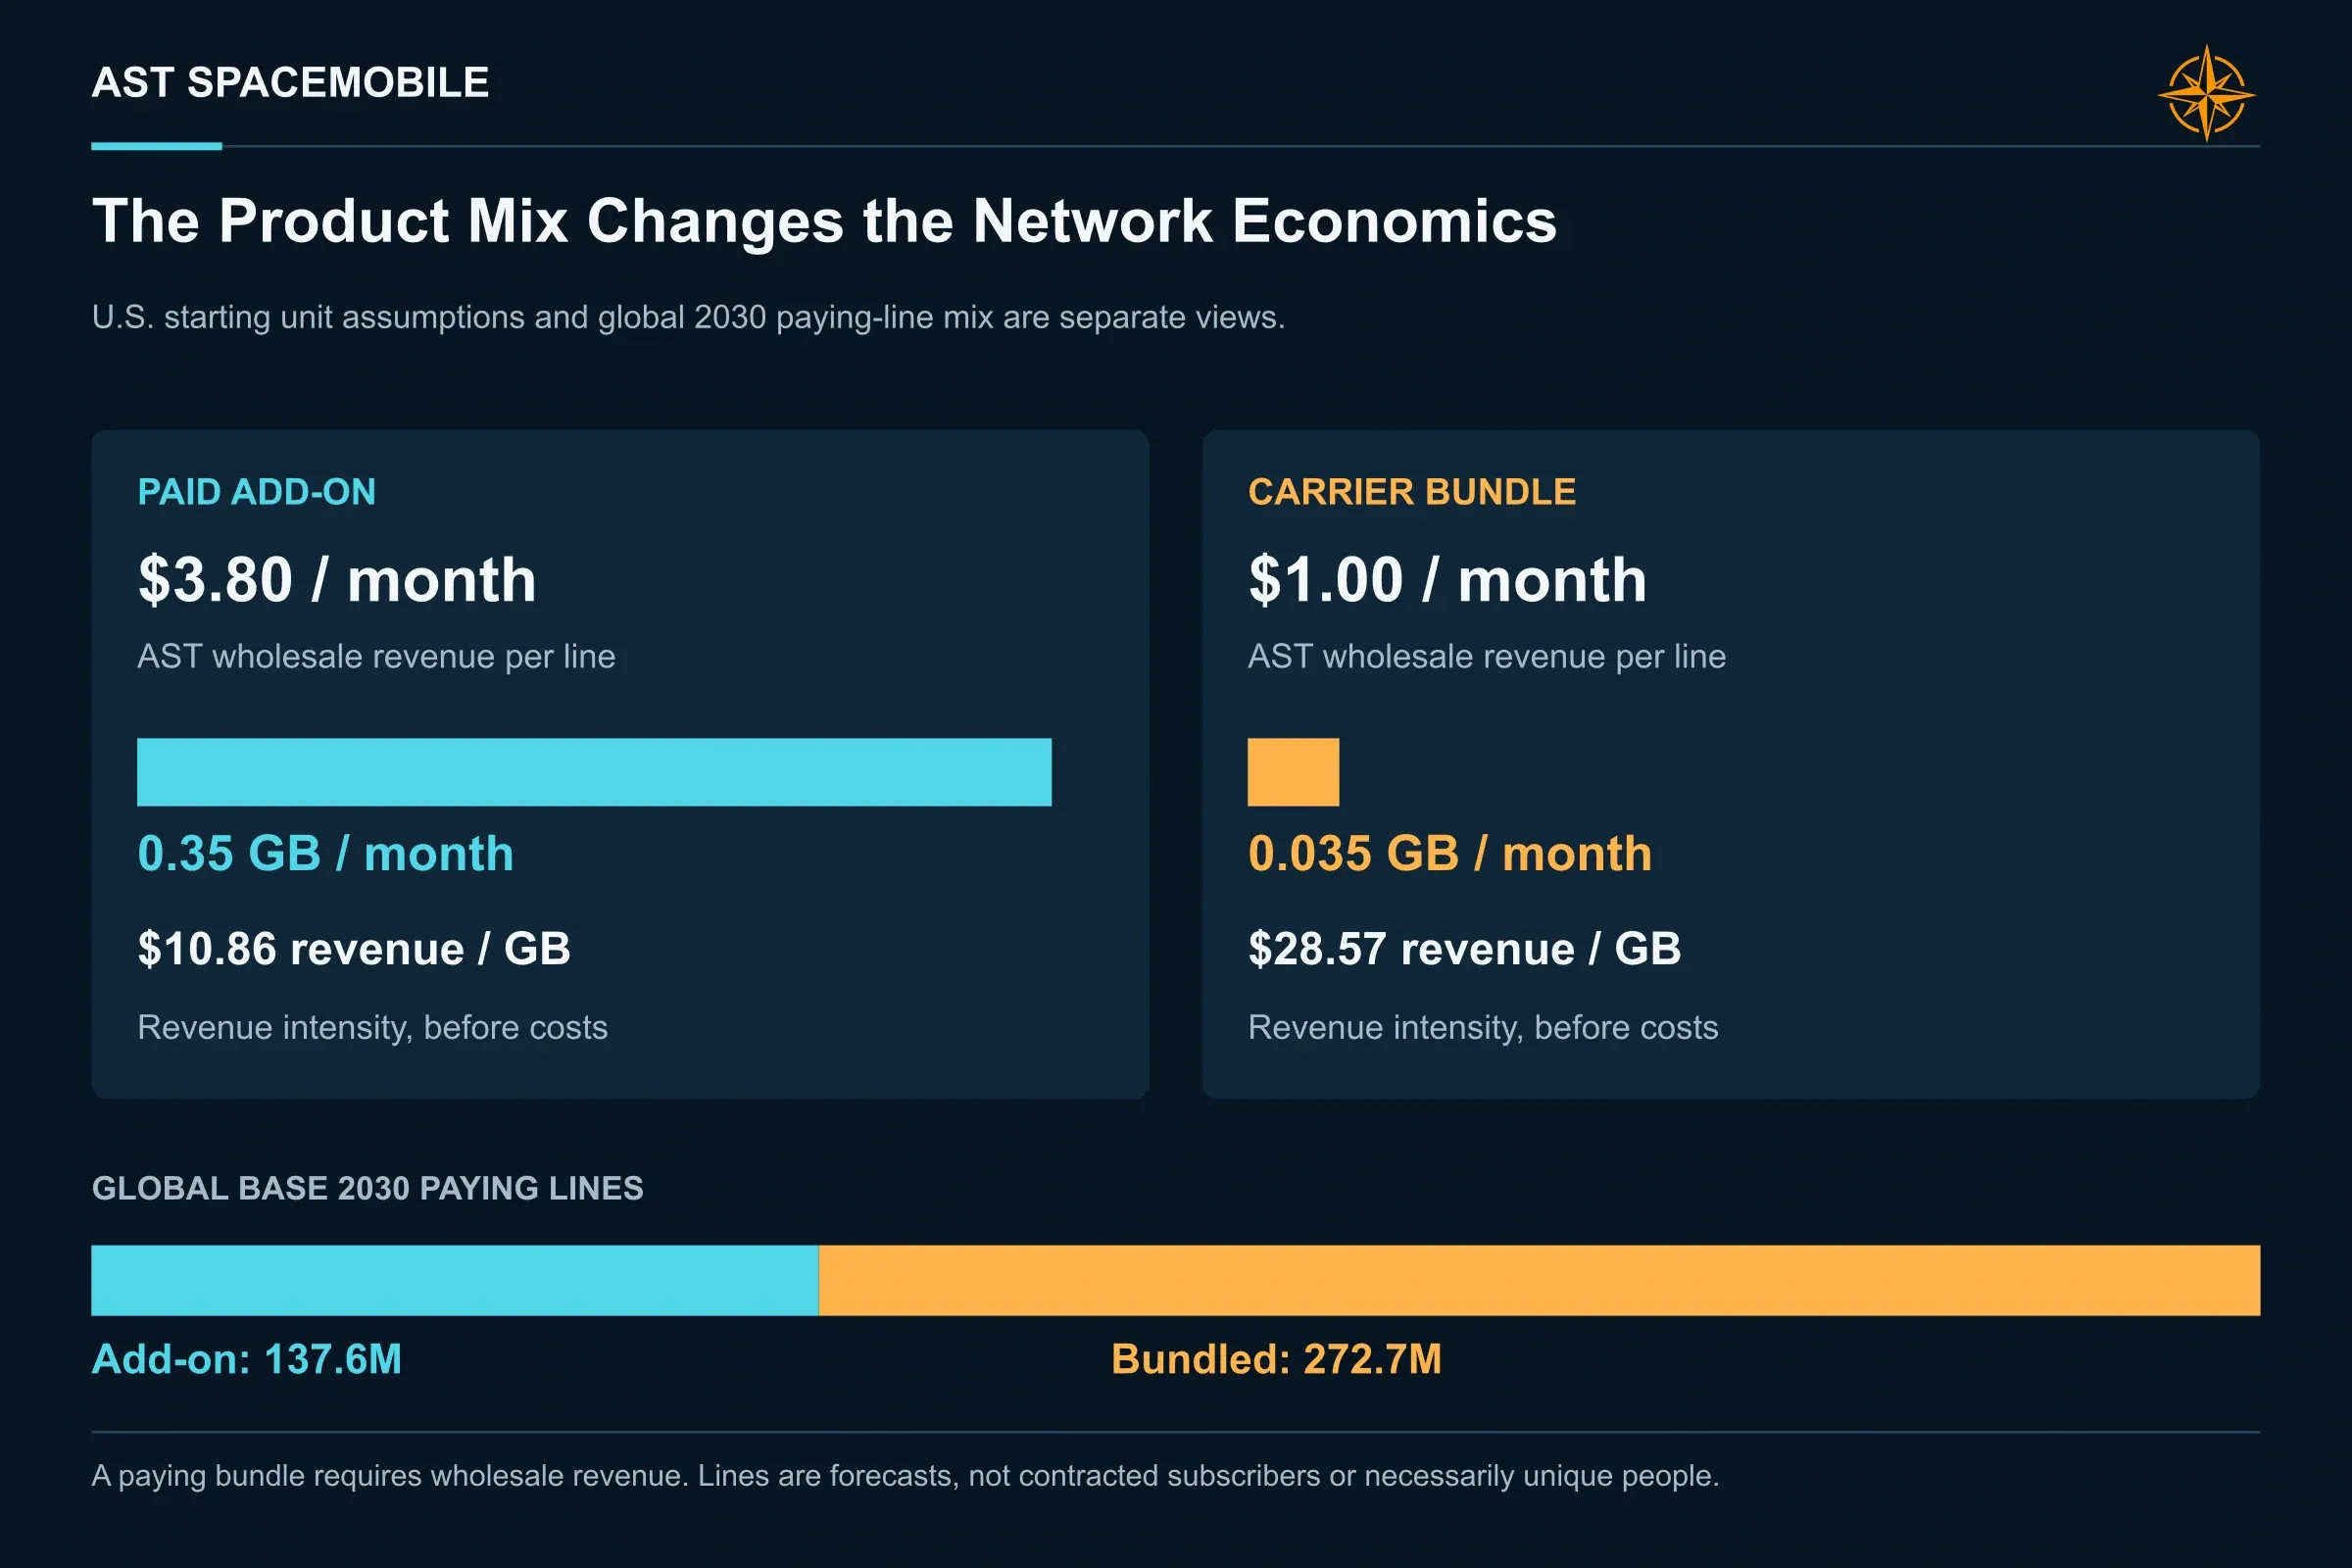
Taken together, Base revenue reaches about $503M in 2027, $2.29B in 2028 and $5.15B in 2030, from roughly 410M average paying or bundled lines. The U.S. contributes about $1.59B of 2030 service revenue, continental Europe about $719M and Latin America about $480M.
Base case | 2026 | 2027 | 2028 | 2029 | 2030 |
|---|---|---|---|---|---|
Revenue ($M) | 175 | 503 | 2,292 | 4,012 | 5,154 |
Adjusted EBITDA ($M) | (373) | (280) | 1,207 | 2,651 | 3,572 |
Operating cash flow less capex ($M) | (1,978) | (2,117) | (578) | 1,077 | 2,216 |
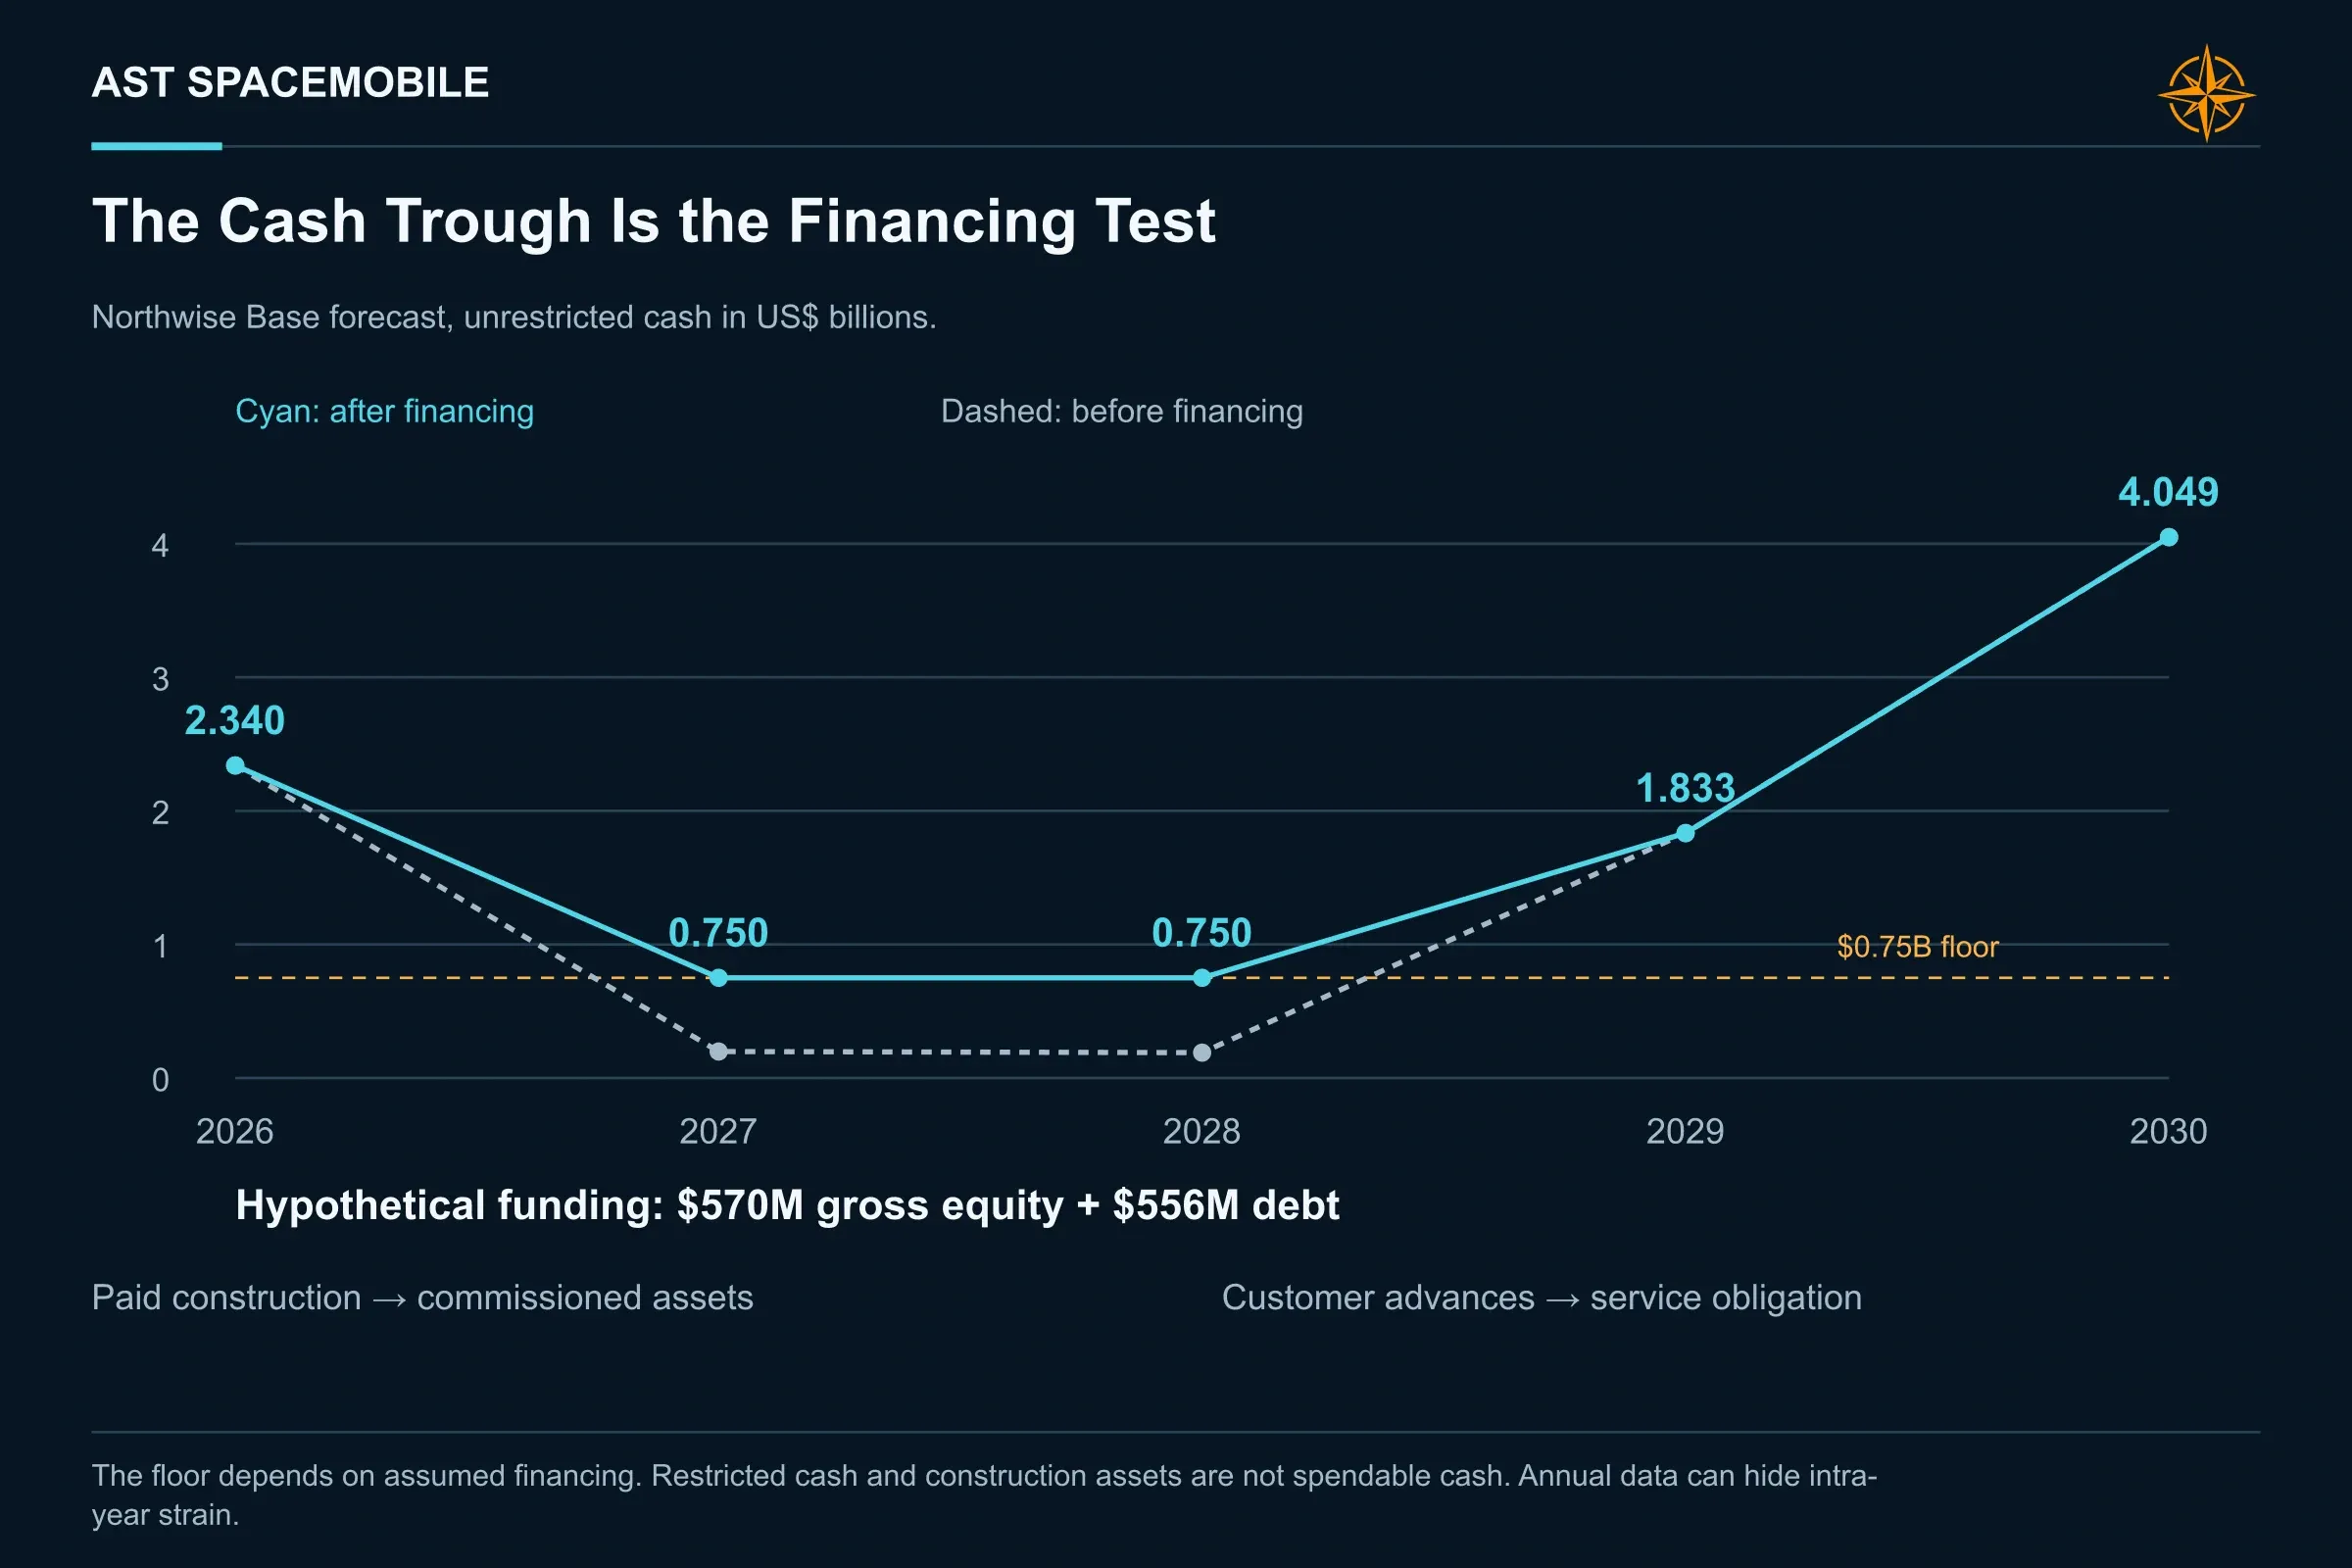
Year-end cash ($M) | 2,340 | 750 | 750 | 1,833 | 4,049 |
Active satellites, year end | 12 | 47 | 94 | 133 | 169 |
The 2026 column combines reported first-half results with our second-half forecast, and the full-year figure sits inside AST's $150M to $200M guidance.
Funding the build
The July sale of $1.15B of 1.625% convertible notes due 2034 lifted reported pro forma cash, cash equivalents and restricted cash above $3.7B. Restricted cash is not interchangeable with unrestricted operating liquidity. Management also guided to $350M to $425M of capital spending in the third quarter.
Our Base case spends about $5.8B of cash on satellite and ground investment from mid-2026 through 2030. Even with the July raise, cash reaches our $750M liquidity floor in 2027. The financing need is a forecast, and annual balances can conceal pressure within a year.
We assume roughly $570M of gross new equity and $556M of new debt across 2027 and 2028 before operating cash flow covers capital spending in 2029. In weaker paths the funding need grows, and new shares are issued at lower modeled prices. These future financings are assumptions, not committed facilities.
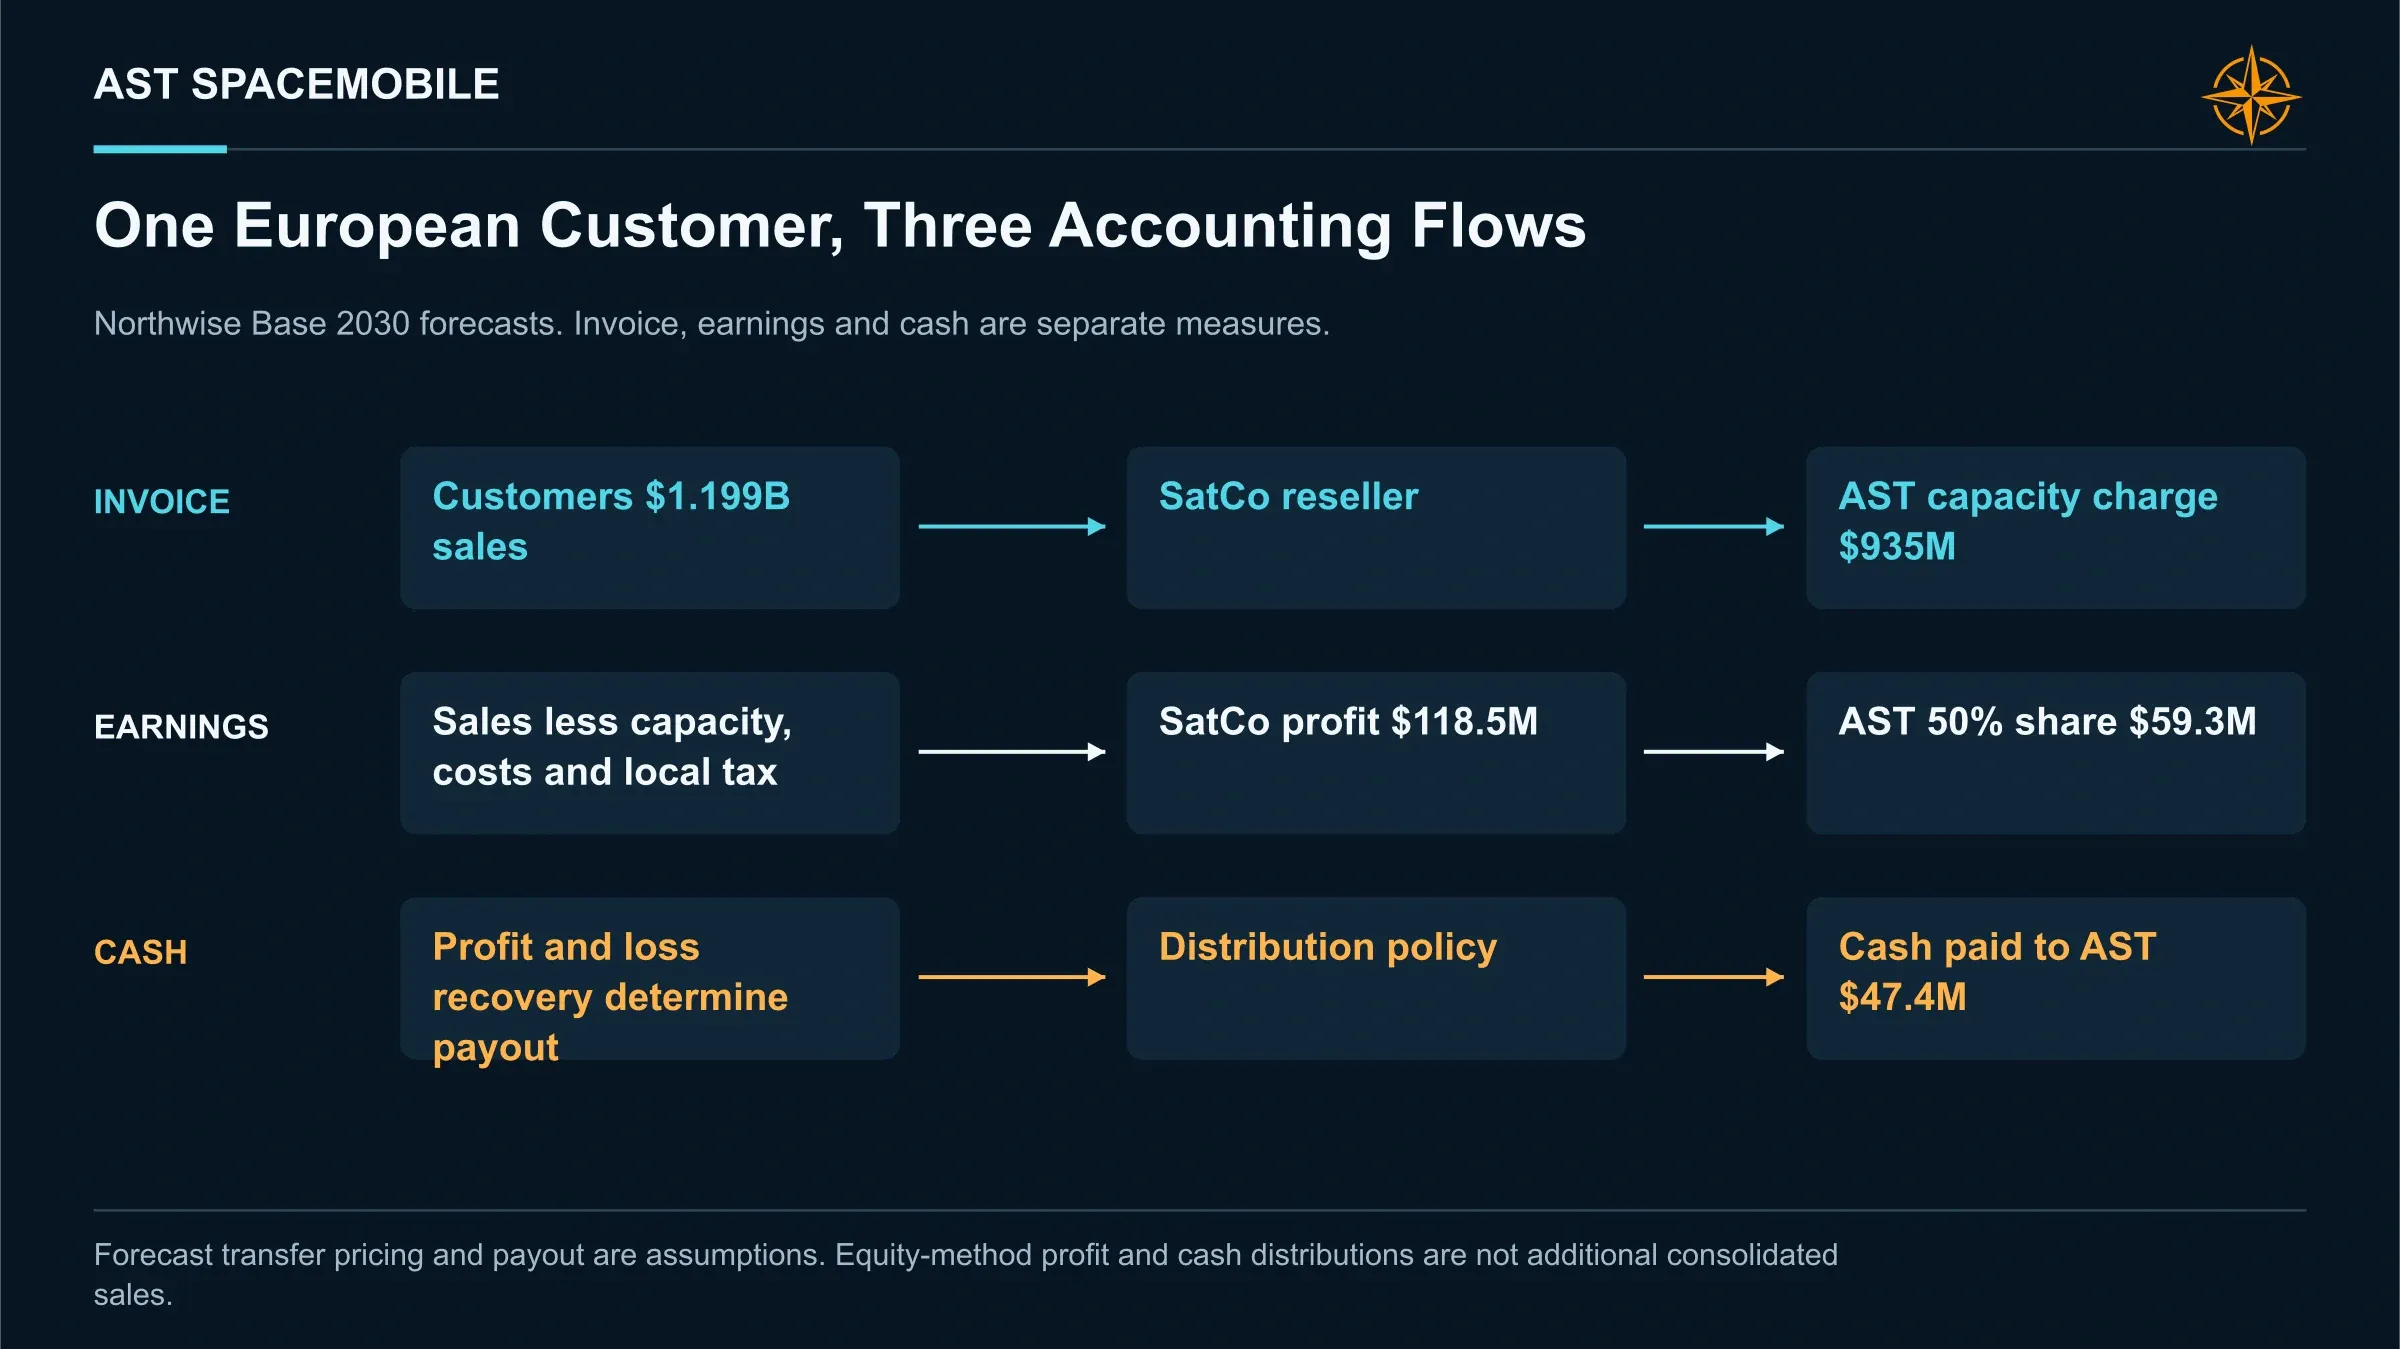
Europe requires a separate accounting step. In our Base 2030 forecast, SatCo earns $1.199B of external revenue and pays AST a $935M capacity charge. AST then recognizes $59.3M of residual venture profit and receives $47.4M of distributions. The capacity charge, equity-method earnings and cash distribution belong in different lines; adding all four figures as AST revenue would double count the same business.
The cost of staying in orbit
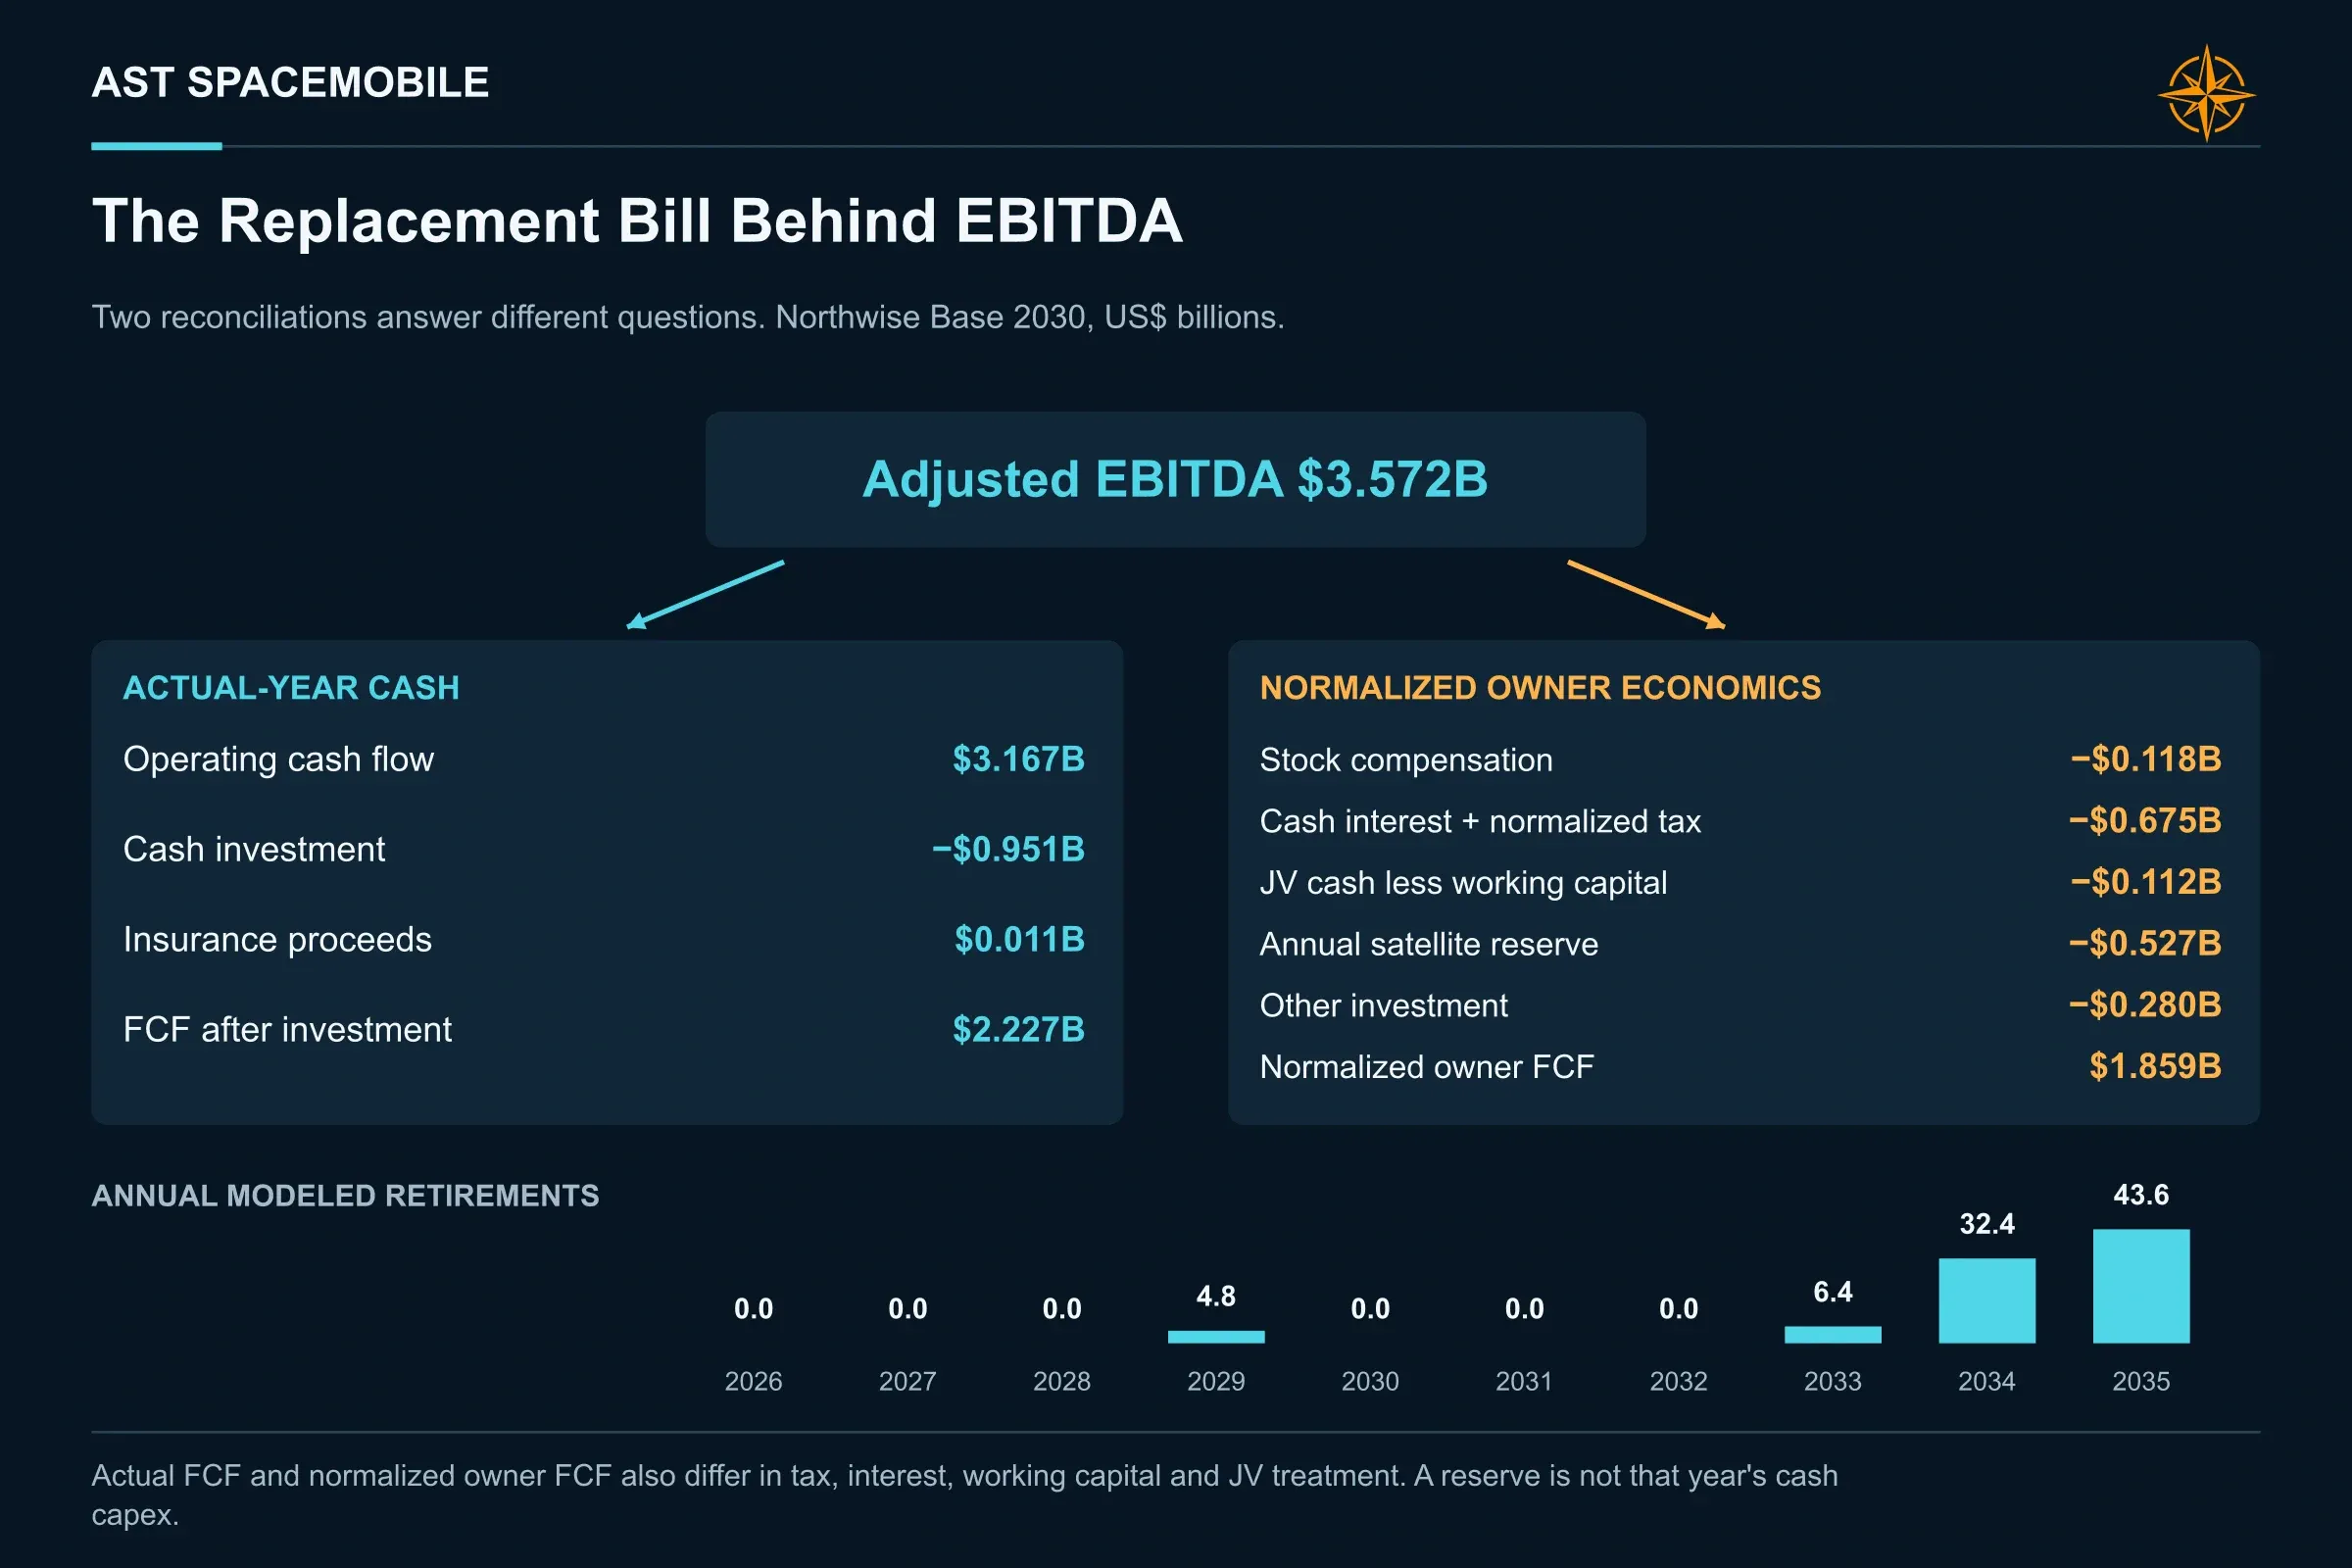
Operating leverage is the attractive half of the model. Once the network is built, adding a bundled line costs AST very little, and Base adjusted EBITDA reaches about $3.57B in 2030, a 69% margin.
We built costs up from the current run rate. Second-quarter adjusted operating expenses, excluding cost of revenue, were $95.9M, up 20% from the first quarter, and guidance for the third quarter is $105M to $115M. On top of that we layer national landing-rights fees, gateway sites, satellite operations and the Ligado payments.
The less attractive half is that satellites wear out. We assume a 7-year economic life, so the fleet launched in 2027 and 2028 starts reaching that assumed life in 2034 and 2035, just as the network approaches its authorized ceiling of 248 satellites. Our installed cost per satellite falls from $32M to $24M as volumes rise, above management's $21M to $23M estimate, to allow for early units and launch risk.
Our long-run cash flow treats replacement as a permanent cost of doing business, at roughly $890M a year once the fleet matures. Growth beyond that point has to be funded with new investment, and we charge for it explicitly.
The industry's history is a reason to take that cost seriously. Iridium filed for bankruptcy in 1999, Globalstar in 2002 and OneWeb in 2020. Each had working satellites, and each ran out of financing before revenue could carry the capital base.
AST's design, carrier model and balance sheet differ from those predecessors in important ways. The failure mode still applies to any network that must be built in full before it earns in full.
What shareholders own today
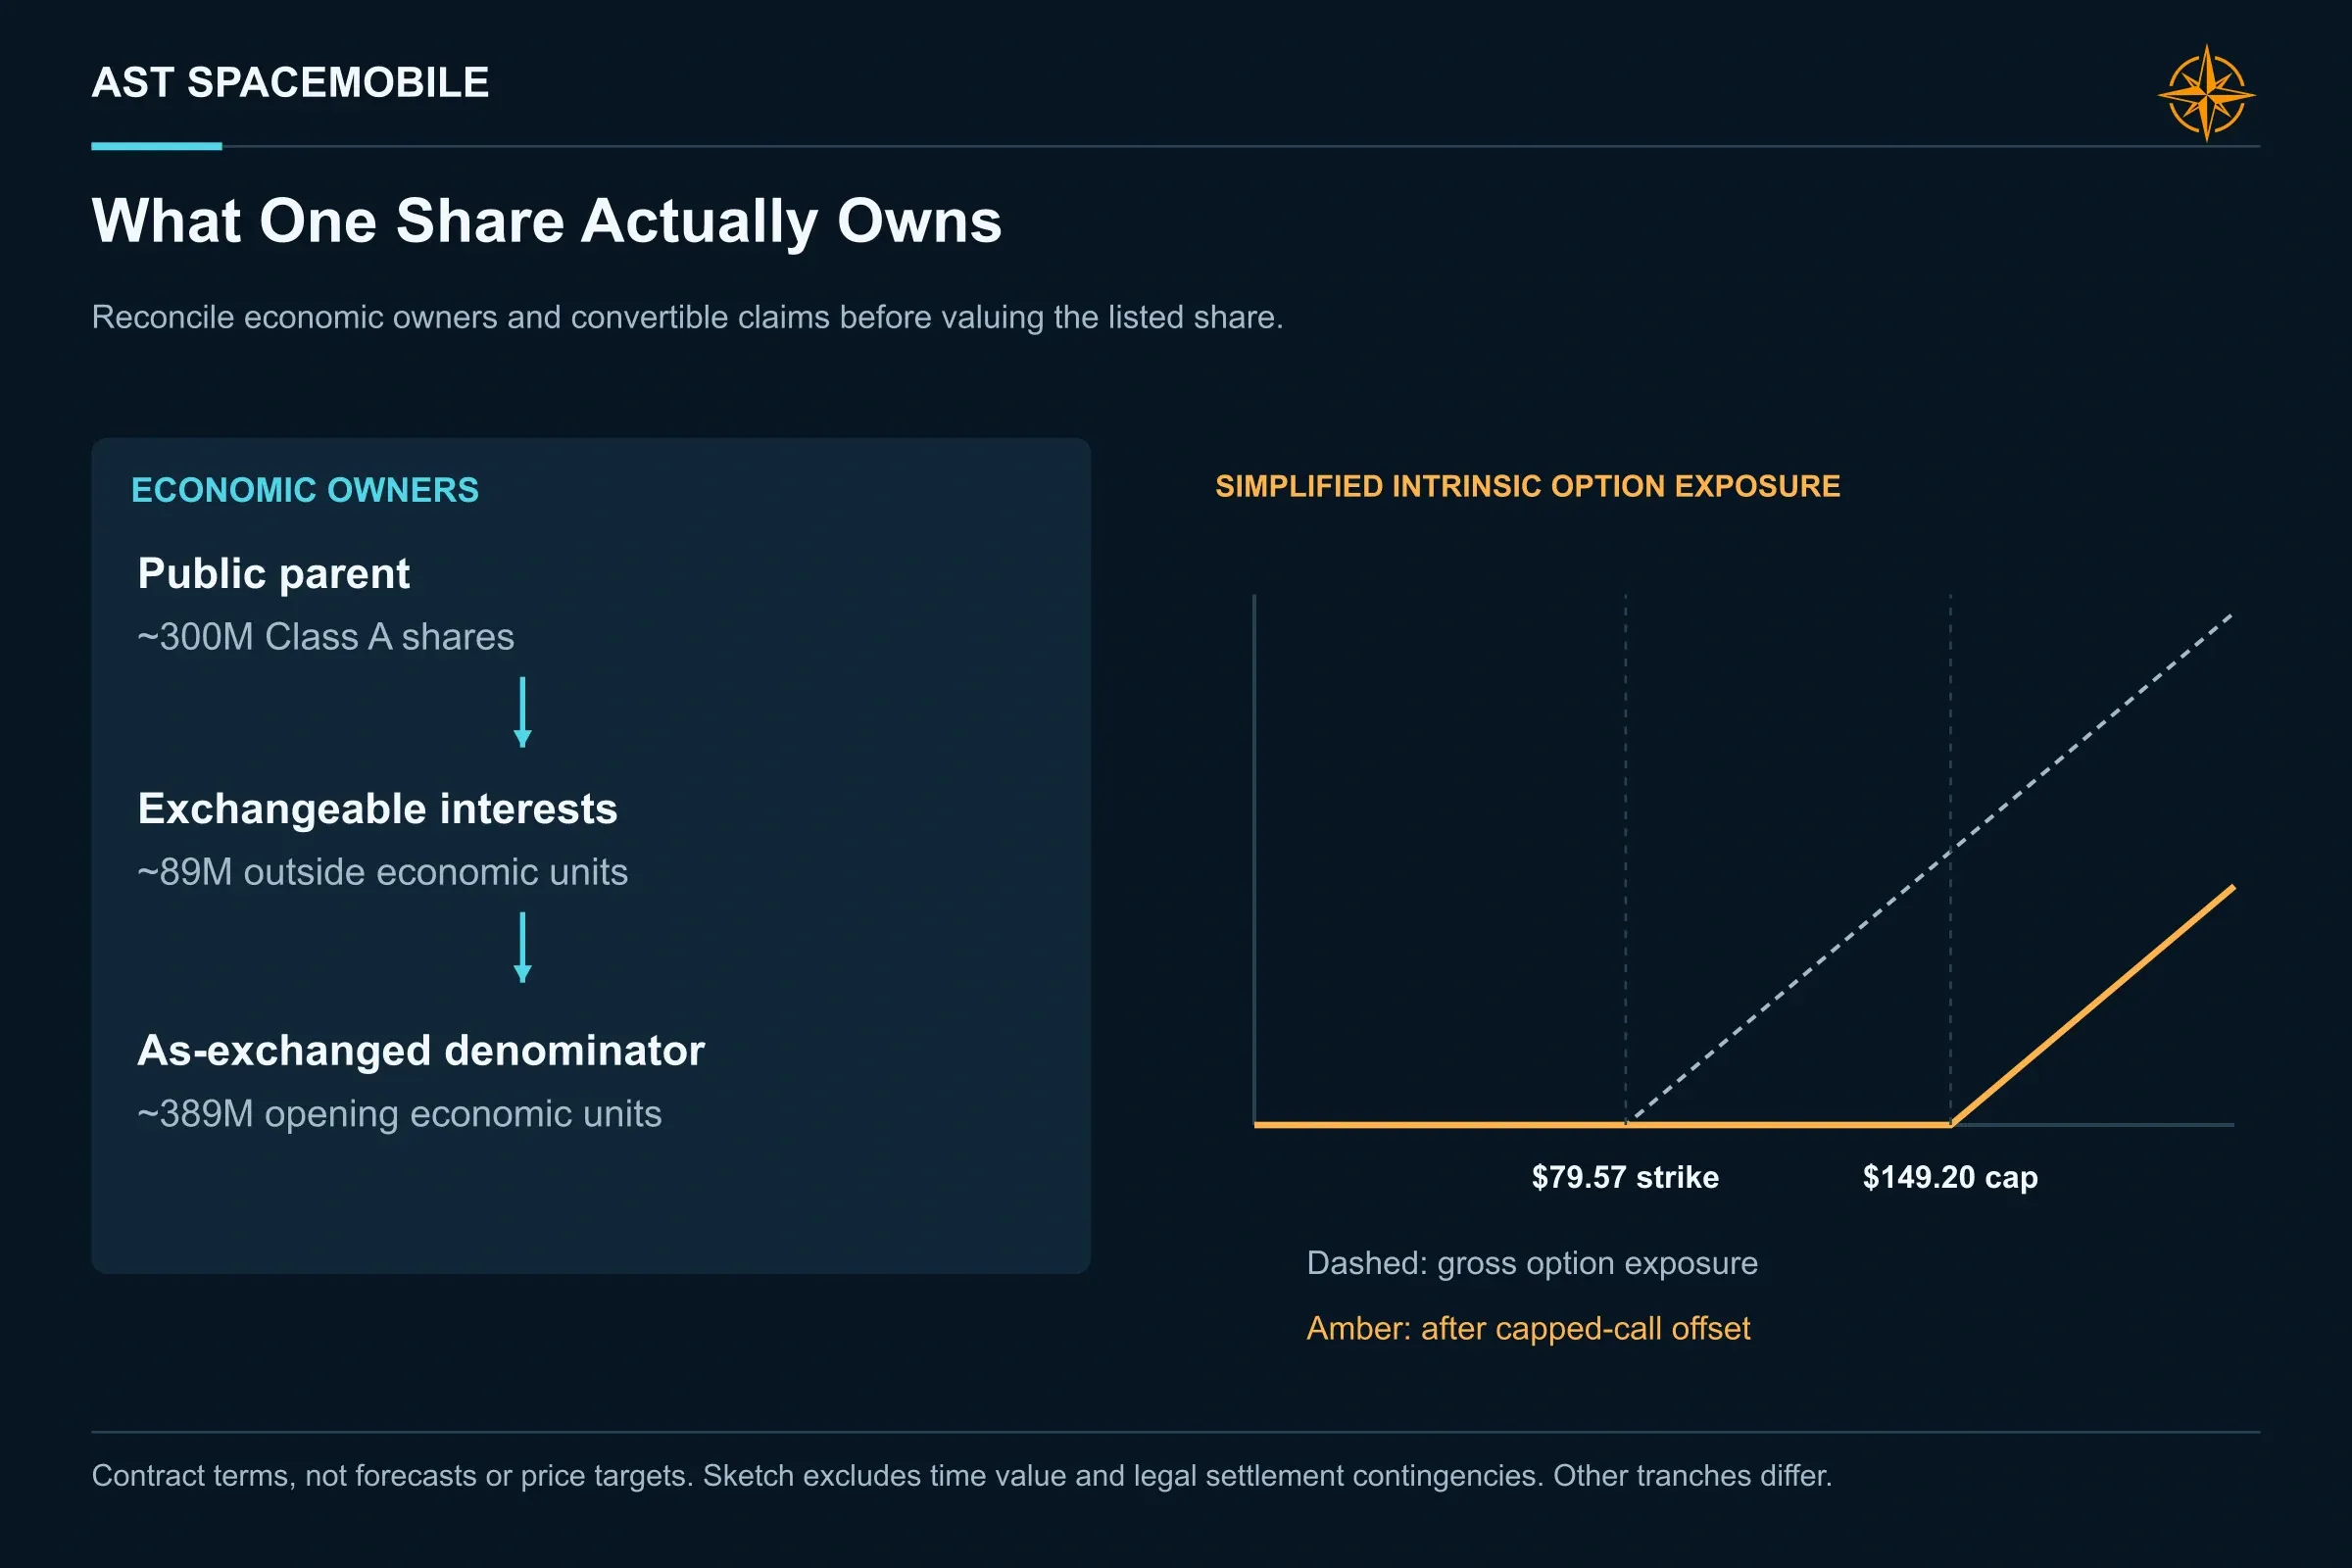
For existing holders, the starting economic denominator is about 389M units: roughly 300M publicly traded Class A shares plus about 89M exchangeable outside interests. Our Base forecast reaches about 418M economic units by 2030 before conversion claims are allocated. A lower reference share price increases the number of units needed for a given future equity raise.
Holders also own a set of near-term tests. Over the next 6 to 12 months, the company is due to start beta service with carrier partners, reach about 45 satellites in orbit, begin launching mid-band satellites, and work toward closing the Ligado spectrum deal. Each of those milestones has a date attached, which makes them a practical scorecard.
The outside variables move on a similar clock. SpaceX's next-generation direct-to-cell satellites, Amazon's Globalstar acquisition, and the U.S. carrier joint venture's choice of satellite partners will all shape what AST can charge.
The recent selloff reflects some of that uncertainty. Our valuation work below asks whether the reference price compensates for the remaining operating and commercial risks.
The variables that decide the outcome
After running every major input through the full model, the drivers sort into 3 groups.
Execution covers launch cadence, satellite cost and in-orbit reliability. It mostly moves timing and capital needs. A slower ramp costs money and pushes revenue out, though the network still arrives at a similar size a few quarters later.
Capacity covers loaded throughput per satellite, usage growth and how congestion is handled. These set the number of paying lines the network can hold, and they remain the largest technical unknown.
Adoption and pricing cover how many lines carriers attach, at what wholesale rate, and with how much bargaining power. In our testing this group carries the most weight. A combined cut to adoption and price, the kind of outcome a market with 2 large suppliers and an organized carrier bloc can produce, does more damage than any engineering shortfall we tested.
That ordering is the core of our view. AST has largely answered the question bears asked 3 years ago, whether the technology works. The question that now decides the stock is commercial: how much carriers will pay once they have a choice.
Continue with Northwise Premium
Everything above explains how AST's network works, what the evidence shows, and which variables will decide the outcome. Northwise Premium converts that work into per-share values: our valuation method, Bear, Base and Bull outcomes built from the same 3 drivers, the probability weighting, a full stress-test library, the judgment calls with the most leverage, and our required-return entry zones and rating for AST.
Northwise Premium
Choose how to continue with Northwise
Join Northwise Premium
Unlock the rest of this report, its complete valuation, the downloadable model, portfolios, and action framework.
Join Northwise PremiumCreate a Free Account
Continue across Free Northwise research, follow companies, save reports, and receive updates.
Create a Free Account
AST SpaceMobile Stock Analysis
AST SpaceMobile stock analysis exploring direct to device satellites, carrier partnerships, technology, risks, and long term potential.

ASTS Stock Price
ASTS Stock Price is a controversial topic. Is it justified or not? This piece explores the unparalleled TAM, strategic vision, and leadership of ASTS.

Celsius Stock Analysis: The Shelf Reset and the Second Growth Curve
Celsius stock analysis of the shelf reset, Alani growth, Pepsi economics and cash flow, with a 2030 model and a Premium valuation and entry-price framework.
Northwise Portfolios
See how the research becomes real decisions
Reader discussion
Discuss the research
Premium access is required to join this report's discussion.
Join Northwise Premium
No comments yet. Start a thoughtful discussion.