
Netflix Stock Forecast 2030

Our Netflix stock forecast 2030 models subscriptions, advertising, margins, free cash flow, competition, valuation, and Netflix’s long-term upside
In this article
Netflix has already won the streaming war. Its next challenge is proving that subscriptions, advertising, and a broader entertainment ecosystem can sustain growth as the company matures.
1. Netflix's Next Act
For most of its public life, Netflix was a bet on a behavioral shift. The company argued that television would move to the internet, spent enormous sums to force the transition, and endured a decade of skepticism about whether the economics would ever work.
That argument is over. Netflix ended 2025 with more than 325 million paid memberships, $45.2 billion of revenue, a 29.5% operating margin, and roughly $9.5 billion of free cash flow. Streaming carried 47.6% of all U.S. television viewing in April 2026. The behavioral shift happened, and Netflix collected the largest prize.
Winning changes the job. A challenger only needs to grow. A scaled platform needs to grow, defend, and monetize simultaneously, and it must do all three from a base where the easy household additions are behind it and every competitor for human attention now shows up on the same screen.
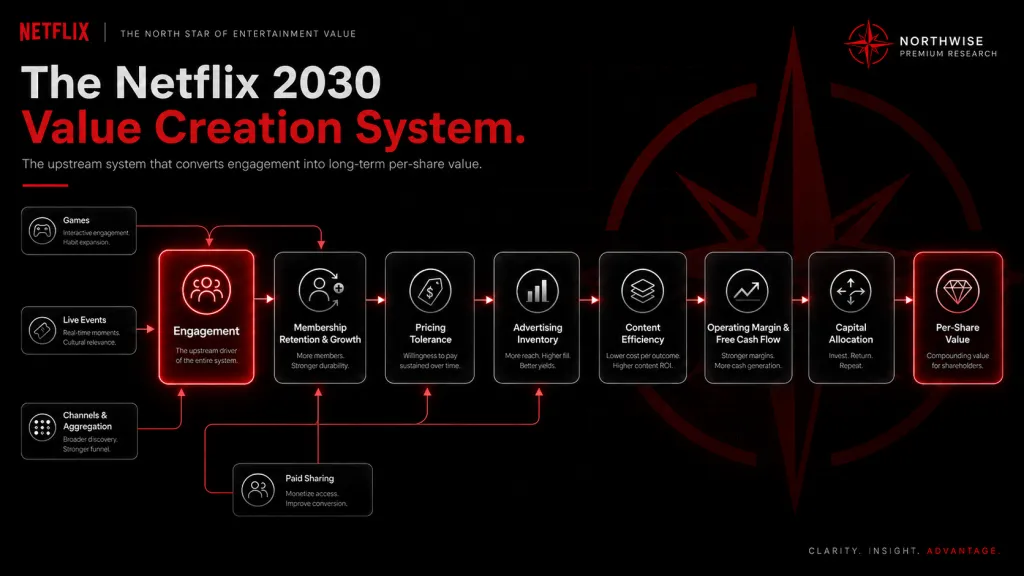
So the investment question has moved. It is no longer about whether streaming replaces television. It is about whether a mature subscription platform, layered with a young advertising business and a widening set of engagement products, can keep compounding at a rate that justifies a premium valuation.
Netflix is attempting a transition from the world's largest streaming service into something closer to a general entertainment platform: on-demand programming, advertising, live events, games, and possibly channels and aggregation. That evolution expands the ceiling. It also places the company in direct competition with nearly every major platform fighting for consumer attention, including several with deeper pockets and different economics.
This Netflix Stock Forecast 2030 report works through that transition piece by piece, then builds the full 2030 financial model, scenario by scenario, to answer the only question that ultimately pays: what is this business worth, and at what price does it become compelling?
2. The Subscription Engine Is Maturing, Not Breaking
The lazy read on Netflix is that subscriber growth is slowing, therefore the story is ending. The numbers do not support that conclusion, though they do demand a more precise one.
Netflix estimates it has penetrated less than 45% of its addressable broadband-household market. Even after two decades, more than half the pool remains unconverted, and most of the remaining opportunity sits outside the mature English-speaking markets where Netflix already dominates living rooms.
The 2025 regional revenue split shows where the engine now runs:
Region | 2025 revenue |
|---|---|
UCAN | $19.957B |
EMEA | $14.515B |
Latin America | $5.358B |
APAC | $5.354B |
Growth was strongest in APAC and EMEA, with Latin America also growing strongly on a constant-currency basis. UCAN remains the profit anchor, though the incremental member increasingly lives elsewhere, pays less per month, and often enters through the advertising plan.
That mix shift is the crux of subscription maturity. Netflix now grows revenue through several levers at once: new households internationally, periodic price increases in mature markets, paid sharing and extra-member accounts that monetize viewing which previously generated nothing, and the low-priced ad tier that converts price-sensitive households the premium plans could never reach.
None of these levers is as dramatic as the original land grab. Together they have kept revenue growing at double-digit rates. 2025 revenue grew roughly 16%, and 2026 guidance calls for 12% to 14%. Those are not the growth rates of a broken engine.
The honest tension is different. Each lever pulls on the others. Price increases test churn. The ad tier lowers average subscription revenue per member even as it adds members. International growth dilutes blended monetization even as it expands the base. The subscription engine still works. It simply requires more skill to operate, and the margin for pricing error narrows as the base matures.
The detailed membership and monetization assumptions that flow from this, and what they produce by 2030, are built in Section 10.
3. Advertising Changes the Business Model
Advertising is the most consequential structural change at Netflix since the move into original programming, and it is arriving faster than most models anticipated.
Netflix expects roughly $3 billion of advertising revenue in 2026, approximately double the 2025 figure. More than 60% of new signups in advertising markets now choose the ad plan. The company works with more than 4,000 advertisers, a count that grew roughly 70% year over year. Netflix estimates its ad-supported experience reaches more than 250 million monthly viewers globally, with more than 80% of ad-supported members watching weekly. The plan expands into 15 additional countries in 2027.
One definitional point before going further. The 250 million figure counts viewers, not accounts or paid memberships. Multiple people watch a single account, so dividing ad revenue by 250 million produces a meaningless number. Any per-account advertising math in this report is labeled as a model estimate.
The strategic logic of advertising is straightforward and powerful. Netflix already owns the viewing hours. Advertising monetizes those same hours a second time. It lowers the entry price in markets where an ad-free subscription is genuinely expensive relative to income. It creates premium inventory around live events. It extracts new revenue from library content that subscription pricing alone never captured. And it hands advertisers something broadcast television can no longer offer: global, logged-in, measurable reach on the biggest screen in the house.
The economics are less clean than the strategy. Advertising revenue arrives net of real costs. The ad plan carries a lower subscription price, and some members who would have paid for premium tiers migrate down. Netflix must fund ad technology, measurement, sales infrastructure, and revenue-sharing agreements, and the formats that generate the best inventory, live events in particular, carry their own programming costs.
So the right way to think about advertising is as a second monetization layer with its own cost structure, not as free money layered on top of an existing business. Whether it becomes a margin engine or a revenue substitute depends on scale and execution. The contribution math, which is where this question actually gets settled, is worked through in Section 11.
4. Engagement Controls the Outcome
Every variable in this thesis, pricing power, advertising inventory, retention, content efficiency, terminal multiple, sits downstream of a single question: do people keep watching?
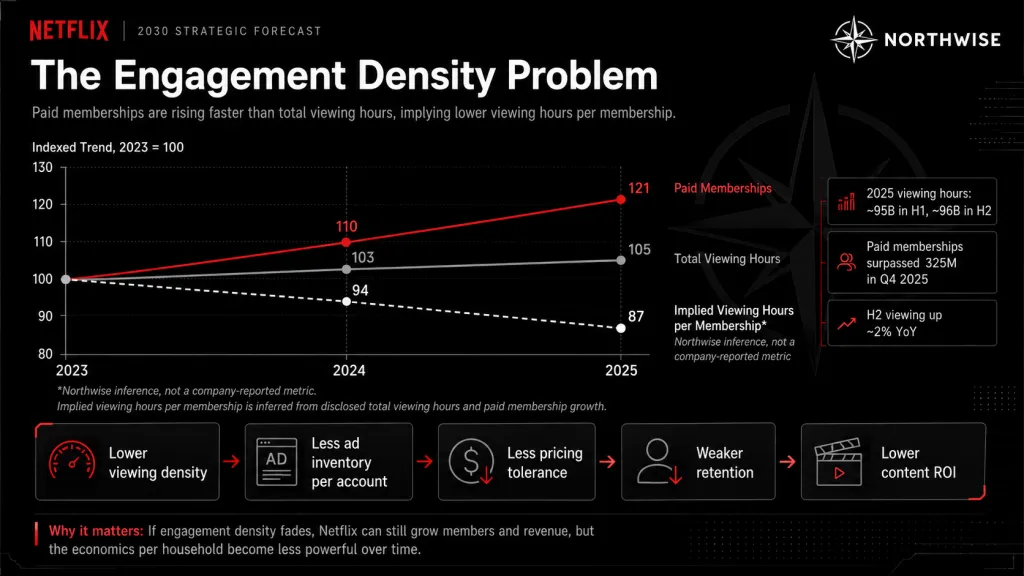
The disclosed numbers deserve a careful read. Netflix reported more than 95 billion viewing hours in the first half of 2025 and roughly 96 billion in the second half, with H2 viewing up about 2% year over year. Viewing of Netflix-branded originals grew roughly 9%, with non-branded viewing declining, partly due to lower licensed-content availability. Netflix says its internal quality-engagement measure reached an all-time high in Q1 2026, and estimates it captures about 5% of total global television viewing.
Now hold those figures against the membership line. Paid memberships passed 325 million in Q4 2025 and grew materially faster than total viewing hours. If the audience grows faster than the hours, viewing per membership likely declined. Netflix does not disclose that metric, so this is our inference, not a company figure. It is, in our view, the most important inference in the entire report.
Here is why. A growing membership base watching slightly less per household can still produce rising revenue for years. Pricing, paid sharing, and the ad tier all keep working. What erodes is the density of the asset. Less viewing per member means less advertising inventory per account, weaker justification for price increases, softer retention when the next hike lands, and lower return on each content dollar.
Nielsen data sharpens the pressure. In April 2026, streaming carried 47.6% of U.S. television time. YouTube alone held 13.4%. Netflix held roughly 7.8%, with Prime Video at 4.2%. Netflix is the largest paid service on television, and it is simultaneously being out-watched by a platform that pays for almost none of its own content.
The engagement question therefore reduces to a race: is Netflix increasing the economic value of each household faster than engagement density is fading? The 2030 model takes a position on that race in every scenario, and the probability weights in Section 15 lean on this variable more heavily than any other.
5. The Content Machine
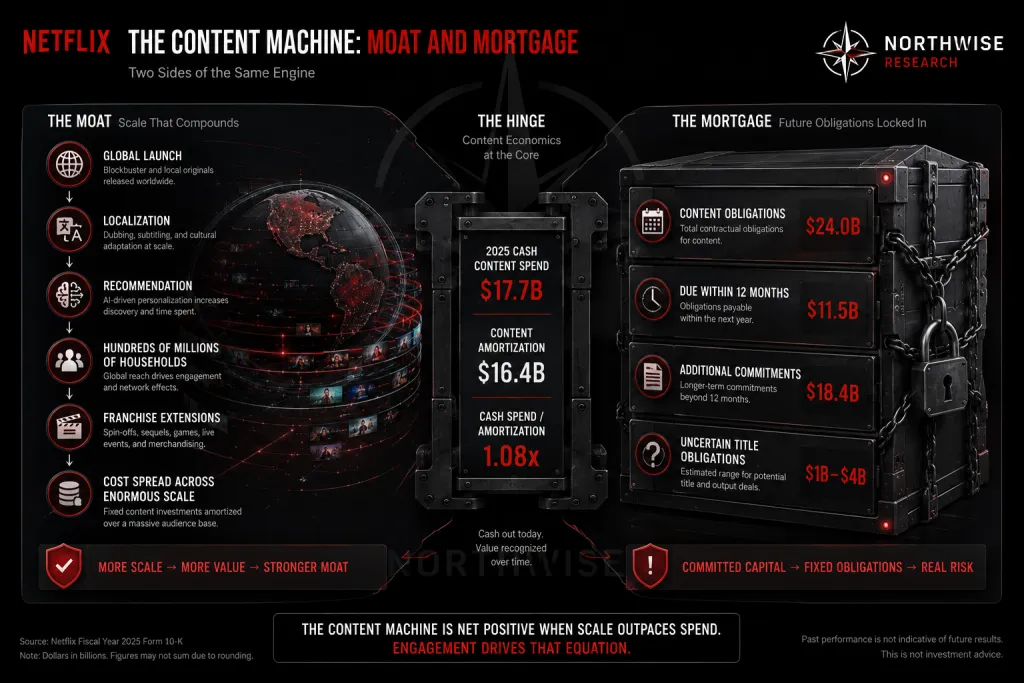
Netflix's content operation is the moat and the mortgage at the same time, and understanding both sides is essential before touching the cash flow model.
The moat side is genuinely formidable. A successful Netflix title launches globally on day one, localized across dozens of languages, promoted by a recommendation system trained on the viewing of hundreds of millions of households. The subscription base spreads production cost across more payers than any studio in history, and a hit can be extended into sequels, games, live experiences, and merchandise. No competitor combines that distribution, that data, and that production infrastructure in one system.
The mortgage side is equally real. At the end of 2025, Netflix carried $24.0 billion of total content obligations, $11.5 billion of it due within 12 months, with roughly $18.4 billion of additional commitments not yet on the balance sheet and an estimated $1 billion to $4 billion of further uncertain title obligations over three years. These are not conventional debt, though they behave like it in one important way: they remove Netflix's ability to cut content spending quickly if conditions deteriorate.
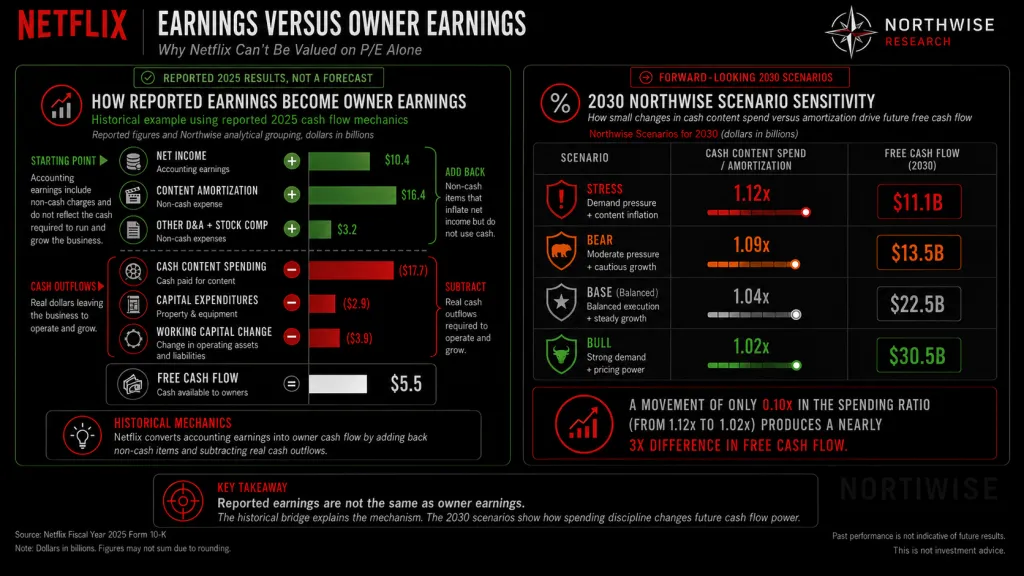
The subtler point, and the one that separates careful Netflix analysis from casual analysis, is the gap between accounting cost and cash cost. In 2025, Netflix amortized $16.4 billion of content through the income statement while spending roughly $17.7 billion of cash on content, about 1.08x amortization. Content additions ran $17.1 billion against a roughly $611 million decline in content liabilities.
That ratio, cash content spending relative to amortization, is the hinge between reported earnings and owner earnings. When cash spending runs well above amortization, the income statement flatters the business. When the ratio compresses toward 1.0x, earnings and free cash flow converge and the equity gets cheaper in cash terms without the P/E moving at all. The 2030 model treats this ratio as a first-class variable, scenario by scenario, in Section 12.
6. Games, Live Events, and the Return of Channels
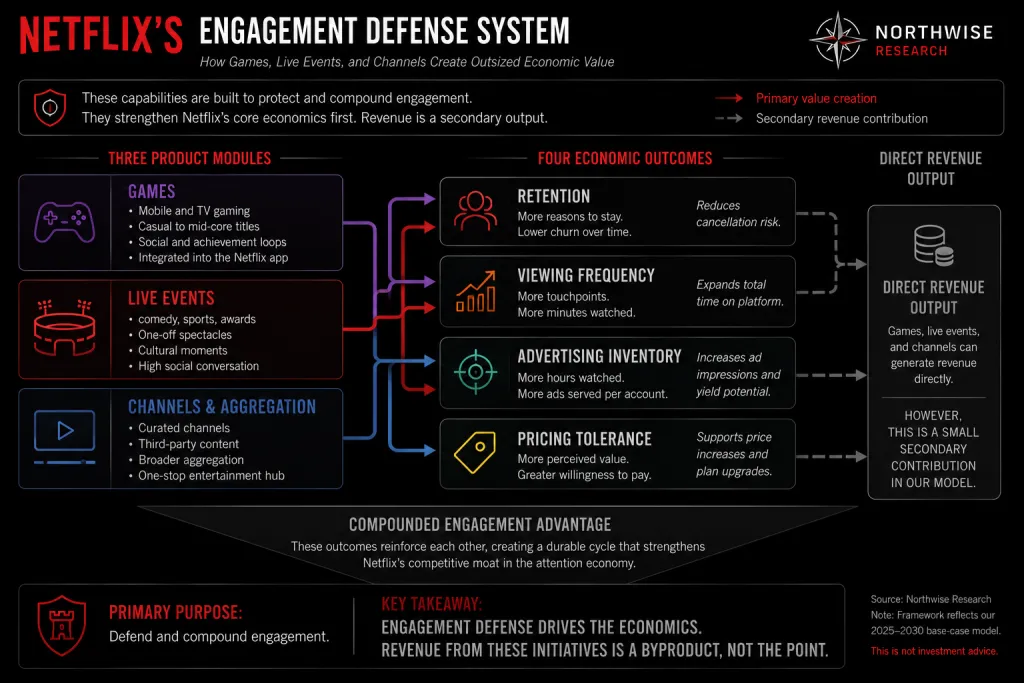
Everything in the previous two sections points at the same vulnerability: Netflix monetizes attention, and attention is the one input it cannot manufacture. The company's response has been to multiply the reasons a household opens the app.
Games are the quietest of these efforts and probably the most misunderstood. The current strategy centers on narrative titles, party and puzzle games, mainstream franchises, and children's games, including television games controlled through a smartphone and a dedicated Playground experience for kids. Roughly 10% of children's profiles have played a Netflix game. Direct game revenue remains small and largely undisclosed. The value, for now, runs through retention, family-plan stickiness, and franchise extension. A household whose children play inside Netflix is a household that thinks harder before canceling. We model games accordingly, as an engagement and retention asset with modest standalone revenue, not as a gaming business.
Live programming is louder and further along. Netflix aired more than 70 live events in Q1 2026. The World Baseball Classic in Japan drew approximately 31.4 million viewers and contributed to Netflix's largest single signup day in that market. A BTS live event drew roughly 18.4 million. Live content does three things on-demand programming cannot: it creates appointment viewing, it generates event-driven signups, and it produces premium advertising inventory sold at rates library content will never command. It also imports the pathologies of traditional television, rights inflation, production complexity, and technical risk, so discipline on what Netflix pays for liveness will decide whether this expands margins or consumes them.
Channels and aggregation are the newest front. Netflix's confirmed partnership in France integrates TF1 programming and five live channels, spanning news, sports, drama, and reality, directly into the Netflix interface. Beyond France, Netflix has reportedly explored always-on genre channels, franchise channels, bundles, and distribution of third-party services. Those remain reported possibilities, not announced products, and we treat them as such. The strategic direction is clear even so: reduce the friction of deciding what to watch, capture passive viewing, and position Netflix as the interface for television itself, the slot cable occupied for 40 years.
Taken together, these initiatives expand the ceiling and reveal the concern. Management is building defenses around engagement precisely due to the pressure described in Section 4. The model gives these efforts credit primarily through retention, pricing tolerance, and advertising inventory, with deliberately conservative standalone revenue.
7. The Expanding Competitive War
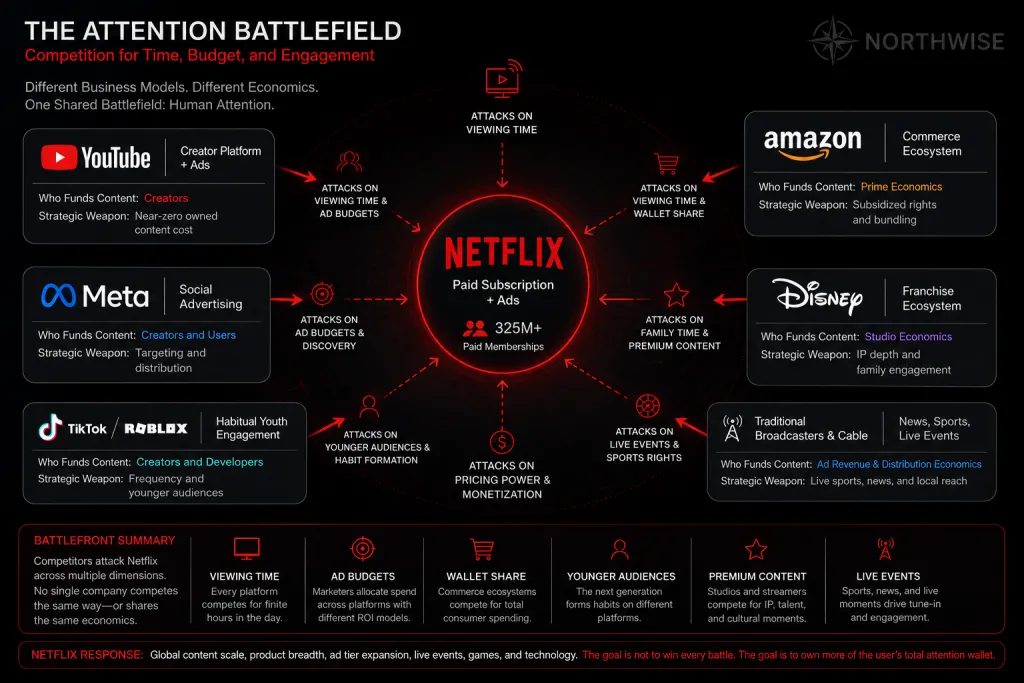
Netflix's competitive set used to be legible: Disney, HBO, and the corpse of linear television. That map is obsolete. The relevant battlefield is the total supply of screen attention, and the combatants have very different cost structures.
YouTube is the most dangerous opponent, and it is not close. It holds 13.4% of U.S. television time against Netflix's roughly 7.8%, and its structural advantage compounds: creators fund the overwhelming majority of content supply, absorbing the production risk Netflix pays $17 billion a year to carry, while Google supplies distribution, recommendation, data, and the most sophisticated advertising machine ever built. YouTube attacks Netflix's viewing share, its connected-TV ad dollars, and its podcast and live ambitions simultaneously, all with a content cost base near zero.
Amazon fights with different weapons. Prime Video never needs to justify itself as a standalone business. It exists to defend Prime, which lets Amazon fund sports rights, third-party channels, and advertising expansion out of the profits of a commerce empire. A competitor that does not need entertainment margins is a competitor that can distort entertainment pricing indefinitely.
Meta is the emerging threat. Instagram's push toward television screens, longer-form and episodic content, and creator-led live programming aims Meta's targeting and advertising infrastructure directly at connected-TV budgets. Meta has not yet proved it can produce premium scripted entertainment at Netflix's level. Its distribution and ad technology require no proof at all.
Disney remains the strongest traditional rival, with franchise depth, family engagement, theatrical distribution, and consumer-product economics Netflix cannot replicate. Its weakness is structural: a legacy-media cost base and streaming profitability far below Netflix's.
TikTok competes hardest for younger viewers and habitual daily use, and Roblox and gaming platforms hold youth attention in ways subscription video never will. Traditional broadcasters retain sports, news, and local programming, though the France partnership shows they may end up inside Netflix's tent as partners. Apple produces prestige content on an ecosystem subsidy, at a scale that has yet to threaten anyone's viewing share.
Netflix's position in this war is enviable and exposed at the same time. It has the largest paid base, the best content engine, and a clean direct-to-consumer model with no legacy anchor. It also spends more of its own money on content than any rival, in a market where its two most dangerous competitors get their content funded by creators or by a commerce business. The competitive question embedded in the model is whether Netflix's advantages hold viewing share near current levels through 2030. The thesis breakers in Section 20 put a number on it.
8. The Investment Question
Pull the threads together and the shape of the debate becomes clear.
The subscription engine is mature and durable, with real levers left: penetration below 45% of addressable households, pricing, paid sharing, and international monetization. Advertising is scaling quickly toward $3 billion in 2026 and gives Netflix a second way to monetize hours it already owns. The content machine remains unmatched, financed by obligations that also make spending hard to cut. Games, live events, and channels widen the platform and defend engagement. Competition now includes the two most structurally advantaged attention platforms on earth.
Every one of those sentences cuts both ways, and that is the point. Advertising may expand margins, or its gains may be absorbed by lower plan pricing and new programming costs. Adjacent products may deepen retention, or become expensive distractions. Engagement may stabilize as live and channels scale, or the per-member viewing decline may continue and quietly erode pricing power, ad inventory, and content returns all at once.
A qualitative story this balanced cannot be resolved qualitatively. Determining whether Netflix is attractive requires more than deciding whether the company keeps growing. It requires estimating how quickly revenue can compound, how much of that growth converts into cash, and what price makes the risk worth taking. So we build the machine: normalize the starting point, construct 2030 revenue from memberships and monetization, price the advertising contribution honestly, bridge margins to free cash flow, and let capital allocation set the share count. That is the work of the next five sections.
9. Normalizing Netflix's Financial Foundation
Before forecasting anything, the starting point has to be cleaned. 2026 reported results contain a large one-time distortion, and building a five-year model on a distorted base corrupts every number downstream.
The distortion is the Warner Bros. termination fee. Netflix agreed to acquire Warner Bros. streaming and studio assets, declined to match a higher competing offer, and collected roughly $2.8 billion of termination-fee income, recognized below operating income. Q1 2026 net income of $5.28 billion and EPS of $1.23 were artificially elevated as a result. The fee is real cash and it tells us something useful about management discipline. It is not recurring economics, so it comes out.
The recent record, stated cleanly:
Metric | 2025 actual | Q1 2026 actual |
|---|---|---|
Revenue | $45.183B | $12.25B |
Revenue growth | 16.2% | |
Operating income | $13.327B | $3.957B |
Operating margin | 29.5% | 32.3% |
Net income | $10.981B | $5.283B |
Diluted EPS | $2.53 | $1.23 |
Free cash flow | ~$9.46B | $5.094B |
Full-year 2026 guidance calls for revenue of $50.7 billion to $51.7 billion, growth of 12% to 14%, a 31.5% operating margin, roughly $3 billion of advertising revenue, and approximately $12.5 billion of reported free cash flow. The reported FCF guide includes the after-tax termination-fee benefit; normalized FCF runs closer to $11 billion.
From this we lock the 2026 normalized base:
Metric | 2026 normalized base |
|---|---|
Revenue | $51.2B |
Subscription revenue | $48.0B |
Advertising revenue | $3.0B |
Other and adjacent revenue | $0.2B |
Normalized operating margin | 32.0% |
Normalized operating income | $16.4B |
Normalized net income | $13.6B |
Average diluted shares | ~4.25B |
Normalized EPS | $3.21 |
Normalized free cash flow | $11.0B |
Cash | $12.3B |
Debt | $14.4B |
Net debt | ~$2.1B |
Two adjustments deserve explicit labels. First, the termination fee is excluded entirely from normalized earnings and normalized cash flow. Second, the 32.0% margin is a model adjustment, not management guidance: the official guide is 31.5%, and we remove approximately $275 million of acquisition-related expenses to reflect the recurring cost base.
The balance sheet needs little commentary. Roughly $2.1 billion of net debt against $16 billion of operating income is close to irrelevant as a solvency matter. The binding financial constraint at Netflix is not leverage. It is the $24 billion content obligation stack described in Section 5, which fixes a large share of spending regardless of how the next two years unfold.
Every scenario in this report grows from this base.
10. Building the 2030 Revenue Model
Netflix revenue in 2030 is the sum of three streams, each modeled separately: subscriptions, advertising, and adjacent products.
Subscription revenue follows a simple identity: average paid memberships, multiplied by monthly subscription revenue per membership, multiplied by 12. Both terms move, and the interaction between them defines the scenarios.
Variable | Stress | Bear | Base | Bull |
|---|---|---|---|---|
2030 paid memberships | 355M | 370M | 398M | 430M |
Monthly subscription revenue per membership | $13.45 | $13.60 | $14.34 | $15.21 |
2030 subscription revenue | $57.3B | $60.4B | $68.5B | $78.5B |
The base case asks for mature but healthy growth on both axes: continued international penetration, periodic price increases, paid-sharing and extra-member monetization, better economics in developing regions, and some mix pressure from ad-supported plans holding monetization growth to a moderate pace. It requires members and monetization together. A pricing-only story stalls, and a volume-only story dilutes; the model deliberately depends on neither alone.
A useful external cross-check exists here. The Wall Street Journal has reported internal Netflix ambitions of roughly $78 billion of 2030 revenue, $9 billion of advertising revenue, and approximately 410 million memberships. Those are reported internal goals, not public guidance, and we treat them only as a reference point. Our base case lands at 398 million memberships and, as shown below, $8.5 billion of advertising: slightly more conservative than the company's reported ambitions on both counts.
Advertising is the second stream:
Scenario | 2030 advertising revenue | Approximate 2026 to 2030 CAGR |
|---|---|---|
Stress | $5.5B | 16% |
Bear | $6.2B | 20% |
Base | $8.5B | 30% |
Bull | $11.5B | 40% |
Note what the stress case says: even in a genuinely bad outcome, advertising still nearly doubles from 2026. That is how strong the current trajectory is. The base case asks for 30% compound growth, demanding but consistent with the country expansion, live inventory, and advertiser adoption documented in Section 3.
Adjacent revenue, games, channels, live experiences, licensing, and consumer products, is modeled with deliberate restraint:
Scenario | 2030 adjacent revenue |
|---|---|
Stress | $0.2B |
Bear | $0.4B |
Base | $1.0B |
Bull | $2.0B |
The restraint is a methodological choice, not pessimism. Most of the value from games, live, and channels already flows through the model via retention, pricing tolerance, engagement, and advertising inventory. Stacking aggressive standalone revenue on top of those benefits would count the same value twice.
The three streams combine into the 2030 revenue picture:
Scenario | Total 2030 revenue | Revenue CAGR from 2026 |
|---|---|---|
Stress | $63.0B | 5.3% |
Bear | $67.0B | 6.9% |
Base | $78.0B | 11.1% |
Bull | $92.0B | 15.8% |
The base case, $78 billion at an 11.1% compound rate, describes a company that keeps doing what it is currently doing, slightly less well than management privately hopes. That is the standard we want a central forecast to meet.
11. Advertising Economics
Headline ad revenue is the number that gets quoted. Contribution is the number that gets paid. This section converts one into the other.
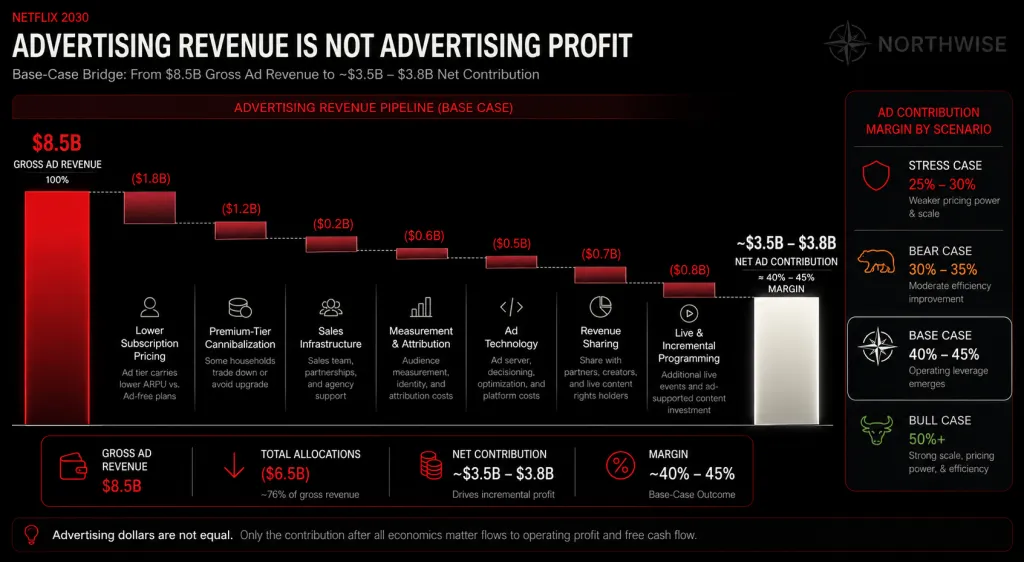
Advertising revenue at Netflix arrives carrying five categories of cost. Direct sales, measurement, and attribution infrastructure. Ad technology and programmatic integrations. Revenue-sharing agreements with partners. Incremental programming built partly for inventory, live events above all. And the quietest cost of the group: cannibalization, the revenue surrendered when members who would have paid for premium tiers instead sit on the cheaper ad plan, plus the lower plan price itself.
Netting those against gross ad revenue produces the contribution margins used in the model:
Scenario | Net advertising contribution margin |
|---|---|
Stress | 25% to 30% |
Bear | 30% to 35% |
Base | 40% to 45% |
Bull | 50% or higher |
In the base case, roughly $8.5 billion of gross advertising revenue converts to approximately $3.5 to $3.8 billion of net contribution. That is a material addition to operating income, and it is nowhere near the "every ad dollar is pure margin" arithmetic that circulates in bullish commentary.
The scaling logic behind the margin progression is standard for advertising businesses. The technology, measurement, and sales infrastructure is substantially fixed; once built, each incremental ad dollar carries less cost. Cannibalization also fades as a proportional drag as the ad tier shifts from converting existing premium members to acquiring households who were never going to pay full price. The stress and bear cases assume that scaling stalls, leaving Netflix with subscale ad infrastructure and persistent plan-mix pressure.
One discipline governs this entire section and everything downstream: advertising gets credited once. It appears in revenue, and it appears in the margin bridge through its net contribution. It does not then also justify a higher terminal multiple on top. Optimism stacking, letting the same driver inflate revenue, margins, and valuation simultaneously, is how forecasts drift $30 above reality, and it is the single most common error in published Netflix models.
12. The Margin and Free-Cash-Flow Bridge
The normalized 2026 base sits at a 32.0% operating margin. The scenarios diverge from there:
Scenario | 2030 operating margin | 2030 operating income |
|---|---|---|
Stress | 29.0% | $18.3B |
Bear | 31.0% | $20.8B |
Base | 36.0% | $28.1B |
Bull | 39.5% | $36.3B |
The bridge from 32% to the base case 36% runs through four sources of leverage. Advertising contributes its net margin as described above. Content amortization grows slower than revenue, the core scale advantage of a fixed-cost content model. Technology and corporate costs leverage as the platform scales. Pricing and mix add the remainder. Pulling against all of it: continued investment in games, live programming, and channels, plus whatever competitive content escalation YouTube, Amazon, and Meta force.
The stress case at 29% describes those pressures winning: weak ad contribution, content inflation, soft pricing, and poor returns on new initiatives compressing margins below today's level. The bear case at 31% describes a stalemate, a strong and profitable company whose leverage is fully consumed by content costs and competition. The bull case at 39.5% requires nearly everything to go right and should be read as an excellent-execution outcome, not a default.
Operating income still is not cash, and at Netflix the distance between the two is where valuations go wrong. The bridge runs: net income, plus content amortization, minus cash content spending, plus other depreciation and stock compensation, minus capital expenditure and working capital.
The dominant term is the one introduced in Section 5, the ratio of cash content spending to amortization:
Metric | Stress | Bear | Base | Bull |
|---|---|---|---|---|
Cash content spend / amortization | 1.12x | 1.09x | 1.04x | 1.02x |
Free cash flow | $11.1B | $13.5B | $22.5B | $30.5B |
FCF margin | 17.6% | 20.1% | 28.8% | 33.2% |
Study the spread for a moment. Stress-case FCF of $11.1 billion sits essentially at the 2026 normalized level, four years of zero cash progress. Base-case FCF of $22.5 billion doubles it. The difference comes only partly from revenue and margin; a large share comes from that ratio compressing from 1.12x toward 1.04x as the content slate matures relative to the revenue base.
This is why the report keeps insisting on the distinction between amortization and cash spending, and why the valuation framework in Section 16 refuses to price Netflix on earnings alone. A Netflix that earns well and converts poorly is a much cheaper stock than its P/E suggests. A Netflix that converts at 1.02x is considerably more valuable than the same P/E implies.
13. Capital Allocation and Share Repurchases
The final input to per-share value is the denominator, and Netflix's share count in 2030 is a direct function of the cash the business generates and management's priorities for deploying it.
Those priorities, in order: core content and product investment, liquidity, debt management, selective acquisitions and strategic investment, then share repurchases. Netflix repurchased roughly $9.1 billion of stock in 2025 and resumed buybacks after collecting the Warner termination fee, so the commitment to returning excess cash is demonstrated, not hypothetical.
The Warner episode itself is the best available evidence on acquisition discipline. Management pursued a transformative deal it found attractive, refused to chase a higher competing bid, and walked away $2.8 billion richer. A team willing to attempt an acquisition of that scale will consider others, so the model does not assume a future of buybacks-only capital allocation. It carves out an acquisition reserve, a strategic investment reserve, debt repayment, and minimum liquidity before a single dollar reaches repurchases, and it nets ongoing stock-compensation dilution against buyback activity.
What remains after those claims produces the locked share counts:
Scenario | 2030 diluted shares |
|---|---|
Stress | 4.14B |
Bear | 4.12B |
Base | 3.98B |
Bull | 3.88B |
The mechanics matter more than the specific figures. Share count here is an output of cash generation, never an independent lever. In the stress case, $11 billion of annual FCF funds only modest repurchases after reserves, and dilution offsets much of the effort, so the count barely moves from today's 4.25 billion. In the base case, cumulative free cash flow supports meaningful retirement down to 3.98 billion. The model refuses the common shortcut of assuming aggressive buybacks to flatter EPS: a forecast that needs a shrinking denominator to work is a forecast that does not work.
14. Netflix Stock Forecast 2030 Stress, Bear, Base, and Bull Scenarios
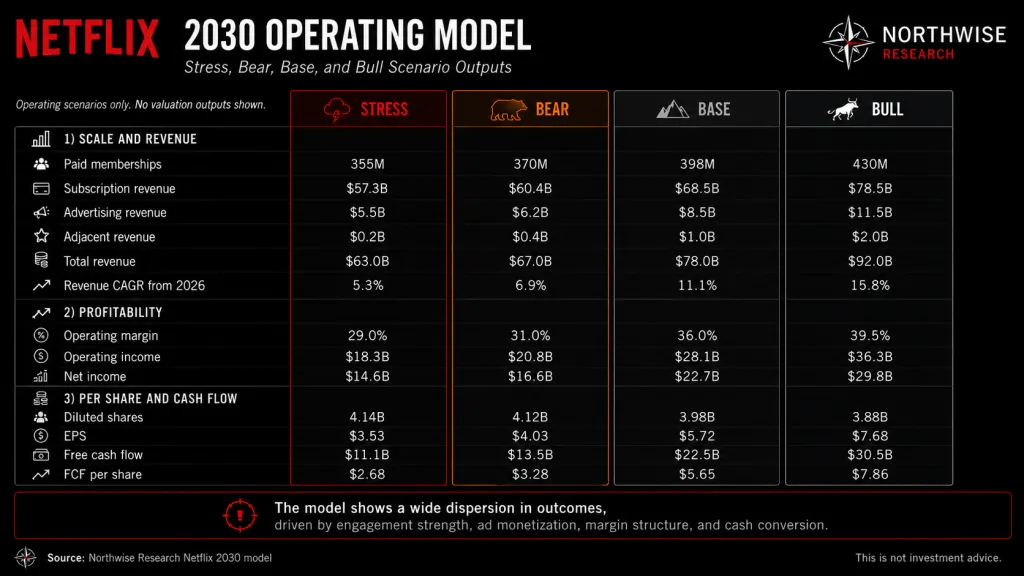
The complete 2030 operating model:
Metric | Stress | Bear | Base | Bull |
|---|---|---|---|---|
Paid memberships | 355M | 370M | 398M | 430M |
Subscription revenue | $57.3B | $60.4B | $68.5B | $78.5B |
Advertising revenue | $5.5B | $6.2B | $8.5B | $11.5B |
Adjacent revenue | $0.2B | $0.4B | $1.0B | $2.0B |
Total revenue | $63.0B | $67.0B | $78.0B | $92.0B |
Revenue CAGR from 2026 | 5.3% | 6.9% | 11.1% | 15.8% |
Operating margin | 29.0% | 31.0% | 36.0% | 39.5% |
Operating income | $18.3B | $20.8B | $28.1B | $36.3B |
Net income | $14.6B | $16.6B | $22.7B | $29.8B |
Diluted shares | 4.14B | 4.12B | 3.98B | 3.88B |
EPS | $3.53 | $4.03 | $5.72 | $7.68 |
Free cash flow | $11.1B | $13.5B | $22.5B | $30.5B |
FCF per share | $2.68 | $3.28 | $5.65 | $7.86 |
Each scenario describes a coherent world, and the differences between them come down to which combination of conditions holds.
The stress case requires several failures to arrive together: viewing per member declines materially, advertising underperforms its trajectory, price increases trigger persistent churn, content spending stays elevated at 1.12x amortization, new initiatives return poorly, and connected-TV share slips. Even then, Netflix earns $14.6 billion and generates $11 billion of cash. This is a deterioration in the quality of growth and cash conversion, not a collapse, and certainly not a solvency event.
The bear case needs no failure at all, only faster maturity. Membership growth slows, advertising scales at moderate profitability, content inflation absorbs most operating leverage, and pricing weakens without breaking. Netflix in the bear case remains a strong, growing, highly profitable company. That distinction carries directly into the multiples in Section 16.
The base case is the continuation scenario: mature membership growth, monetization improving through pricing and mix, advertising reaching $8.5 billion, content spending growing slower than revenue, margins reaching 36%, and buybacks working down the share count. Nothing in it requires reinvention. All of it requires sustained execution.
The bull case asks for alignment: advertising becomes a large high-margin business, per-member viewing stabilizes or improves, channels lift passive viewing, live events feed acquisition and inventory, content economics improve materially, and margins approach 40%. Netflix does not become a different company in the bull case. Its existing advantages simply compound unusually well, simultaneously, for four years.
15. Probability Weighting
Scenario | Probability |
|---|---|
Stress | 8% |
Bear | 20% |
Base | 52% |
Bull | 20% |
These weights come out of an evidence framework, with each category weighted by its influence on the 2030 outcome:
Category | Weight |
|---|---|
Engagement | 18% |
Membership growth | 15% |
Advertising | 15% |
Content economics | 13% |
Pricing power | 12% |
Competition | 12% |
Capital allocation | 10% |
Adjacent products | 5% |
Engagement carries the largest single weight, consistent with everything Section 4 established: it is the variable with the least visibility and the widest blast radius.
Stress receives only 8% due to the sheer number of independent supports under the business. Revenue is still growing at double-digit rates, advertising provides a second engine on a steep trajectory, pricing remains available, the balance sheet is unstressed, and management has shown it can adapt the content and product mix. A scenario requiring five or six of those supports to fail simultaneously deserves respect, not centrality.
Bear and bull receive equal weight deliberately. Netflix has genuine upside optionality in advertising, live, and channels, and it starts from an extraordinary level of scale and profitability with more competitors attacking attention and ad budgets than ever before. Extreme upside requires several favorable variables to align at once. Moderate disappointment requires nothing to break at all. Symmetry at 20% reflects that balance honestly.
Base earns its 52% by demanding the least. It asks for the most ordinary continuation of present trends, no deterioration, no exceptional execution. When the central scenario is also the lowest-assumption scenario, a majority weight is justified.
Northwise Premium
Choose how to continue with Northwise
Join Northwise Premium
Unlock the rest of this report, its complete valuation, the downloadable model, portfolios, and action framework.
Join Northwise PremiumCreate a Free Account
Continue across Free Northwise research, follow companies, save reports, and receive updates.
Create a Free Account
Celsius Stock Analysis: The Shelf Reset and the Second Growth Curve
Celsius stock analysis of the shelf reset, Alani growth, Pepsi economics and cash flow, with a 2030 model and a Premium valuation and entry-price framework.

Meta AI Spending: The Customer Is Already Here
Can Meta turn AI spending into shareholder returns? We model advertising, Muse, hardware, capital costs and cash flow through 2030, with a full valuation.

IREN Stock Dilution: Can the Build Reach Shareholders?
IREN stock analysis of AI growth, funding and dilution through 2030. Read our full valuation, 27 scenarios and price zones free. Excel model is Premium.
Northwise Portfolios
See how the research becomes real decisions
Reader discussion
Discuss the research
Premium access is required to join this report's discussion.
Join Northwise Premium
No comments yet. Start a thoughtful discussion.