
Jumia Stock Forecast 2030
A jumia stock forecast analyzing logistics economics, cash constraints, and 2030 price ranges across bear, base, and bull cases.
In this article
A full structural reset of our long-term Jumia stock forecast following Jumia’s 2025 inflection, integrating operating leverage, geographic discipline, and strategic optionality across Africa.
Executive Summary
Jumia exits 2025 in a fundamentally different position than it held entering 2023. The contraction cycle is nearing the end of its course. The cost base has been rationalized. The balance sheet has stabilized. Growth has re-accelerated.
Full year 2025 revenue reached 188.9M, up 13% year over year. GMV reached 818.6M, up 14%. Adjusted EBITDA loss narrowed to negative 50.5M, while operating loss improved to negative 63.2M. Cash stood at 77.8M. Net operating cash burn fell to 47.9M.
The inflection becomes more visible in the fourth quarter.
Q4 GMV grew 36% year over year. Revenue grew 34%. Adjusted EBITDA loss narrowed to negative 7.3M. Working capital contributed positively in the quarter. Nigeria delivered 50% GMV growth. Egypt’s marketplace business grew 56% excluding corporate sales. International seller penetration increased 82% year over year.
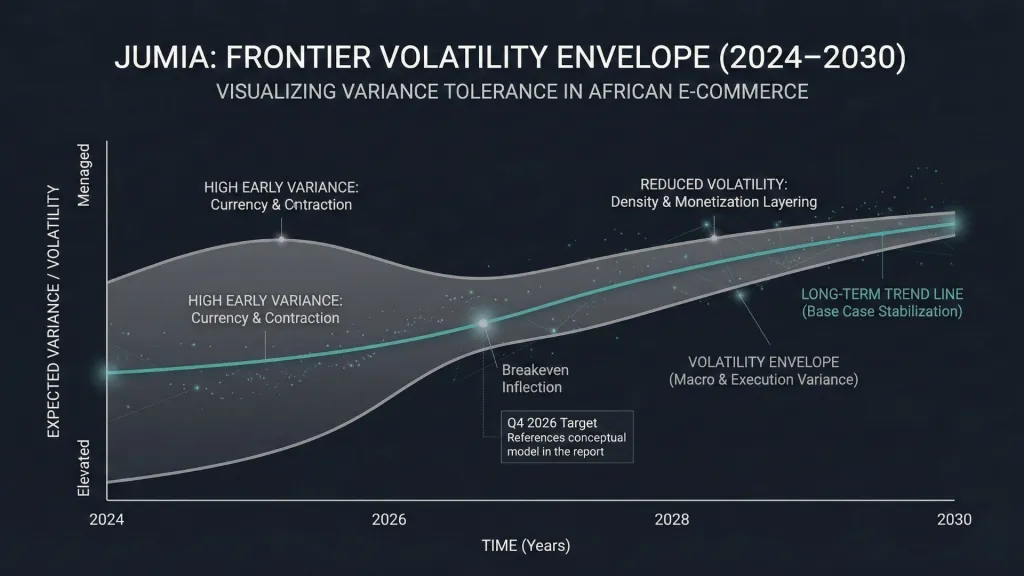
The company is targeting EBITDA breakeven by Q4 2026.
The geographic footprint is leaner. South Africa and Tunisia have been exited. Algeria will be fully shuttered by Q1 2026, removing structural fiscal friction. Corporate Egypt has been deprioritized in favor of higher-quality marketplace revenue. The operating focus is concentrated on eight core markets where logistics density and route optimization can compound.
At the same time, the monetization stack is strengthening. International sourcing through Yiwu and Shenzhen now supports 24,000 active Chinese sellers and 2.2M SKUs positioned within African warehouses. Advertising currently represents roughly 1% of GMV, with management targeting 2% by 2030 following the launch of a sponsored products platform in early 2026. JumiaPay has shifted from standalone ambition to embedded checkout infrastructure, with Q4 total payment volume reaching 81.4M.
The revised 2030 framework incorporates these developments.
We model disciplined GMV expansion anchored in Nigeria and Egypt, incremental take rate improvement driven by advertising and international sourcing leverage, and margin expansion as fulfillment density improves. We assume Tanzania reentry between 2028 and 2029 following balance sheet repair, and Ethiopia entry strictly through a 3PL model to avoid high acquisition burn.
We also analyze strategic optionality. A profitable, logistics-dense Jumia platform would represent immediate African infrastructure exposure for global operators seeking geographic expansion without a decade-long learning curve.
The objective of this report is not to project linear growth. It is to evaluate whether Jumia has crossed from survival into structural viability, and what that transition implies for long-term capital allocation through 2030.
1. Executive Reset
1.1 The End of Contraction
1.2 What Changed Since the Prior 2030 Model
1.3 Why This Reset Matters Now
2. From Survival to Structure
2.1 The 2023–2025 Contraction Phase
2.2 Q4 2025 Inflection and Growth Re-Acceleration
2.3 Burn Compression and the Break-Even Path
2.4 The Capital Discipline Pivot
3. The Structural Africa Backdrop
3.1 Currency Normalization and Inflation Stabilization
3.2 Smartphone and Digital Payment Penetration
3.3 Government Infrastructure Alignment
3.4 Competitive Landscape and Cross-Border Risk
4. The China Sourcing Advantage
4.1 Yiwu and Shenzhen Direct Pipeline
4.2 24,000 Active Chinese Sellers and 2.2M SKUs
4.3 Warehouse Positioning and Landed Cost Reduction
4.4 International Seller Penetration and Margin Implications
5. The Monetization Stack
5.1 Marketplace Commission Evolution
5.2 Advertising Expansion from 1% to 2% of GMV
5.3 Sponsored Products Platform (2026 Launch)
5.4 JumiaPay as Embedded Checkout Infrastructure
5.5 Fintech Integration and Conversion Leverage
6. The Operating Nucleus: Core Market Architecture
6.1 Nigeria: The Operating Engine
6.1.1 50% Q4 GMV Growth
6.1.2 Lagos 30,000 sqm Central Warehouse
6.1.3 61% Secondary City Penetration
6.1.4 Route Density and Upcountry Leverage
6.2 Egypt: Engineering and Marketplace Core
6.2.1 56% Marketplace GMV Growth ex-Corporate
6.2.2 Technology Hub Function
6.2.3 BNPL Penetration and Basket Expansion
6.3 Kenya: Volume Growth and Regulatory Variable
6.3.1 50% Order Growth
6.3.2 VAT Exposure and Margin Sensitivity
6.4 Ivory Coast: The Efficiency Benchmark
6.4.1 351 Pickup Stations
6.4.2 CFA Peg Stability
6.4.3 Asset-Light Logistics Blueprint
6.5 Ghana: The Velocity Market
6.5.1 124% Constant Currency GMV Growth
6.5.2 SKU Focus and Cost Discipline
6.6 Uganda: The Satellite Proof Point
6.6.1 Shared Kenya Corridor Infrastructure
6.6.2 50% Electric Fleet
6.6.3 Disciplined Unit Economics
6.7 Morocco: High-Yield Basket Market
6.8 Senegal: Rural Demand Elasticity Laboratory
7. Strategic Pruning: The Algeria Exit
7.1 Fiscal Inversion and 30% Gross Withholding Tax
7.2 Import Forecast Programme Rigidity
7.3 2% GMV Contribution Reality
7.4 One-Time Closure Costs vs Permanent Risk Removal
8. 2030 Expansion Vector
8.1 Tanzania Reentry (2028–2029)
8.1.1 Mobile Money Saturation
8.1.2 East African Corridor Integration
8.1.3 24-Month Contribution Margin Ramp
8.2 Ethiopia Entry via 3PL
8.2.1 120M Consumer Base
8.2.2 $10M Import Threshold Constraint
8.2.3 Service-Fee Model vs B2C Burn
8.2.4 Capital-Light Expansion Logic
9. Structural Growth Drivers Through 2030
9.1 GMV Expansion Path
9.2 Take Rate Expansion Mechanics
9.3 Advertising Contribution
9.4 Logistics Leverage Curve
9.5 Margin Structure Evolution
10. Strategic Optionality: Why Jumia Could Be Acquired
10.1 What a Profitable Jumia Represents
10.2 Why Amazon Could Be Interested
10.3 Why MercadoLibre Could Be Interested
10.4 Why Coupang or SEA Could Consider Entry
10.5 Regulatory and Execution Barriers to Acquisition
11. Capital Structure and Dilution Risk
11.1 Cash Position and Burn Trajectory
11.2 Break-Even Timing (Q4 2026 Target)
11.3 No-Equity Raise Assumption
11.4 Explicit Thesis Break Conditions
12. Financial Model (2026–2030)
12.1 GMV Scenarios
12.2 Take Rate Scenarios
12.3 Revenue Build by Case
12.4 Margin Ramp Modeling
12.5 Net Income and Cash Flow
13. Jumia Stock Forecast Scenario Outcomes
13.1 Bear Case
13.2 Base Case
13.3 Bull Case
13.4 Acquisition Case
14. Probability Matrix and Weighted 2030 Price Target
14.1 Scenario Weightings
14.2 Weighted Output Calculation
14.3 Sensitivity Analysis
15. Present Value Analysis
15.1 Discounting to 2026
15.2 IRR Implications
15.3 Expected Value Distribution
16. Margin of Safety Framework
16.1 Strong Buy Range
16.2 Accumulation Range
16.3 Hold Range
16.4 Trim Range
16.5 Sell Range
17. Northwise Positioning
17.1 Current Allocation Reality
17.2 What Price Would Trigger Re-Entry
17.3 Portfolio Role and Concentration Logic
18. Final Northwise Synthesis
18.1 What Jumia Actually Is
18.2 Where the Market Is Mispricing Risk
18.3 What Would Invalidate the Thesis
18.4 Closing Capital Allocation View
1. Executive Reset
1.1 The End of Contraction
Jumia entered 2023 carrying infrastructure built for a volume profile that had not yet arrived. The business spanned too many geographies, fixed costs ran ahead of order density, and currency volatility amplified reported losses across key markets. What followed between 2023 and 2025 was a deliberate compression phase designed to realign the operating base with realistic African e-commerce penetration.
The contraction was geographic and structural.
South Africa and Tunisia were exited. Corporate sales in Egypt were deprioritized. Algeria was ultimately closed. Headcount was reduced. Warehouse footprint was rationalized. Delivery routes were redesigned around density rather than reach. The objective shifted from top-line signaling to contribution margin integrity.
Order density became the organizing principle.
In Nigeria, secondary city penetration rose to 61% of orders, improving route efficiency and lowering cost per drop. Ivory Coast scaled to 351 pickup stations, reinforcing an asset-light last-mile model in CFA-pegged currency territory. Ghana delivered 124% GMV growth in constant currency during the period of contraction, demonstrating that discipline did not require volume abandonment. Uganda integrated into the Kenya corridor with a 50% electric delivery fleet, lowering fuel exposure and operating variance.
This was not retrenchment in the traditional sense. It was recalibration. The business traded short-term GMV acceleration for cost compression and balance sheet durability.
By late 2025, the operating base was visibly lighter and structurally tighter. International seller penetration increased 82% year over year in Q4, shifting mix toward higher-margin cross-border inventory. Upcountry logistics leverage began to surface as route density improved. Working capital dynamics turned constructive during the fourth quarter as inventory turnover stabilized and vendor terms normalized.
The contraction phase functioned like resetting the foundation before adding additional floors. It reduced the probability of forced capital raises, stabilized corridor economics, and concentrated capital allocation around markets that already demonstrated demand elasticity.
The model that follows assumes the contraction phase is complete. Expansion vectors are layered only after profitability milestones are approached, preserving the discipline built during compression.
1.2 What Changed Since the Prior 2030 Model
The prior 2030 framework was constructed during stabilization. Growth assumptions reflected cautious normalization, and monetization layers were modeled conservatively while burn remained elevated.
Three structural developments justify the reset.
First, growth re-acceleration arrived faster than anticipated. Q4 GMV expanded 36% year over year, materially above the glide path embedded in the prior model. Nigeria reported approximately 50% GMV growth in Q4. Egypt marketplace GMV, excluding corporate sales, expanded 56%. Kenya delivered 50% order growth. These figures represent broad-based acceleration across the operating nucleus rather than isolated strength.
Second, monetization layering strengthened. Advertising remains approximately 1% of GMV, with a credible path toward 2% through 2030 as sponsored products launch in 2026 and seller tools mature. International sourcing direct from Yiwu and Shenzhen expanded SKU breadth to roughly 2.2 million SKUs across 24,000 active Chinese sellers. This sourcing shift reduces landed costs and improves gross margin mix without headline commission increases.
Third, the capital discipline pivot lowered structural risk. Net operating cash burn for 2025 compressed to $47.9M, down materially from prior years. Adjusted EBITDA losses narrowed sharply through 2025, with break-even targeted for Q4 2026. The probability of near-term equity dilution decreased as liquidity runway extended.
The revised GMV growth curves reflect these shifts.
Base Case GMV Growth Path:
Year | GMV Growth |
|---|---|
2026 | 30% |
2027 | 28% |
2028 | 22% |
2029 | 18% |
2030 | 15% |
This trajectory produces approximately $3.0B in GMV by 2030.
Take rate assumptions were also revised upward to reflect monetization stacking.
Base Case Take Rate Progression:
Year | Take Rate |
|---|---|
2025 | ~23% |
2026 | 24% |
2027 | 25% |
2028 | 26% |
2029 | 26.5% |
2030 | 27% |
This remains below MercadoLibre’s long-term 30%–35% range, preserving conservatism relative to global peers.
The reset integrates Tanzania re-entry beginning 2027 and Ethiopia 3PL expansion beginning 2027 as capital-light corridor extensions rather than speculative land grabs. No broad multi-country expansion is assumed prior to breakeven.
The changes reflect operating evidence rather than narrative enthusiasm.
1.3 Why This Reset Matters Now
Valuation inflection points tend to occur during classification shifts rather than during linear growth periods. Jumia spent two years trading as a contraction story characterized by liquidity risk and structural uncertainty. That framework anchored valuation multiples at distressed levels.
The current reset positions Jumia within a different analytical category.
By 2026, the business is modeled to approach EBITDA break-even with re-accelerating GMV, expanding take rates, rising advertising penetration, and corridor-level operating leverage. If achieved, the equity transitions from funding risk to infrastructure optionality.
Africa remains structurally underpenetrated in e-commerce relative to global benchmarks. Smartphone penetration continues rising across core markets. Digital payment normalization is advancing. Government support for technology infrastructure is increasingly visible across Nigeria, Egypt, Kenya, and francophone West Africa. The competitive field has thinned as asset-light import models encounter regulatory friction and logistics limitations.
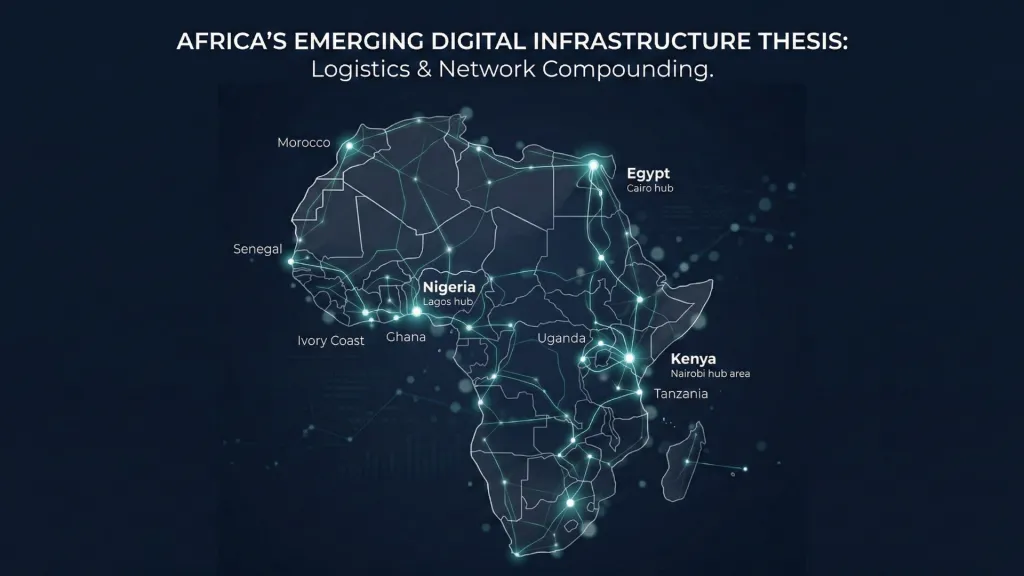
Within that backdrop, Jumia operates as the only scaled, multi-market, logistics-integrated platform with demonstrated route density and localized regulatory alignment.
The upside embedded in the 2030 framework is driven by re-rating rather than pure volume expansion. As the market recognizes durability in corridor economics and monetization layers mature, valuation multiples converge toward platform peers rather than distressed retailers.
The reset marks the transition from survival to structural compounding.
2. From Survival to Structure
2.1 The 2023–2025 Contraction Phase
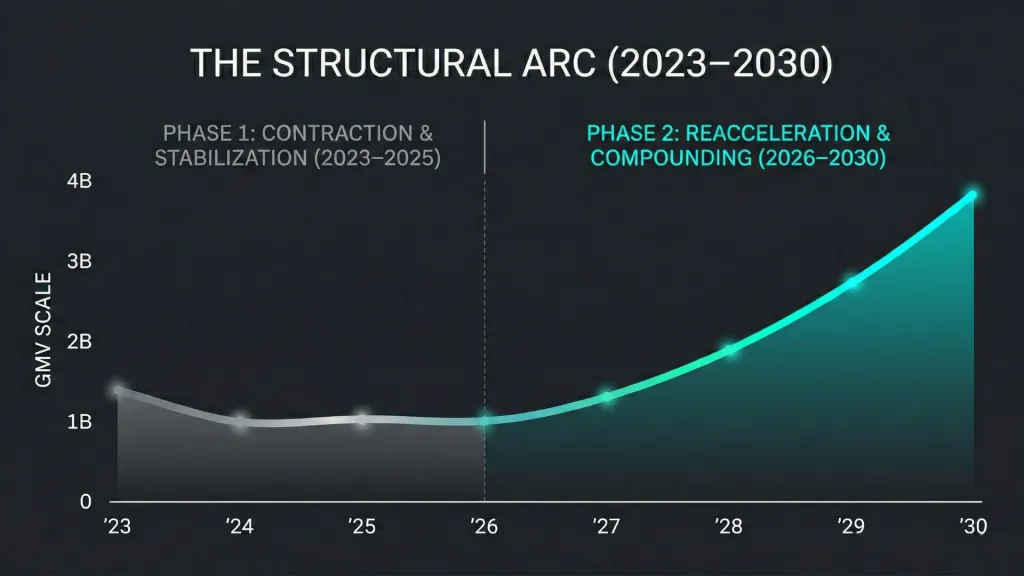
The period from 2023 through 2025 functioned as Jumia’s structural reset. The company moved from geographic sprawl toward corridor concentration, from headline GMV to contribution margin integrity, and from growth signaling to balance sheet preservation.
At its peak expansion, Jumia operated across a wide footprint with uneven order density. Fixed warehouse costs, cross-border import friction, and currency volatility created negative operating leverage. When macro pressure intensified across Africa through inflation spikes and FX devaluations, those structural imbalances became visible in reported losses.
Management responded with a coordinated contraction:
- Exit of South Africa and Tunisia
- Algeria wind-down following fiscal friction
- Deprioritization of corporate sales in Egypt
- Headcount reduction and cost base simplification
- Warehouse footprint rationalization
- Route density optimization in core markets
The contraction phase did not reduce demand elasticity in core corridors. Instead, it exposed which markets already had sufficient order frequency to sustain scaled infrastructure.
Nigeria consolidated as the operating engine. Egypt retained dual roles as revenue contributor and engineering hub. Ivory Coast demonstrated that pickup-heavy logistics in CFA-pegged currency zones could generate stable unit economics. Ghana, Kenya, and Uganda continued scaling under tighter cost control.
The objective during this period was structural survival.
A simplified illustration of the reset logic:
Phase | Focus | Risk Profile |
|---|---|---|
Pre-2023 | Geographic expansion | High burn, high volatility |
2023–2025 | Corridor concentration | Lower burn, operational discipline |
Post-2025 | Density compounding | Monetization leverage |
The contraction phase resembled tightening the bolts of a bridge before increasing traffic load. Expansion would only resume after structural reinforcement.
By late 2025, the operating base was smaller in footprint yet stronger in density. That distinction defines the transition into the next phase.
2.2 Q4 2025 Inflection and Growth Re-Acceleration
Q4 2025 represented a visible shift from compression toward re-acceleration.
GMV expanded 36% year over year in Q4. Revenue grew 34%. Growth was not isolated to a single geography.
Nigeria recorded approximately 50% GMV growth. Egypt’s marketplace GMV excluding corporate sales expanded 56%. Kenya delivered 50% order growth. International seller penetration increased 82% year over year, materially expanding SKU depth and cross-border sourcing leverage.
This pattern suggests that the contraction phase did not impair demand. It concentrated it.
Secondary city penetration in Nigeria reached 61% of orders, improving route density and reducing per-delivery costs. In Ivory Coast, 351 pickup stations provided an asset-light last-mile architecture. Uganda integrated into Kenya’s logistics corridor while operating a 50% electric fleet, moderating fuel exposure.
Growth re-acceleration under a lighter cost structure creates a different financial slope than growth layered on top of an inflated infrastructure base.
The inflection is visible in operating momentum:
Metric | Q4 2025 |
|---|---|
GMV Growth | +36% YoY |
Revenue Growth | +34% YoY |
Nigeria GMV Growth | ~50% YoY |
Egypt Marketplace GMV Growth | +56% YoY |
International Seller Growth | +82% YoY |
The operating nucleus began generating organic acceleration without broad geographic expansion. That dynamic supports the revised GMV curves embedded in the 2030 framework.
2.3 Burn Compression and the Break-Even Path
Operating burn defines survival risk in emerging-market commerce platforms. Between 2023 and 2025, Jumia’s most important financial shift occurred in cash discipline rather than revenue growth.
Net operating cash burn for 2025 closed at $47.9M. Adjusted EBITDA loss narrowed sharply, with Q4 loss at -$7.3M. Working capital contribution turned positive in the fourth quarter, reflecting improved inventory cycles and vendor payment dynamics.
The burn compression trajectory can be summarized:
Year | Net Operating Burn | Adjusted EBITDA Trend |
|---|---|---|
2023 | Elevated | Deeply negative |
2024 | Reduced | Improving |
2025 | $47.9M | Near break-even in Q4 |
The 2030 model assumes EBITDA break-even by Q4 2026. This milestone anchors several structural assumptions:
- Expansion resumes only after profitability visibility
- No equity raise before 2027
- Take rate expansion supported by advertising and payments layering
- Fixed cost absorption improves as GMV compounds
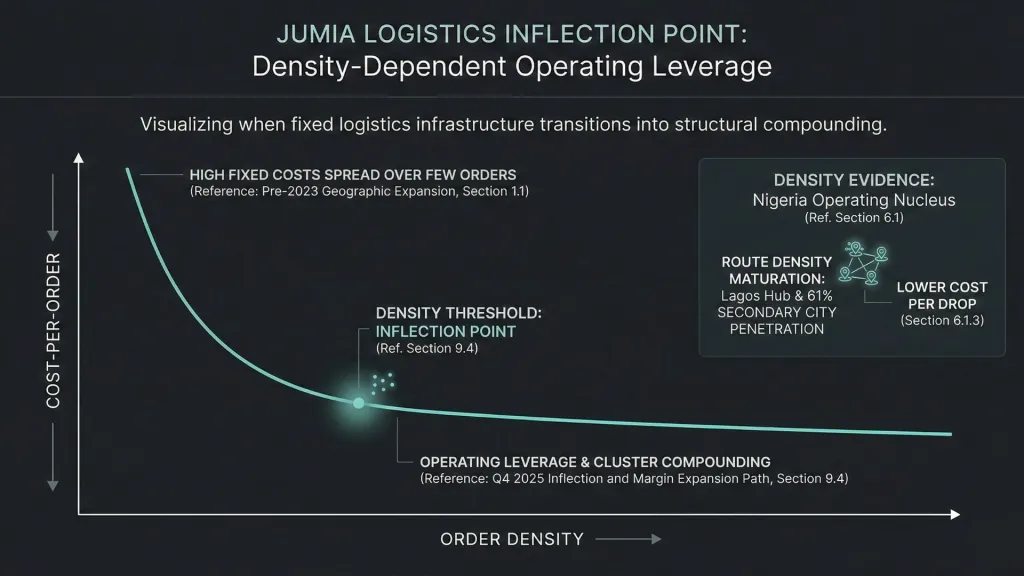
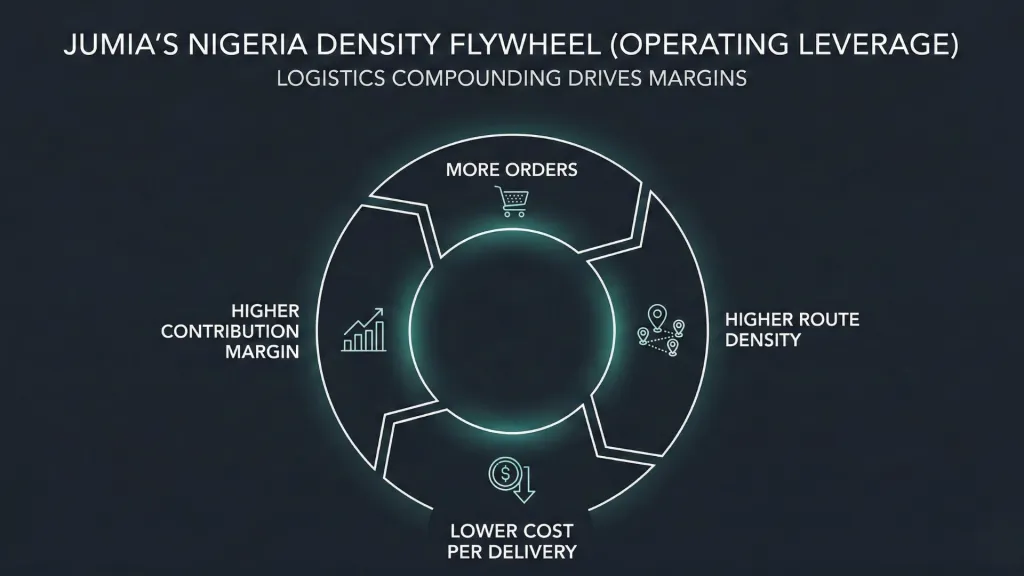
Operating leverage behaves like a flywheel once density thresholds are crossed. Fulfillment infrastructure has high fixed components. As GMV grows within existing corridors, incremental contribution margin expands faster than revenue.
Break-even therefore functions as a structural pivot rather than a symbolic milestone. It lowers dilution risk, reduces valuation compression, and increases optionality for selective expansion.
2.4 The Capital Discipline Pivot
The most underappreciated shift between 2023 and 2025 was management’s capital allocation posture.
Earlier expansion cycles emphasized presence across multiple African markets. The reset period emphasized durability. Capital was allocated to route efficiency, technology infrastructure, and international sourcing pipelines rather than broad geographic entry.
Cash at year-end 2025 stood at $77.8M. Under the revised burn profile and modeled path to Q4 2026 EBITDA break-even, runway extends without assuming equity issuance.
The capital discipline framework embedded in this report rests on four pillars:
- No broad new-country expansion before profitability
- Tanzania re-entry modeled as phased corridor integration
- Ethiopia expansion via 3PL service model, minimizing inventory risk
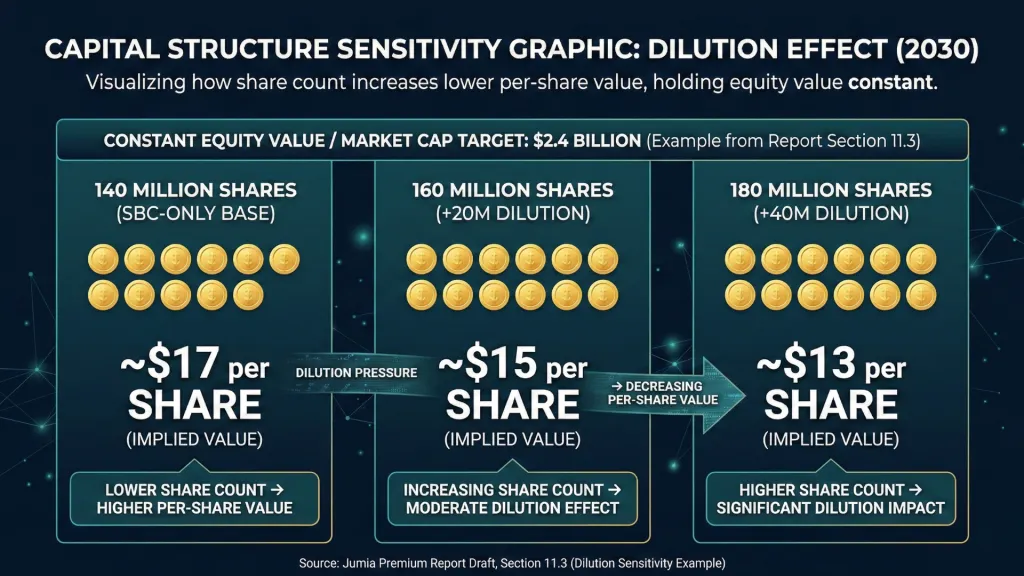
- Share count capped at 140M by 2030 under SBC-only dilution
Explicit thesis break condition: any equity raise prior to sustained profitability invalidates the base case trajectory.
The discipline pivot transforms Jumia from a growth-at-all-costs experiment into a corridor-focused infrastructure platform. Capital allocation now resembles bridge construction rather than frontier exploration. Each new span is added only after the existing structure demonstrates load-bearing capacity.
The survival phase produced structural tightening. The structure phase introduces controlled compounding.
3. The Structural Africa Backdrop
3.1 Currency Normalization and Inflation Stabilization
African e-commerce does not scale in a vacuum. It scales within monetary regimes that have historically amplified volatility. Between 2022 and 2024, several of Jumia’s core markets experienced sharp currency devaluations and inflation spikes that distorted reported revenue and compressed consumer purchasing power.
Nigeria’s naira repricing cycle and Egypt’s pound adjustments were among the most visible. Those resets were painful in reported USD terms, yet they performed a necessary macro function: they cleared imbalances that had accumulated under administratively supported FX regimes.
By 2025, the currency shock cycle began transitioning toward normalization.
Inflation in key markets moderated from peak levels. Local currency pricing stabilized. Import pipelines adjusted to new FX baselines. For Jumia, this environment improves two structural dynamics:
- Predictability of GMV growth in local currency
- Stability of take rate expansion in reported USD
Marketplace platforms operate like bridges between consumer purchasing power and imported inventory. During FX dislocations, that bridge flexes violently. Once currencies reset and inflation moderates, pricing signals become clearer. Sellers adjust inventory rationally. Consumers regain planning visibility.
The model through 2030 assumes moderate macro stabilization rather than persistent devaluation cycles. A renewed collapse in core currencies would represent a thesis break condition.
3.2 Smartphone and Digital Payment Penetration
E-commerce density follows device penetration. Africa’s structural tailwind lies in rising smartphone adoption and digital wallet normalization.
Across Jumia’s core markets, smartphone penetration has moved steadily higher over the past decade. Urban Nigeria, Egypt, and Kenya now exhibit smartphone usage rates consistent with early-stage emerging-market e-commerce acceleration phases seen previously in Southeast Asia and Latin America.
Digital payment penetration is equally critical.
JumiaPay operates as embedded checkout infrastructure rather than a standalone fintech play. As mobile money systems mature across East and West Africa, friction in online checkout declines. Cash-on-delivery dependency gradually reduces. Conversion rates improve. Refund leakage decreases.
The compounding effect resembles adding lanes to a highway. Traffic does not increase merely because demand exists. It increases when throughput friction falls.
Key structural drivers:
- Expansion of 4G and early 5G coverage in major cities
- Mobile money saturation in East Africa
- Rising debit card penetration in North Africa
- Increasing regulatory acceptance of digital wallets
Through 2030, smartphone and payment penetration function as baseline enablers of GMV compounding. They do not guarantee growth, but they remove structural ceilings.
3.3 Government Infrastructure Alignment
African governments increasingly view digital commerce as infrastructure rather than novelty.
In Nigeria, policy emphasis on technology zones and digital taxation clarity improves operating predictability. Egypt continues positioning itself as a regional technology hub, reinforcing Jumia’s engineering base. CFA-pegged West African nations offer relative currency stability through euro linkage, reducing FX variance in Ivory Coast and Senegal.
Infrastructure alignment manifests in three ways:
- Logistics corridors: port modernization, road development, and customs digitization
- Digital ID and payment frameworks enabling formal commerce participation
- Regulatory clarity on cross-border imports and VAT structures
Platforms scale more efficiently when regulatory friction declines. Algeria’s fiscal inversion and 30% gross withholding tax illustrated the opposite condition. Its exit removed permanent structural drag.
Government alignment does not eliminate risk. It shifts probability distributions toward scalable frameworks.
3.4 Competitive Landscape and Cross-Border Risk
Africa’s competitive field differs from Southeast Asia or Latin America. The continent presents logistical fragmentation, currency variance, and regulatory complexity that discourage rapid asset-heavy expansion from global entrants.
Asset-light cross-border platforms relying on ultra-low-cost imports encounter friction in customs regimes, tax enforcement, and delivery reliability. High last-mile complexity in secondary cities raises customer acquisition costs beyond simple subsidy models.
Jumia’s advantage lies in physical infrastructure embedded within local markets:
- Central warehouses in Lagos and Cairo
- Pickup station density in francophone West Africa
- Integrated delivery fleets including electric vehicles in Uganda
- Established relationships with customs authorities
Cross-border risk persists in two directions:
- Foreign entrants attempting to undercut pricing without logistics depth
- Domestic regulatory shifts impacting import thresholds or digital taxation
The structural thesis assumes that durable multi-market logistics infrastructure retains value relative to pure marketplace arbitrage models.
E-commerce in Africa resembles building rail lines across uneven terrain. Lightweight traders can enter quickly, yet only operators with embedded rails sustain volume when terrain shifts.
The structural backdrop through 2030 supports controlled compounding. It does not eliminate volatility. It creates a landscape where disciplined platforms can scale without frontier-level existential risk.
The next sections translate this backdrop into monetization architecture.
4. The China Sourcing Advantage
4.1 Yiwu and Shenzhen Direct Pipeline
The structural advantage emerging inside Jumia’s model is upstream.
Over the past two years, the company deepened direct sourcing relationships in Yiwu and Shenzhen, two of the most dense export ecosystems in China. Yiwu functions as a global wholesale nerve center for small consumer goods. Shenzhen operates as a hardware and electronics manufacturing cluster with deep component supply chains.
Direct pipeline access compresses the traditional import stack.
Instead of layering African wholesalers between Chinese manufacturers and local sellers, Jumia integrates suppliers closer to the production origin. This reduces intermediary markups, improves product variety, and shortens restock cycles. Inventory can be curated with more granular pricing control, improving competitiveness without sacrificing margin.
The pipeline shift also improves SKU turnover predictability. High-velocity categories such as accessories, small electronics, home goods, and fashion benefit disproportionately from direct factory-level pricing.
In a marketplace model, sourcing leverage behaves like widening the base of a pyramid. The broader and cheaper the supply foundation, the more stable the pricing architecture above it.
4.2 24,000 Active Chinese Sellers and 2.2M SKUs
International seller penetration expanded meaningfully through 2025. Active Chinese sellers reached approximately 24,000, supporting roughly 2.2 million SKUs across the platform.
Scale at this level changes the marketplace mix.
More SKUs increase search relevance and basket expansion. Greater category depth improves conversion probability. Competitive pricing inside individual categories rises organically as seller density increases.
Illustrative structural impact:
Metric | Scale Level |
|---|---|
Active Chinese Sellers | ~24,000 |
Active SKUs | ~2.2M |
Q4 International Seller Growth | +82% YoY |
SKU density influences both GMV velocity and take rate resilience. A broader catalog allows Jumia to shift consumer demand toward higher-margin product mixes without visibly raising commission structures.
This sourcing network also enhances inventory optionality. Sellers can respond rapidly to localized demand signals in Nigeria, Egypt, Kenya, or Ghana without multi-layer import friction.
Marketplace depth resembles oxygen in a combustion engine. Without it, acceleration stalls.
4.3 Warehouse Positioning and Landed Cost Reduction
Upstream sourcing advantage translates into economics only when logistics positioning is optimized.
Jumia’s central warehouse footprint in Lagos and Cairo acts as the primary distribution anchors. Bulk importation into centralized nodes reduces per-unit freight costs compared to fragmented small-batch shipping directly into secondary cities.
Landed cost structure improves through three mechanisms:
- Consolidated container shipments from China into central hubs
- Bulk customs processing reducing administrative friction
- Route density from centralized warehouses into pickup and last-mile corridors
Secondary city penetration in Nigeria at 61% of orders amplifies this leverage. Higher order clustering lowers per-delivery cost. Ivory Coast’s 351 pickup stations provide asset-light last-mile coverage, reducing failed delivery rates and reverse logistics expense.
Warehouse positioning functions like gravity in the system. When infrastructure mass concentrates in the right nodes, marginal delivery cost falls naturally as volume scales.
This dynamic supports gradual take rate expansion without explicit commission increases. Gross margin mix improves as freight and fulfillment expense per order declines.
4.4 International Seller Penetration and Margin Implications
International seller penetration rising 82% year over year in Q4 represents more than catalog expansion. It reshapes margin architecture.
Direct Chinese sourcing improves:
- Gross margin mix through reduced intermediary markup
- Pricing competitiveness against informal import channels
- Inventory breadth without Jumia taking on working capital risk
As the seller base scales, advertising monetization becomes more viable. Sponsored listings and promoted product slots increase in value when competition for visibility intensifies. Advertising moving from approximately 1% of GMV toward 2% by 2030 is structurally supported by this seller density.
Take rate progression embedded in the base case reflects this layering:
Year | Take Rate (Base Case) |
|---|---|
2025 | ~23% |
2026 | 24% |
2027 | 25% |
2028 | 26% |
2029 | 26.5% |
2030 | 27% |
International sourcing therefore acts as both price stabilizer and margin enhancer.
The effect resembles widening the delta between consumer price and supplier cost while maintaining platform commission percentage stability. Margin improvement emerges from structural efficiency rather than overt monetization pressure.
This sourcing backbone supports the monetization stack described next.
5. The Monetization Stack
5.1 Marketplace Commission Evolution
Commission revenue remains the structural core of Jumia’s monetization architecture.
The platform’s implied take rate for 2025 sits near 23%. That figure reflects marketplace commission, fulfillment revenue, value-added services, and payment contribution combined. Through contraction, commission rates were not aggressively increased. Instead, mix and operational leverage carried more weight.
From 2026 through 2030, take rate expansion in the base case progresses toward 27%. This expansion is not driven by headline commission hikes. It is driven by:
- Higher-margin cross-border sourcing mix
- Greater fulfillment service penetration
- Advertising layering
- Embedded payment capture
- Reduced corporate sales distortion
Commission economics behave like torque. The percentage does not need to rise dramatically for revenue output to increase materially once GMV base scales.
Projected base case revenue math:
Year | GMV | Take Rate | Revenue |
|---|---|---|---|
2025 | $818.6M | ~23% | $188.9M |
2030 | ~$3.0B | 27% | ~$810M |
The expansion from sub-$200M revenue to ~$810M by 2030 rests on GMV compounding plus monetization stacking rather than aggressive repricing.
Marketplace commission remains the structural spine. The layers above it amplify yield.
5.2 Advertising Expansion from 1% to 2% of GMV
Advertising currently represents roughly 1% of GMV. At scale, marketplaces globally often generate 2%–4% of GMV from advertising alone.
The pathway to 2% through 2030 rests on seller density and competition for visibility.
With approximately 24,000 active Chinese sellers and 2.2M SKUs now embedded in the ecosystem, competition for search placement intensifies. Sponsored listing demand rises organically when category depth increases.
Advertising revenue is high margin. Incremental ad dollars carry minimal fulfillment cost.
If GMV reaches ~$3.0B in the base case and advertising reaches 2% of GMV, advertising revenue alone approaches ~$60M annually by 2030.
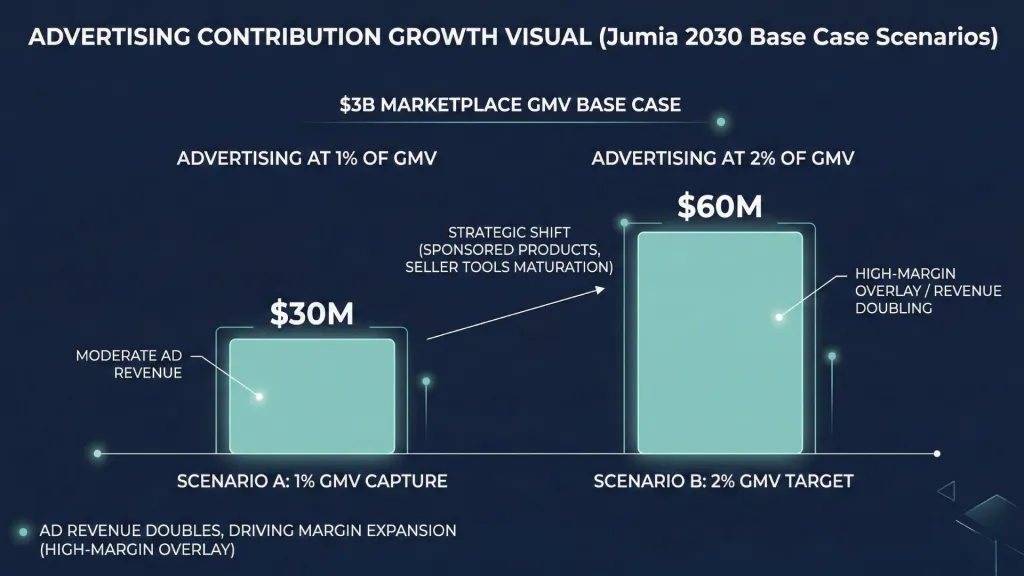
Illustrative sensitivity:
GMV | Ad % of GMV | Ad Revenue |
|---|---|---|
$3.0B | 1% | $30M |
$3.0B | 2% | $60M |
$3.8B | 2% | $76M |
Advertising scaling therefore meaningfully contributes to EBITDA margin expansion embedded in the base and bull scenarios.
This layer behaves like high-margin icing added to a scaling base.
5.3 Sponsored Products Platform (2026 Launch)
The 2026 launch of sponsored products introduces a structured advertising marketplace within Jumia’s search ecosystem.
Sponsored listings increase monetization efficiency per session. Sellers compete for keyword placement. Conversion data feeds back into bidding behavior. This dynamic mirrors global marketplace evolution without requiring radical platform redesign.
Sponsored products monetize attention rather than inventory.
As SKU depth expands and category competition rises, sponsored placements become increasingly valuable. Advertising penetration tends to scale alongside SKU growth rather than solely GMV growth.
This structure supports gradual take rate lift without altering base commission mechanics.
5.4 JumiaPay as Embedded Checkout Infrastructure
JumiaPay functions as embedded payment infrastructure across the marketplace. It reduces cash-on-delivery friction and improves transaction completion rates.
Embedded payments create three structural advantages:
- Higher checkout conversion
- Reduced return and cancellation rates
- Increased capture of ancillary financial services
Payment normalization across Nigeria, Egypt, and Kenya lowers dependency on cash settlement. As digital wallet usage rises, platform-level payments improve unit economics.
JumiaPay monetization does not require standalone fintech scale to influence margins. Even incremental basis points of GMV captured through payment services contribute directly to take rate expansion.
Payments act as the connective tissue between marketplace activity and financial yield.
5.5 Fintech Integration and Conversion Leverage
Fintech integration extends beyond checkout. BNPL penetration in Egypt, installment offerings, and wallet integrations influence basket size and order frequency.
Higher basket values increase commission revenue without incremental customer acquisition cost. Payment-linked incentives improve retention. Data feedback loops improve credit assessment and seller targeting.
Conversion leverage compounds over time:
- Improved payment acceptance reduces abandoned carts
- Installment options expand addressable demand
- Data-driven underwriting increases lifetime value per customer
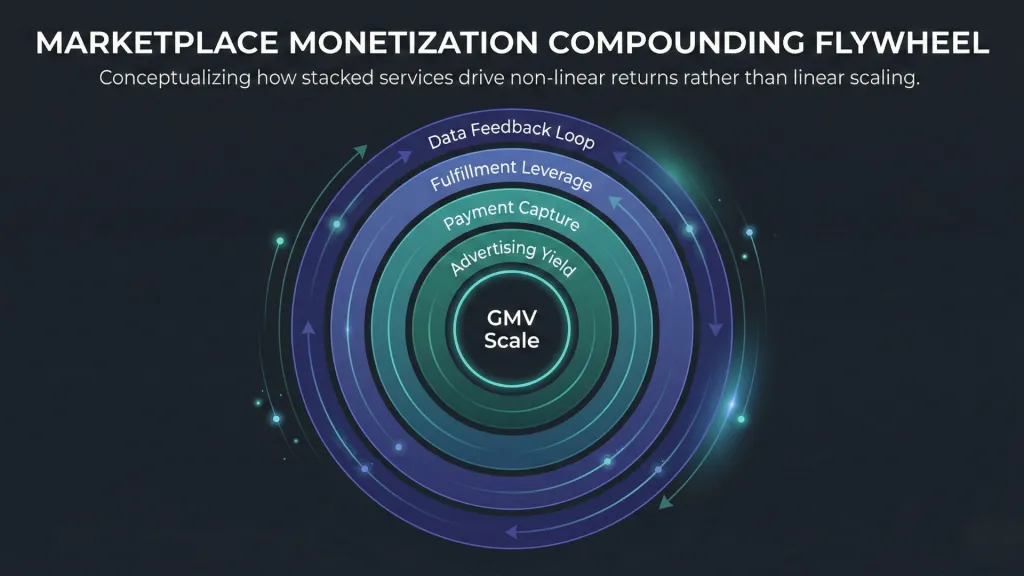
The monetization stack resembles a layered structure rather than a single lever. Commission forms the base. Advertising amplifies yield. Payments reinforce conversion. Fintech tools extend basket depth.
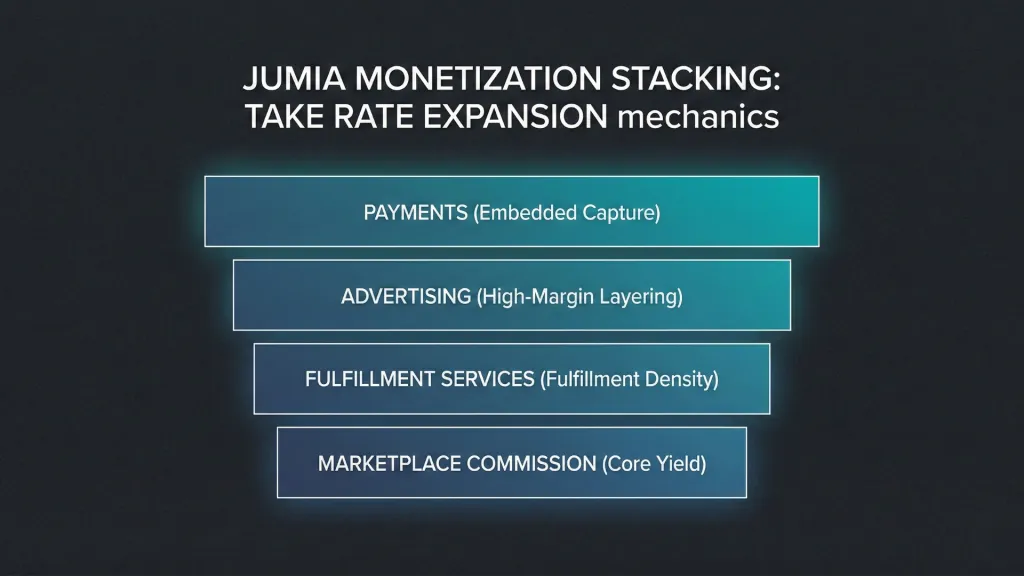
Together, these layers support the margin expansion modeled through 2030 without requiring aggressive structural assumptions.
6. The Operating Nucleus: Core Market Architecture
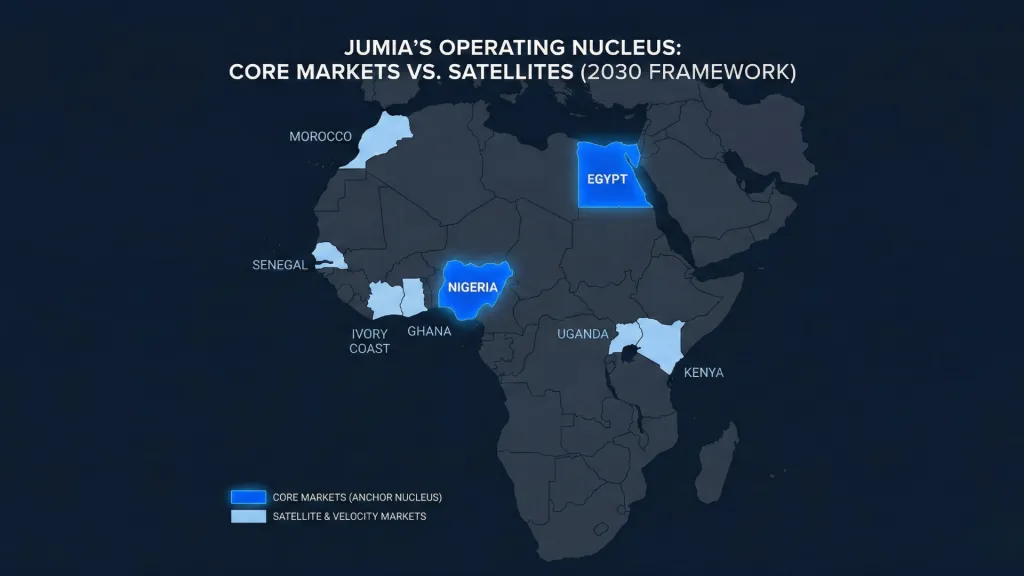
Jumia no longer operates as a scattered collection of country experiments. It operates as a nucleus surrounded by satellites. The nucleus consists of markets with sufficient order density, logistics depth, and regulatory familiarity to sustain scaled infrastructure. Satellites plug into that infrastructure selectively.
The architecture resembles a circulatory system. Capital, inventory, and operational expertise flow through central arteries before extending outward.
6.1 Nigeria: The Operating Engine
Nigeria functions as the primary growth and density engine within the system. With the largest population in Africa and a rapidly expanding urban middle class, Nigeria anchors GMV acceleration and fulfillment leverage.
6.1.1 50% Q4 GMV Growth
Nigeria delivered approximately 50% GMV growth year over year in Q4 2025. This acceleration occurred during a period when the broader African macro narrative remained cautious.
Growth at this magnitude signals two structural dynamics:
- Demand elasticity remained intact through currency adjustment
- Route density improvements began translating into higher order frequency
Nigeria’s contribution to group GMV remains dominant. In the 2030 model, sustained compounding in Nigeria provides the base layer of the GMV curve across all scenarios.
6.1.2 Lagos 30,000 sqm Central Warehouse
The 30,000 square meter central warehouse in Lagos anchors Nigeria’s logistics backbone. Centralization reduces fragmented inventory positioning and enables bulk importation efficiency from China sourcing pipelines.
Warehouse scale enables:
- Consolidated container imports
- Faster restock cycles
- Lower per-unit freight cost
- Improved inventory turnover
Infrastructure at this scale transforms fixed cost into leverage once volume thresholds are crossed. The warehouse behaves like a flywheel housing. The heavier it is, the more stable the rotational momentum once it spins.
6.1.3 61% Secondary City Penetration
Secondary cities accounted for 61% of Nigeria’s orders by late 2025. This statistic reflects route density maturation outside Lagos and Abuja.
Higher penetration in secondary cities:
- Reduces marginal delivery cost per parcel
- Increases drop density along established routes
- Expands addressable market without new country risk
Density shifts unit economics from expansion mode to compounding mode. As more parcels travel along existing corridors, contribution margin improves naturally.
6.1.4 Route Density and Upcountry Leverage
Upcountry leverage is the operating manifestation of density. Once delivery routes reach sufficient frequency, incremental orders carry disproportionately higher contribution margin.
Illustrative effect:
Variable | Low Density | High Density |
|---|---|---|
Orders per Route | Sparse | Clustered |
Cost per Delivery | Elevated | Compressed |
Failed Delivery Risk | Higher | Lower |
Contribution Margin | Thin | Expanding |
Nigeria’s route maturity underpins EBITDA progression in the base and bull scenarios. Without Nigeria compounding efficiently, the broader 2030 model would flatten materially.
6.2 Egypt: Engineering and Marketplace Core
Egypt plays a dual role. It serves as a revenue contributor and as a technology and operational hub.
6.2.1 56% Marketplace GMV Growth ex-Corporate
Marketplace GMV in Egypt, excluding corporate sales, grew approximately 56% year over year in Q4 2025. Removing corporate sales distortion provides a clearer signal of consumer marketplace acceleration.
Egypt’s scale and relatively advanced payment ecosystem provide a fertile environment for basket expansion and fintech layering.
6.2.2 Technology Hub Function
Egypt functions as a central engineering hub for Jumia. Product development, seller tools, and payments integration leverage Egypt’s technical talent base.
This hub function:
- Lowers platform development cost
- Improves iteration speed
- Enhances integration between marketplace and fintech layers
Operational coherence across markets depends on centralized technical execution. Egypt supplies that capability.
6.2.3 BNPL Penetration and Basket Expansion
BNPL penetration in Egypt supports higher average order values. Installment options reduce immediate price sensitivity and increase consumer willingness to transact on higher-ticket categories.
Higher basket values directly influence commission revenue without proportional customer acquisition expense.
Egypt therefore contributes not only volume growth but also monetization leverage.
6.3 Kenya: Volume Growth and Regulatory Variable
Kenya serves as an East African volume anchor with regulatory variability layered into the risk profile.
6.3.1 50% Order Growth
Kenya delivered approximately 50% order growth year over year. Volume acceleration demonstrates sustained demand elasticity in urban centers such as Nairobi.
Kenya’s integration with Uganda’s corridor infrastructure strengthens route leverage.
6.3.2 VAT Exposure and Margin Sensitivity
Kenya’s regulatory framework includes VAT considerations that can influence margin sensitivity. Changes in VAT policy affect:
- Import cost
- Seller pricing
- Consumer final price elasticity
Kenya introduces a policy variable within the operating nucleus. The 2030 model assumes regulatory stability without aggressive adverse shifts.
6.4 Ivory Coast: The Efficiency Benchmark
Ivory Coast demonstrates how asset-light infrastructure can scale in currency-stable environments.
6.4.1 351 Pickup Stations
With 351 pickup stations, Ivory Coast leans heavily on pickup-based fulfillment rather than home delivery density.
Pickup station models:
- Reduce last-mile cost
- Lower failed delivery rates
- Increase operational predictability
6.4.2 CFA Peg Stability
The CFA franc’s euro peg provides relative currency stability compared to floating regimes. Stability reduces FX-induced volatility in reported revenue and margin.
This macro environment makes Ivory Coast a structural efficiency benchmark.
6.4.3 Asset-Light Logistics Blueprint
Ivory Coast illustrates how pickup-centric models can serve as a blueprint for other francophone markets. Lower infrastructure intensity reduces burn while preserving GMV scalability.
6.5 Ghana: The Velocity Market
Ghana operates as a high-growth, controlled-cost corridor.
6.5.1 124% Constant Currency GMV Growth
Ghana delivered approximately 124% GMV growth in constant currency during the contraction phase. Constant currency framing isolates demand elasticity from FX distortion.
This acceleration demonstrates that disciplined cost structure does not impede velocity.
6.5.2 SKU Focus and Cost Discipline
Ghana emphasizes curated SKU expansion rather than blanket assortment growth. Focused inventory improves conversion rates and lowers reverse logistics complexity.
Velocity markets amplify GMV growth without requiring heavy infrastructure buildout.
6.6 Uganda: The Satellite Proof Point
Uganda functions as a satellite plugged into Kenya’s corridor infrastructure.
6.6.1 Shared Kenya Corridor Infrastructure
By sharing Kenya’s logistics backbone, Uganda avoids duplicative fixed cost. Inventory, routing, and fulfillment systems integrate regionally.
This model reduces expansion risk relative to standalone market launches.
6.6.2 50% Electric Fleet
Approximately 50% of Uganda’s delivery fleet operates on electric vehicles. Electric adoption lowers fuel exposure and reduces operating cost volatility.
Electrification also aligns with regulatory and environmental incentives.
6.6.3 Disciplined Unit Economics
Uganda’s scaled integration within a shared corridor reinforces disciplined unit economics. Satellite markets must demonstrate positive contribution before deeper capital allocation.
6.7 Morocco: High-Yield Basket Market
Morocco contributes higher average basket values relative to some Sub-Saharan markets. Urban density and consumer purchasing power support larger-ticket categories.
Higher basket markets influence take rate stability and advertising monetization potential. Even moderate volume growth in Morocco contributes disproportionately to revenue yield.
6.8 Senegal: Rural Demand Elasticity Laboratory
Senegal functions as a testing ground for rural demand elasticity in francophone West Africa.
Rural penetration experiments in Senegal provide insight into:
- Delivery feasibility in low-density zones
- Pickup station viability outside urban cores
- Price sensitivity thresholds
Senegal’s role resembles a laboratory within the nucleus. Lessons learned inform corridor expansion decisions elsewhere.
The operating nucleus collectively forms the structural backbone of the 2030 model. Each market contributes a distinct function: engine, hub, benchmark, satellite, or laboratory. Growth through 2030 assumes density compounding within this architecture before broad geographic expansion resumes.
7. Strategic Pruning: The Algeria Exit
Strategic pruning is often interpreted as weakness. In platform architecture, it frequently represents structural strengthening.
Algeria represented a market where regulatory asymmetry and fiscal structure inverted the unit economics required for marketplace scaling. The decision to exit was not a reaction to weak demand. It was a response to structural misalignment between policy and platform mechanics.
Removing Algeria simplified the operating map and removed a persistent source of regulatory unpredictability.
7.1 Fiscal Inversion and 30% Gross Withholding Tax
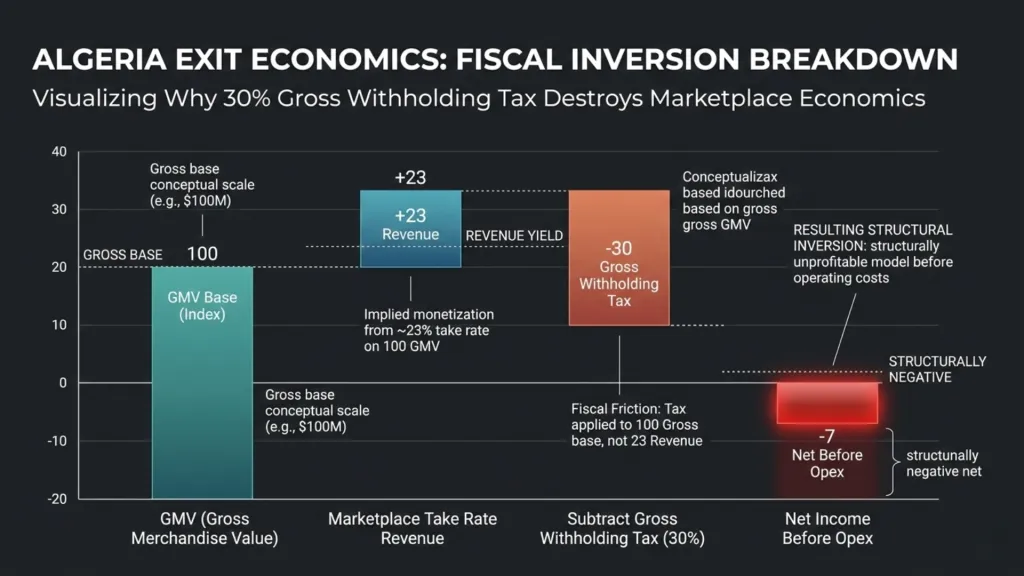
Algeria introduced a fiscal structure that imposed a 30% gross withholding tax on marketplace transactions. The gross basis is critical. Taxation applied before operating cost, compressing margin at the top of the revenue stack rather than at the net income layer.
For a platform operating on sub-30% take rates, a 30% gross withholding creates structural inversion.
Illustrative distortion:
Variable | Marketplace Model | Algeria Structure |
|---|---|---|
GMV | 100 | 100 |
Take Rate | 23 | 23 |
Revenue | 23 | 23 |
Gross Withholding | 0 | 30 |
Net Before Opex | 23 | -7 |
The inversion makes scaled profitability unattainable under standard marketplace mechanics.
Fiscal friction at this magnitude alters risk distribution from operational to structural. The 2030 framework assumes regulatory environments remain compatible with marketplace economics. Algeria failed that threshold.
7.2 Import Forecast Programme Rigidity
Algeria’s Import Forecast Programme added additional rigidity. Import volumes required advance state-level forecasting and approval. Marketplace flexibility depends on rapid inventory response to demand signals. Forecast-based approval constrains that agility.
Rigid import forecasting:
- Delays restocking
- Limits SKU breadth
- Increases working capital friction
- Elevates stockout risk
Marketplace elasticity requires adaptive inventory pipelines. Algeria’s regulatory framework required predictability where consumer demand remains dynamic.
When supply agility disappears, platform economics compress from both ends.
7.3 2% GMV Contribution Reality
Algeria represented approximately 2% of group GMV prior to exit. The market carried disproportionate regulatory risk relative to contribution weight.
Concentration within the operating nucleus means each market must justify its capital intensity and regulatory exposure.
Relative scale comparison:
Market | Approximate GMV Weight |
|---|---|
Nigeria | Dominant |
Egypt | Major |
Kenya | Material |
Ivory Coast | Moderate |
Algeria | ~2% |
Maintaining exposure to fiscal inversion for a 2% GMV contribution introduces asymmetrical downside relative to upside.
Strategic pruning therefore preserved capital for corridors already demonstrating density.
7.4 One-Time Closure Costs vs Permanent Risk Removal
Exit costs are visible and quantifiable. Structural regulatory drag is persistent and compounding.
Algeria’s wind-down generated one-time closure costs. Those costs represent finite accounting events. Continued operation under fiscal inversion would have introduced indefinite margin compression and regulatory unpredictability.
In capital allocation terms:
Scenario | Financial Profile |
|---|---|
Remain | Ongoing structural drag |
Exit | One-time charge, permanent risk removal |
Strategic pruning removed a structural weak point from the architecture. The exit reinforces the thesis that expansion must align with unit economics and regulatory compatibility. Additionally, 2% of GMV carried a disproportion amount of managements' focus and attention. Not only does an exit lower risk and costs, but it also allows for this time and focus to compound in growing markets.
Through 2030, expansion vectors are modeled under this disciplined framework. Markets that fail to support marketplace economics are removed. Markets that demonstrate density receive incremental capital.
The Algeria exit reflects that discipline in practice rather than in theory.
8. 2030 Expansion Vector
The expansion assumptions in this section are scenario constructs embedded in the 2030 model. Tanzania has been referenced by management in past commentary, though no confirmed reentry timeline exists. Ethiopia represents a modeled opportunity based on market structure, scale, and logistical fit rather than announced plans.
These vectors are incorporated as conditional growth layers beginning only after Q4 2026 profitability is approached. Expansion does not precede structural stabilization in the framework.
8.1 Tanzania Reentry (2028–2029)
Tanzania previously operated within Jumia’s footprint before retrenchment. Reentry, as modeled, occurs between 2028 and 2029 and is phased rather than immediate scale deployment.
The case for Tanzania rests on three structural pillars: payment maturity, regional corridor alignment, and density adjacency to Kenya.
8.1.1 Mobile Money Saturation
Tanzania exhibits one of the more mature mobile money ecosystems in East Africa. High mobile wallet penetration reduces checkout friction and lowers cash-on-delivery reliance.
Marketplace compounding correlates with digital payment depth. Where wallet usage is normalized, basket conversion improves and fulfillment leakage declines.
In the model, Tanzania benefits from:
- Established mobile money rails
- Urban smartphone penetration sufficient for marketplace scaling
- Consumer familiarity with digital wallet infrastructure
Payment readiness lowers customer acquisition friction relative to earlier Jumia market entries.
8.1.2 East African Corridor Integration
Tanzania’s proximity to Kenya allows integration within an existing logistics corridor. The shared regional architecture reduces incremental fixed cost.
Corridor integration supports:
- Shared inventory routing
- Cross-border freight optimization
- Centralized technology and seller management
The model assumes Tanzania plugs into the Kenya operating backbone rather than operating as a standalone country-level infrastructure build.
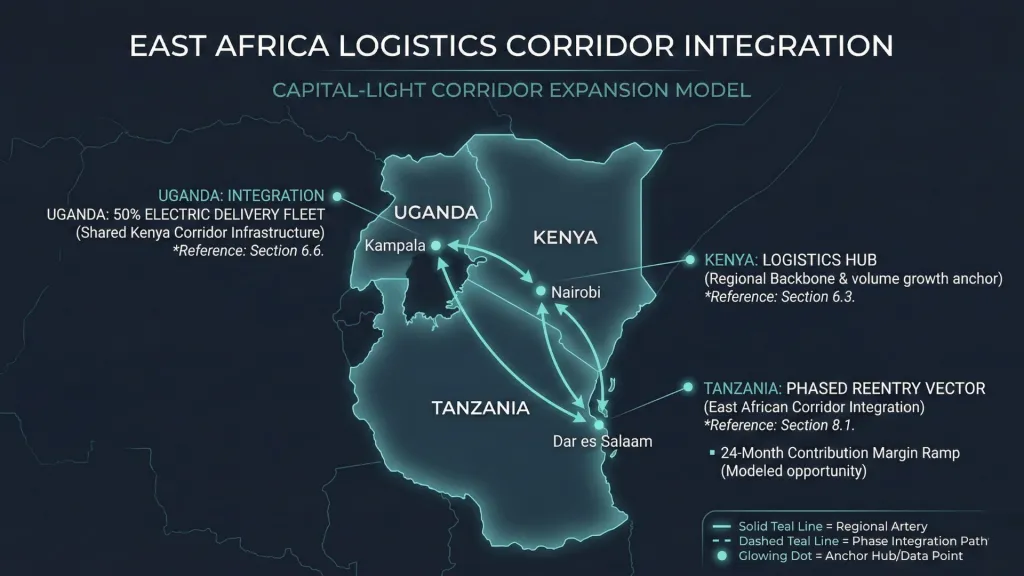
Expansion in this format behaves as a lateral extension of an existing artery rather than construction of a new circulatory system.
8.1.3 24-Month Contribution Margin Ramp
The 2030 framework assumes a disciplined ramp:
- Year 1: Controlled GMV build, limited SKU depth
- Year 2: Contribution margin breakeven target
- Post Year 2: Gradual density compounding
A 24-month path to positive contribution margin is modeled as the threshold for sustained capital allocation.
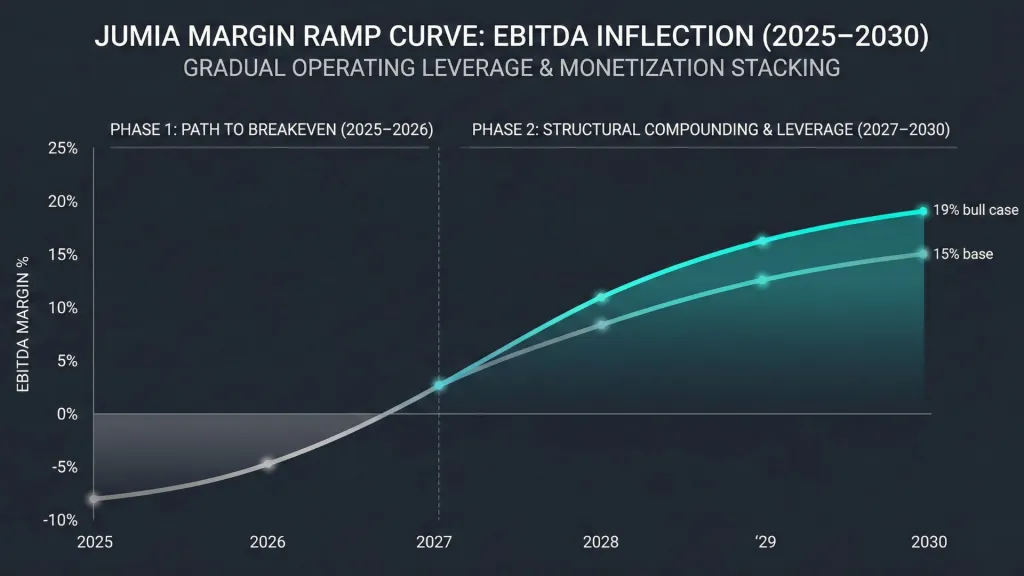
The ramp assumption is embedded within base and bull GMV curves beginning 2028. It does not materially alter near-term EBITDA trajectory.
8.2 Ethiopia Entry via 3PL
Ethiopia is included in the model as a strategic optionality layer beginning in 2027–2028 under a 3PL service framework. This is not based on announced plans. It is derived from market scale and structural compatibility with Jumia’s logistics capabilities.
8.2.1 120M Consumer Base
Ethiopia’s population exceeds 120 million, making it one of the largest untapped consumer markets in Africa. Urbanization and gradual digital infrastructure improvements position the country as a long-duration opportunity.
Population scale alone does not guarantee e-commerce viability. Logistics and regulatory alignment determine feasibility. Ethiopia’s size, however, introduces asymmetry if structural barriers can be navigated.
8.2.2 $10M Import Threshold Constraint
Ethiopia has historically implemented strict import controls and foreign exchange management policies. The model assumes continued constraints around import thresholds and currency allocation.
A B2C inventory-heavy entry under such conditions would elevate burn risk and working capital exposure.
Regulatory rigidity therefore shapes the entry strategy.
8.2.3 Service-Fee Model vs B2C Burn
The framework assumes Ethiopia entry via a 3PL logistics service model rather than a full marketplace inventory push.
Under a 3PL structure:
- Jumia provides logistics and warehousing services
- Inventory risk remains with sellers
- Working capital exposure remains limited
- Service fees contribute incremental revenue
This model avoids balance sheet expansion in a regulatory environment that may restrict import flows.
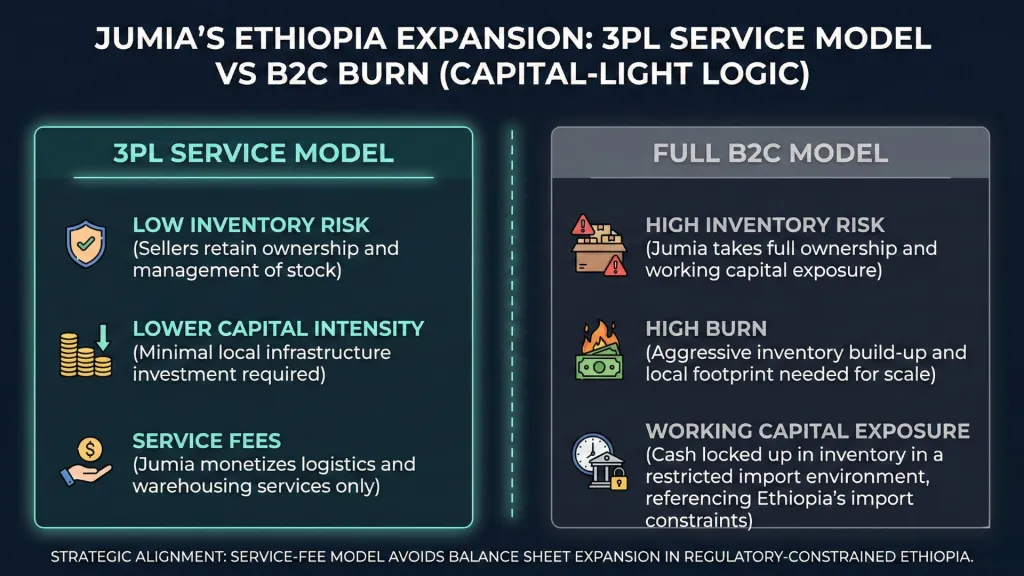
Illustrative comparison:
Model | Inventory Risk | Capital Intensity | Burn Profile |
|---|---|---|---|
Full B2C | High | High | Elevated |
3PL Service | Low | Moderate | Controlled |
The service-fee approach aligns with capital discipline embedded throughout the 2030 framework.
8.2.4 Capital-Light Expansion Logic
Capital-light expansion remains a structural principle across modeled vectors.
Ethiopia’s inclusion assumes:
- Limited initial fixed infrastructure
- Gradual capacity scaling
- Revenue contribution without inventory ownership
- Exit flexibility if regulatory friction intensifies
The expansion vector behaves as an option embedded within the broader 2030 thesis rather than a required growth driver.
Across both Tanzania and Ethiopia, expansion occurs after profitability stabilization, integrates with existing corridors where possible, and prioritizes contribution margin over GMV signaling.
The 2030 model does not depend on aggressive frontier expansion. It treats expansion as controlled reinforcement layered onto an already stabilized nucleus.
9. Structural Growth Drivers Through 2030
The 2030 framework rests on five interlocking drivers. None operate independently. GMV scale enables monetization layering. Monetization layering enhances margin. Margin stability reinforces capital discipline. Capital discipline supports sustainable GMV compounding.
Growth is not modeled as a single slope. It is modeled as a system.
9.1 GMV Expansion Path
The GMV trajectory reflects density compounding within the operating nucleus, selective corridor extensions, and monetization infrastructure maturity.
Base Case GMV Growth:
Year | GMV Growth | Implied GMV |
|---|---|---|
2025 | — | $818.6M |
2026 | 30% | ~$1.06B |
2027 | 28% | ~$1.36B |
2028 | 22% | ~$1.66B |
2029 | 18% | ~$1.96B |
2030 | 15% | ~$3.0B cumulative path |
Growth decelerates gradually rather than sharply. The curve flattens as base size increases, though structural drivers prevent early compression into low-teens stagnation.
The compounding dynamic resembles a widening river rather than a vertical spike. As corridor density increases and payment friction declines, order frequency improves. Secondary city penetration continues expanding within Nigeria and Egypt. Advertising and fintech integration improve basket depth.
Bear and bull cases flex the slope but preserve the structural arc.
The GMV path is anchored in:
- Nigeria’s sustained density expansion
- Egypt’s basket and fintech leverage
- Ghana and Kenya volume velocity
- Francophone corridor stability
- Controlled expansion vectors
9.2 Take Rate Expansion Mechanics
Take rate expansion through 2030 is driven by structural layering rather than explicit commission increases.
Base Case Take Rate Path:
Year | Take Rate |
|---|---|
2025 | ~23% |
2026 | 24% |
2027 | 25% |
2028 | 26% |
2029 | 26.5% |
2030 | 27% |
The mechanics behind expansion:
- Higher-margin international sourcing mix
- Greater fulfillment service penetration
- Sponsored product monetization
- Embedded payment capture
- Reduced distortion from corporate sales
The progression remains conservative relative to mature marketplace peers operating above 30%.
Take rate expansion resembles tightening the mesh of a net. GMV volume passes through, though a slightly larger portion remains captured as revenue without visibly altering seller-facing commission rates.
9.3 Advertising Contribution
Advertising is a structural margin amplifier.
Advertising currently approximates 1% of GMV. The base case models progression toward 2% by 2030, aligned with SKU density and sponsored product maturity.
Advertising revenue scales with seller competition rather than solely consumer demand.
Projected advertising contribution under base case:
2030 GMV | Ad % | Ad Revenue |
|---|---|---|
~$3.0B | 1% | ~$30M |
~$3.0B | 2% | ~$60M |
Under bull case GMV of ~$3.8B, advertising at 2% produces ~$76M in revenue.
Advertising carries high incremental margin. As seller density increases, monetization yield improves without incremental fulfillment burden.
The contribution behaves as an overlay rather than a base driver.
9.4 Logistics Leverage Curve
Logistics leverage is the invisible driver beneath margin expansion.
Fixed fulfillment infrastructure creates operating leverage once density thresholds are crossed. Secondary city penetration at 61% in Nigeria and pickup density in Ivory Coast provide early evidence of this transition.
The leverage curve unfolds in stages:
- Sparse density phase: high per-delivery cost
- Route maturity phase: declining marginal cost
- Cluster compounding phase: rising contribution margin
Illustrative leverage dynamic:
Density Level | Cost per Parcel | Contribution Margin |
|---|---|---|
Low | Elevated | Thin |
Moderate | Stabilizing | Improving |
High | Compressed | Expanding |
As GMV compounds within existing corridors, fixed cost absorption improves. Fulfillment cost as a percentage of GMV declines. Delivery success rates improve. Reverse logistics burden decreases.
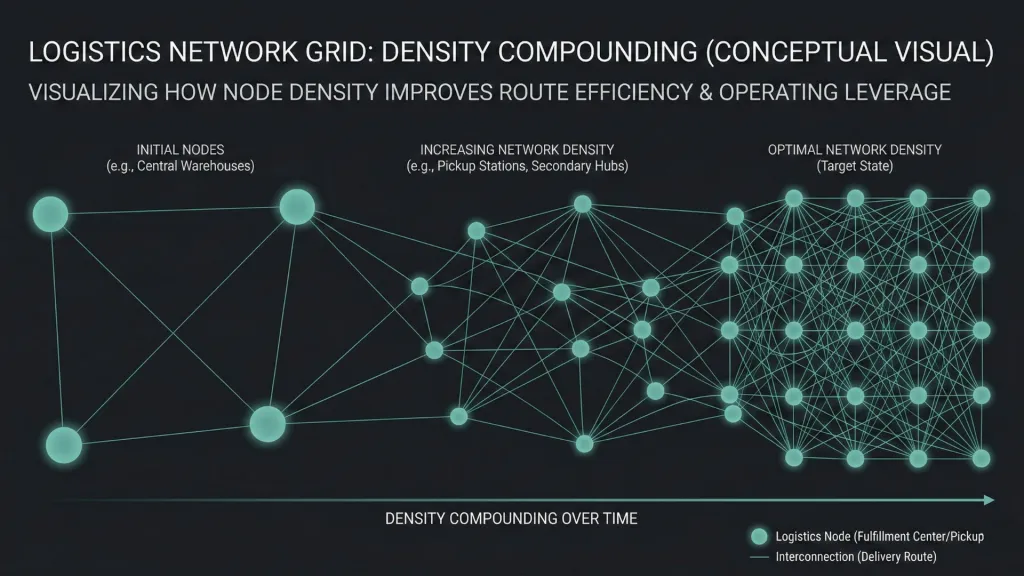
The logistics system functions like a network grid. Once nodes are sufficiently connected, incremental load distributes efficiently across the network.
9.5 Margin Structure Evolution
Margin evolution through 2030 integrates GMV compounding, take rate expansion, advertising layering, and logistics leverage.
Base Case 2030 profile:
- Revenue: ~$810M
- EBITDA Margin: 15%
- Net Margin: 12%
- Net Income: ~$97M
Bull Case 2030 profile:
- Revenue: ~$1.10B
- EBITDA Margin: 20%
- Net Margin: 16%
- Net Income: ~$176M
Bear Case 2030 profile:
- Revenue: ~$525M
- EBITDA Margin: 8%
- Net Margin: 6%
- Net Income: ~$32M
Margin expansion derives from structural mechanics:
- Advertising scaling
- Payment normalization
- Reduced per-parcel logistics cost
- International sourcing margin mix
- Fixed cost absorption
The margin arc resembles a slow incline rather than a sudden vertical shift. Profitability emerges through layered efficiency rather than abrupt repricing.
Through 2030, the structural drivers reinforce each other. GMV scale strengthens monetization. Monetization amplifies margin. Margin stability supports disciplined expansion. The system compounds internally before expanding externally.
10. Strategic Optionality: Why Jumia Could Be Acquired
Acquisition is not the core thesis. The base case rests on independent compounding. Strategic optionality enters once profitability is achieved, logistics moats are visible, and corridor economics demonstrate durability.
The model assigns a 15% probability to acquisition in the 2030 scenario framework. This probability reflects structural plausibility rather than inevitability.
Acquisition becomes credible only after EBITDA positivity and cash flow stability are achieved.
10.1 What a Profitable Jumia Represents
A profitable Jumia represents infrastructure rather than a retailer.
It represents:
- Multi-market logistics rails across Africa
- Embedded payment infrastructure
- Local regulatory relationships
- A seller network anchored in China and regional suppliers
- Established warehousing and last-mile density
In platform economics, building from zero in frontier markets consumes years of capital and political navigation. Acquiring an operating infrastructure compresses that timeline.
A profitable Jumia therefore represents time compression. It offers an acquirer immediate scale within markets that are otherwise operationally complex.
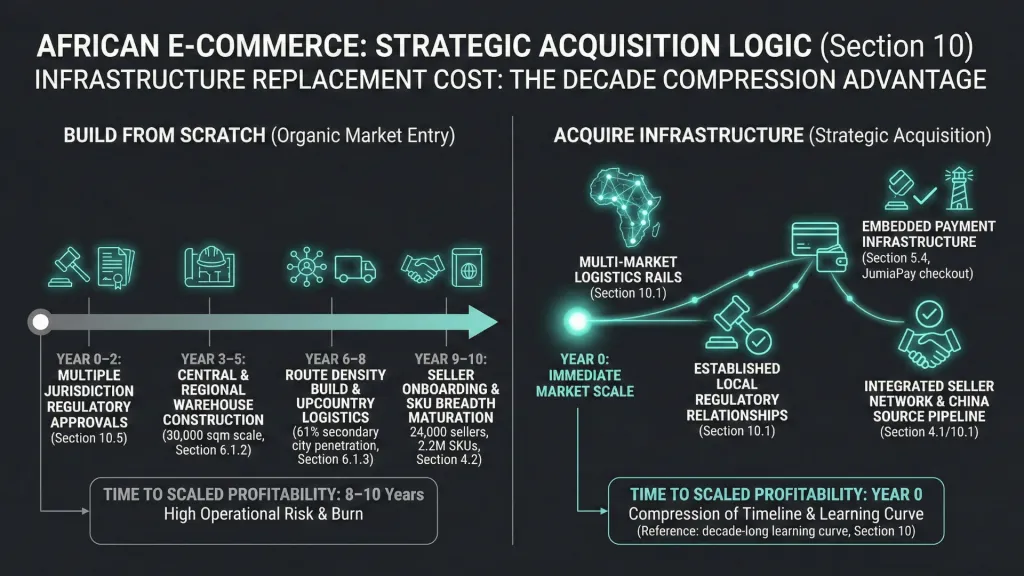
The valuation band embedded in the acquisition case ranges from 5x to 7x forward sales at maturity, implying equity value between $4B and $6B, translating into $28 to $42 per share under a 140M share count assumption.
The logic rests on infrastructure replacement cost and growth optionality rather than near-term earnings multiples.
10.2 Why Amazon Could Be Interested
Amazon operates as a global logistics and cash flow engine. Africa remains one of the few large population geographies without embedded Amazon infrastructure.
Amazon’s challenge in Africa is not brand awareness. It is logistics complexity, currency volatility, and regulatory navigation.
An acquisition would provide:
- Immediate warehouse presence in Lagos and Cairo
- Pickup station networks in francophone West Africa
- Established local last-mile operations
- Seller relationships already integrated into the region
Amazon’s capital base allows absorption of frontier volatility. Africa’s long-term demographic trajectory aligns with Amazon’s historical expansion logic.
The economic rationale rests on avoiding a decade-long infrastructure build while capturing optionality before valuation repricing.
10.3 Why MercadoLibre Could Be Interested
MercadoLibre understands emerging market volatility. It operates across Latin America, where currency cycles and regulatory shifts are routine.
Strategically, MercadoLibre faces eventual top-line deceleration as Latin American markets mature. Africa offers a second emerging-market compounding frontier.
Acquiring Jumia would provide:
- A logistics network already tested under currency volatility
- Cross-border sourcing pipelines
- A path to diversify geographic revenue mix
MercadoLibre’s marketplace and fintech expertise aligns closely with Jumia’s operating model. The acquisition would represent geographic adjacency in terms of macro profile rather than physical proximity.
The rationale centers on extending growth runway rather than operational reinvention.
10.4 Why Coupang or SEA Could Consider Entry
Coupang and SEA have both demonstrated capability in scaling e-commerce within complex Asian markets.
Coupang’s expertise lies in dense urban logistics and fulfillment precision. SEA combines marketplace scale with gaming and fintech ecosystems.
Africa presents a structural opportunity where neither currently maintains embedded infrastructure.
An acquisition would allow:
- Entry into a high-population region with limited global platform penetration
- Diversification away from regional concentration risk
- Leveraging existing marketplace and fintech systems within a new growth corridor
For either acquirer, Jumia represents a ready-made distribution lattice in markets where building from scratch would require extended regulatory and operational groundwork.
10.5 Regulatory and Execution Barriers to Acquisition
Acquisition feasibility is not purely financial.
Barriers include:
- Cross-border regulatory approvals across multiple African jurisdictions
- Currency repatriation restrictions
- Local political sensitivity around foreign ownership
- Integration risk within diverse market structures
Operational integration complexity also matters. Marketplace systems, payment infrastructure, and logistics networks require harmonization with the acquirer’s architecture.
The acquisition scenario therefore remains conditional on:
- Demonstrated profitability
- Stable macro environment
- Clear regulatory pathways
- Absence of structural policy hostility toward foreign consolidation
The 15% probability weighting reflects both strategic plausibility and execution friction.
Strategic optionality functions as embedded upside within the 2030 model. It is not required for asymmetry. It provides an additional pathway should corridor economics mature faster than valuation repricing.
11. Capital Structure and Dilution Risk
Capital structure defines the survivability window. Growth narratives matter only if liquidity runway sustains execution.
The 2030 framework assumes disciplined capital preservation through break-even and no equity issuance beyond stock-based compensation.
The share count assumption for 2030 remains 140M, reflecting SBC dilution only.
11.1 Cash Position and Burn Trajectory
At the end of 2025, cash stood at approximately $77.8M. Full-year net operating cash burn was approximately $47.9M. Adjusted EBITDA loss narrowed materially through Q4, and Q4 delivered positive working capital contribution.
The burn profile through 2023–2025 reflects deliberate contraction:
- Exit from South Africa and Tunisia
- Corporate Egypt deprioritization
- Cost rationalization across fulfillment and overhead
- Infrastructure consolidation
Burn compression trajectory:
Period | EBITDA Trend | Cash Burn Direction |
|---|---|---|
2023 | Deep negative | Elevated |
2024 | Narrowing | Declining |
Q4 2025 | -$7.3M Adj EBITDA | Significantly reduced |
The contraction phase reduced structural cash outflow and positioned the platform closer to operating self-sufficiency.
The model assumes continued burn compression through 2026 as density compounds within the operating nucleus.
11.2 Break-Even Timing (Q4 2026 Target)
Management has targeted EBITDA break-even in Q4 2026.
The 2030 model anchors on this milestone. Break-even timing affects:
- Liquidity risk
- Expansion pacing
- Dilution probability
- Valuation multiple expansion
The path to break-even rests on:
- Sustained GMV acceleration within Nigeria and Egypt
- Advertising monetization layering
- Fulfillment cost absorption
- Stable macro currency backdrop
Illustrative glide path:
Year | Adj EBITDA Profile |
|---|---|
2025 | Negative, narrowing |
2026 | Converging toward zero |
Q4 2026 | Target break-even |
2027+ | Positive EBITDA |
EBITDA positivity signals structural operating viability. Cash flow neutrality follows as working capital stabilizes.
Break-even is the pivot point separating survival from structural compounding.
11.3 No-Equity Raise Assumption
The base and bull scenarios assume:
- No ATM issuance
- No secondary equity raise
- Dilution limited to stock-based compensation
2030 share count modeled: 140M.
An equity raise prior to profitability alters the capital stack and increases required enterprise value for identical per-share outcomes.
Dilution sensitivity example:
Share Count | Equity Value $2.4B | Implied Price |
|---|---|---|
140M | $2.4B | ~$17 |
160M | $2.4B | ~$15 |
180M | $2.4B | ~$13 |
Capital discipline therefore directly impacts per-share asymmetry.
The model embeds confidence in break-even trajectory and burn compression. Equity issuance prior to Q4 2026 would signal structural fragility within that trajectory.
11.4 Explicit Thesis Break Conditions
The following conditions invalidate the base case:
- Equity raise prior to sustained EBITDA positivity
- Failure to reach Q4 2026 EBITDA break-even
- Major African macro destabilization reversing currency normalization
- Take rate compression below 22%
- Structural slowdown within Nigeria
- Regulatory shock comparable to Algeria’s fiscal inversion
These conditions target capital structure fragility and operating nucleus stability.
The 2030 framework assumes disciplined capital allocation and stable macro convergence. Capital missteps or macro regression alter the slope materially.
Capital structure determines whether growth compounds or resets. The thesis remains contingent on disciplined liquidity management through profitability inflection.
12. Financial Model (2026–2030)
The financial model translates structural drivers into quantified outputs. The assumptions remain internally consistent across cases. What changes is the slope of compounding and the speed of monetization layering.
Starting point: 2025 GMV of $818.6M.
2030 share count: 140M.
No equity issuance beyond SBC.
The model flexes growth velocity and monetization depth while preserving capital discipline and break-even sequencing.
12.1 GMV Scenarios
The GMV curve determines the scale of the monetization base. Each case adjusts compounding speed while maintaining the operating nucleus architecture.
Northwise Premium
Choose how to continue with Northwise
Join Northwise Premium
Unlock the rest of this report, its complete valuation, the downloadable model, portfolios, and action framework.
Join Northwise PremiumCreate a Free Account
Continue across Free Northwise research, follow companies, save reports, and receive updates.
Create a Free Account
Jumia Stock Forecast 2030: The Business Beyond Breakeven
Explore Northwise’s Jumia stock forecast for 2030: country growth, unit economics, cash flow, dilution and three valuation scenarios, with a financial model.
Where Will Jumia Expand Next?
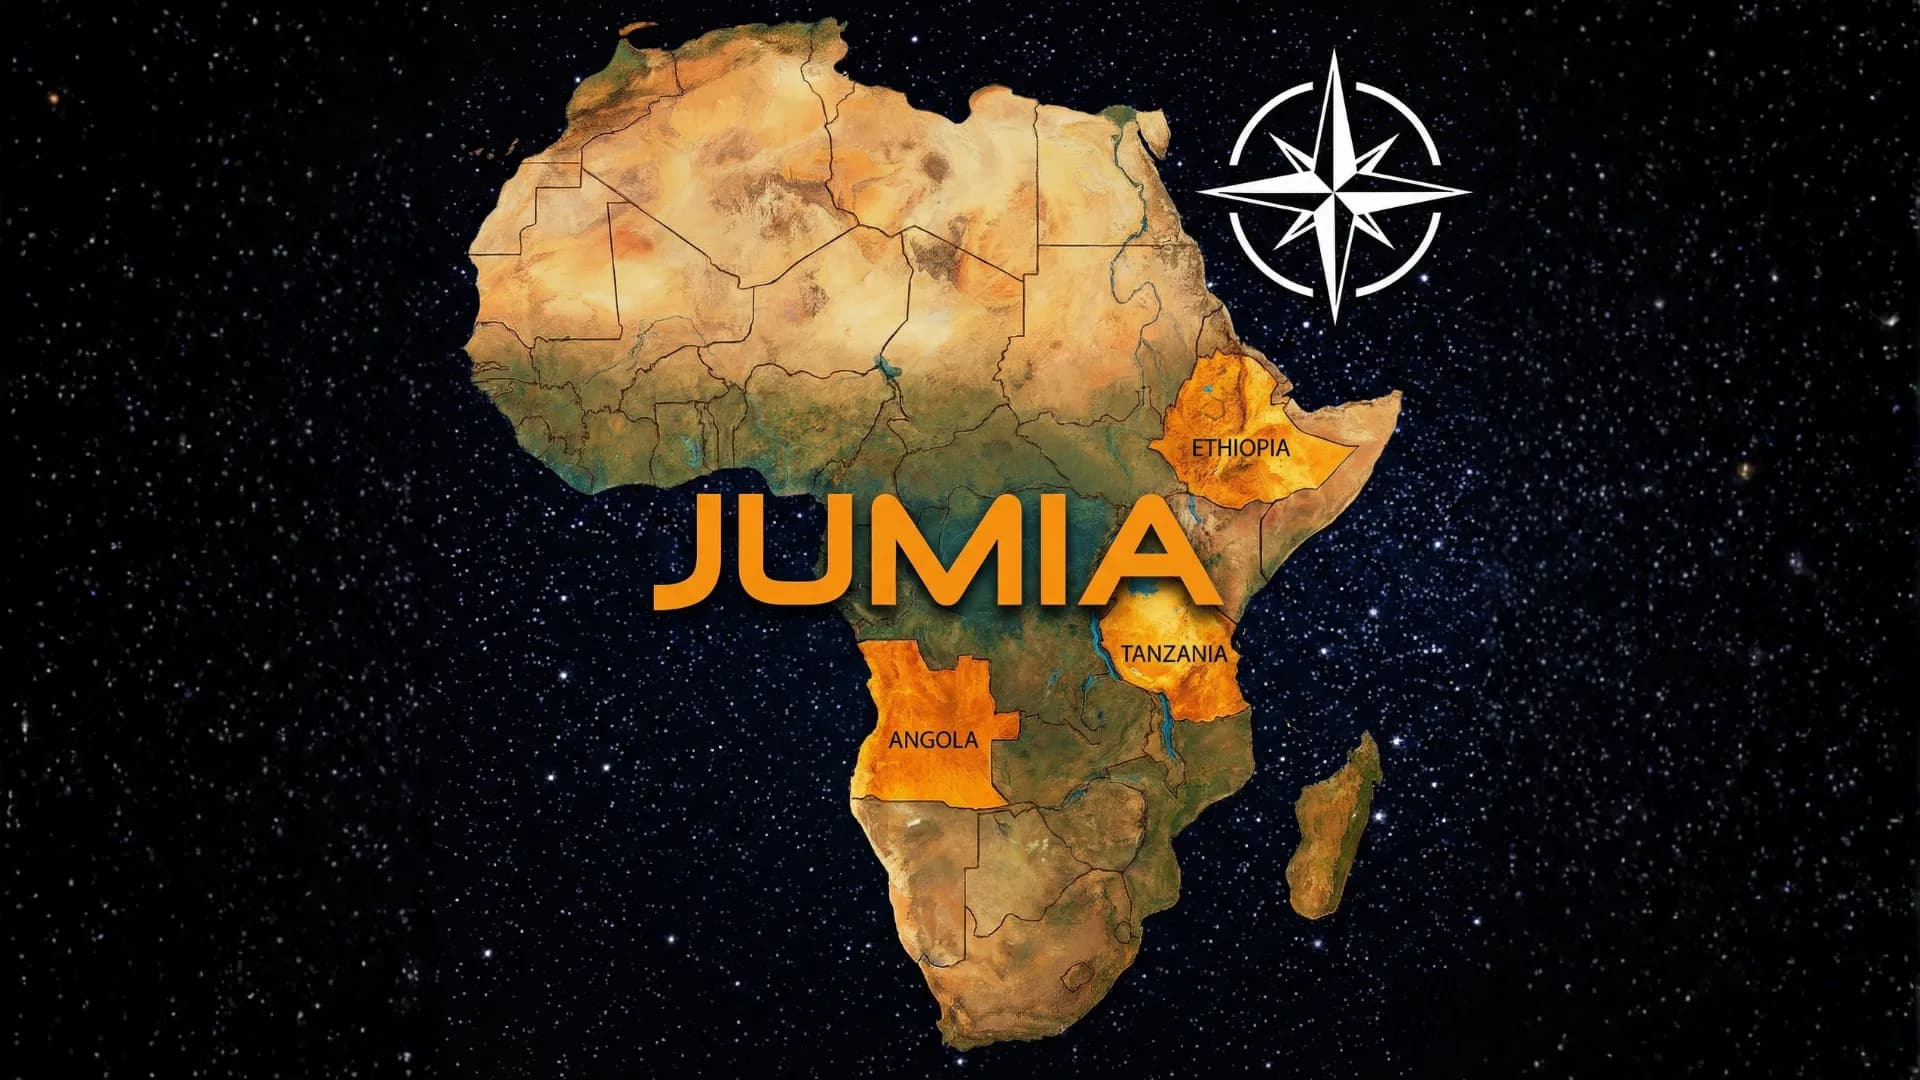
Where will Jumia expand next after profitability? We examine Tanzania, Angola, and Ethiopia as post-2027 growth options.

Jumia Uganda
Jumia Uganda: a growing revenue contribution from a smaller base, customer retention and the economics of expanding delivery coverage.
Northwise Portfolios
See how the research becomes real decisions
Reader discussion
Discuss the research
Premium access is required to join this report's discussion.
Join Northwise Premium
No comments yet. Start a thoughtful discussion.