Is Nike Stock a Buy? The Comeback Has to Earn Its Keep
Is Nike stock a buy? We examine its recovery, margins, cash flow and risks, with three operating scenarios and a detailed valuation for Premium members.
In this article
Nike still makes shoes people line up for. It also carries the costs of a much bigger business. We examine whether better products, healthier retail relationships and tighter spending can turn the recovery into lasting earnings.
Kylian Mbappé has joined On as the Swiss brand moves into football. Losing an athlete of his stature hurts Nike, especially while smaller rivals are already taking business from it. On’s announcement makes the competition for Nike’s next generation of customers harder to ignore.
Nike shares have lost more than three-quarters of their value from the 2021 peak. The market is asking whether a company built around sporting greatness can earn its way back after years of overdistribution and weak product choices.
There is still plenty of demand for the right Nike product. More than 2 million consumers signed up for notifications about Mind, which sold out across regions. Nike said it doubled production for the following two seasons. Running has also delivered five consecutive quarters of double-digit growth. Nike Q3 call, Nike Q4 call.
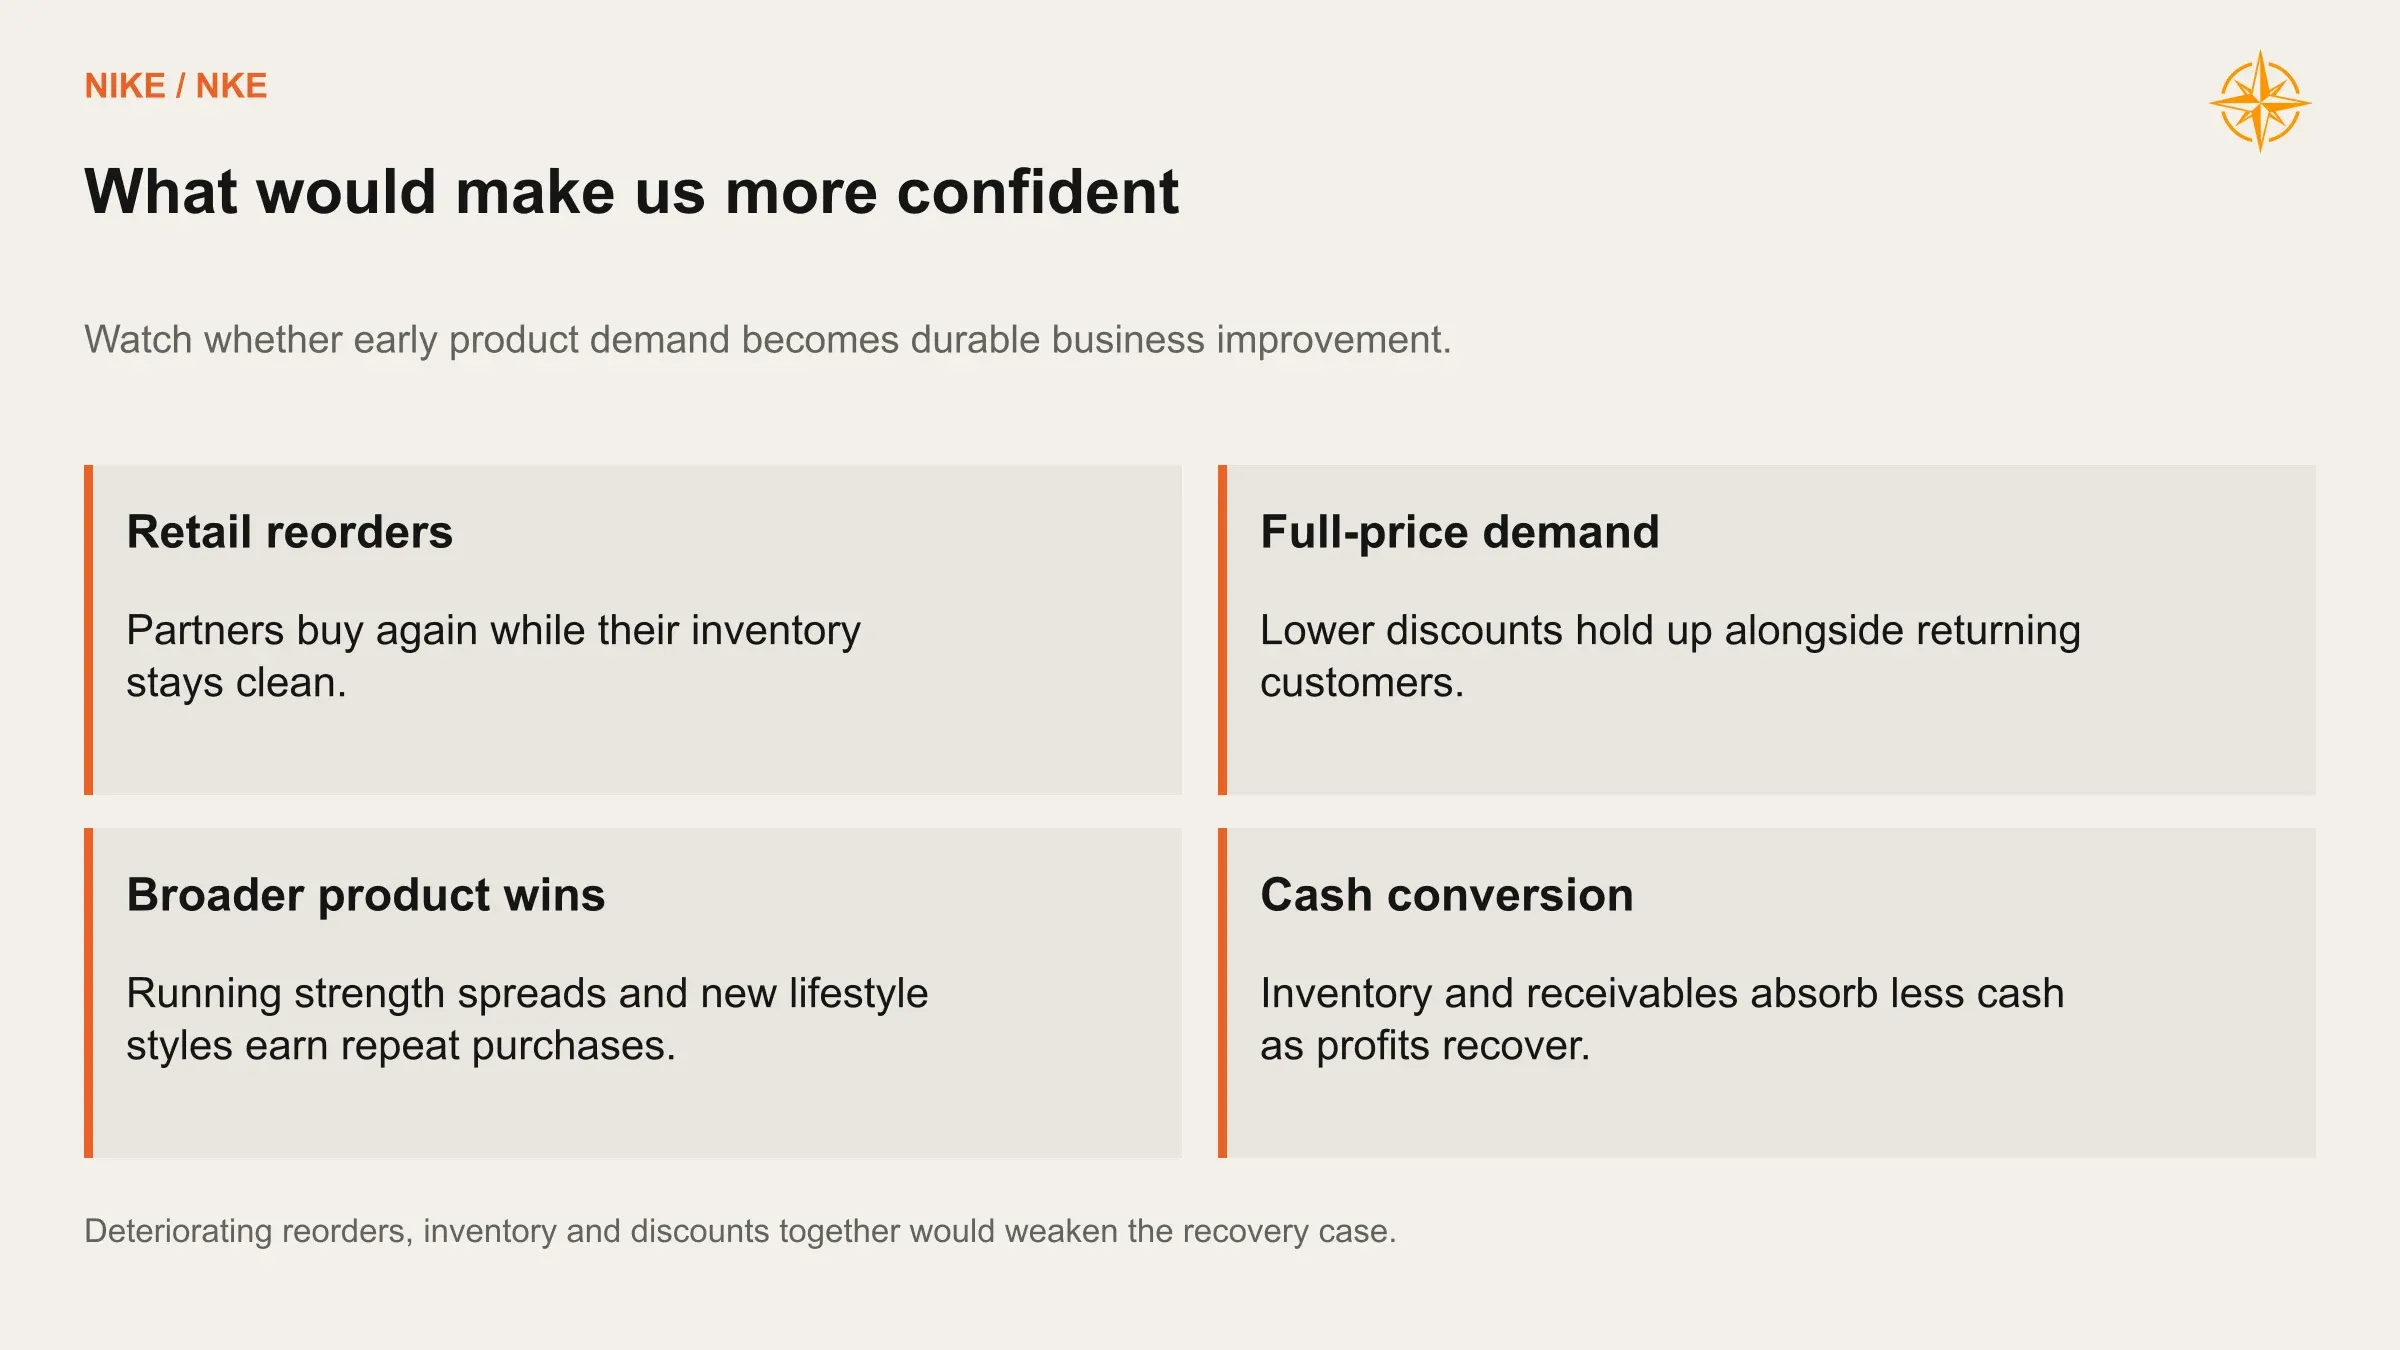
So is Nike stock a buy? We see a credible recovery taking shape, with enough unfinished work to make the entry price matter. Running is improving, retailers are seeing cleaner inventory, and the cost base can become more productive. Lifestyle demand still has to catch up. Our valuation and buying thresholds appear in the Premium section below.
Performance and lifestyle are moving at different speeds. Sportswear and Jordan Streetwear together account for roughly half of revenue, and management expects both to decline again in fiscal 2027. The growing categories have to support a global cost base while the rest of the business recovers.
The investment case depends on how quickly stronger product demand becomes enough gross profit to cover Nike’s marketing, payroll and distribution costs.
We separate performance from lifestyle in each major region, give China and Converse their own recovery paths, and account for the different costs of wholesale and direct selling. The forecasts include employee awards, cash needs and dividends across 108 combinations of operating conditions.
Our Base case lands on $53.06 billion of fiscal 2030 revenue, $7.14 billion of operating profit and $6.12 billion of free cash flow. It gets there on a surprisingly modest set of hopes. China stays smaller than it was in 2026, Converse stays smaller, and lifestyle outside those two merely stops shrinking. Running shoes and better economics carry the rest.
One Company, Two Speeds
Start with the half that works. Running grew more than 20% in the third quarter and added about $1 billion of revenue across its 5-quarter streak. Nike also reports a 5-point share gain in statement running footwear across Western Europe and North America. That is a narrow slice of the market, and it happens to be the slice where serious runners, and everyone who copies them, make up their minds.
Nike has regrouped about 8,000 employees into sport-specific teams. Designers, marketers and distribution teams now work around the same sport. That should help good ideas reach the right shoppers faster, although the benefits still need to show up across the wider business.
Football offers another encouraging sign. By the start of the 2026 World Cup, Nike had sold 2.5 times as many national-team kits as at the same point in 2022. Its new Mercurial also set a Nike Direct record for 24-hour cleated-footwear launch sales. Those gains give us more confidence that the product recovery can spread beyond running.
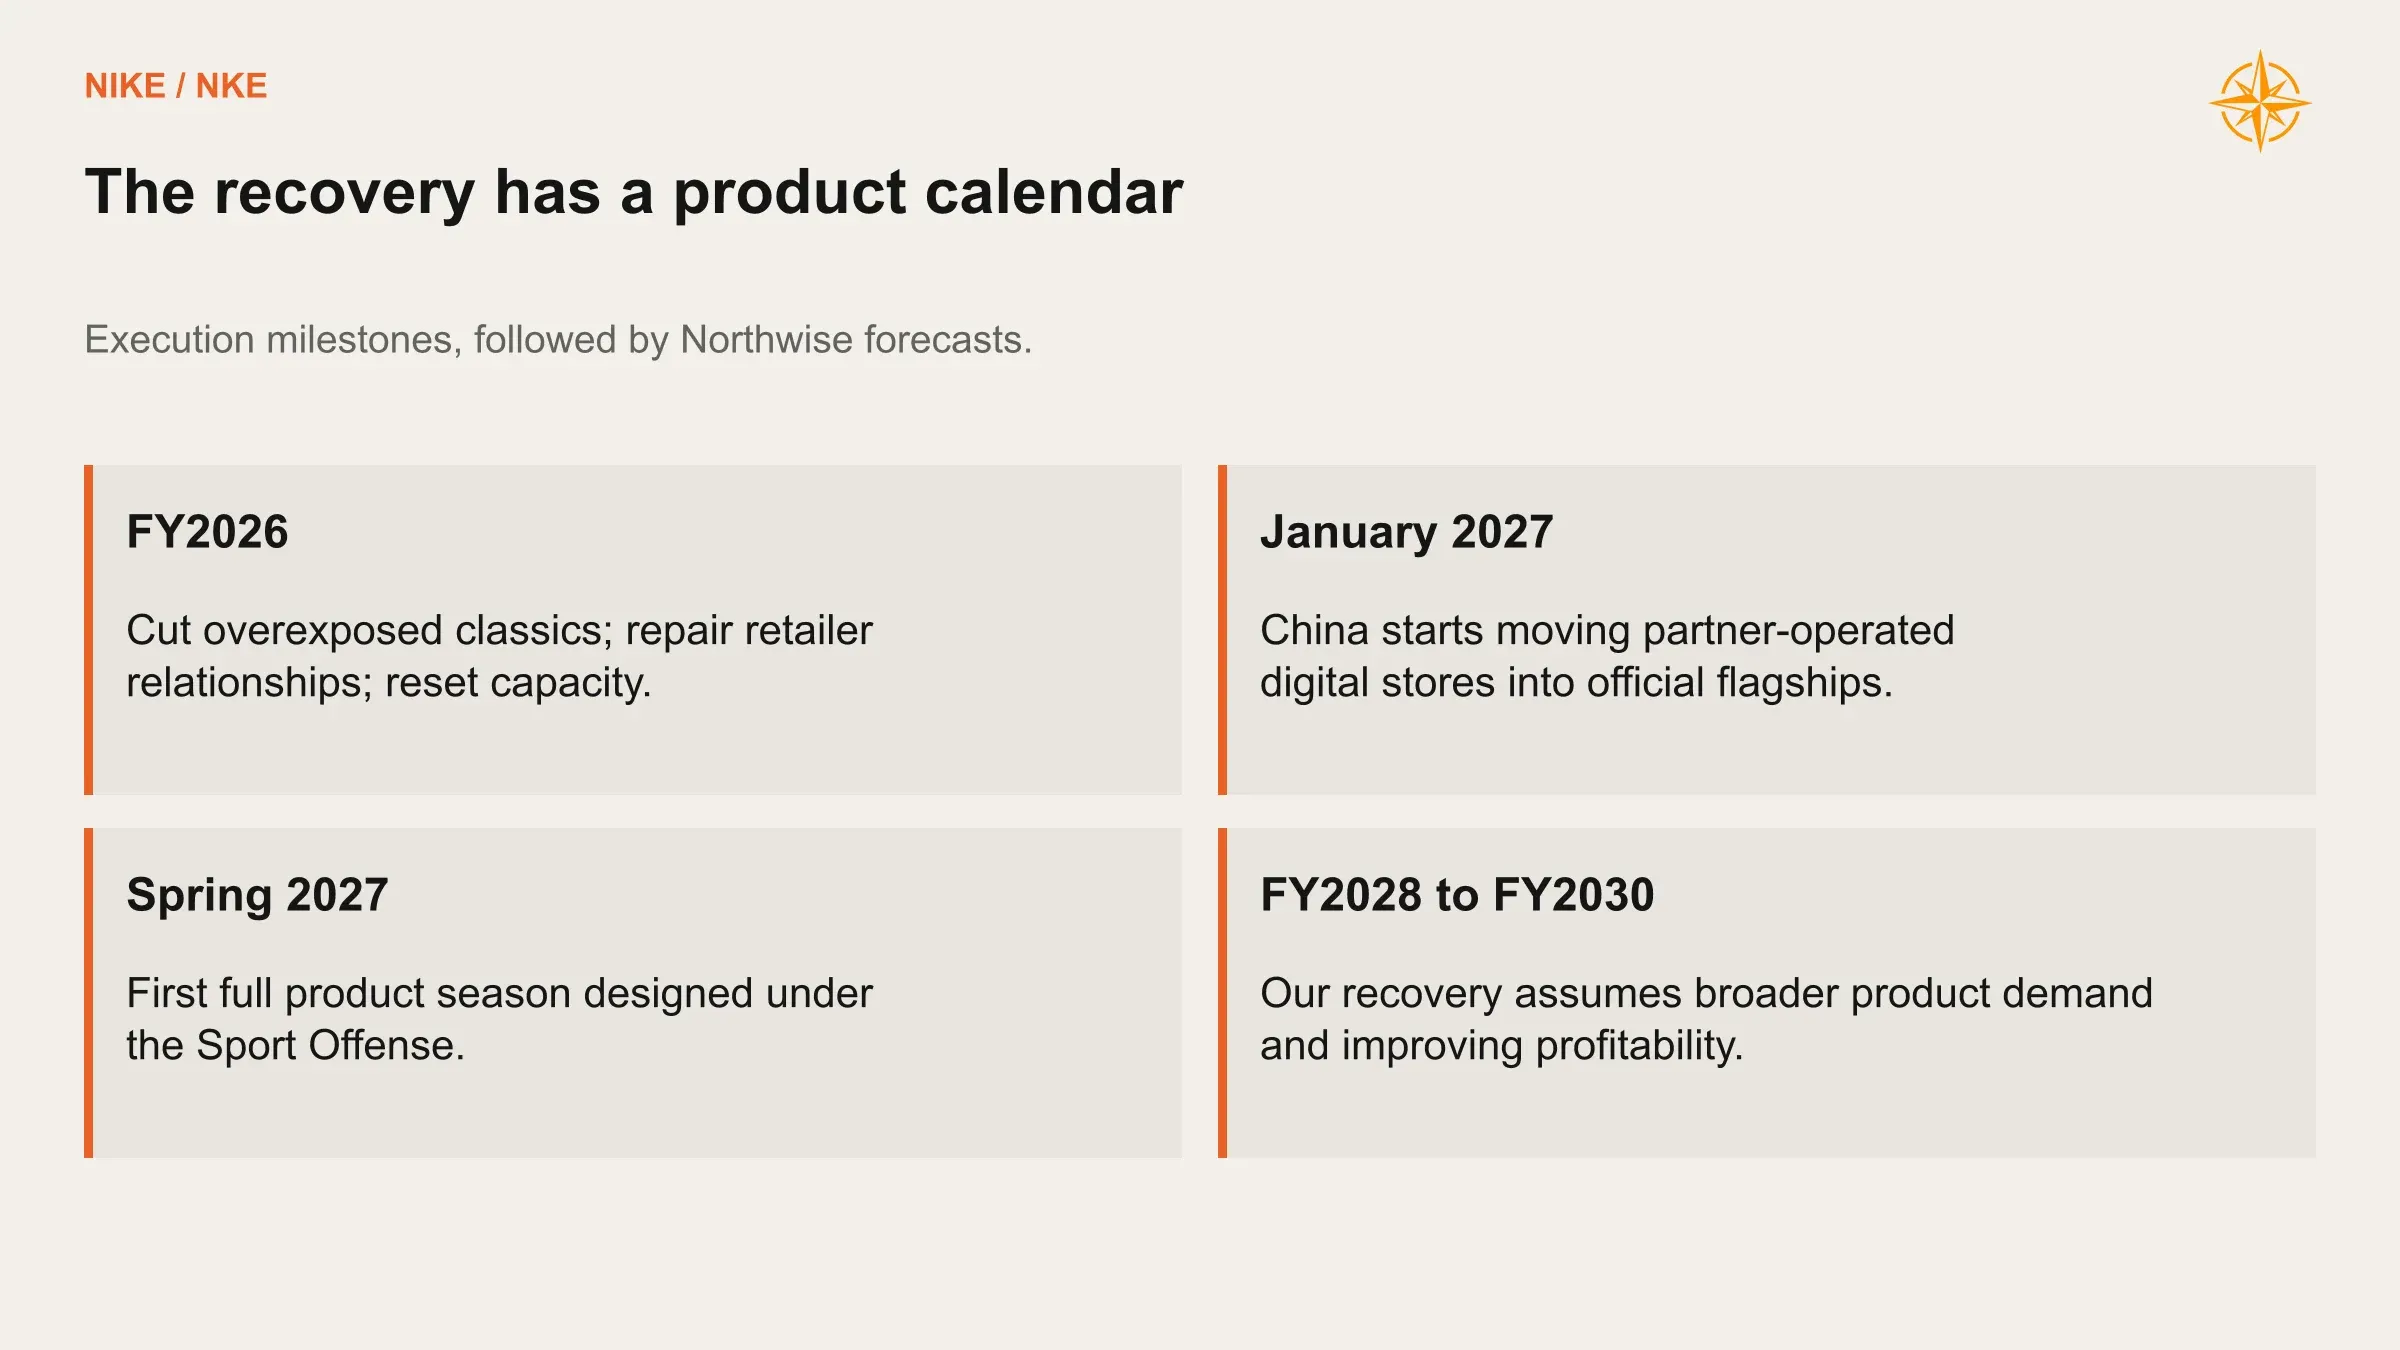
Now the half that isn't working yet. Sportswear and Jordan Streetwear are the shoes people wear to brunch and the office, and management expects both to shrink again in fiscal 2027 before improving in the back half. During fiscal 2026 Nike deliberately cut more than $2 billion from classic franchises it had flooded into the market, think Dunk, Air Force 1 and Air Jordan 1.
Calling that cut intentional is fair. It still leaves a $2 billion hole that has to be refilled with something people will buy at full price.
The refill arrives on a product calendar, and product calendars move slowly. Spring 2027 is the first season in which shoes designed start to finish under the new structure reach stores. More than a dozen new Sportswear styles are planned for the second half of fiscal 2027. A shoe that lands in March cannot rescue the previous October, so fiscal 2027 will probably look worse on paper than the progress underneath it.
Caitlin Clark’s first signature collection launched in China on September 24, with its global release set for October 1. Nike has given no volume estimate. We include these launches within category growth. Jordan’s $7.03 billion of revenue already sits inside Nike Brand, so it is included in the regional totals. Nike launch announcement.
Our rule for launches is simple. Hype proves people are watching. A retailer reordering a season later proves they bought.
How Nike Talked Itself Into the Wrong Channel
Nike built too much capacity around its direct business. The resulting costs became harder to carry when digital demand weakened.
Picture a restaurant that doubled its seating during a boom, signed the leases and hired the staff, then watched the crowd thin out. Nike did something similar during the pandemic, building supply-chain and technology capacity for a much bigger digital business. When revenue cooled, the costs stayed seated. Management is now cutting distribution capacity and simplifying its technology, with savings expected to start in fiscal 2027 and build through 2028.
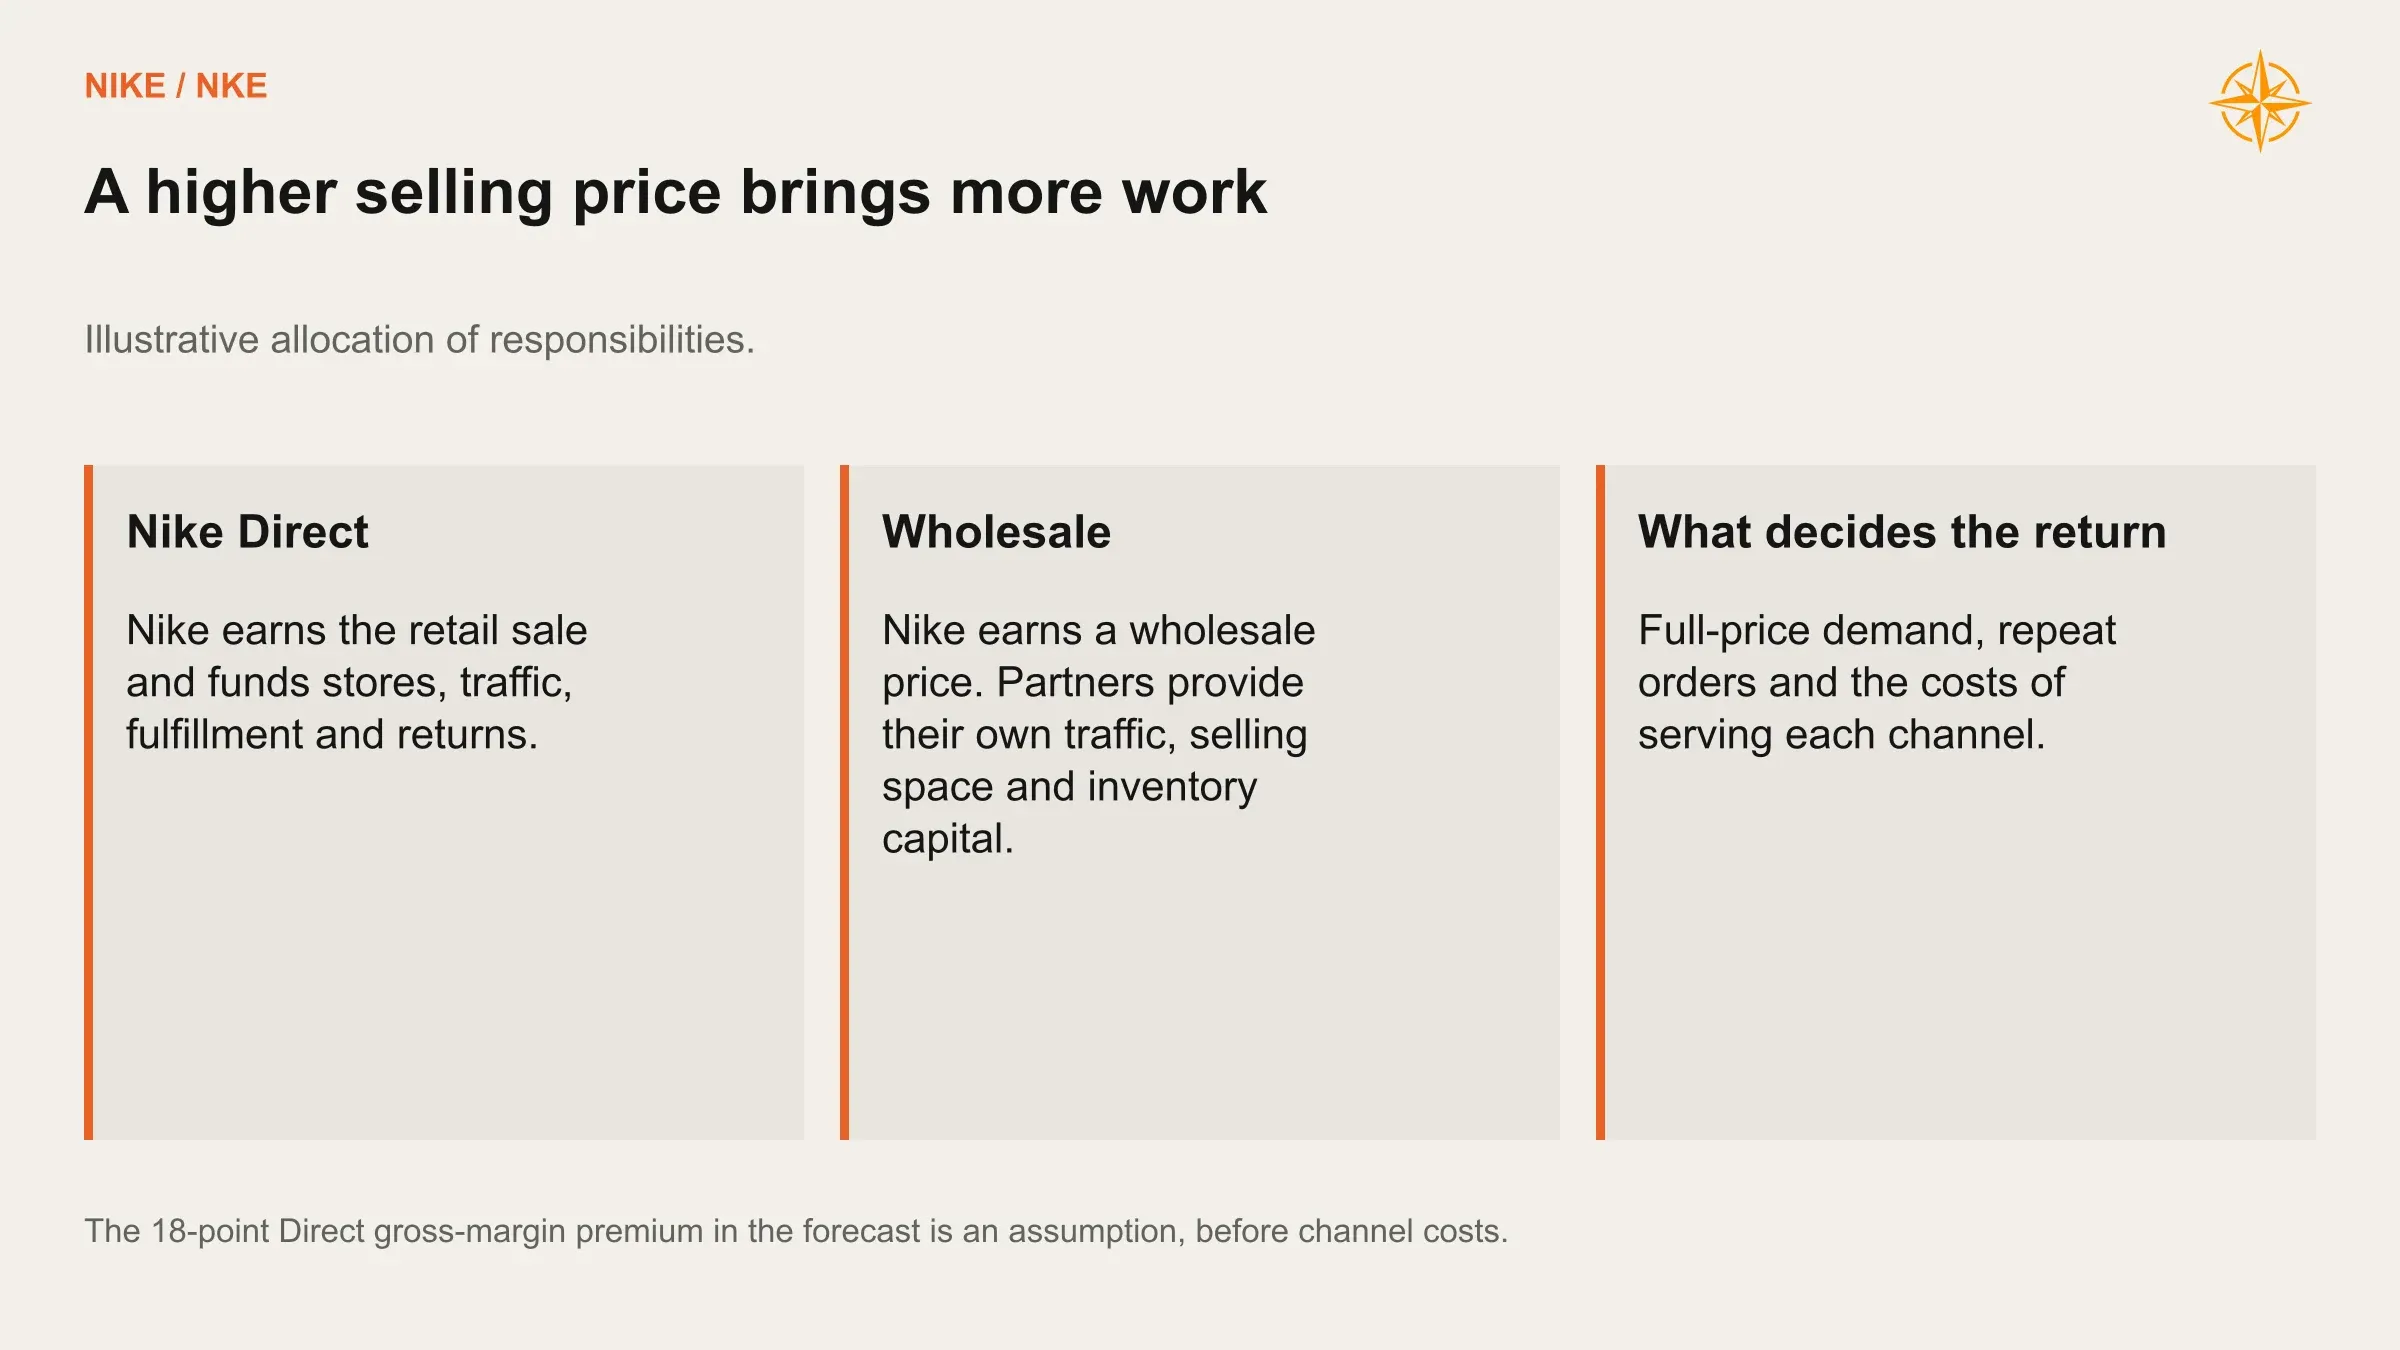
Selling direct was never a dumb idea. Nike keeps more of every sale, controls how the product looks and learns who its customers are. The fine print is everything a retailer used to handle: getting shoppers through the door, holding inventory, shipping orders and eating the returns. In a boom, the brand pockets the extra margin, and in a slump it pays for all of it alone.
Wholesale is the humbler arrangement. Nike gets less per pair, and Foot Locker or DICK'S supplies the foot traffic, the shelf and some of the capital. A full-price pair sold through a partner can be worth more to Nike than a direct sale that needed 30% off to move.
Nike is now spending on both sides. In fiscal 2026 it refreshed more than 15,000 spaces inside partner stores and upgraded more than 150 of its own stores, which we read as the right instinct. Winning shelf space back is the easy part. Keeping it without paying retailers in markdowns is where the earnings get made.
Four Regions, Four Different Problems
North America is furthest along. Revenue rose 5% to $20.51 billion in fiscal 2026. Nike also posted positive comps at Foot Locker for the first time in 4 years, a real repair for a relationship that looked headed for divorce not long ago.
One figure needs care: the 10% jump in North American wholesale revenue in the fourth quarter. Nike's CFO said plainly on the call that shipments did not rise 10%. A large part of the gain came from fewer returns, discounts, cancellations and reserves. Picture selling roughly the same number of shoes and handing back fewer of them as coupons.
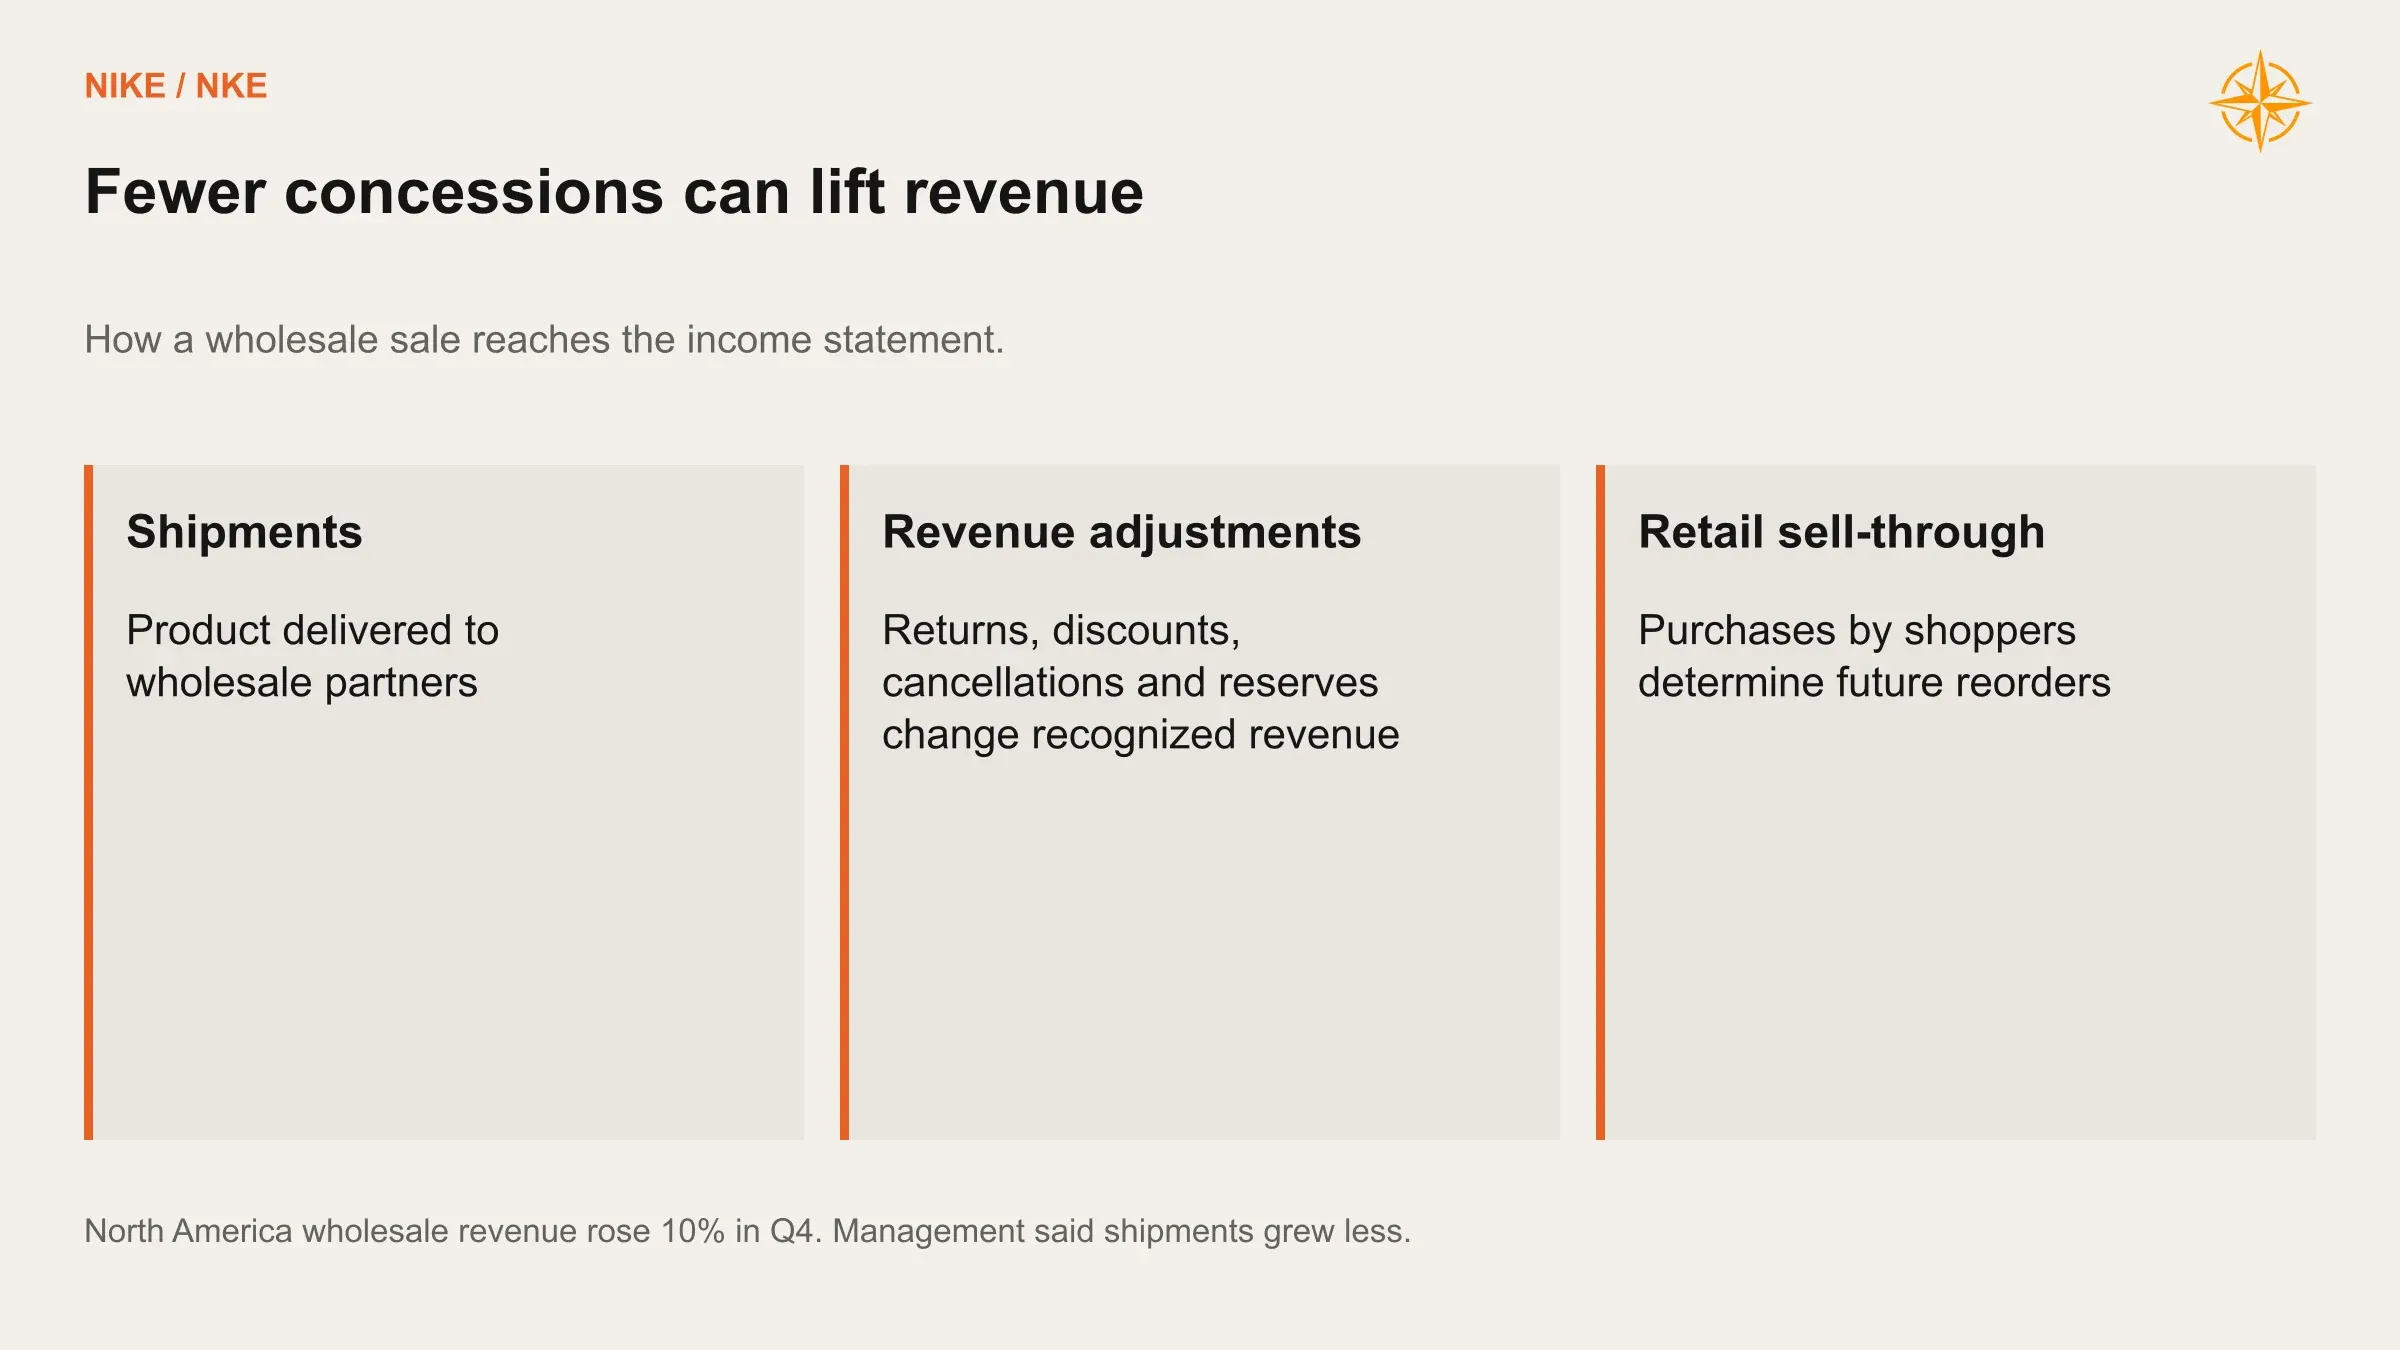
We like that kind of growth, since needing to pay retailers less to carry your product is a sign of a healthier brand. Retail sell-through will show whether shoppers are buying more. The proof we want is retailers reordering, season after season.
Europe remains mixed. Fourth-quarter revenue fell 6% on a currency-neutral basis and digital sales fell 24%. Nike also cut off-price digital revenue by more than half and improved full-price realization by about 15 percentage points. Inventory was still up low double digits. Lower discounting is welcome, but we need evidence that enough customers will keep buying at the higher realized prices.
China is where the "go back to wholesale" playbook stops working. From January 2027, Nike plans to concentrate its Chinese digital business in official flagships on Tmall, JD.com and Douyin plus its own app, as most partner-run online storefronts transition out, with some licensee exceptions. So Nike is taking more control in China while handing more back to partners in America. The two moves only look contradictory until you see the shared principle: pick whichever setup makes more money after counting the customers lost along the way.
A quick example shows the trade. If a pair earns Nike $65 through a partner and $100 sold directly, Nike can lose about a third of those buyers in the switch and still collect the same revenue. Profit depends on what the extra $35 has to cover in platform fees, shipping, marketing and returns. Nike has disclosed neither the size of the affected business nor the share of customers it expects to keep, so we model a range.
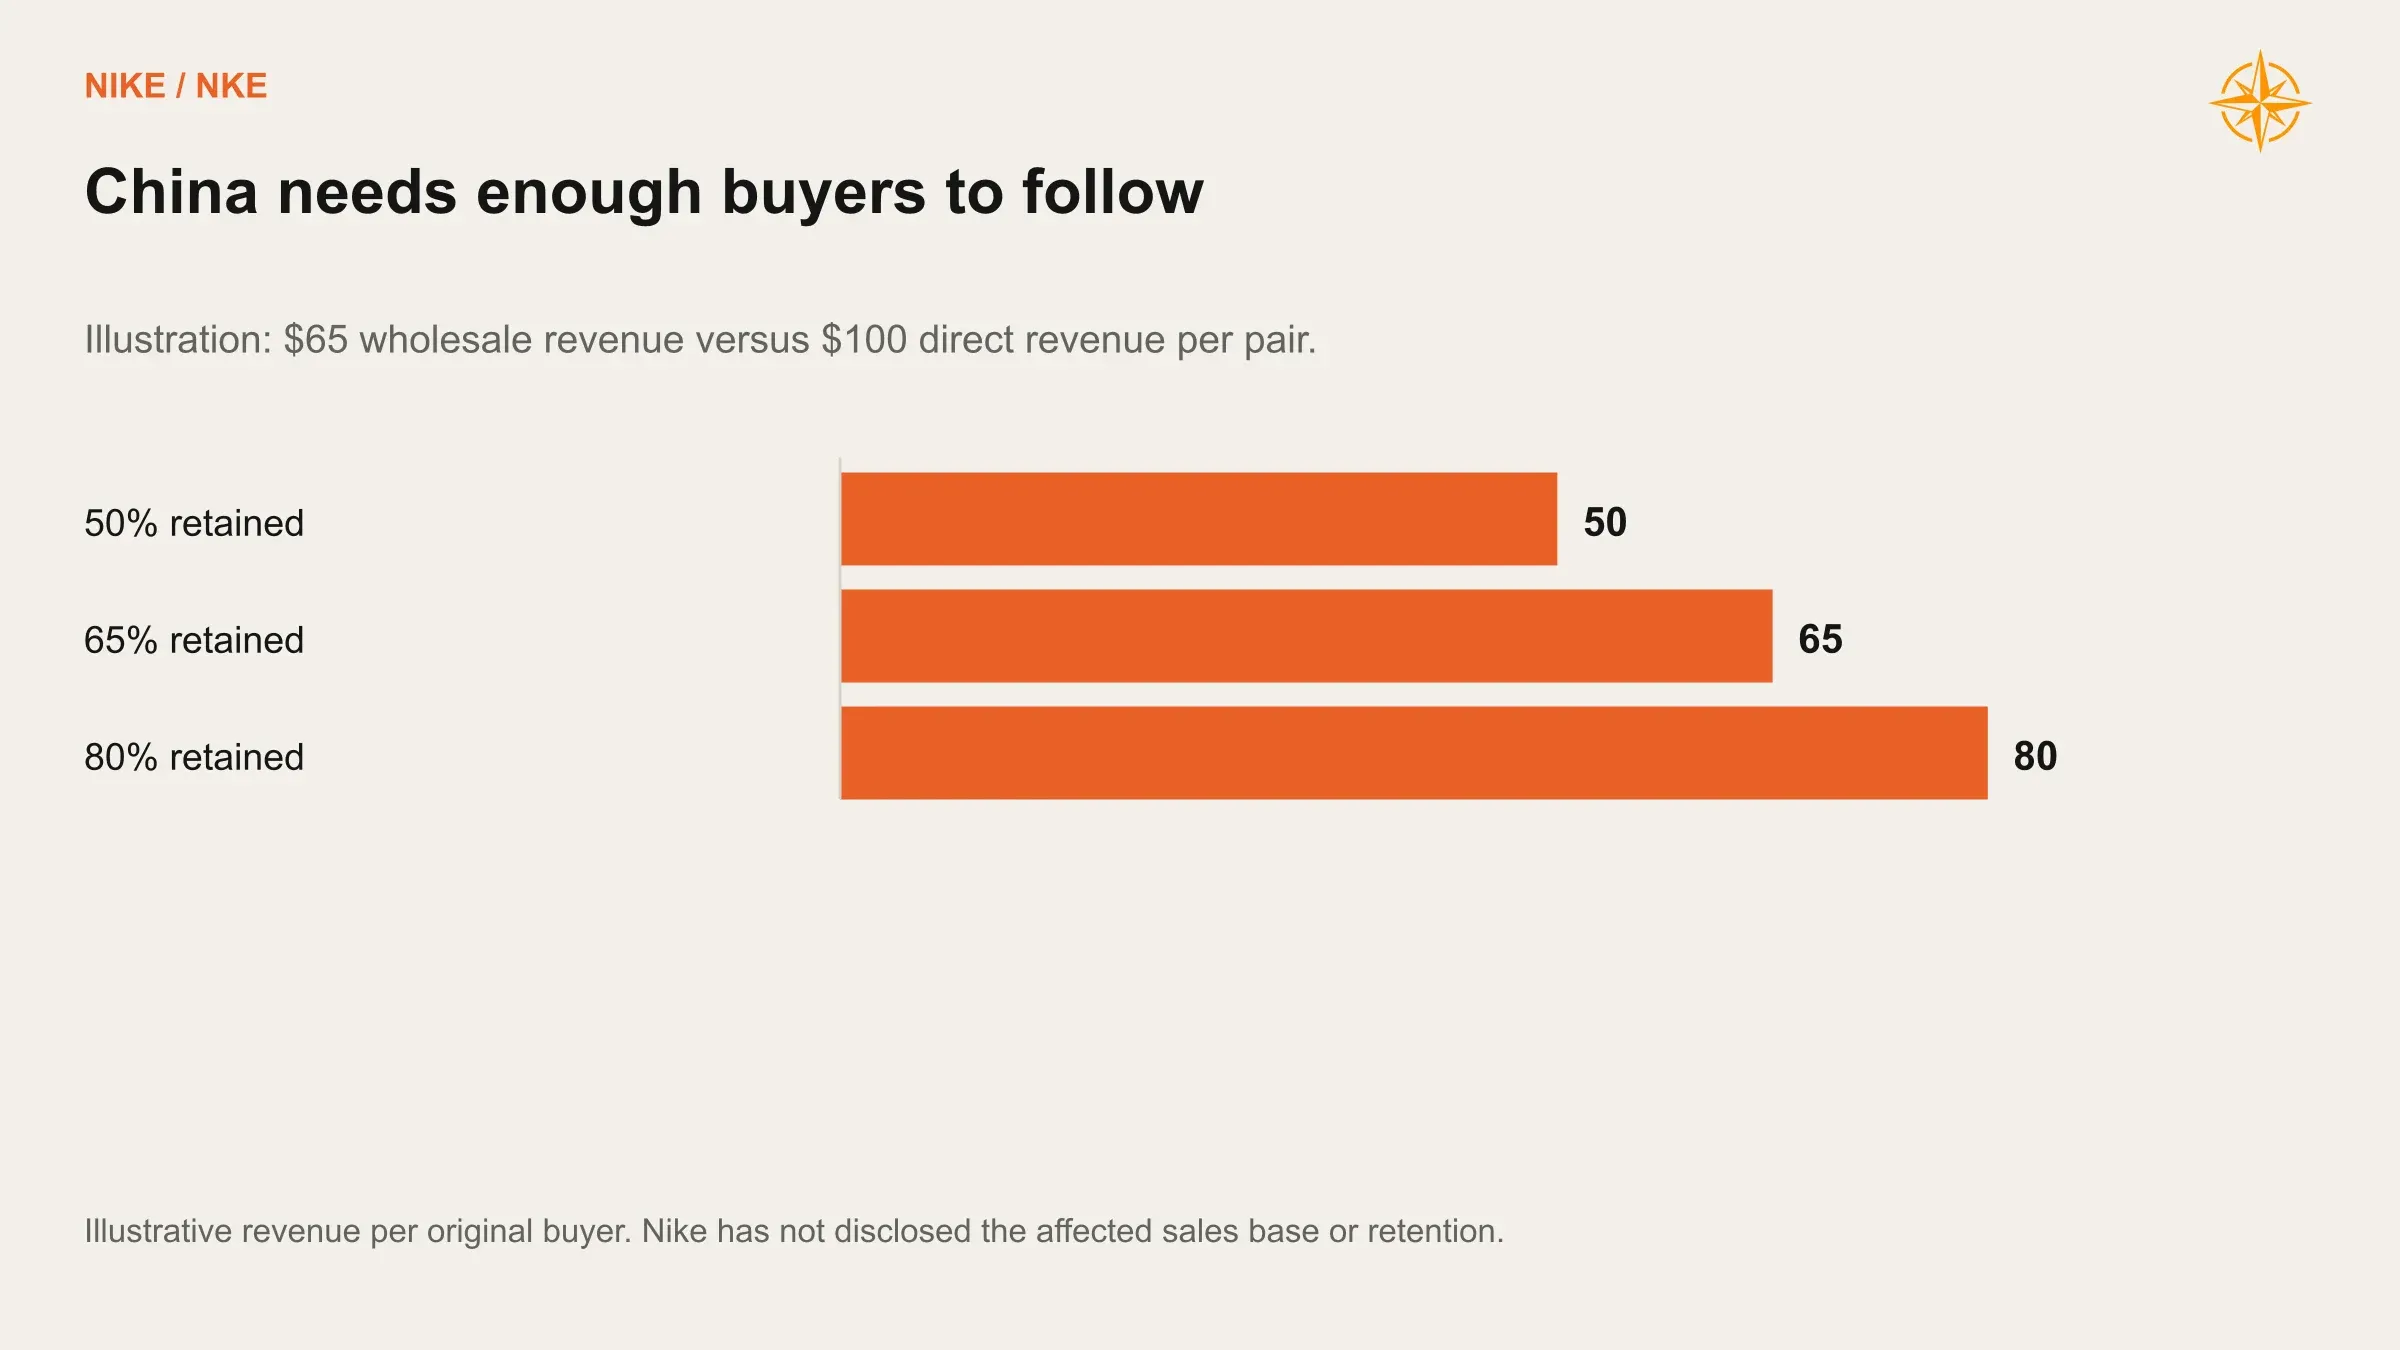
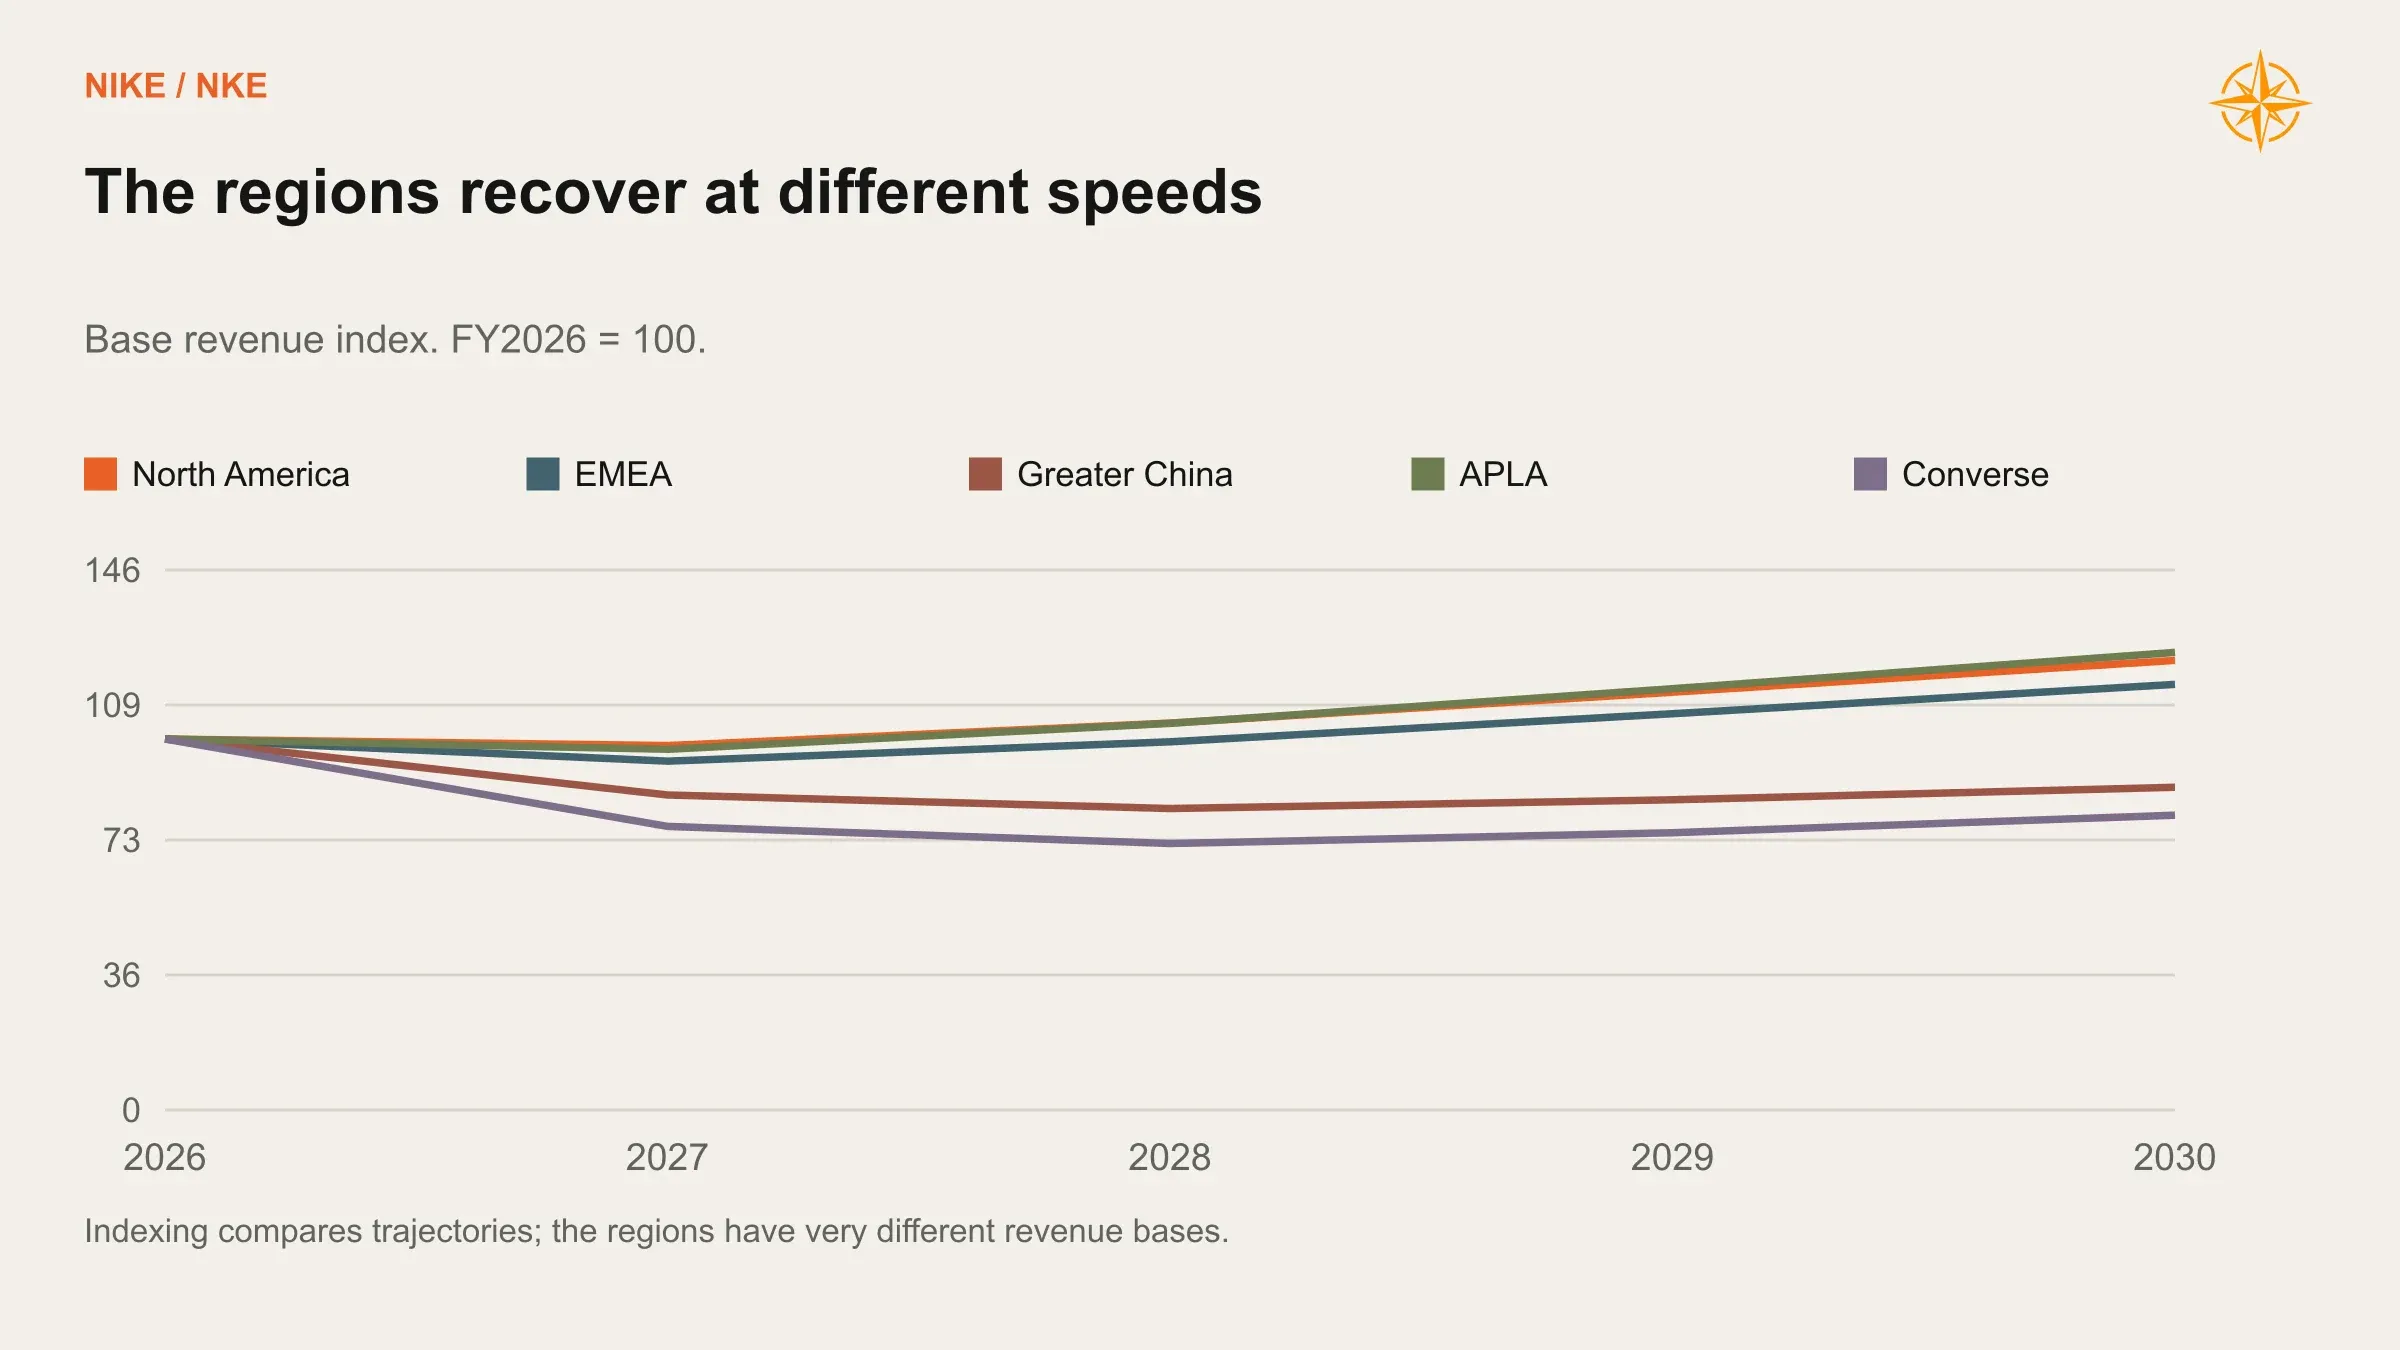
The early evidence in China cuts both ways. Fourth-quarter revenue fell 17%, and yet sell-through improved, discounts shrank and inventory came down. Locally designed products arrive in holiday 2027, and we count them only once shoppers can buy them. Our Base case lets China fall from $5.85 billion to $4.75 billion by fiscal 2028 and recover only to $5.09 billion by 2030, so the consolidated recovery never needs China to come roaring back.
Asia Pacific and Latin America behaves less like a region than a collection of local weather systems. It was down 1% on a currency-neutral basis in the fourth quarter, with running and football offsetting Sportswear. Converse is its own repair job after a 31% revenue drop to $1.17 billion. It is now too small to decide Nike's fate, and we see no reason it bounces just because its parent does.
Rivals Are Finding Demand
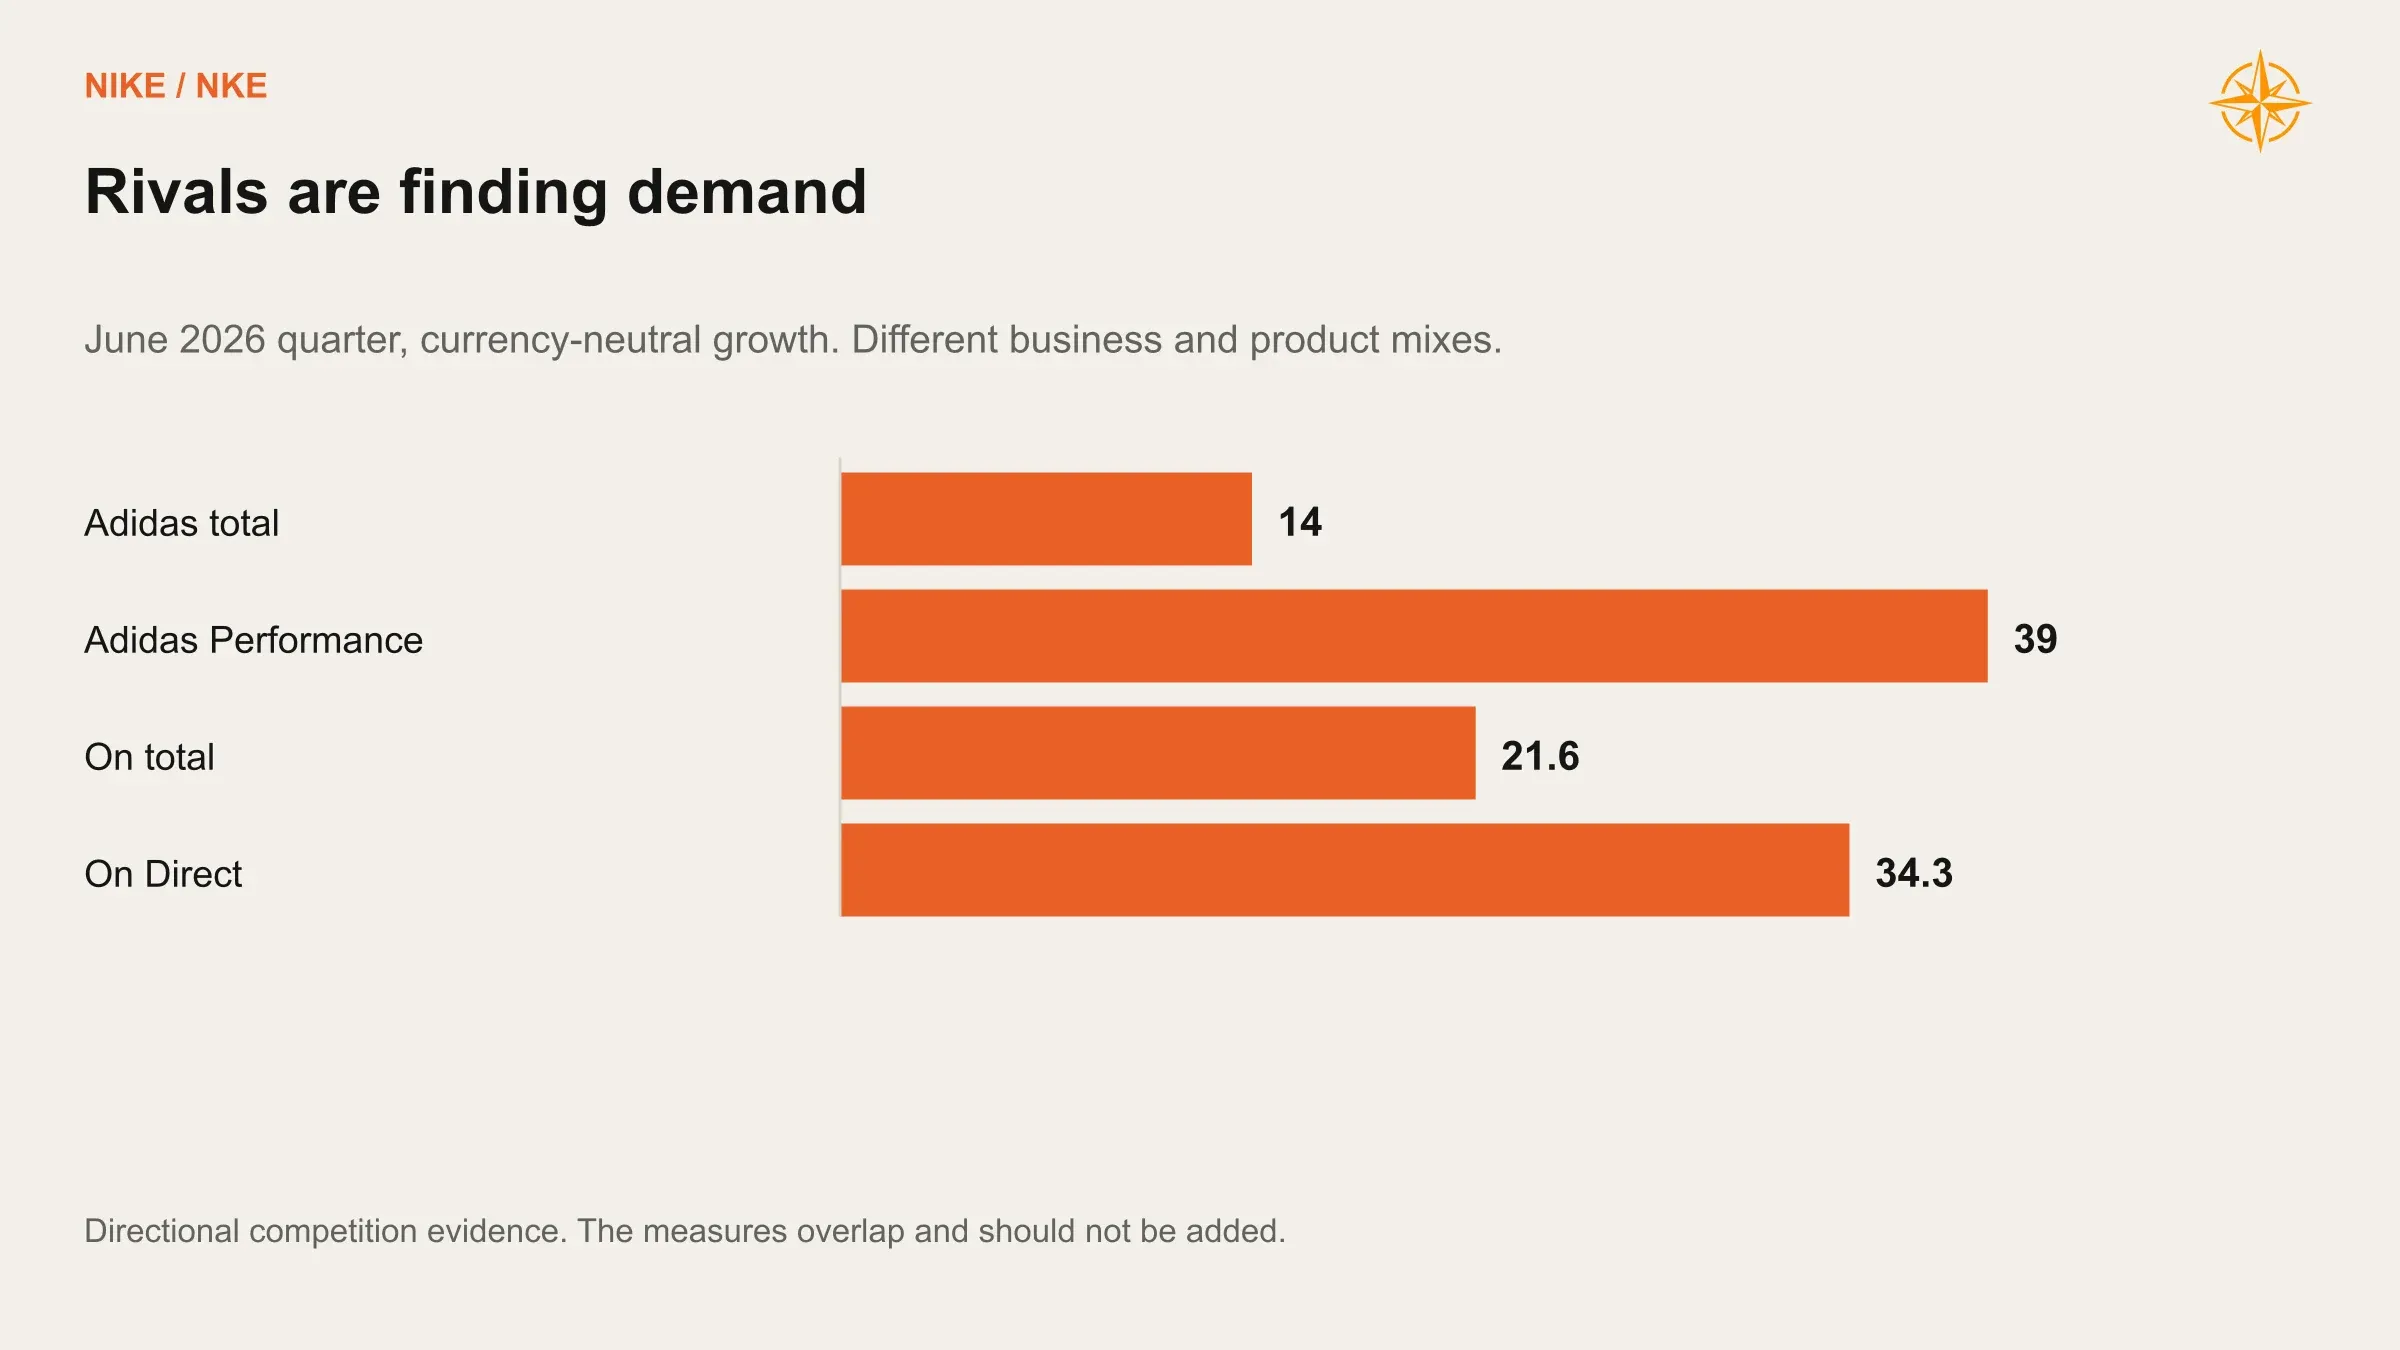
The most uncomfortable data in the Nike story belongs to other companies. Adidas grew 14% on a currency-neutral basis in the June quarter, with its Performance business up 39%. On grew 21.6% in constant currency, and its direct sales rose 34.3%.
The rival results make it harder to attribute all of Nike’s weakness to consumers or to direct selling. Product appeal and execution clearly matter. Adidas also described lifestyle footwear as difficult and promotional, which suggests Nike faces both a category problem and problems of its own.
Retailers show where that pain lands. DICK'S grew comparable sales 4.9% in its namesake stores last quarter, while Foot Locker, which it now owns, saw comps fall 3.6%. Management blamed legacy silhouettes, retro product and disappointing launches. The disclosure names no brand, though Nike's classics are the biggest tenant on that particular shelf.
Mbappé’s move to On adds another competitor in football. Nike has to keep earning its place with athletes and shoppers even as it repairs the business. Our recovery assumptions allow rivals to keep growing.
The strongest Nike investment case rests on winning customers back through better products and better distribution.
The Earnings Hiding Under a Tariff Refund
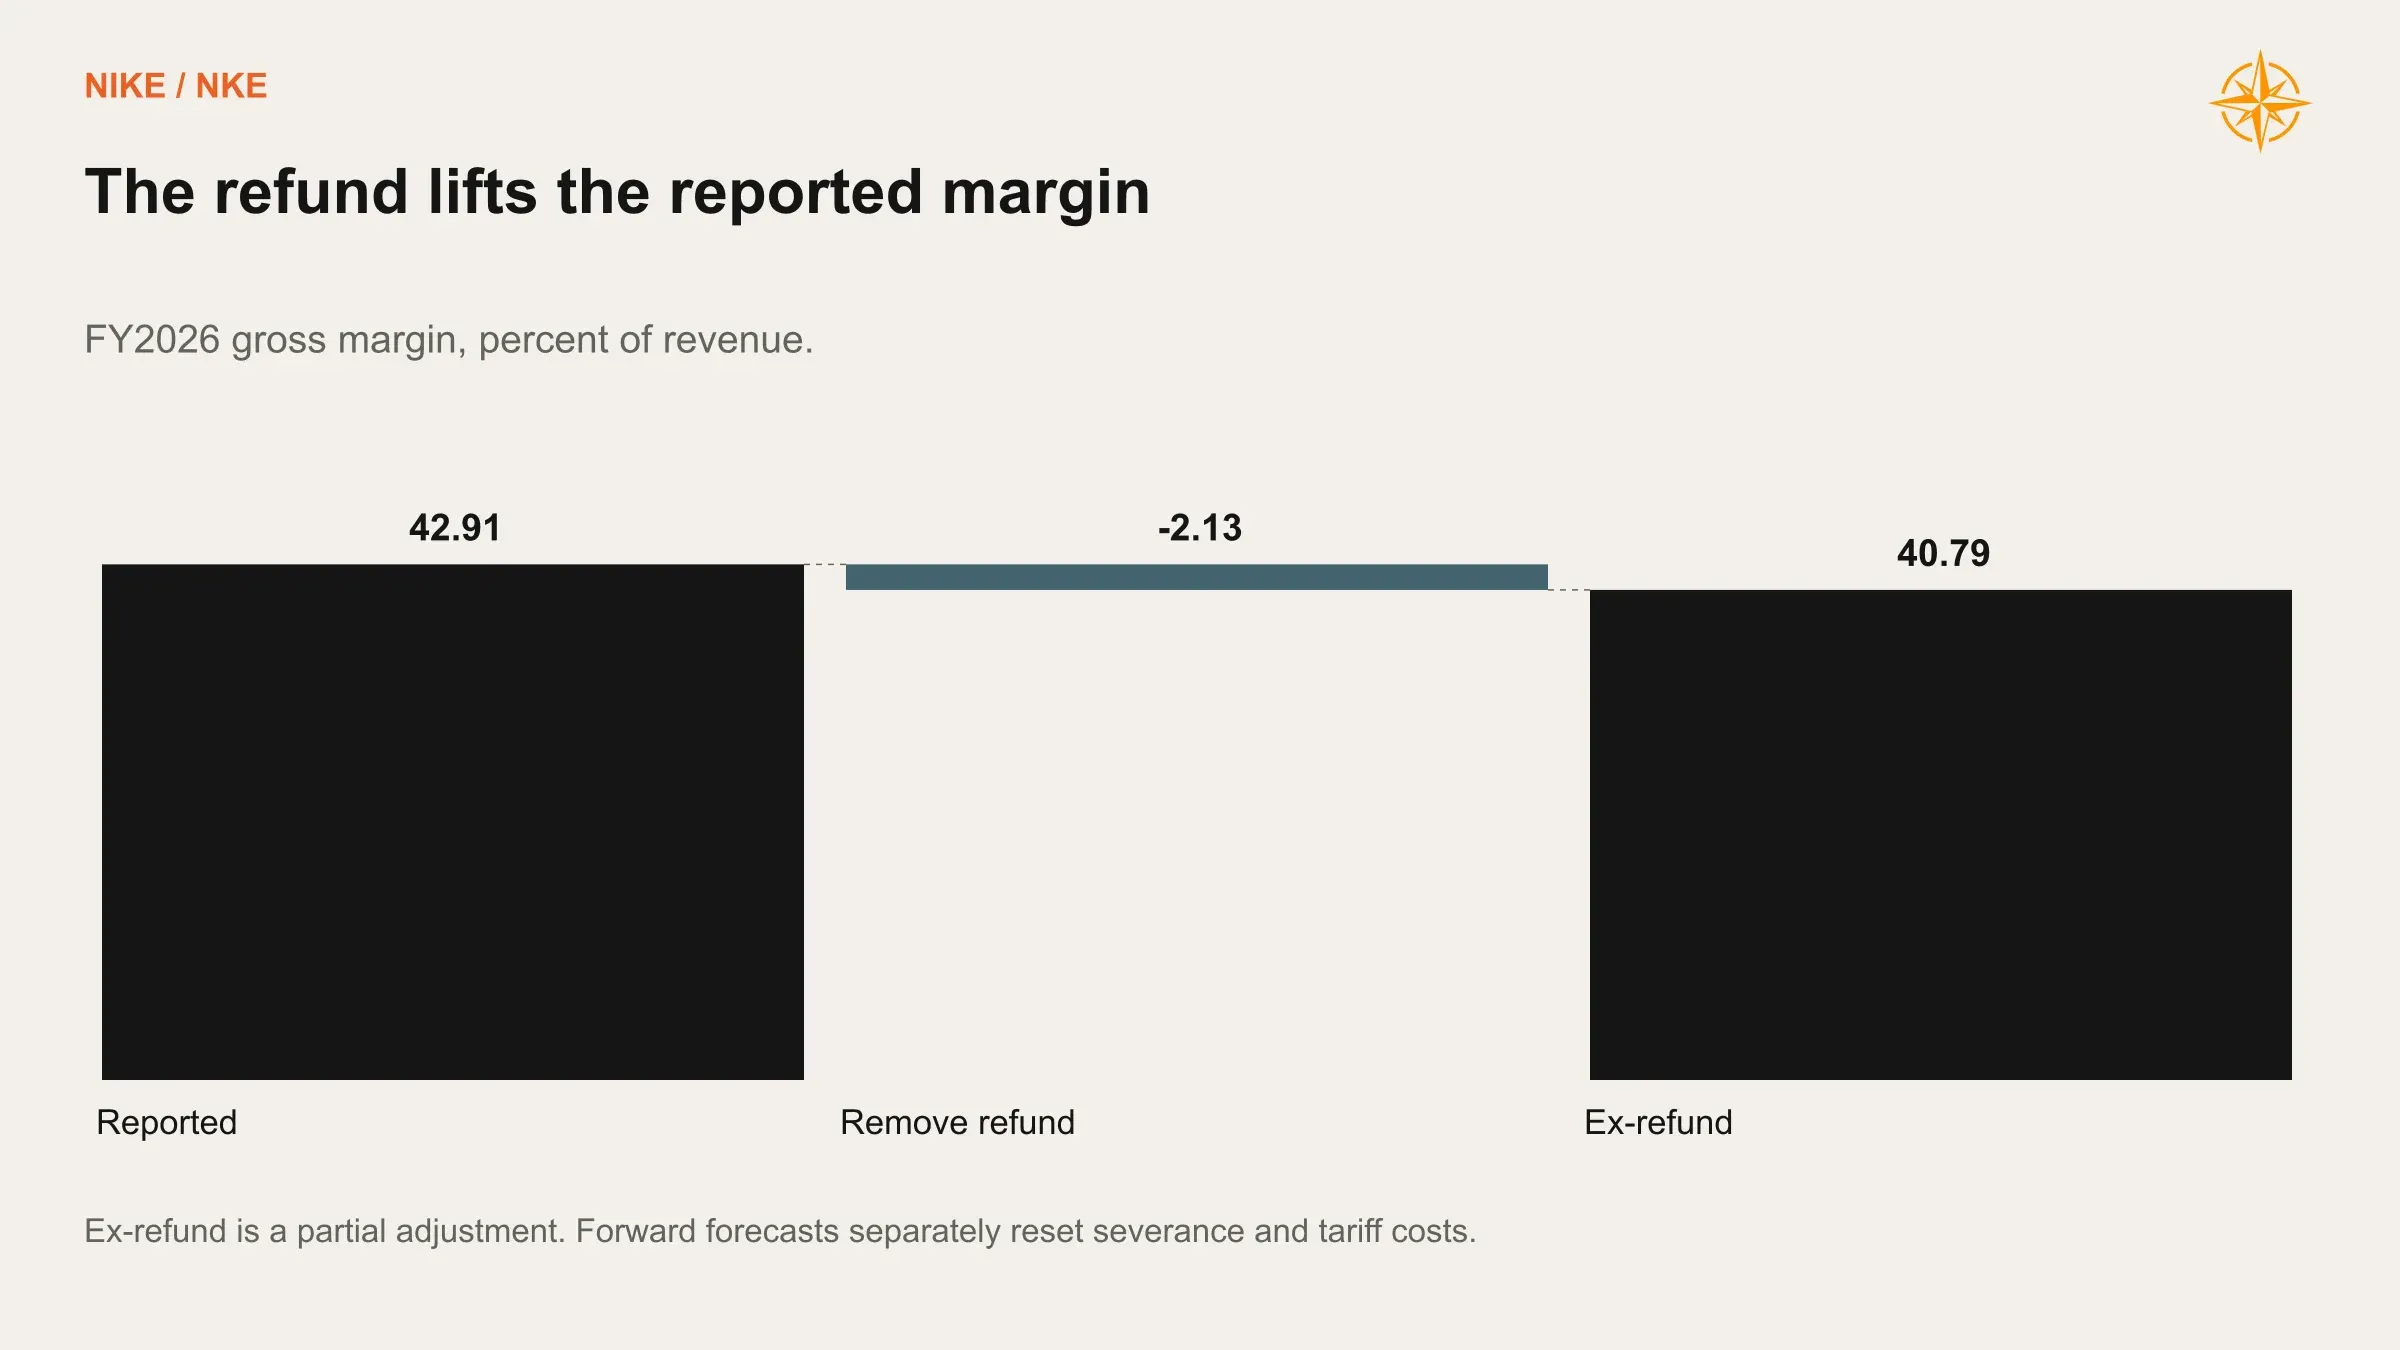
Nike's fourth quarter looked great for about as long as it took to read the footnote. Gross margin of 49.2% and EPS of $0.72 included a $986 million tariff refund worth roughly 9 points of margin and $0.52 of EPS. Strip it out and the quarter earned $0.20 a share on a 40.2% gross margin.
FY2026 financial anchor | Result |
|---|---|
Revenue | $46.40B |
Reported gross profit | $19.91B |
Reported gross margin | 42.9% |
Gross margin excluding tariff-recovery benefit | 40.8% |
Demand creation expense | $4.75B |
Operating overhead | $11.36B |
Operating profit before net interest and other income | $3.80B |
Reported diluted EPS | $2.10 |
EPS excluding tariff-recovery benefit | $1.58 |
Operating cash flow | $2.87B |
Capital expenditure | $0.68B |
Free cash flow | $2.18B |
Cash and short-term investments | $9.03B |
Operating profit is gross profit less demand creation and operating overhead. Free cash flow is operating cash flow less capital expenditure.
Adjusting for the refund cuts both ways. The refund reimbursed IEEPA tariffs that Nike had already expensed during the year. Removing the refund while keeping those old tariff costs would make Nike look worse than it is, and treating the refund as recurring would make it look better. We strip out both historical effects and charge a forward tariff cost of 1.00% of revenue in fiscal 2027, easing to 0.80% by 2030.
Take out the refund and $385 million of severance, $154 million of it in cost of sales and $231 million in overhead, and Nike earned roughly $3.20 billion of operating profit. That figure still carries the old tariff bill, and it is the starting line we build from.
Nike’s depressed earnings still matter to the valuation. The shares can look inexpensive against a successful recovery several years away while offering much less room for error against the profits the company earns today.
Building the Forecast From the Shoe Up
Nike doesn't publish how much of each region's revenue comes from performance product, so we estimate it at 52% in North America, 45% in EMEA and 52% in APLA. The split earns its keep by letting a running-led recovery and a stalled lifestyle business show up as two separate numbers. China and Converse run on their own paths.
Annual category growth before regional and macro adjustments | FY2027 | FY2028 | FY2029 | FY2030 |
|---|---|---|---|---|
Performance: strong expansion | 8.0% | 14.0% | 13.0% | 11.0% |
Performance: steady recovery | 4.5% | 7.5% | 7.5% | 6.5% |
Performance: weak conversion | 0.0% | 2.5% | 2.5% | 2.0% |
Lifestyle: successful renewal | −7.0% | 7.0% | 11.0% | 10.0% |
Lifestyle: partial repair | −11.0% | −1.0% | 2.5% | 3.5% |
Lifestyle: continued erosion | −16.0% | −7.0% | −3.5% | 0.0% |
Even the happiest lifestyle path opens with a 7% decline. Every recovery in this table has to clear the cleanup year first.
Base revenue, USD billions | FY2026A | FY2027E | FY2028E | FY2029E | FY2030E |
|---|---|---|---|---|---|
North America | $20.51 | $20.15 | $21.40 | $23.10 | $24.86 |
EMEA | $12.57 | $11.82 | $12.48 | $13.43 | $14.43 |
Greater China | $5.85 | $4.97 | $4.75 | $4.89 | $5.09 |
APLA | $6.24 | $6.07 | $6.51 | $7.09 | $7.70 |
Converse | $1.17 | $0.90 | $0.84 | $0.88 | $0.93 |
Global Brand Divisions and corporate | $0.05 | $0.05 | $0.05 | $0.05 | $0.06 |
Consolidated revenue | $46.40 | $43.96 | $46.03 | $49.44 | $53.06 |
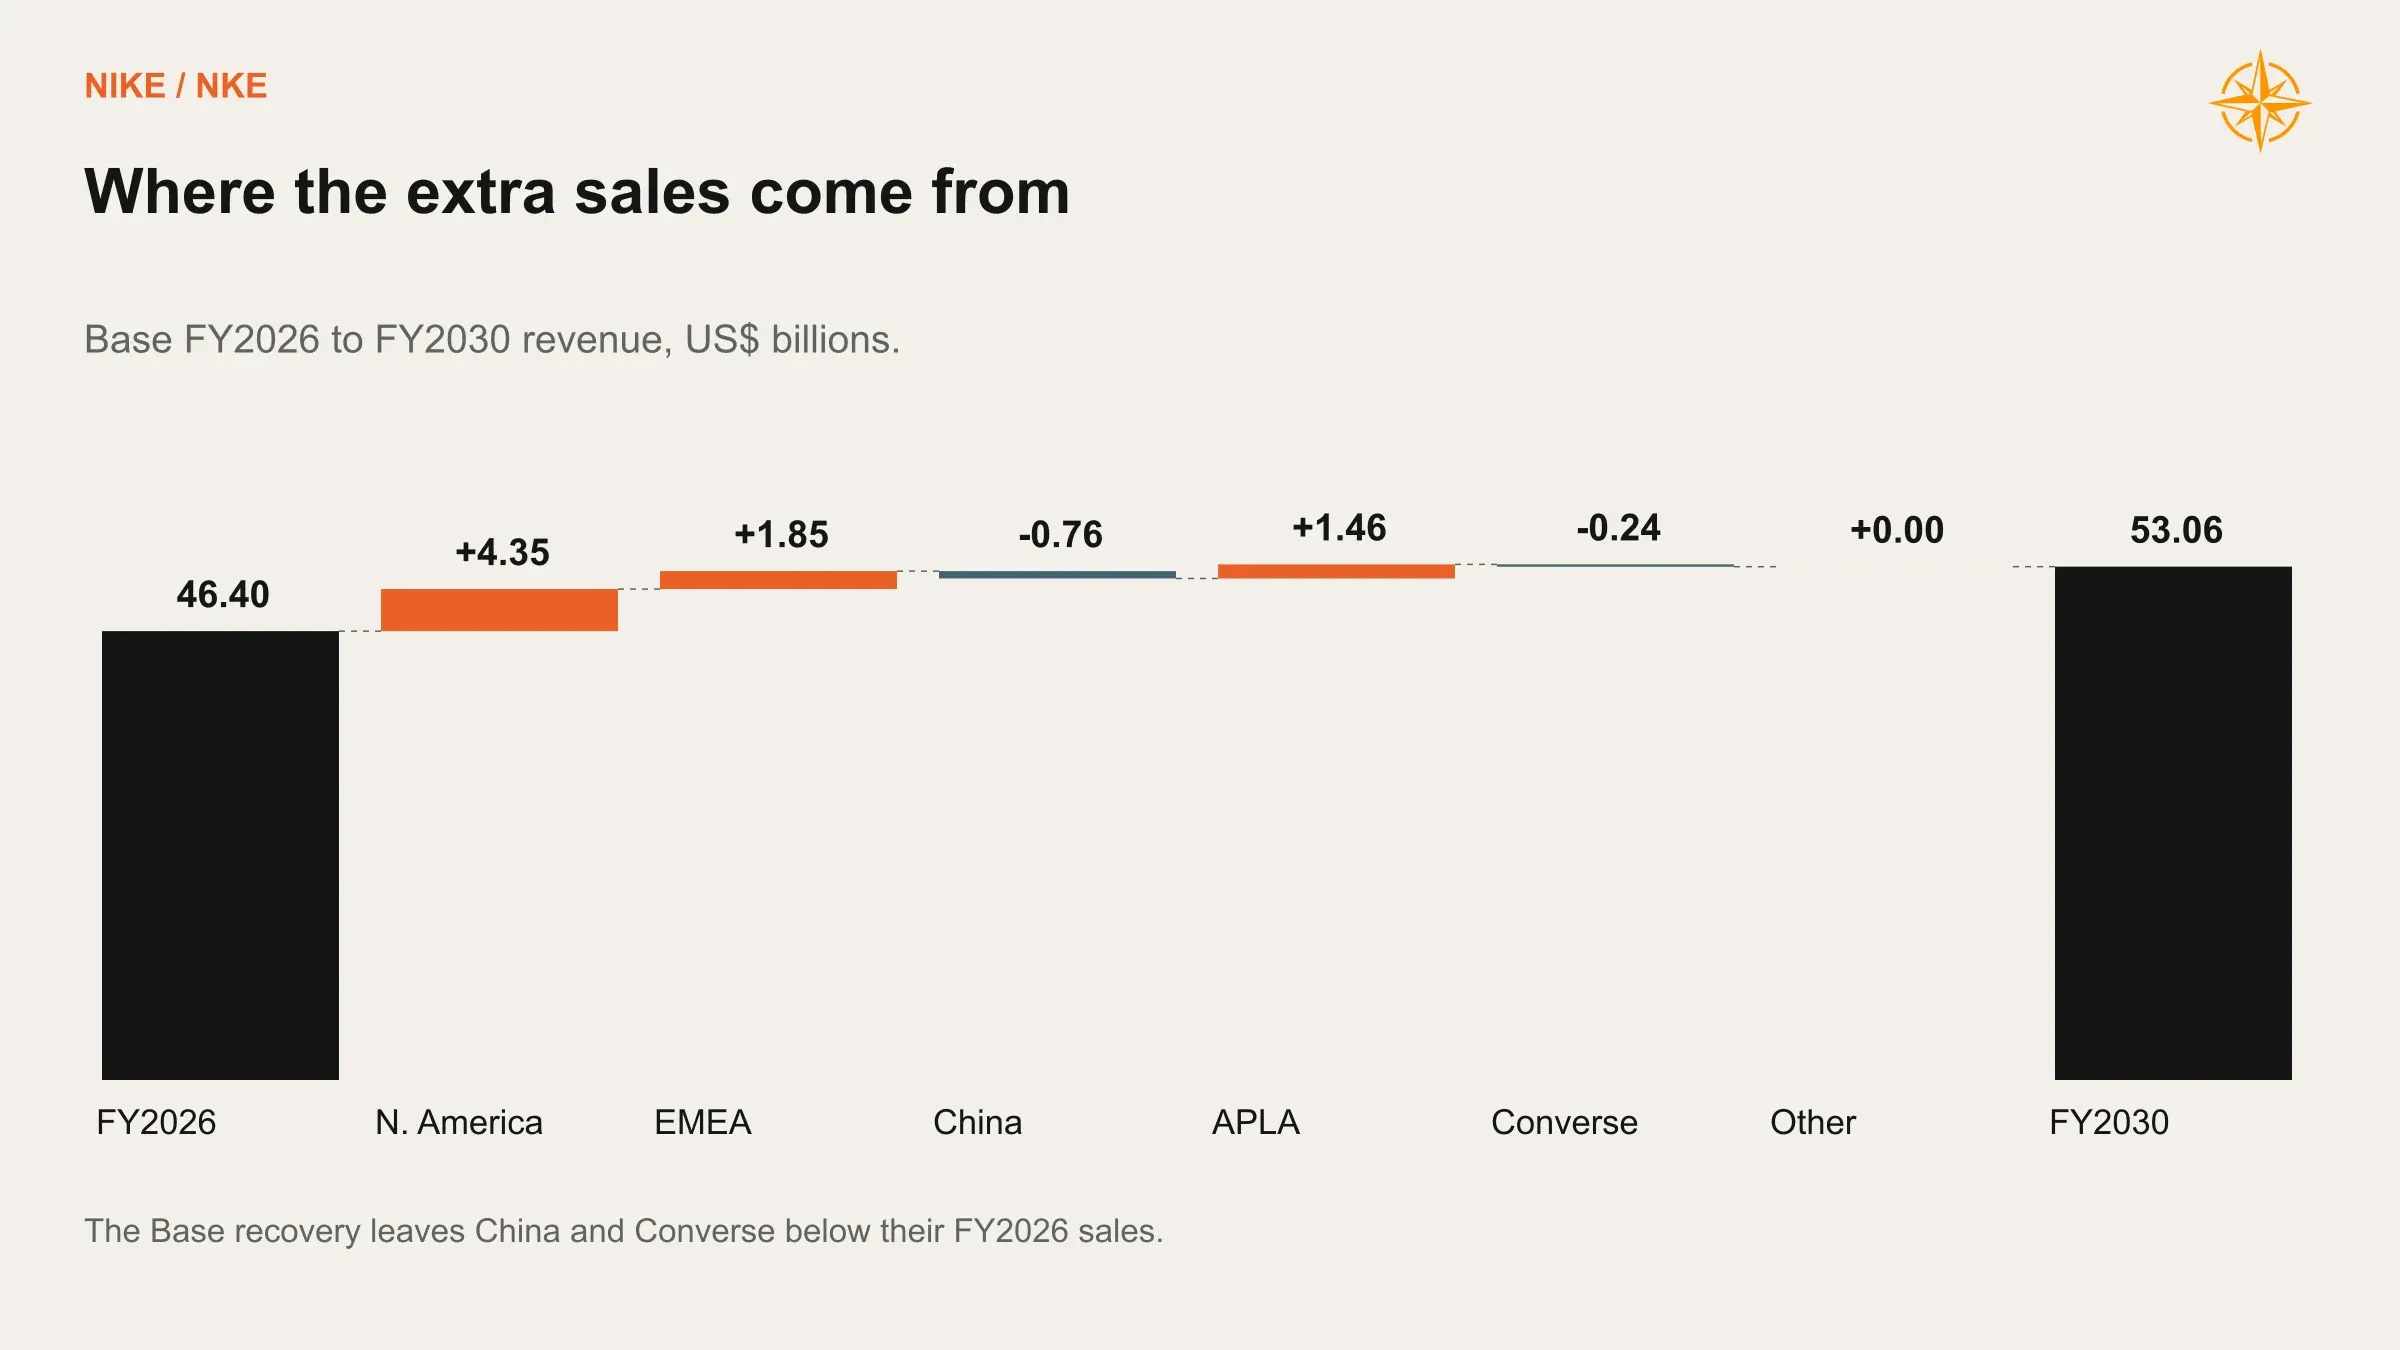
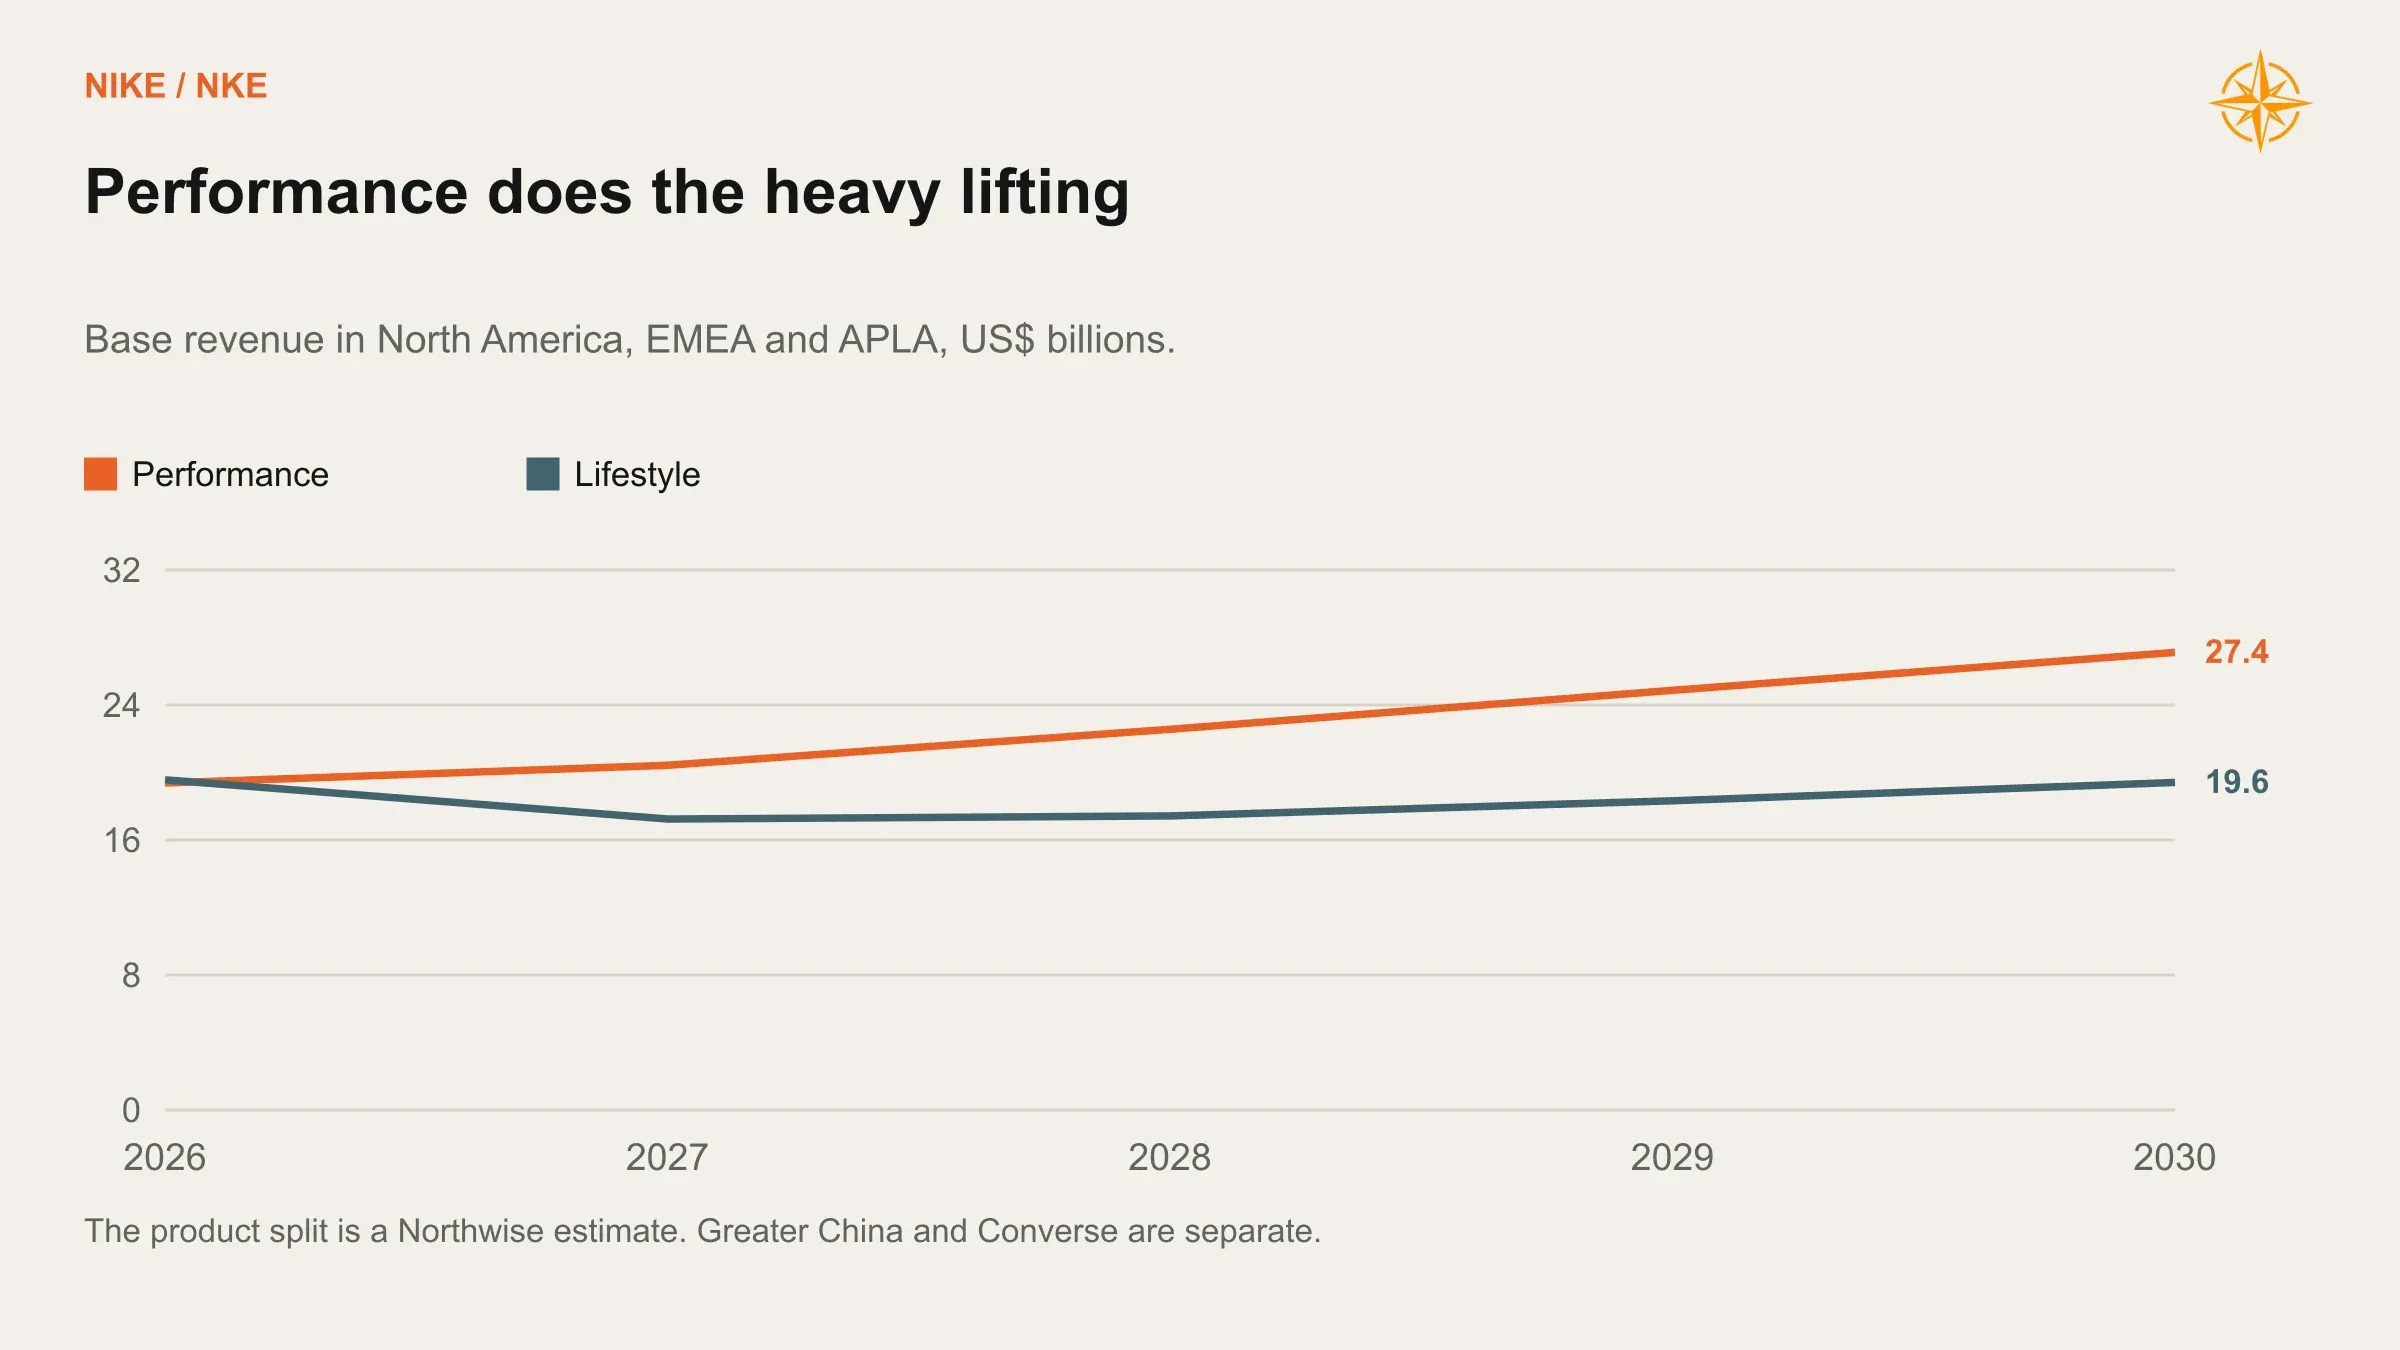
The interesting part hides inside the total. Across North America, EMEA and APLA, performance revenue grows from $19.57 billion to $27.38 billion, while lifestyle slips from $19.76 billion to $19.60 billion. Our Base case asks lifestyle for exactly one thing, to stop shrinking, and asks running, football and training to carry the growth.
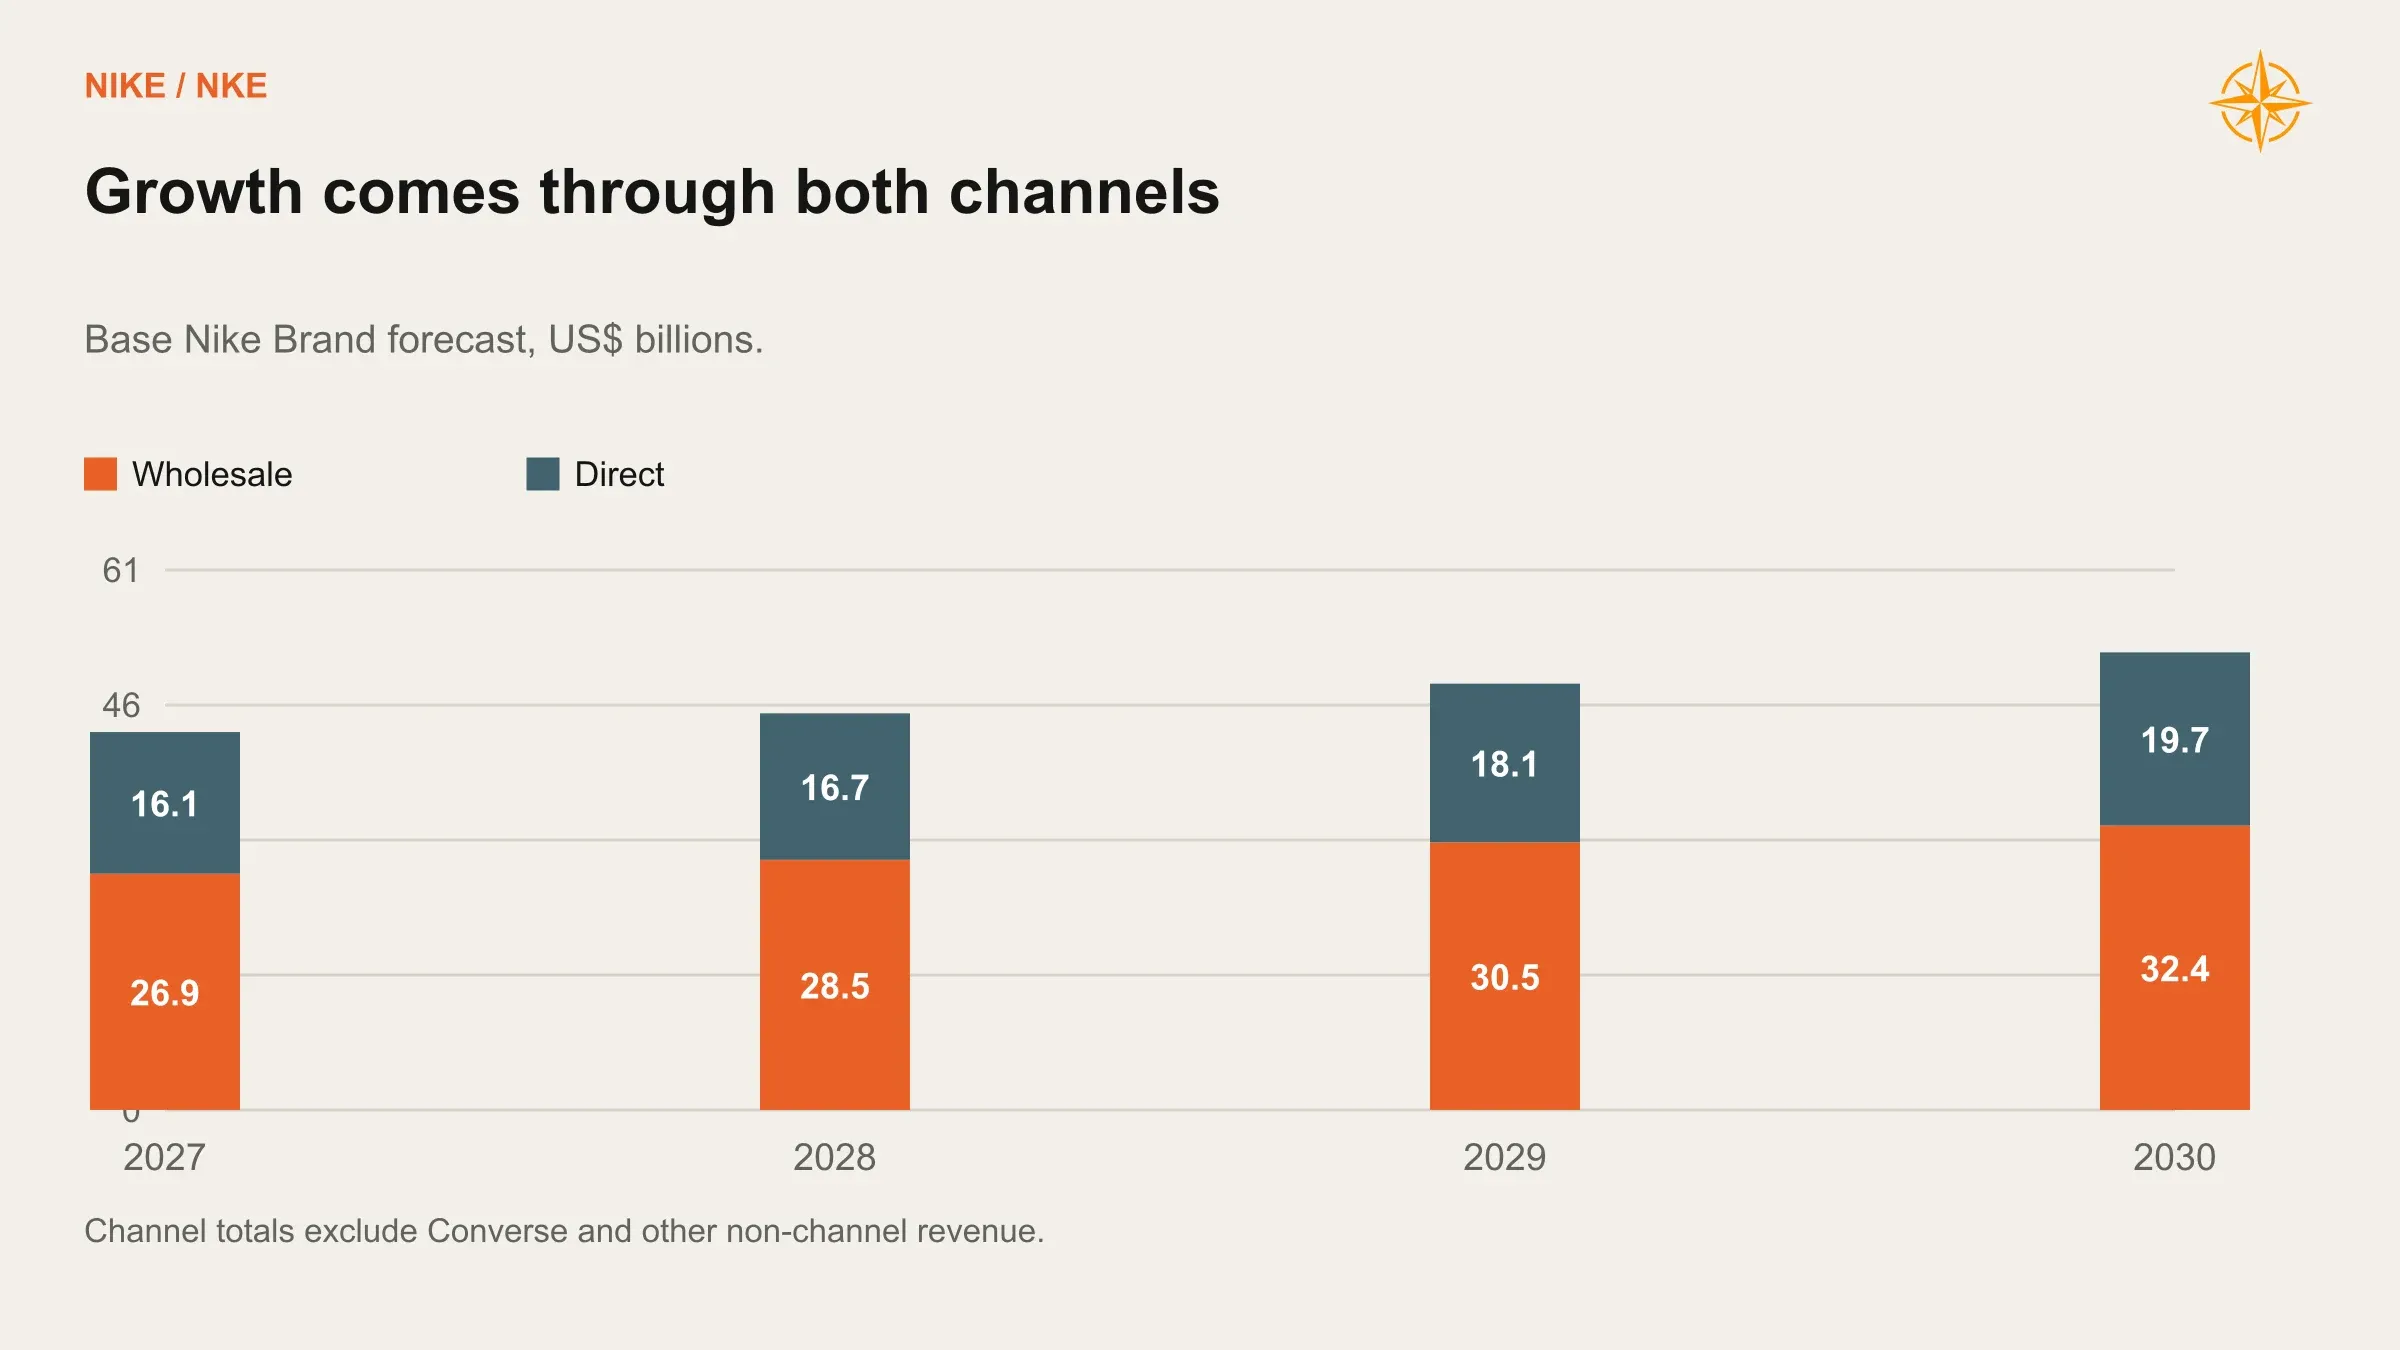
The channel mix lands somewhere sensible. By fiscal 2030, wholesale reaches $32.36 billion and direct reaches $19.71 billion, up from $26.89 billion and $16.12 billion in fiscal 2027. Direct keeps growing, it just stops running the company.
Where the Margin Comes Back
Our Base gross margin reaches 46.6% by fiscal 2030, compared with 43.8% in Bear and 48.4% in Bull. Product mix, discounting, channel mix, tariffs and cost savings determine those outcomes.
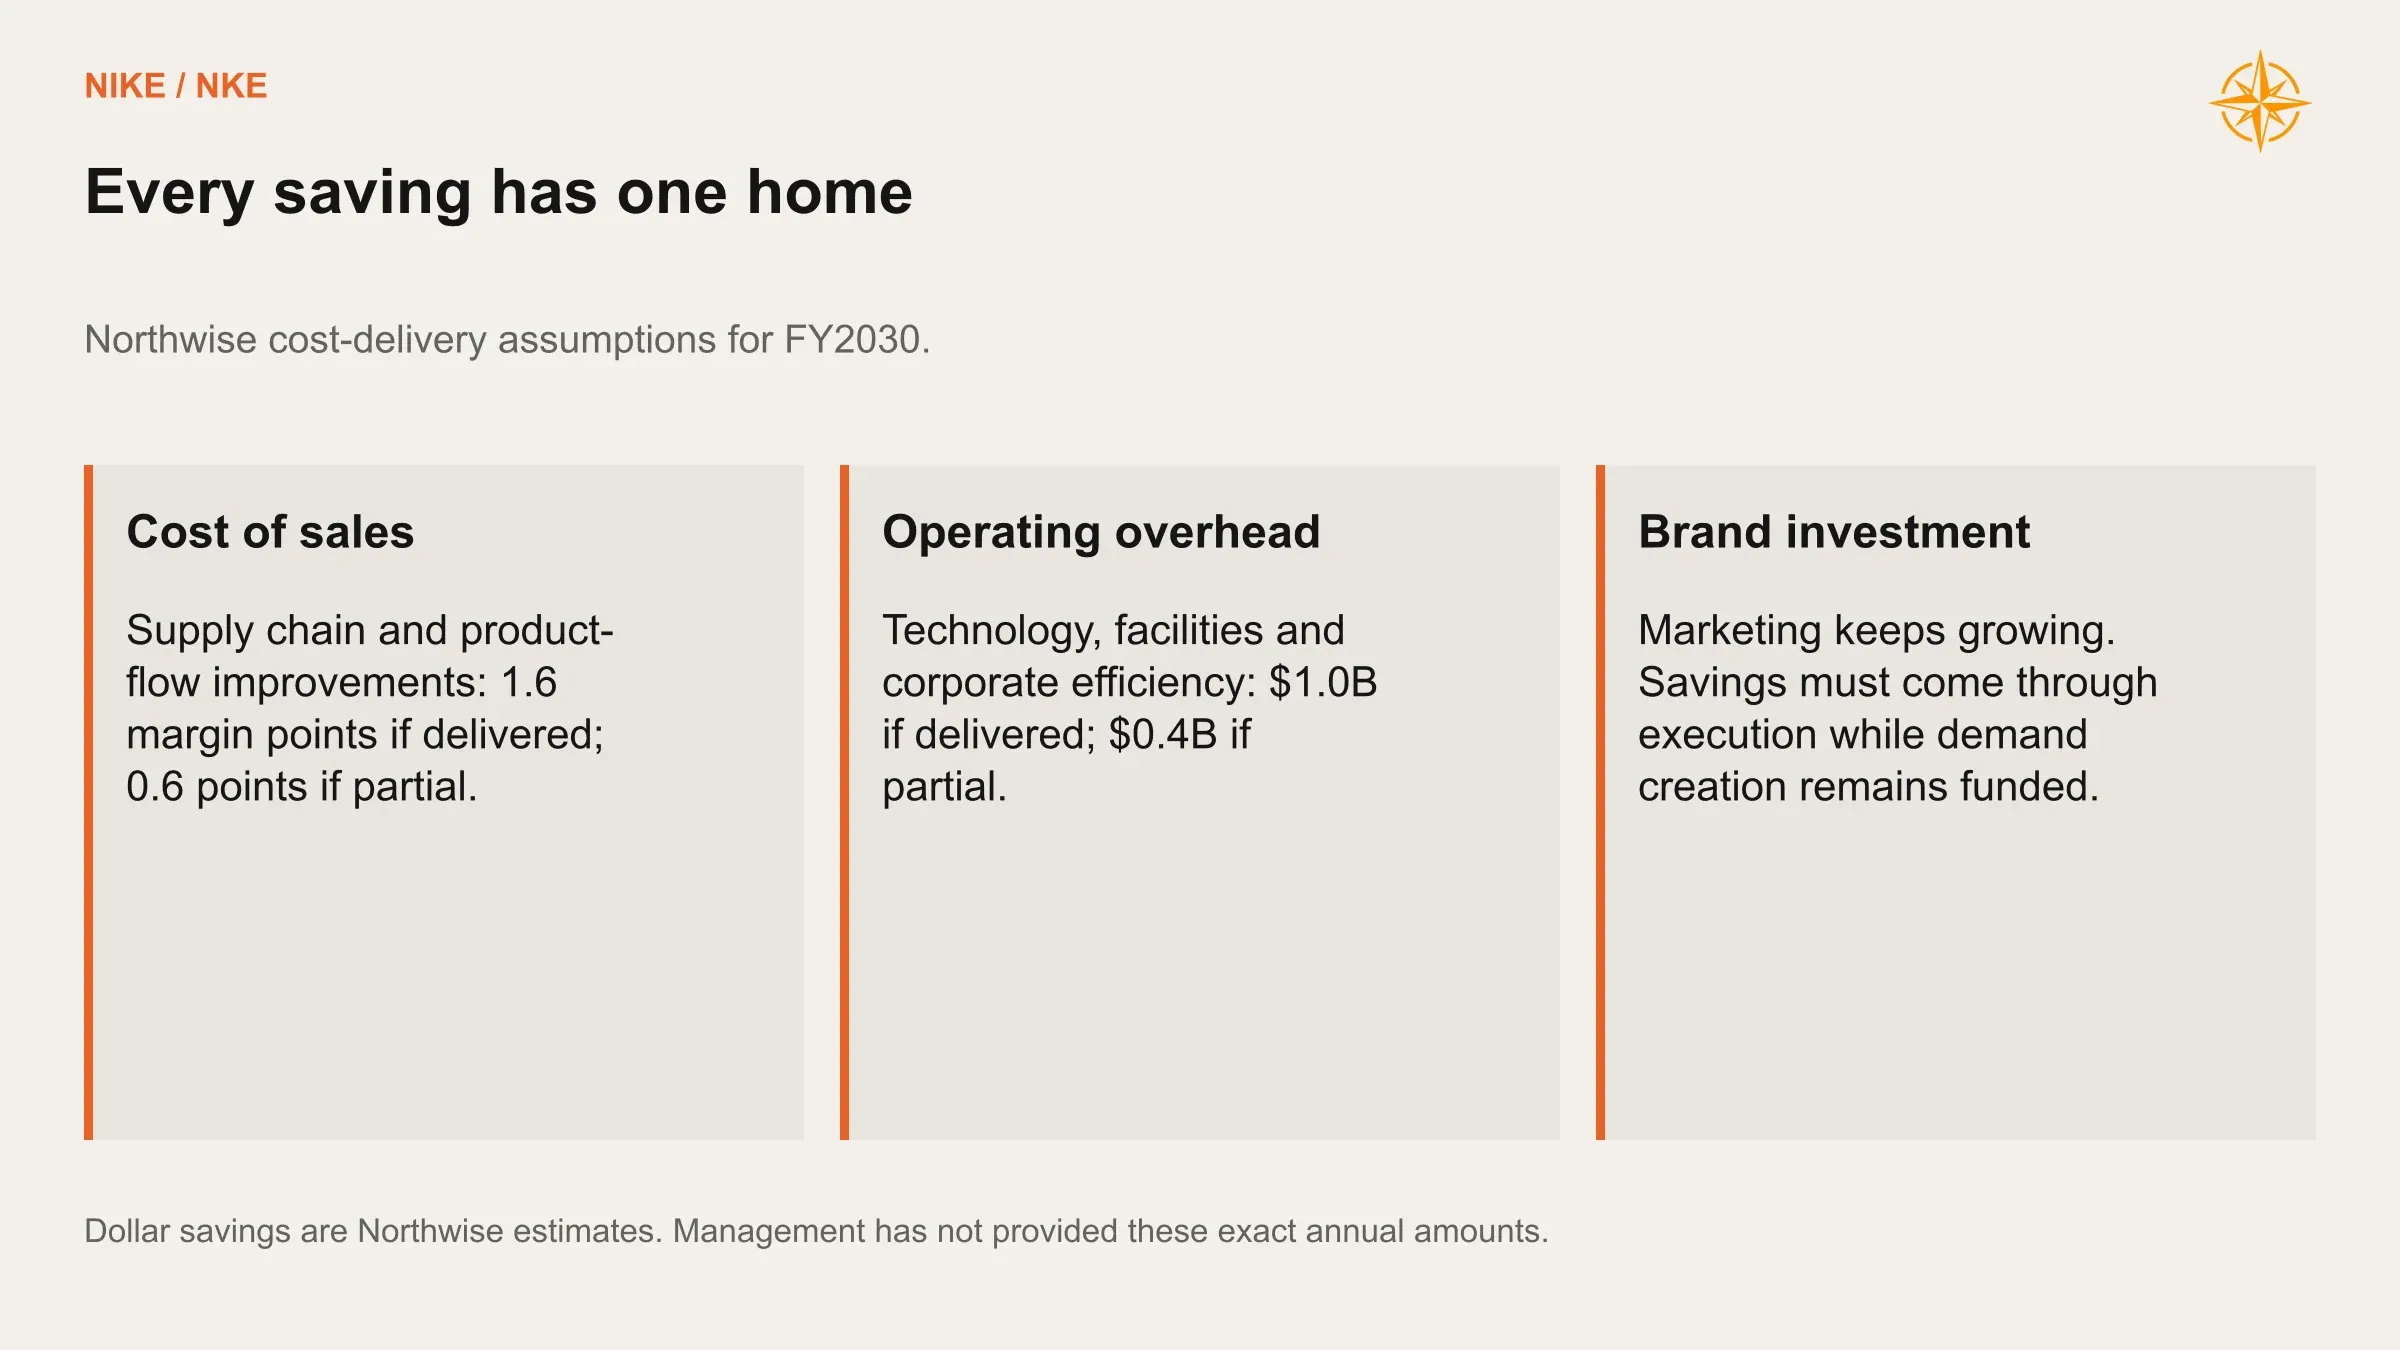
We assume direct sales earn an 18-point gross-margin premium over wholesale, then charge the extra costs of serving those customers. Savings also have separate homes: supply-chain and product-flow improvements reduce cost of sales, while technology and administrative savings reduce overhead.
If Nike executes well, overhead savings reach $1 billion a year by fiscal 2030 and product-cost savings add 1.6 points of gross margin. Half-hearted execution gets $400 million and 0.6 points. Management endorses the direction, and the dollar amounts are ours.
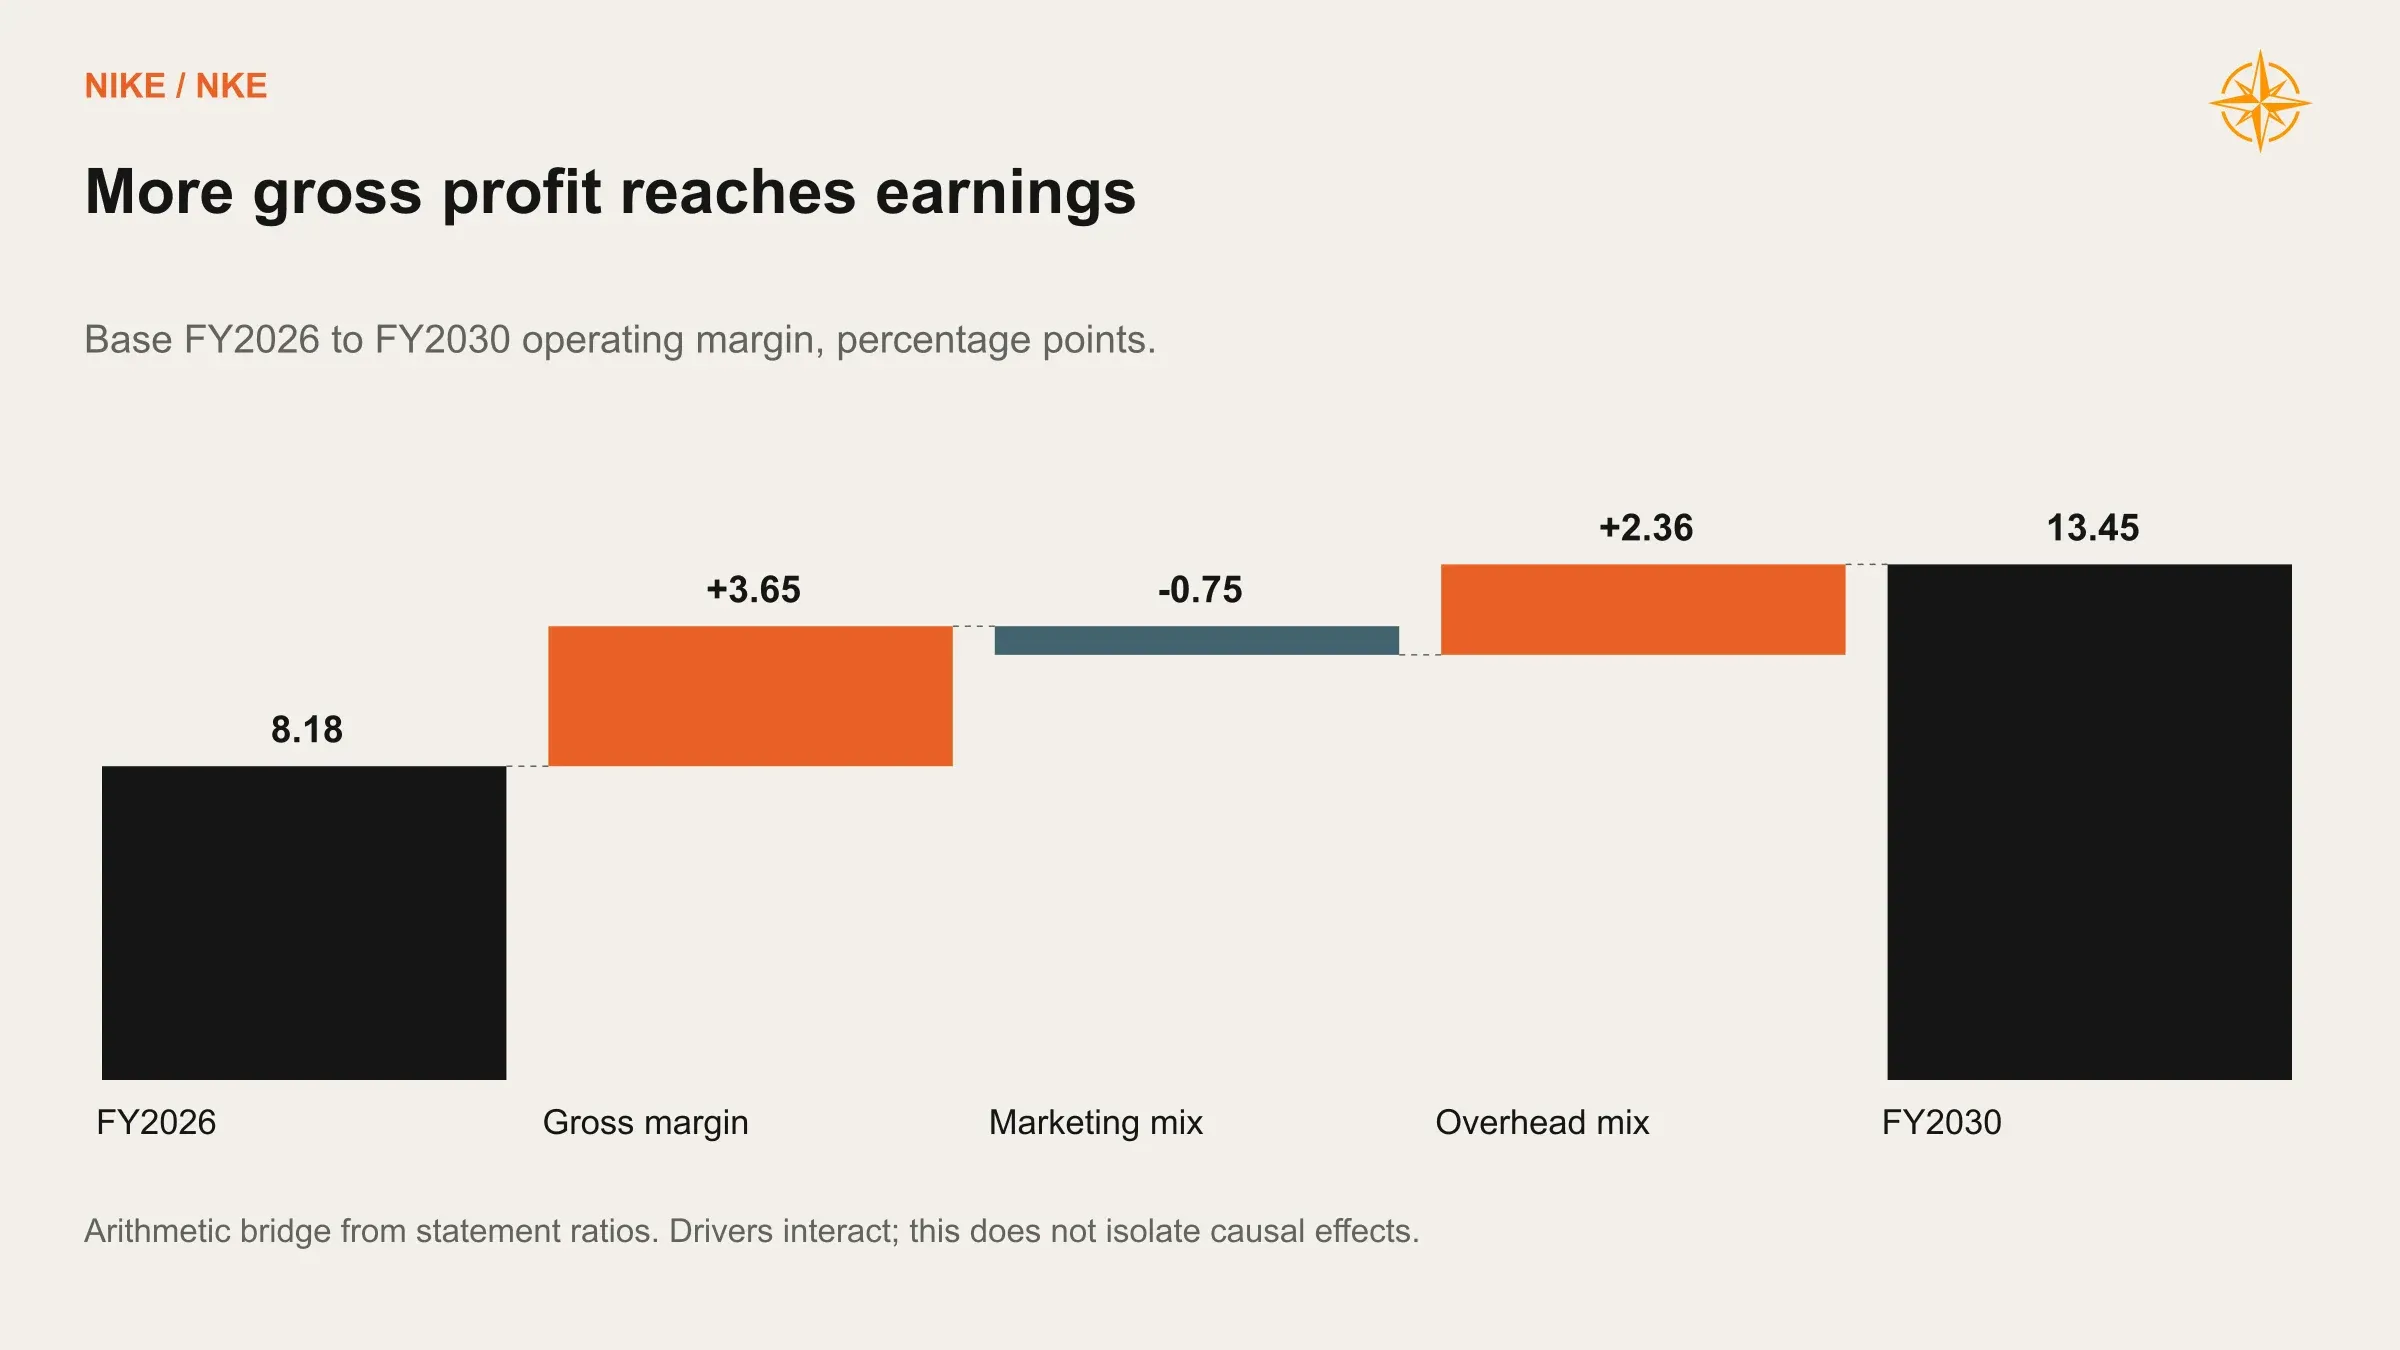
Our favorite line in the Base case is one that goes up. Demand creation, Nike's term for marketing, rises from $4.75 billion to $5.83 billion. Overhead finishes at $11.74 billion, slightly above fiscal 2026 even after the savings. We distrust turnaround stories that only work once the marketing budget is gutted, and in ours Nike keeps spending like a brand and still earns more.
The Base Case
The Base case opens with one more bruise. Revenue slips 5.3% in fiscal 2027 and EPS falls to $1.66. Revenue then climbs to $53.06 billion by fiscal 2030, with growth above 7% in each of the final 2 years.
Base financial forecast | FY2026A | FY2027E | FY2028E | FY2029E | FY2030E |
|---|---|---|---|---|---|
Revenue, $B | $46.40 | $43.96 | $46.03 | $49.44 | $53.06 |
Gross profit, $B | $19.91 | $18.73 | $20.36 | $22.59 | $24.71 |
Gross margin | 42.9% | 42.6% | 44.2% | 45.7% | 46.6% |
Demand creation, $B | $4.75 | $4.83 | $5.10 | $5.45 | $5.83 |
Operating overhead, $B | $11.36 | $10.76 | $10.98 | $11.28 | $11.74 |
Operating profit, $B | $3.80 | $3.14 | $4.28 | $5.86 | $7.14 |
Operating margin | 8.2% | 7.2% | 9.3% | 11.8% | 13.4% |
Pretax income, $B | $3.90 | $3.15 | $4.30 | $5.87 | $7.16 |
Income taxes, $B | $0.79 | $0.68 | $0.93 | $1.27 | $1.56 |
Net income, $B | $3.11 | $2.47 | $3.37 | $4.59 | $5.61 |
Diluted EPS | $2.10 | $1.66 | $2.26 | $3.12 | $3.87 |
Diluted weighted-average shares, B | 1.481 | 1.488 | 1.487 | 1.472 | 1.453 |
Depreciation and amortization, $B | $0.75 | $0.79 | $0.81 | $0.84 | $0.88 |
Stock-based compensation, $B | $0.72 | $0.61 | $0.80 | $0.79 | $0.83 |
Operating cash flow, $B | $2.87 | $4.41 | $5.34 | $6.66 | $7.24 |
Capital expenditure, $B | $0.68 | $0.92 | $0.97 | $1.04 | $1.12 |
Free cash flow, $B | $2.18 | $3.49 | $4.37 | $5.62 | $6.12 |
Common dividends paid, $B | $2.41 | $2.45 | $2.54 | $2.60 | $2.65 |
Repurchases before excise, $B | $0.15 | $0.00 | $1.30 | $2.55 | $3.23 |
Ending cash and investments, $B | $9.03 | $8.11 | $8.67 | $9.31 | $8.38 |
Ending debt principal, $B | $8.00 | $6.00 | $6.00 | $6.00 | $4.50 |
Ending basic shares, B | 1.483 | 1.492 | 1.477 | 1.449 | 1.422 |
Fiscal years end in May, and historical repurchases use the cash-flow measure. Scenario figures are probability-weighted averages of the operating paths in each group. EPS is the average of each path's own EPS, so dividing average net income by average shares can give a slightly different answer.
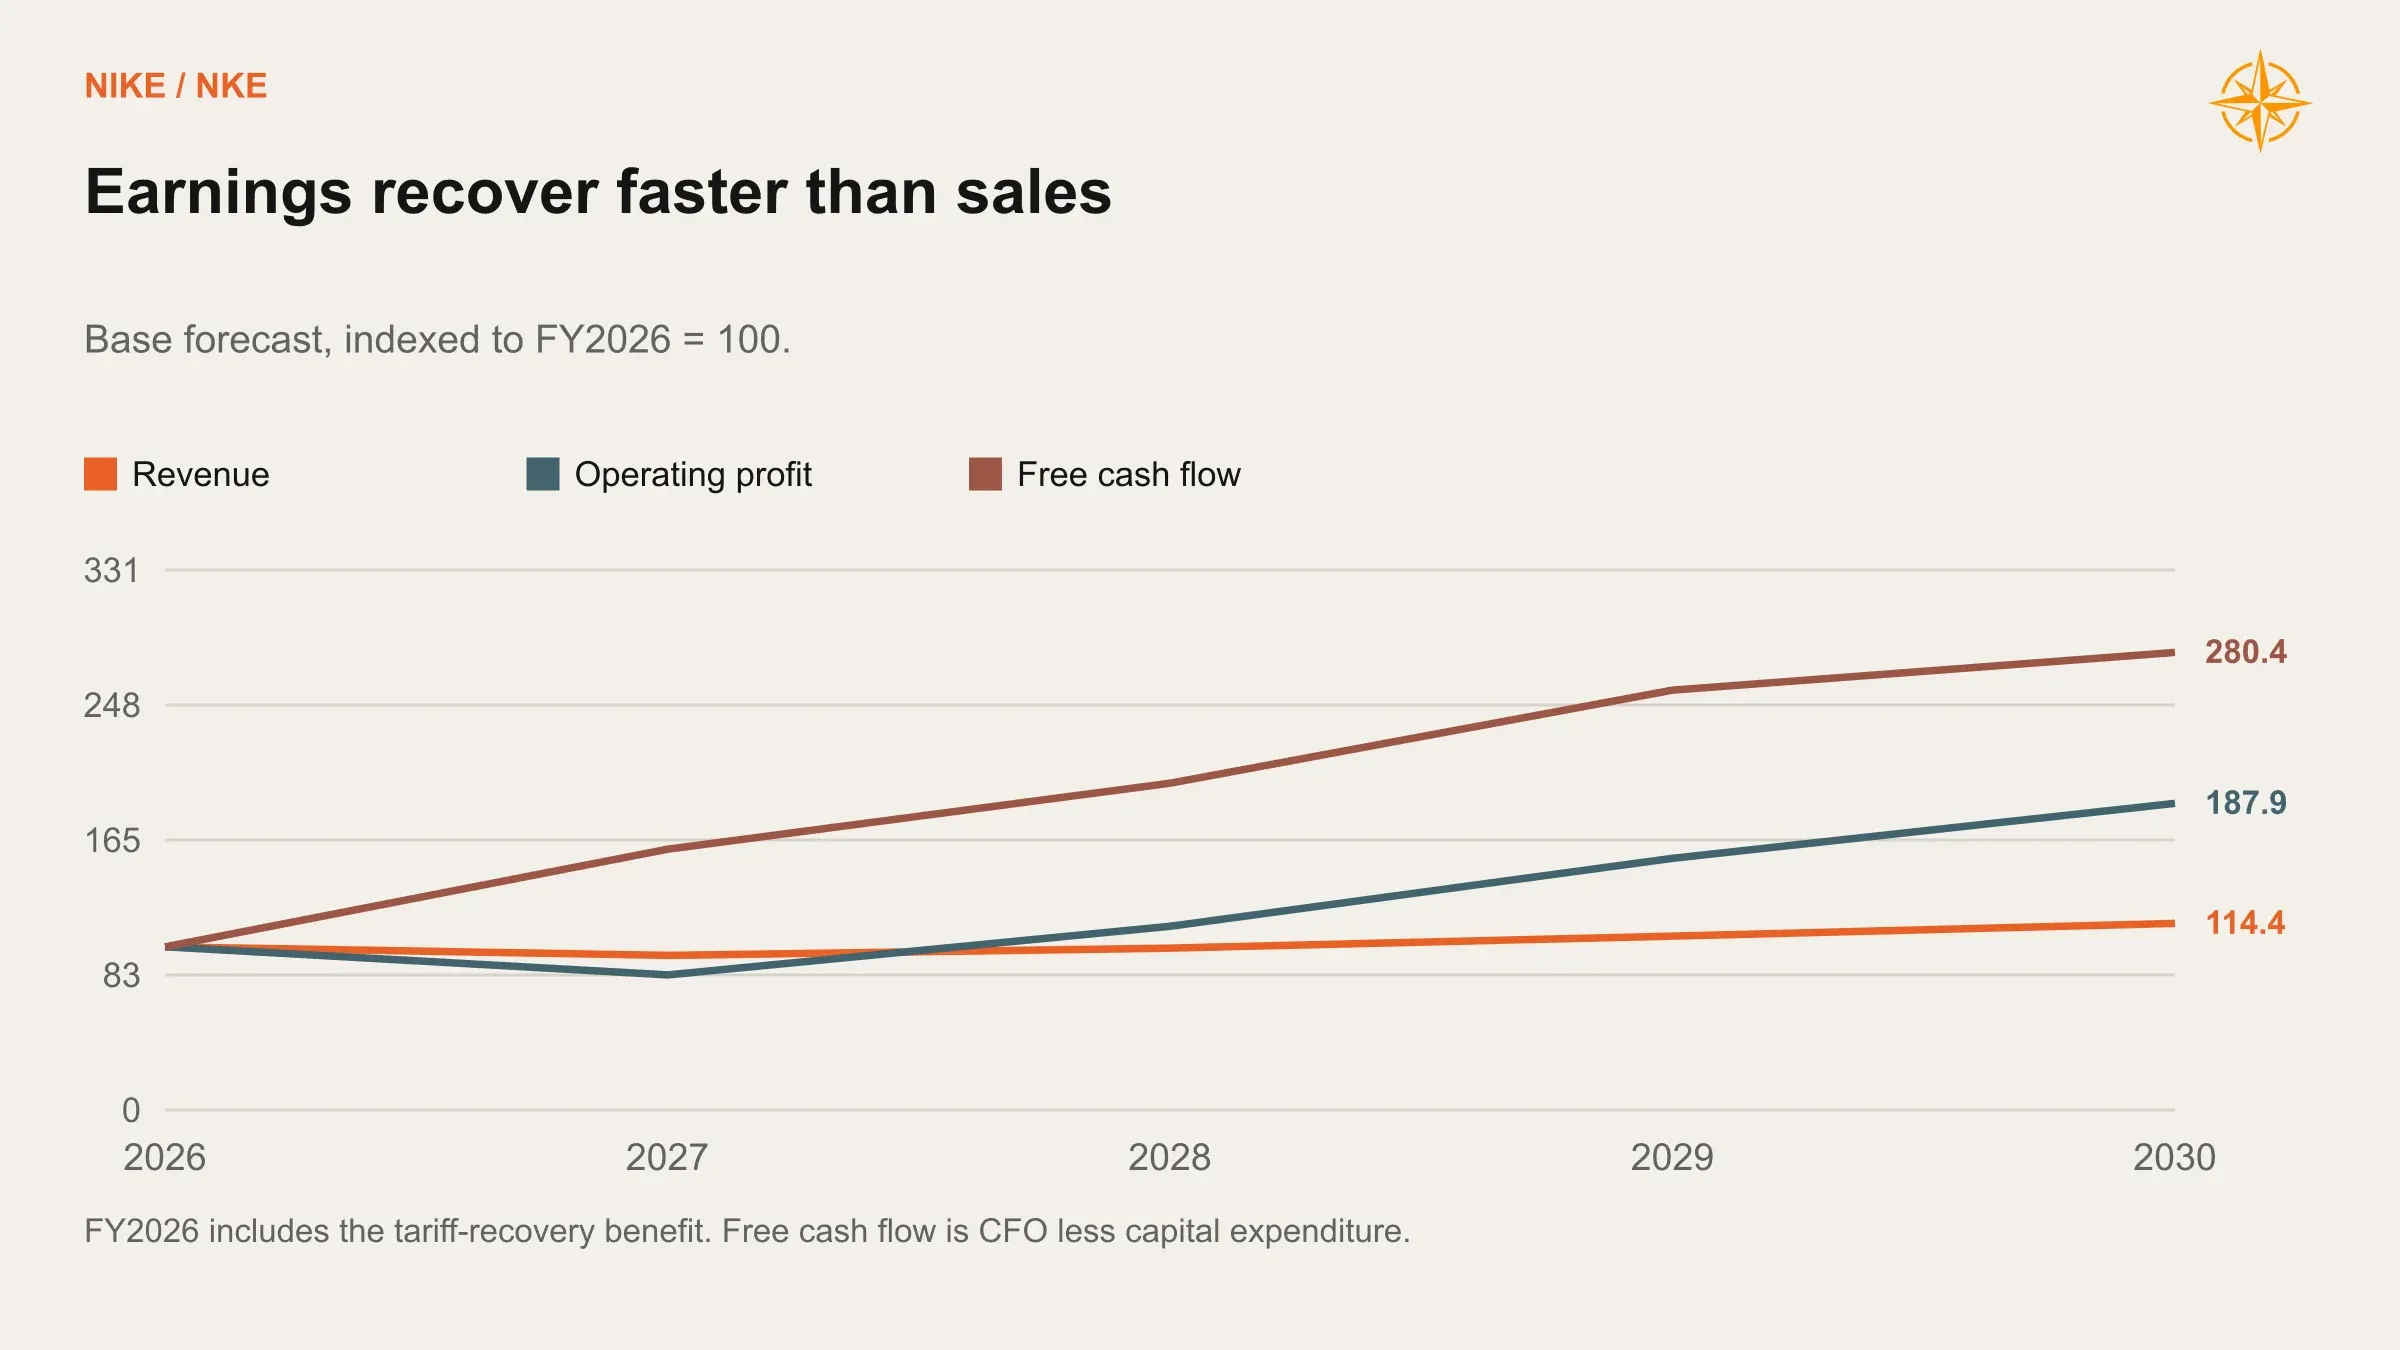
Revenue grows about 14% over four years in the Base case, while operating profit rises from $3.80 billion to $7.14 billion. Higher gross margins and a more productive cost base account for most of the earnings improvement.
Nor does the story stop at 2030. Base revenue reaches $56.63 billion in fiscal 2031, $60.09 billion in 2032 and $63.39 billion in 2033, with EPS climbing to $4.29, $4.73 and $5.20.
The Bear Case Is Boring, Which Is Why It Worries Us
Nike's Bear case has no bankruptcy scene and no collapsed brand. Running keeps working, lifestyle never quite recovers, and Nike keeps paying for a global marketing machine that no longer earns its keep. Buybacks shrink and employee stock quietly swells the share count. A famous company simply earns mediocre returns for years.
Bear financial forecast | FY2026A | FY2027E | FY2028E | FY2029E | FY2030E |
|---|---|---|---|---|---|
Revenue, $B | $46.40 | $42.15 | $41.97 | $43.08 | $44.73 |
Gross profit, $B | $19.91 | $17.59 | $17.84 | $18.65 | $19.58 |
Gross margin | 42.9% | 41.7% | 42.5% | 43.3% | 43.8% |
Demand creation, $B | $4.75 | $4.72 | $4.88 | $5.10 | $5.37 |
Operating overhead, $B | $11.36 | $10.71 | $10.83 | $10.98 | $11.26 |
Operating profit, $B | $3.80 | $2.16 | $2.13 | $2.57 | $2.95 |
Operating margin | 8.2% | 5.1% | 5.1% | 6.0% | 6.6% |
Net income, $B | $3.11 | $1.67 | $1.63 | $1.97 | $2.27 |
Diluted EPS | $2.10 | $1.12 | $1.09 | $1.31 | $1.50 |
Operating cash flow, $B | $2.87 | $2.73 | $3.18 | $3.85 | $3.75 |
Capital expenditure, $B | $0.68 | $0.85 | $0.84 | $0.87 | $0.90 |
Free cash flow, $B | $2.18 | $1.88 | $2.33 | $2.99 | $2.84 |
Common dividends paid, $B | $2.41 | $2.45 | $2.44 | $1.94 | $2.19 |
Repurchases before excise, $B | $0.15 | $0.00 | $0.23 | $0.58 | $0.62 |
Ending cash and investments, $B | $9.03 | $6.49 | $6.14 | $6.65 | $5.29 |
Ending debt principal, $B | $8.00 | $6.00 | $6.00 | $6.00 | $4.50 |
Ending basic shares, B | 1.483 | 1.492 | 1.499 | 1.502 | 1.509 |
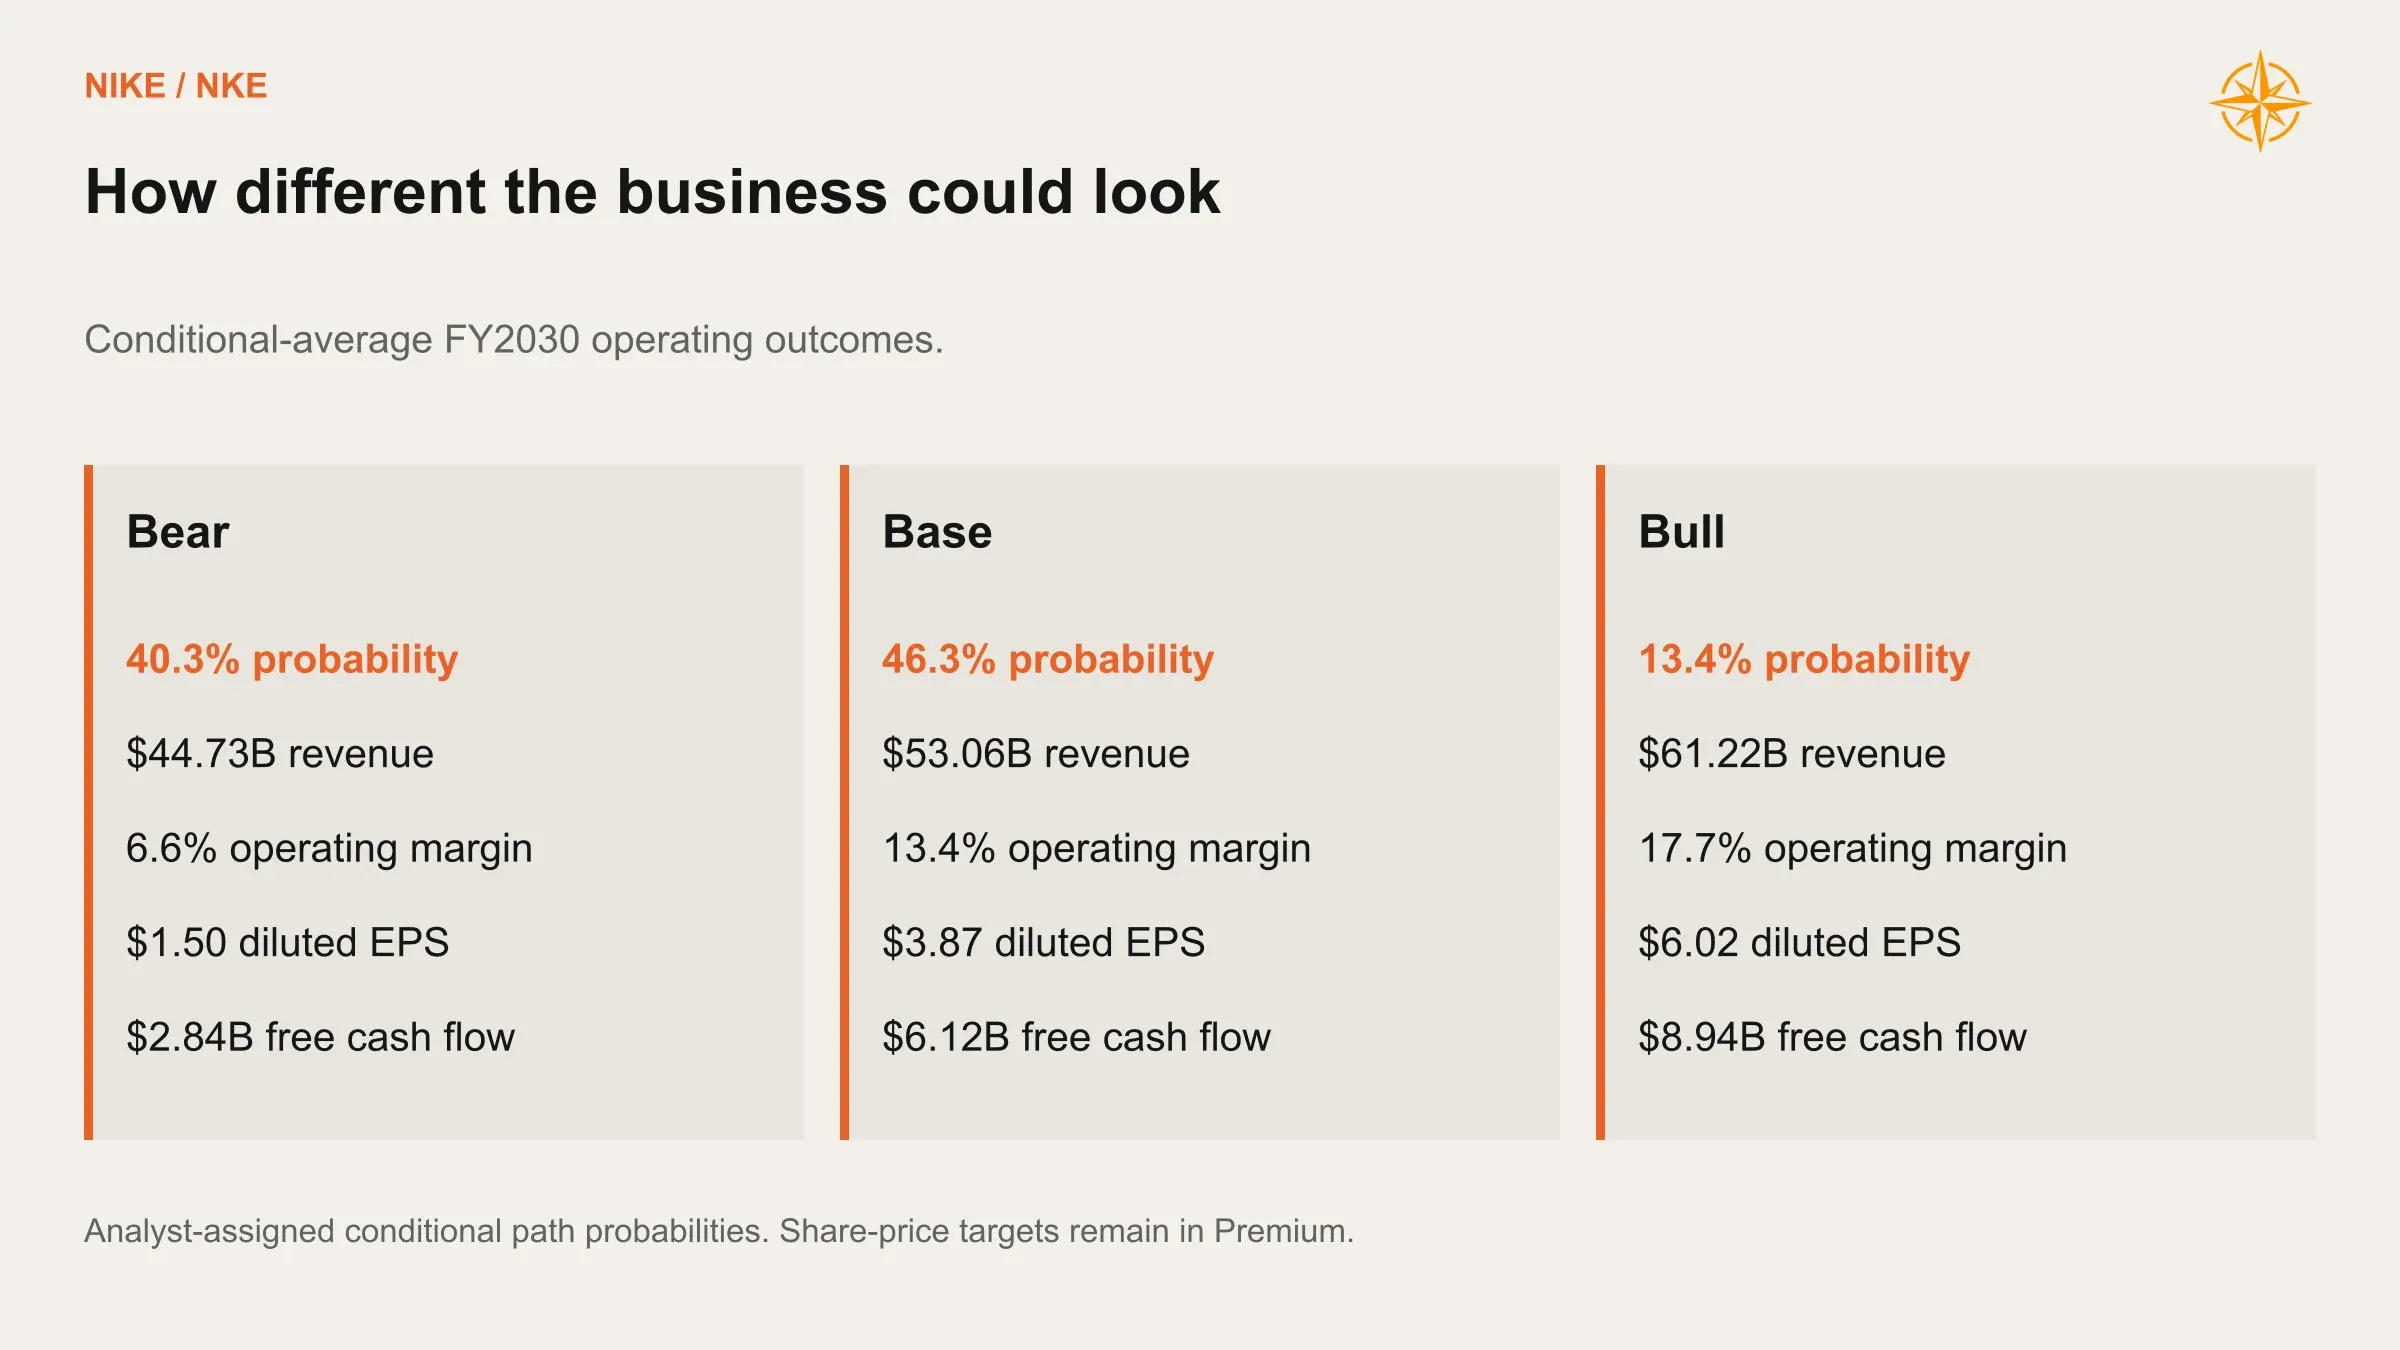
Margins stall between 5% and 7%, fiscal 2030 EPS of $1.50 never gets back to 2026 levels, and the dividend gets trimmed in fiscal 2029 when our liquidity rules demand it. Nobody writes an obituary for a company like this. Shareholders just stop making money.
What the Bull Case Has to Believe
The Bull case asks for much more than a few hit shoes. Performance strength has to spread across sports, new lifestyle styles have to earn repeat purchases, and the cost program has to land in full. Pull off all three and revenue reaches $61.22 billion, operating margin 17.7% and free cash flow nearly $9 billion.
Bull financial forecast | FY2026A | FY2027E | FY2028E | FY2029E | FY2030E |
|---|---|---|---|---|---|
Revenue, $B | $46.40 | $45.42 | $49.70 | $55.49 | $61.22 |
Gross profit, $B | $19.91 | $19.55 | $22.53 | $26.19 | $29.64 |
Gross margin | 42.9% | 43.0% | 45.3% | 47.2% | 48.4% |
Demand creation, $B | $4.75 | $4.92 | $5.31 | $5.79 | $6.29 |
Operating overhead, $B | $11.36 | $10.87 | $11.31 | $11.83 | $12.51 |
Operating profit, $B | $3.80 | $3.76 | $5.92 | $8.57 | $10.84 |
Operating margin | 8.2% | 8.3% | 11.9% | 15.4% | 17.7% |
Net income, $B | $3.11 | $2.98 | $4.70 | $6.77 | $8.57 |
Diluted EPS | $2.10 | $2.00 | $3.17 | $4.64 | $6.02 |
Operating cash flow, $B | $2.87 | $5.56 | $6.80 | $8.75 | $10.28 |
Capital expenditure, $B | $0.68 | $1.00 | $1.09 | $1.22 | $1.35 |
Free cash flow, $B | $2.18 | $4.56 | $5.71 | $7.53 | $8.94 |
Common dividends paid, $B | $2.41 | $2.45 | $2.59 | $2.68 | $2.76 |
Repurchases before excise, $B | $0.15 | $0.00 | $2.24 | $4.04 | $5.59 |
Ending cash and investments, $B | $9.03 | $9.19 | $10.15 | $11.17 | $10.66 |
Ending debt principal, $B | $8.00 | $6.00 | $6.00 | $6.00 | $4.50 |
Ending basic shares, B | 1.483 | 1.492 | 1.464 | 1.425 | 1.383 |
A 17.7% operating margin is a big ask. We keep the Bull case in the distribution since it shows what Nike looks like if the new structure starts delivering across the whole catalog. A rough starting point is a poor reason to rule that out.
Cash Has Bills to Pay First
Nike ended fiscal 2026 with $9.03 billion of cash against $8 billion of debt, including $2 billion due in fiscal 2027. It is tempting to call the difference a buyback fund. A shoe company's cash has to front the inventory, wait for retailers to pay, and pay factories and employees on their own clocks.
Base balance-sheet and working-capital forecast, $B | FY2026A | FY2027E | FY2028E | FY2029E | FY2030E |
|---|---|---|---|---|---|
Trade accounts receivable | $5.25 | $5.17 | $5.31 | $5.51 | $5.91 |
Tariff-recovery receivable | $0.68 | $0.00 | $0.00 | $0.00 | $0.00 |
Inventory | $7.50 | $7.01 | $6.90 | $6.90 | $7.16 |
Accounts payable | $3.60 | $3.36 | $3.48 | $3.71 | $3.92 |
Net property, plant and equipment | $4.80 | $4.93 | $5.09 | $5.28 | $5.52 |
Lease liabilities | $3.09 | $3.16 | $3.23 | $3.31 | $3.39 |
Total assets | $38.41 | $36.34 | $37.24 | $38.51 | $38.73 |
Total liabilities | $23.55 | $20.83 | $21.42 | $22.30 | $21.64 |
Shareholders' equity | $14.87 | $15.51 | $15.82 | $16.21 | $17.09 |
The Base case gets steadily better at that juggling act. Inventory days drop from about 102 to 92 by fiscal 2030, receivable days ease from 43 to 41, and payable days tick up from 49 to 50. Fiscal 2027 also gets a one-time lift from collecting the remaining $684 million tariff receivable, partly offset by $243 million of severance going out the door.
Before a single share is repurchased, our rules hold back the larger of $4 billion or 9% of revenue and set aside the next debt maturity. Only what is left over goes to buybacks.
Cumulative FY2027 to FY2030 cash allocation | Bear | Base | Bull |
|---|---|---|---|
Free cash flow | $10.05B | $19.61B | $26.74B |
Net employee financing receipts | $0.24B | $0.68B | $0.89B |
Common dividends | $9.02B | $10.25B | $10.48B |
Award dividends | $0.07B | $0.06B | $0.06B |
Repurchases before excise | $1.43B | $7.08B | $11.87B |
Repurchase excise | $0.00B | $0.04B | $0.08B |
Scheduled debt principal repayment | $3.50B | $3.50B | $3.50B |
Net change in basic shares | +1.7% | −4.1% | −6.7% |
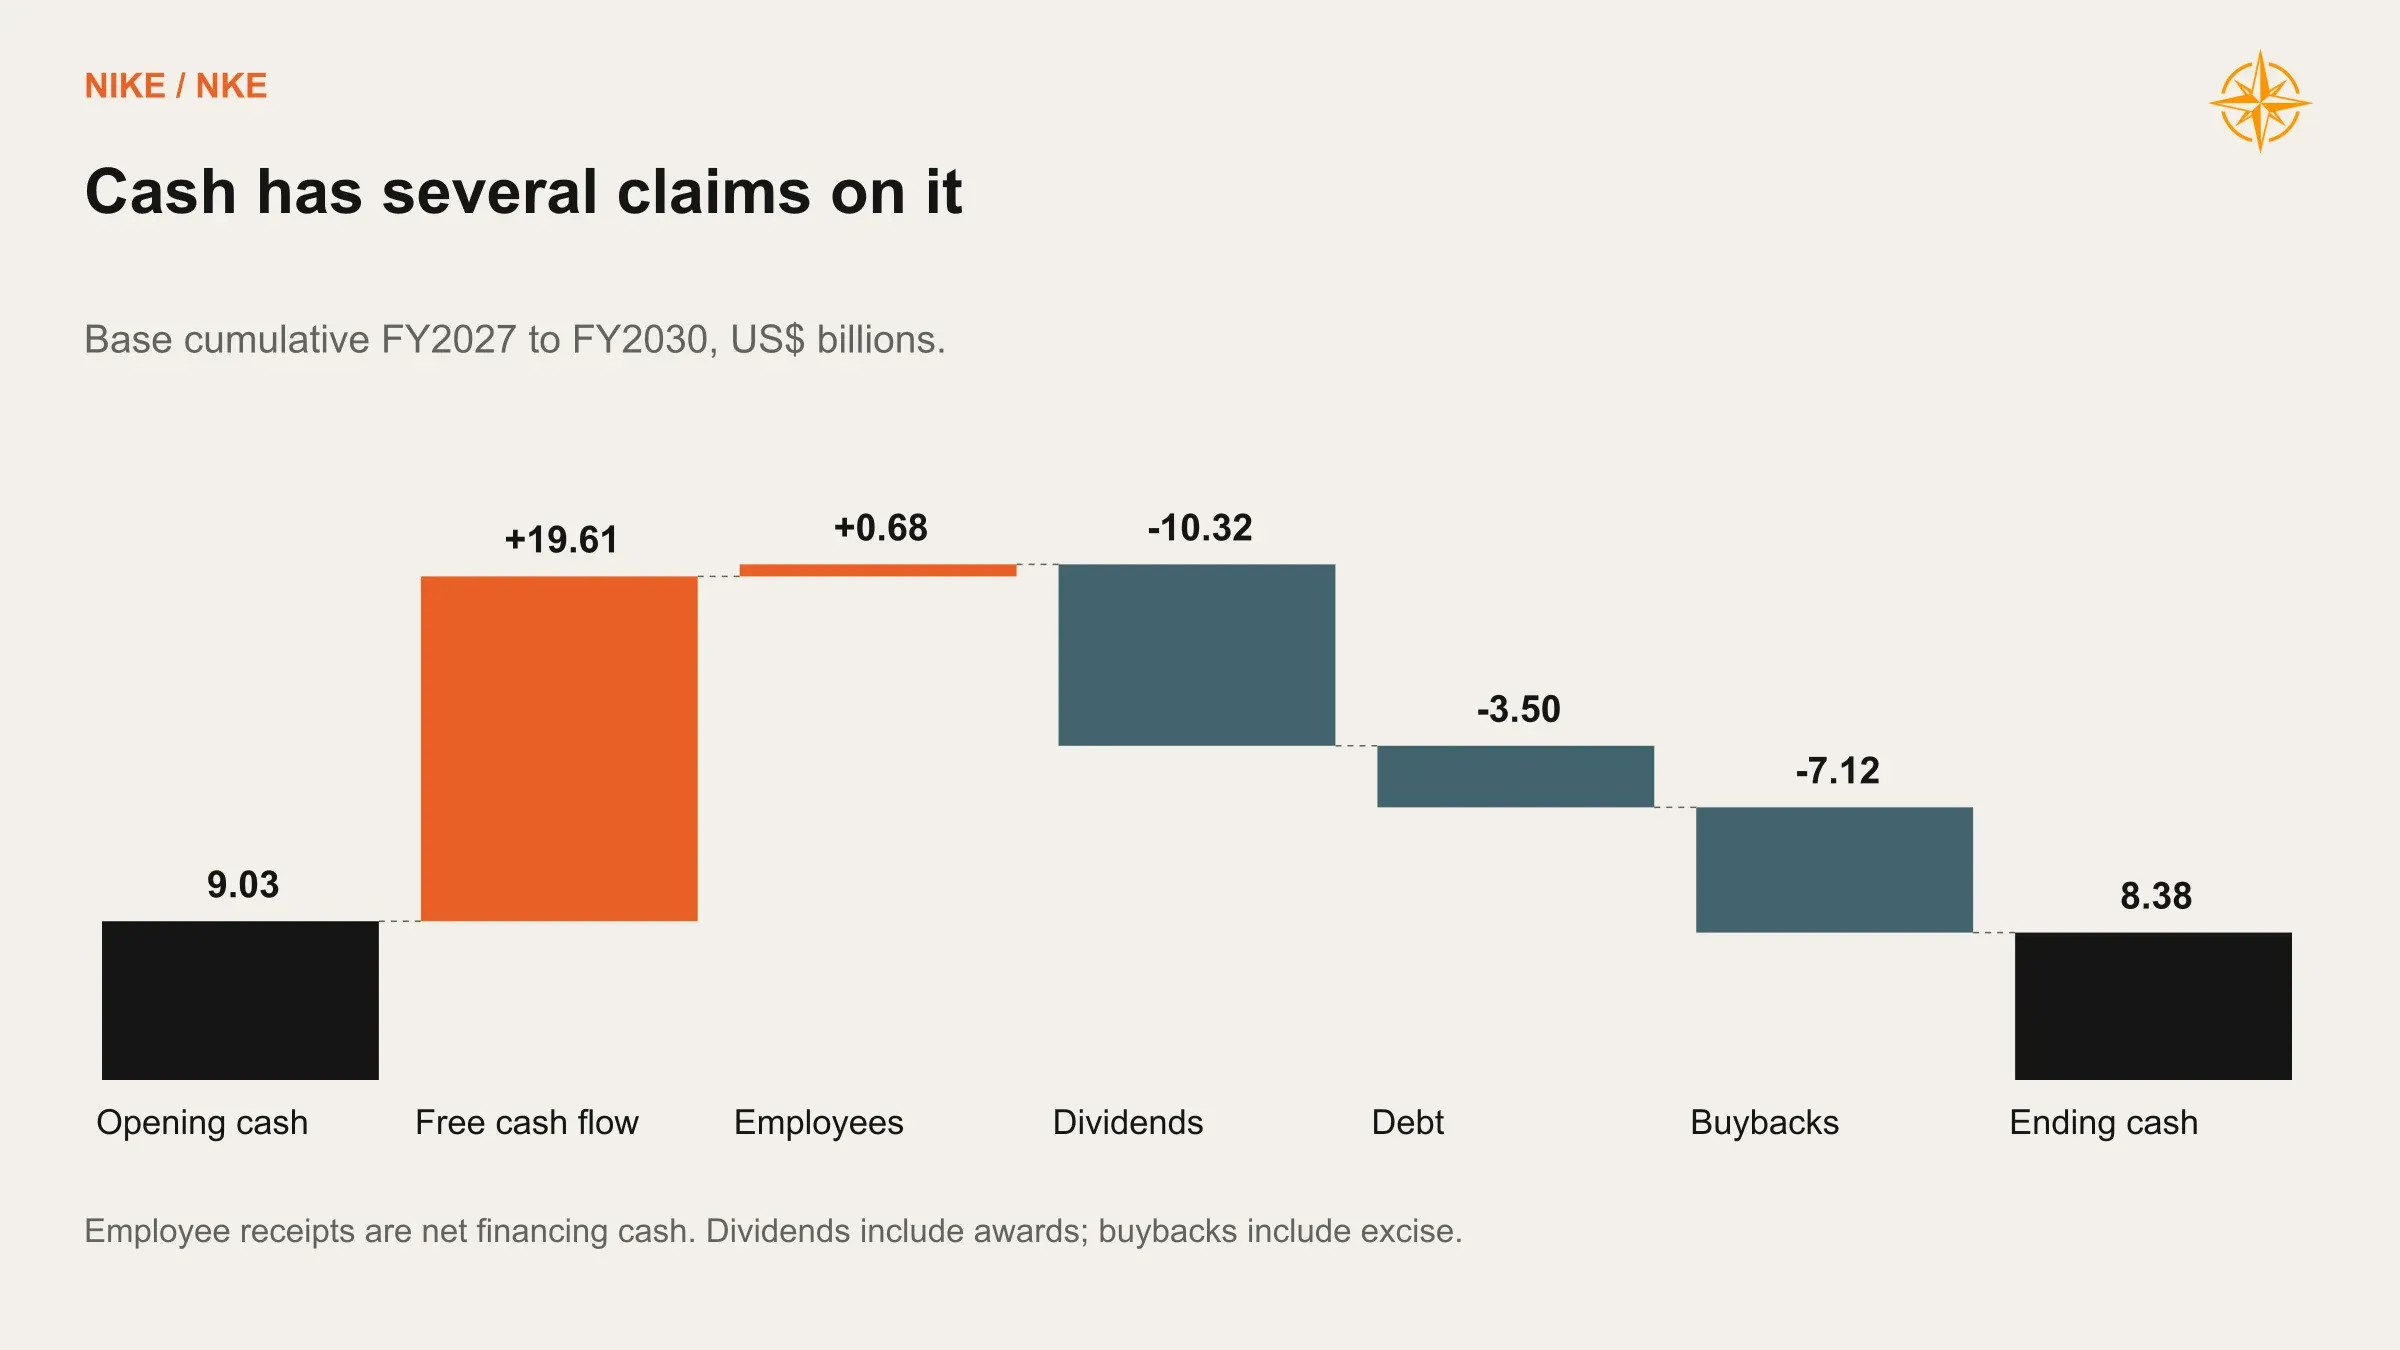
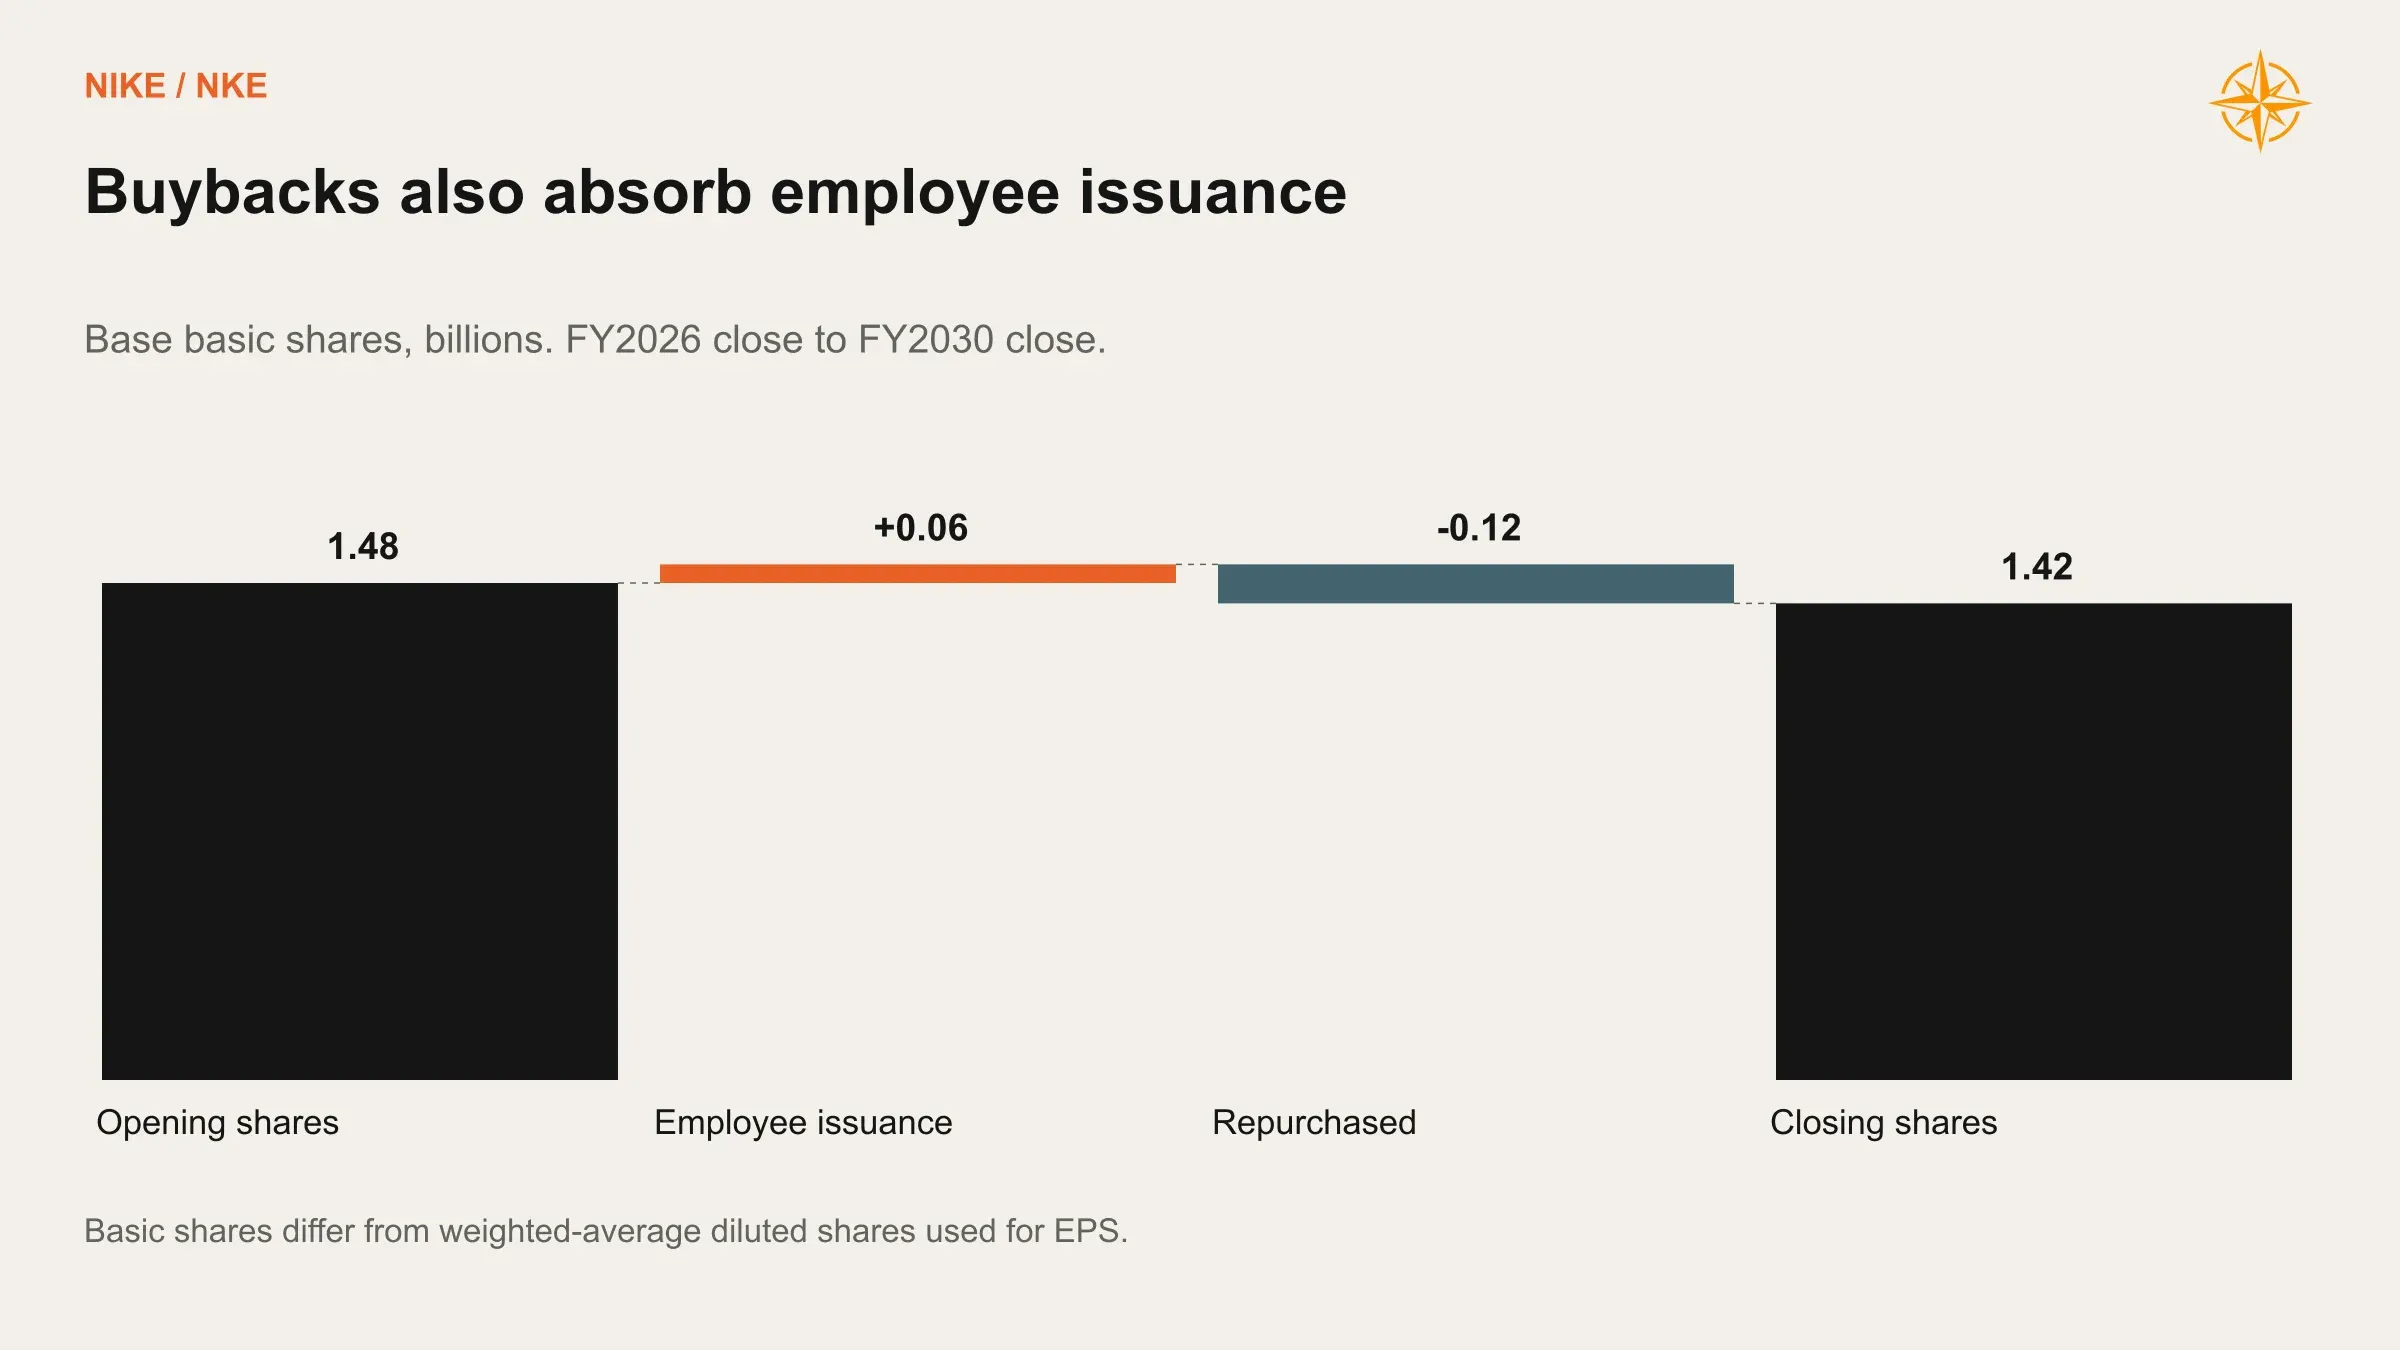
The buyback math is humbling. The Base case spends more than $7 billion repurchasing stock and shrinks the share count by just 4.1%, since employee issuance keeps refilling the bucket. Nike's remaining authorization is about $5.9 billion, so the Base and Bull cases assume the board adds more at some point. That is our assumption, and the board has promised nothing.
The Quiet Cost of Paying People in Stock
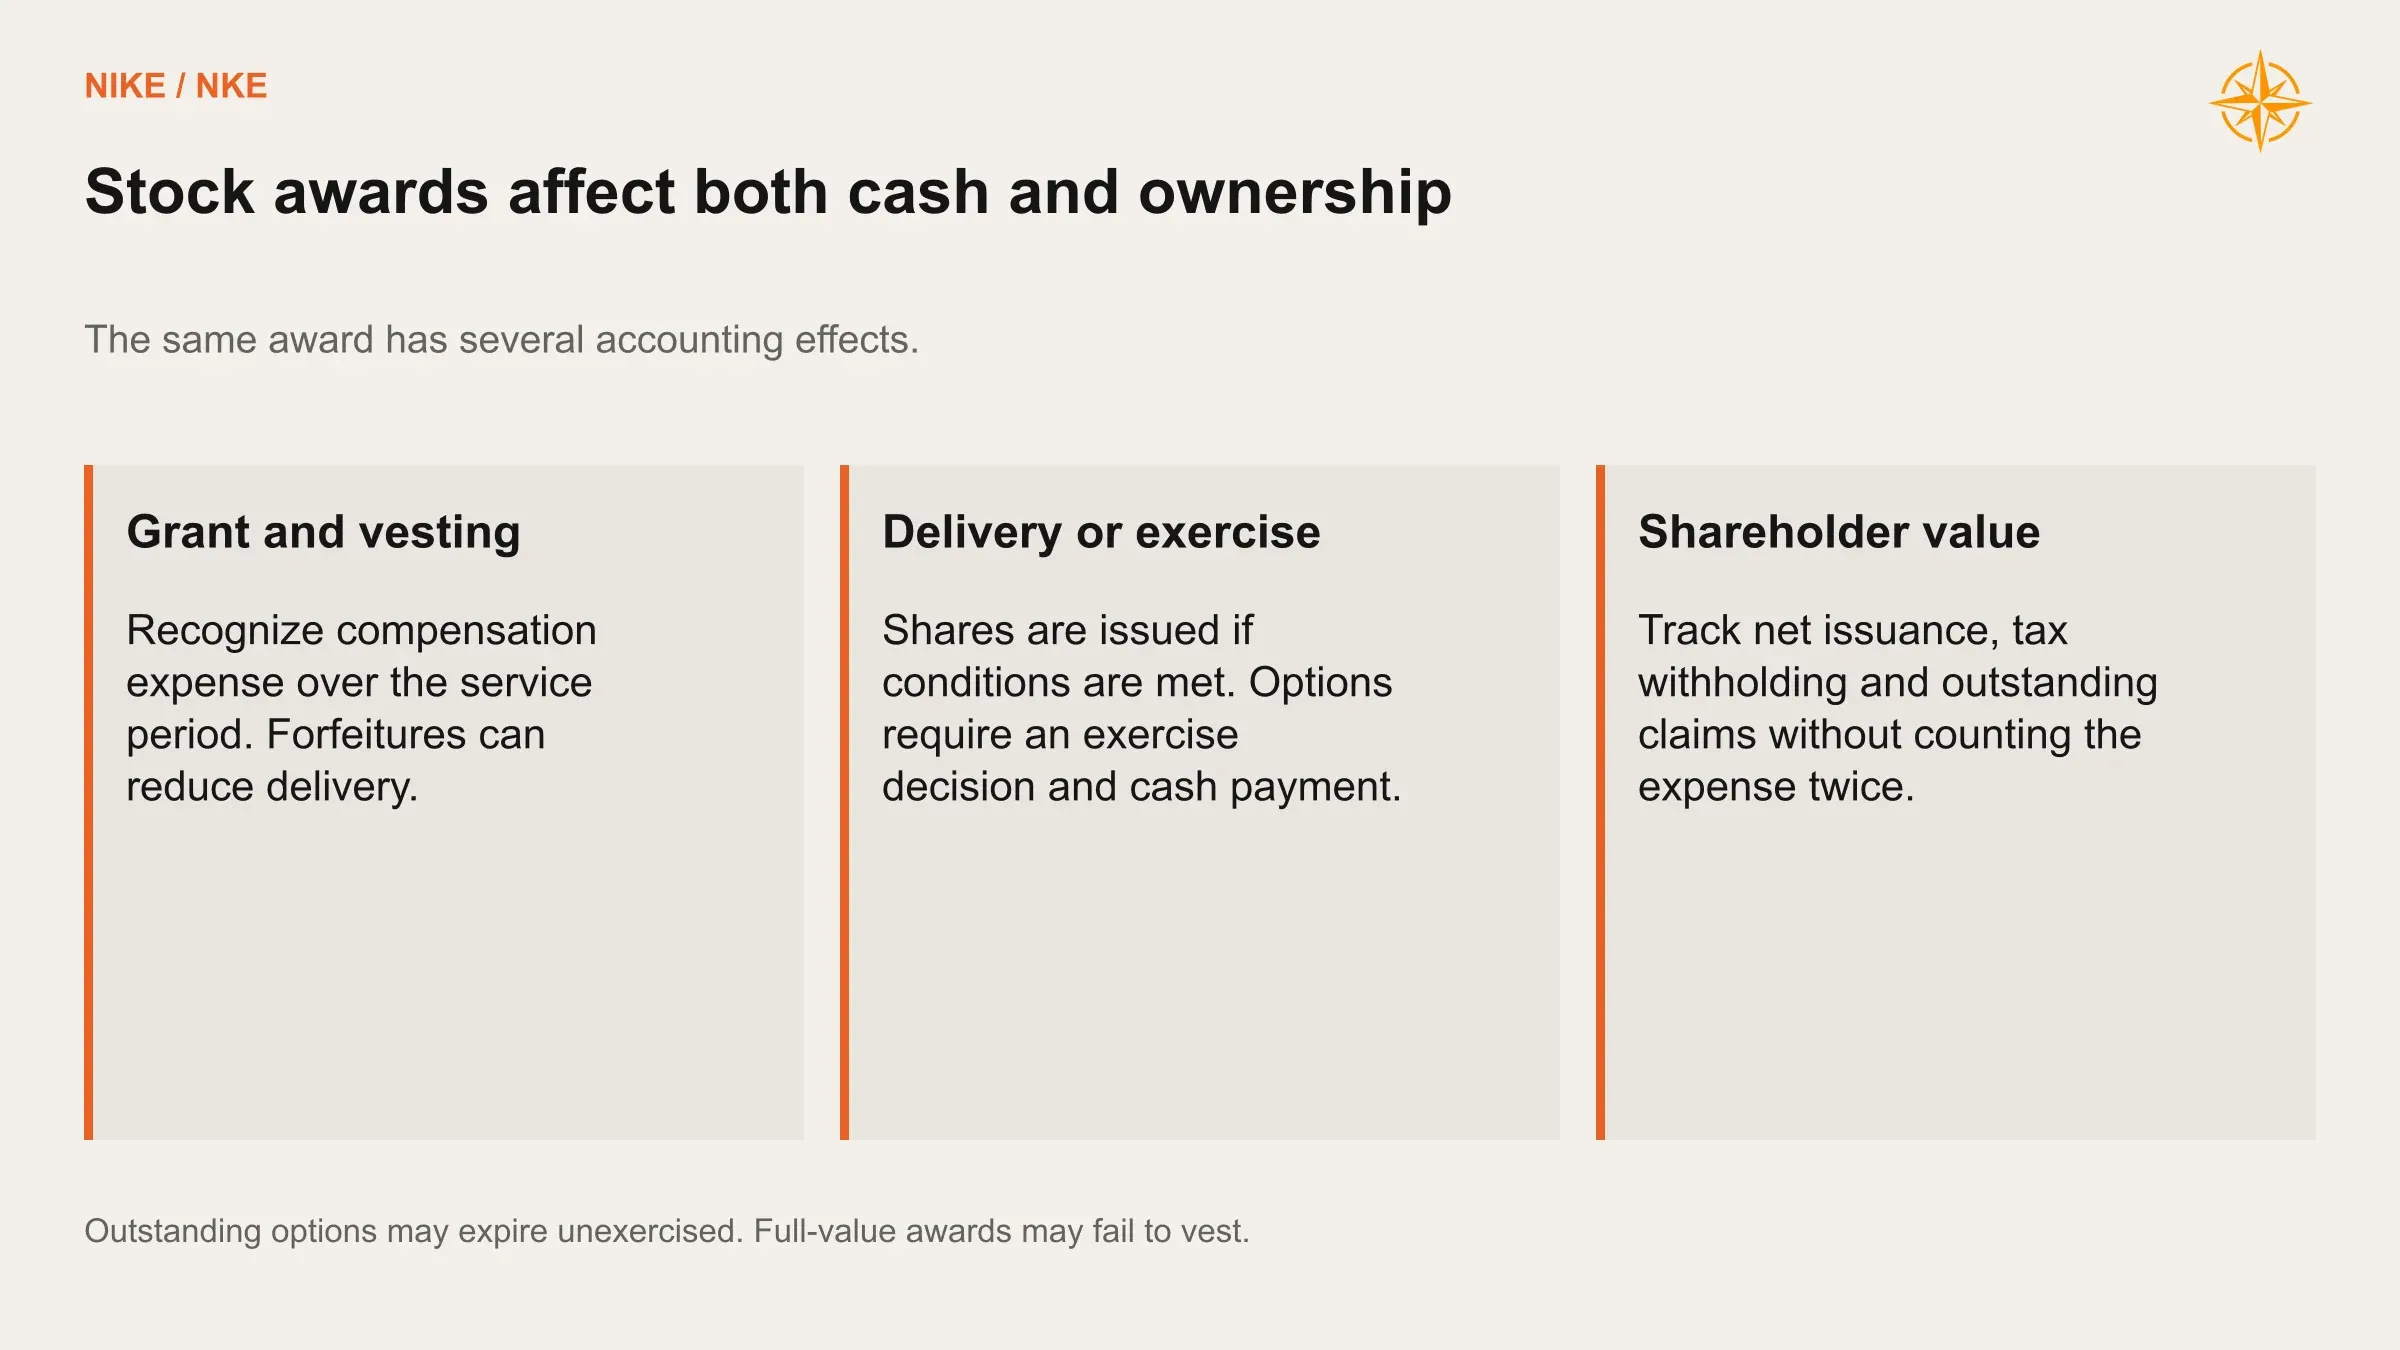
Nike has 76.8 million options outstanding, including 52.8 million already exercisable, plus 12.5 million unvested restricted shares and units. Awards that vest or are exercised can dilute existing owners. Some will be forfeited or expire unexercised, so we track delivery and exercise conditions rather than treating every outstanding award as an issued share.
We track those awards from grant to delivery. Base stock compensation grows from $606 million in fiscal 2027 to $832 million in fiscal 2030. Over the same years, the cash employees pay in when they exercise rises from about $44 million to $381 million. That cash is real and belongs in the financing section, and none of it cancels the expense.
Charge stock compensation as the cost it is, and Base fiscal 2030 free cash flow of $6.12 billion shrinks to about $5.29 billion. We treat that as a check on cash quality and leave EPS alone, since the expense is already counted there.
Why We Give the Outcomes Odds
A single Base case makes every turnaround look like a straight line. Real recoveries are lumpier. The same weak consumer that dents sales also deepens discounts, bloats inventory, shrinks buybacks and leaves more shares outstanding, and a hit product cycle fixes several of those at once.
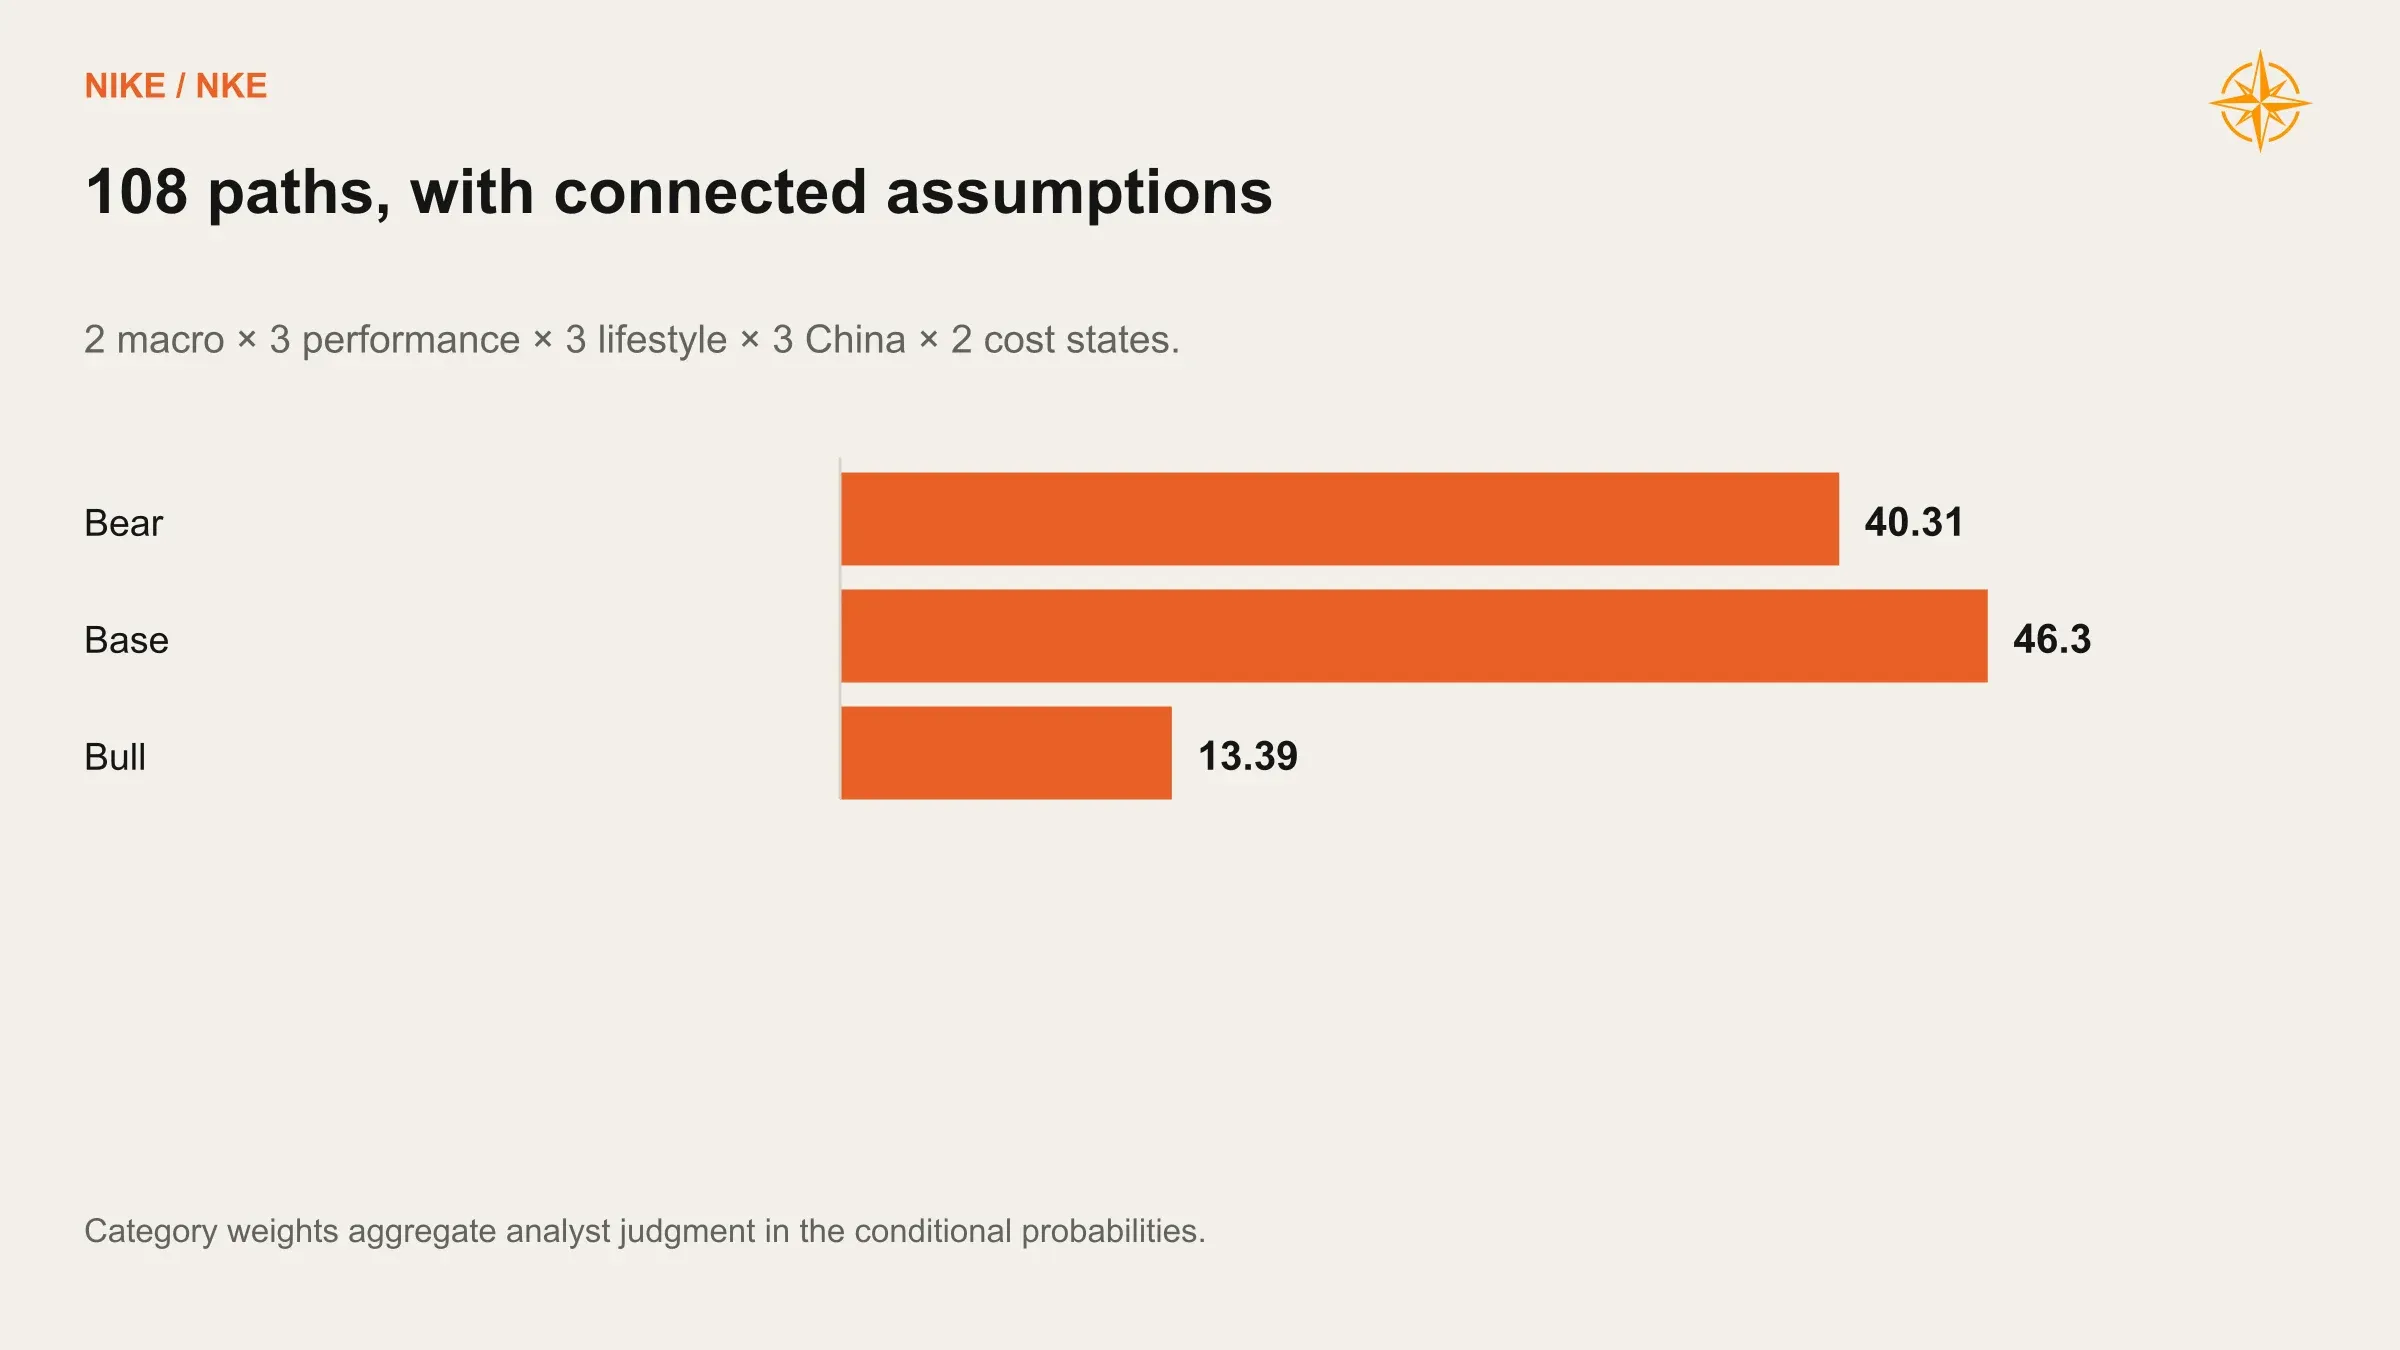
So we built 108 paths from 2 macro states, 3 performance outcomes, 3 lifestyle outcomes, 3 China outcomes and 2 levels of cost execution, with the odds linked together. With no extra macro shock, strong performance gets 45%, steady performance 45% and weak performance 10%. Lifestyle is more likely to recover in paths where performance is already strong. These weights are our judgments, informed by everything above.
Each path then sorts itself by results. Revenue below fiscal 2026, or an operating margin under 10% in fiscal 2030, lands a path in Bear. Reaching $60 billion of revenue with a 15% margin earns Bull, and everything else is Base.
Operating outcome | Probability |
|---|---|
Bear | 40.3% |
Base | 46.3% |
Bull | 13.4% |
These category weights aggregate the conditional probabilities we assign to the 108 paths. The 40% Bear weight reflects how much of Nike’s revenue still needs repair, even with several promising products already selling well.
The Expensive Part Is Waiting
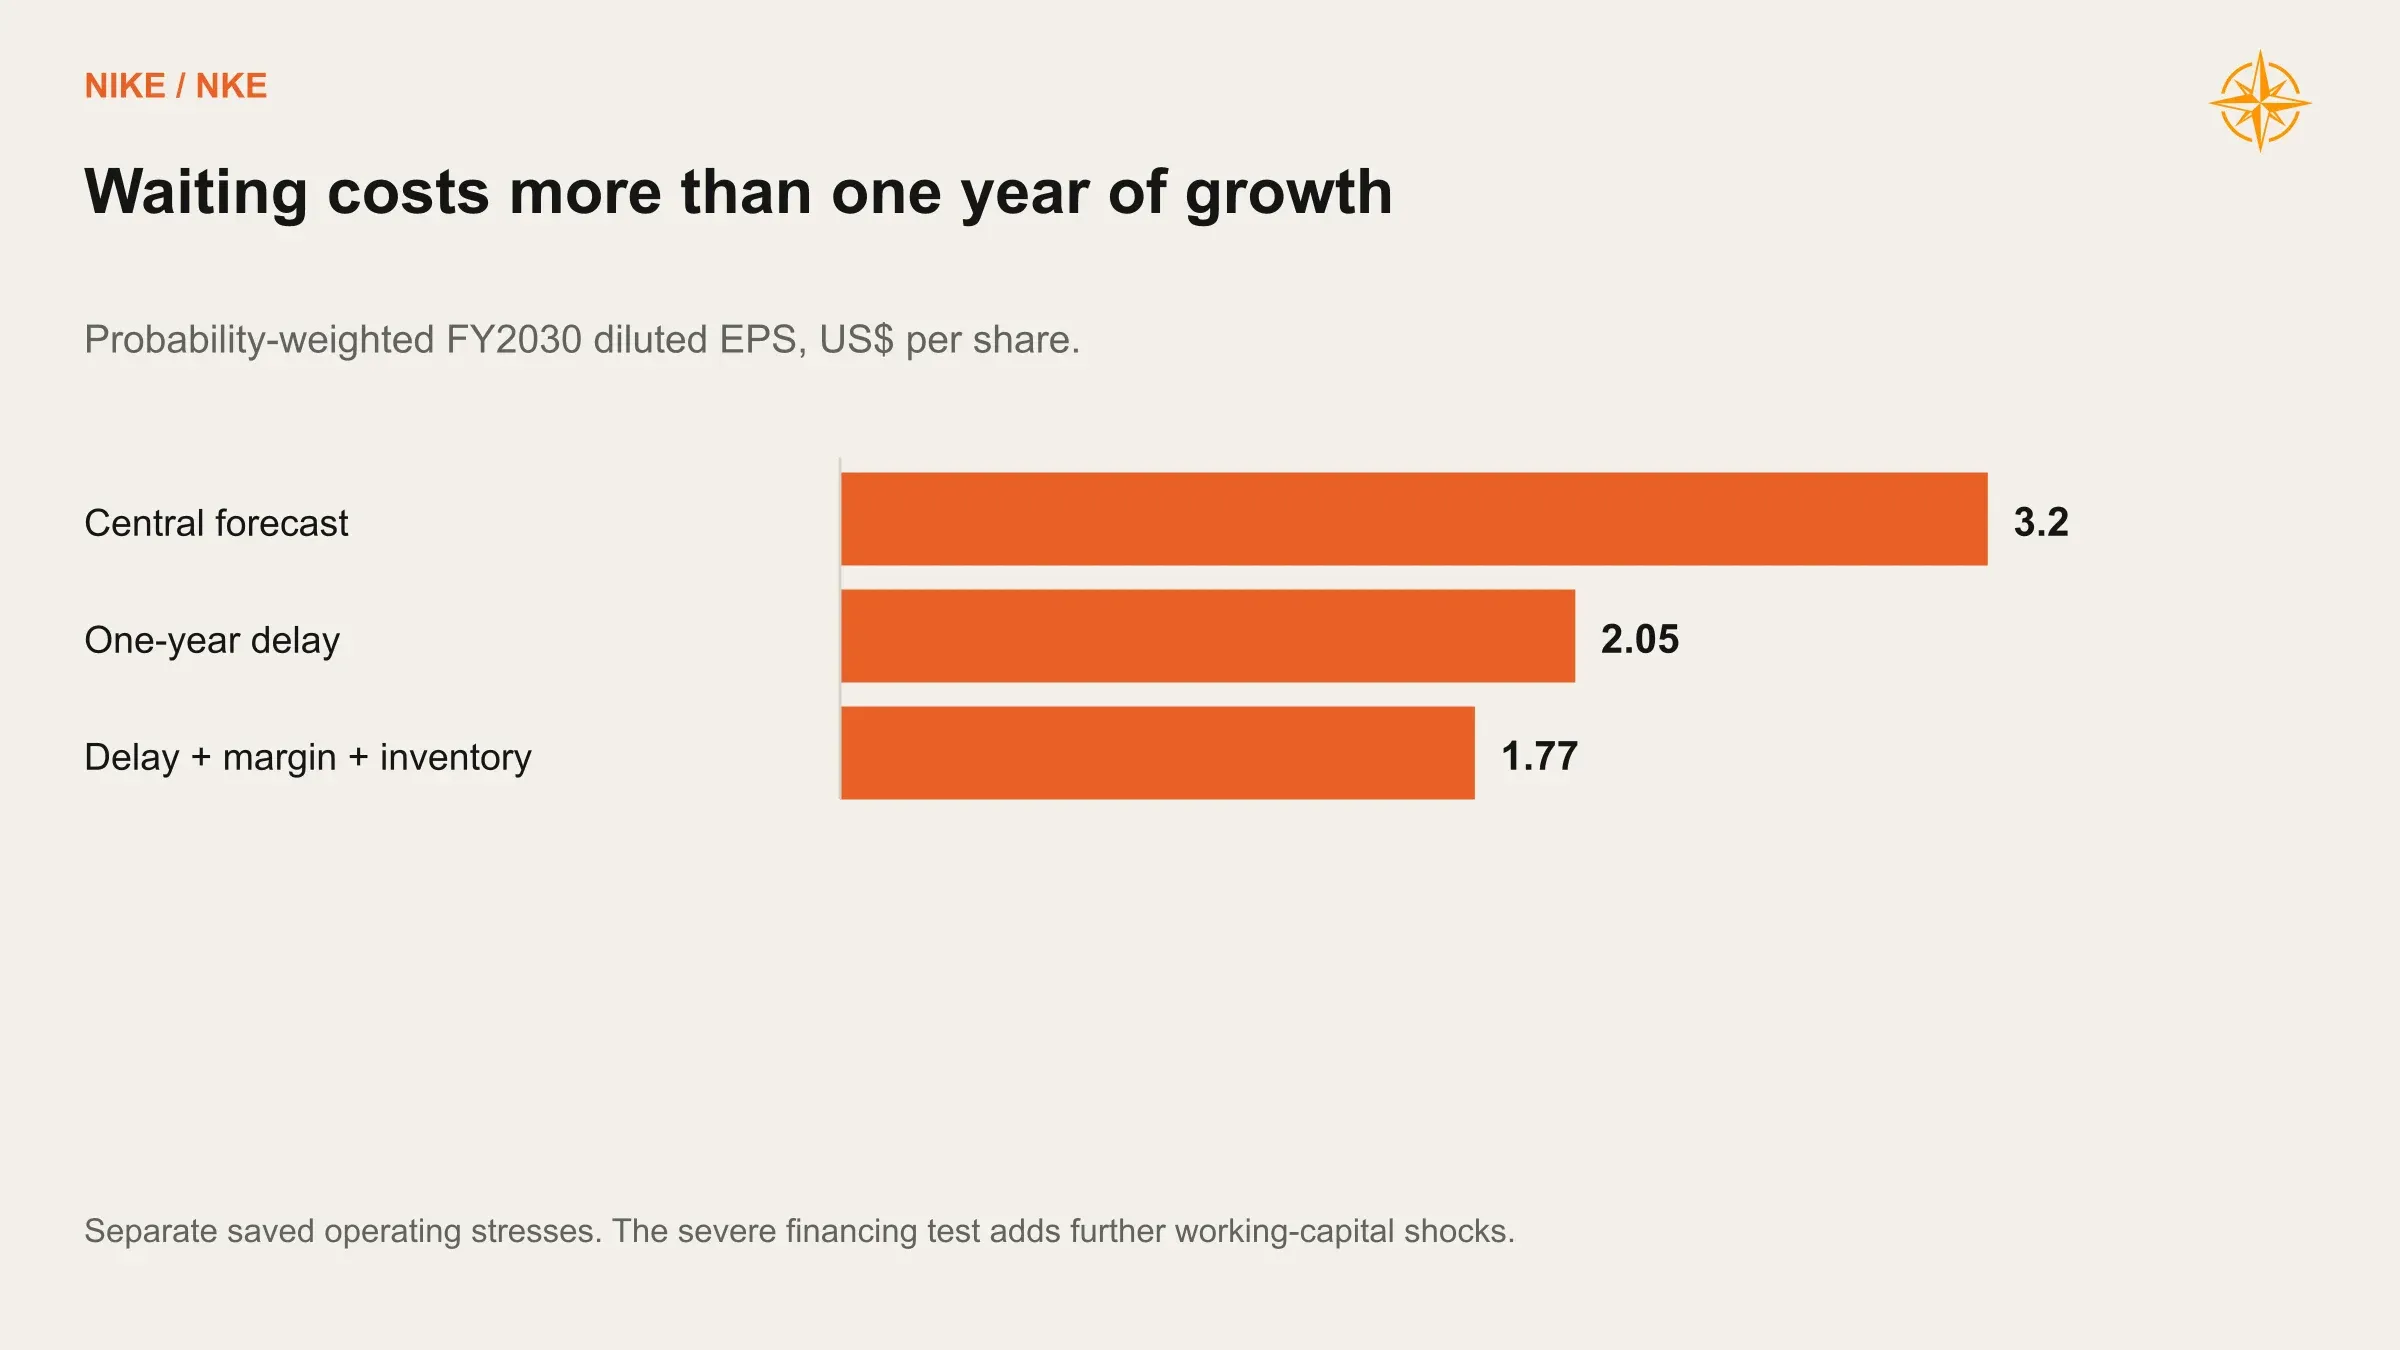
Weighted across every path, fiscal 2030 lands at $50.80 billion of revenue, $5.94 billion of operating profit and $3.20 of EPS. That sits below the Base group, since the downside paths get a vote.
Operating stress, weighted FY2030 result | Revenue | Operating profit | Diluted EPS |
|---|---|---|---|
Central forecast | $50.80B | $5.94B | $3.20 |
Gross margin 1 percentage point lower | $50.80B | $5.44B | $2.89 |
Gross margin 1 percentage point higher | $50.80B | $6.45B | $3.51 |
Recovery delayed one year | $46.02B | $3.97B | $2.05 |
Performance and lifestyle growth 2 points higher annually | $54.36B | $7.15B | $3.90 |
Only half of structural cost savings delivered | $50.80B | $5.25B | $2.79 |
Delay, lower margin, and slower inventory conversion | $46.02B | $3.51B | $1.77 |
The row that should keep Nike's management up at night is the one-year delay. Nike keeps paying designers, marketers, store staff and warehouse rent while it waits, so a delay burns cash along the way on top of pushing profits further out. Weighted EPS drops from $3.20 to $2.05. Slow inventory alone is mostly a timing nuisance, but paired with markdowns and weaker sales it drags EPS down to $1.77.
We also tested how a slower recovery could strain the balance sheet. The test combines a one-year delay, 3 points less margin, 30 extra inventory days, 20 extra receivable days and suppliers paid 10 days sooner. In that world, 75.4% of conditional path probability needs new borrowing, and 16.4% needs equity beyond $3 billion of added credit. In our central case, no path borrows or issues emergency equity through fiscal 2030.
What We Want to See Next
Nike is scheduled to report its first quarter after the close on October 1. Our Base phasing puts fiscal 2027 quarterly revenue at $11.25 billion, $11.68 billion, $10.49 billion and $10.53 billion, with EPS of $0.41, $0.59, $0.34 and $0.33. These are Northwise estimates; management’s outlook extends through the first half of the fiscal year. Rounded quarterly figures can differ slightly from annual totals. Earnings announcement.
The signals we care about take longer to show up. We want shoppers buying enough that retailers reorder without inventory piling up again. We want digital sales getting cleaner without customers vanishing, new lifestyle styles earning a second purchase, and running's momentum spreading to the rest of the store.
We would lose confidence quickly if Nike kept calling falling sales a cleanup while inventory, discounts and reorders stopped improving. A reset only pays off if the company on the other side is better.
Today, the evidence supports a recovery we are willing to underwrite. What we are willing to pay for it is a separate conversation.
Sources and related research
Historical figures come from Nike’s FY2026 results and annual filing. Product and channel commentary comes from the earnings calls linked above and Nike’s China marketplace announcement. Competitive figures use the companies’ own releases: Adidas, On and DICK’S.
Our earlier Nike stock forecast for 2030 and Nike dividend thesis remain available as separate reports. The forecasts in this article are Northwise estimates.
Northwise Premium
Choose how to continue with Northwise
Join Northwise Premium
Unlock the rest of this report, its complete valuation, the downloadable model, portfolios, and action framework.
Join Northwise PremiumCreate a Free Account
Continue across Free Northwise research, follow companies, save reports, and receive updates.
Create a Free Account
Nike Stock Forecast 2030
Nike Stock Forecast 2030: Why unwinding Nike Digital, rebuilding wholesale, and disciplined execution could reset growth and margins this decade.
Nike Stock Dividend Thesis 2025
Nike stock dividend offers steady yield and brand resilience. Here's why we're long NKE as a value anchor in a volatile market.

HOOD Stock Forecast: Can Robinhood Keep the Wealth?
Our Robinhood (HOOD) stock forecast examines earnings, customer wealth, valuation and growth through 2030. Read the report and explore the complete workbook.
Northwise Portfolios
See how the research becomes real decisions
Reader discussion
Discuss the research
Premium access is required to join this report's discussion.
Join Northwise Premium
No comments yet. Start a thoughtful discussion.