HOOD Stock Forecast: Can Robinhood Keep the Wealth?

Our Robinhood (HOOD) stock forecast examines earnings, customer wealth, valuation and growth through 2030. Read the report and explore the complete workbook.
In this article
Robinhood has won a place in millions of investors’ lives. The larger opportunity is the money they still hold elsewhere. Banking, retirement, credit, private markets and financial infrastructure could turn that opening into a much larger earnings base.
A customer can love Robinhood and still keep most of their money somewhere else.
They can place every trade in the app while their paycheck arrives at another bank, their retirement savings sit with another broker, and an adviser handles the family’s larger accounts. Robinhood gets the activity. Other institutions keep much of the relationship.
As customers accumulate wealth, they need more from their financial provider. Robinhood has an opportunity to serve those needs and keep more of their money on its platform.
There is already evidence that this is happening. Robinhood reported $21.7 billion of net deposits in the second quarter, $34.5 billion of retirement assets and 4.8 million Gold subscribers. Its banking offering had attracted more than $3 billion from over 240,000 funded customers, with approximately 40% signed up for direct deposit. Direct deposits, retirement balances and paid subscriptions give customers reasons to keep using the service. (Robinhood Q2 2026 results).
Robinhood also remains exposed to the market cycle. Transaction revenue became a larger share of its business in Q2 as customers gained more ways to trade.
The growing asset base gives Robinhood more ways to earn revenue. Many of those businesses still depend on the same customers, market conditions and appetite for trading.
We expect Robinhood to capture a larger share of customer finances while building selected businesses that extend beyond its own app. A few successful initiatives could support substantial growth. Building them will require capital, reliable service and customers willing to entrust Robinhood with more of their wealth.
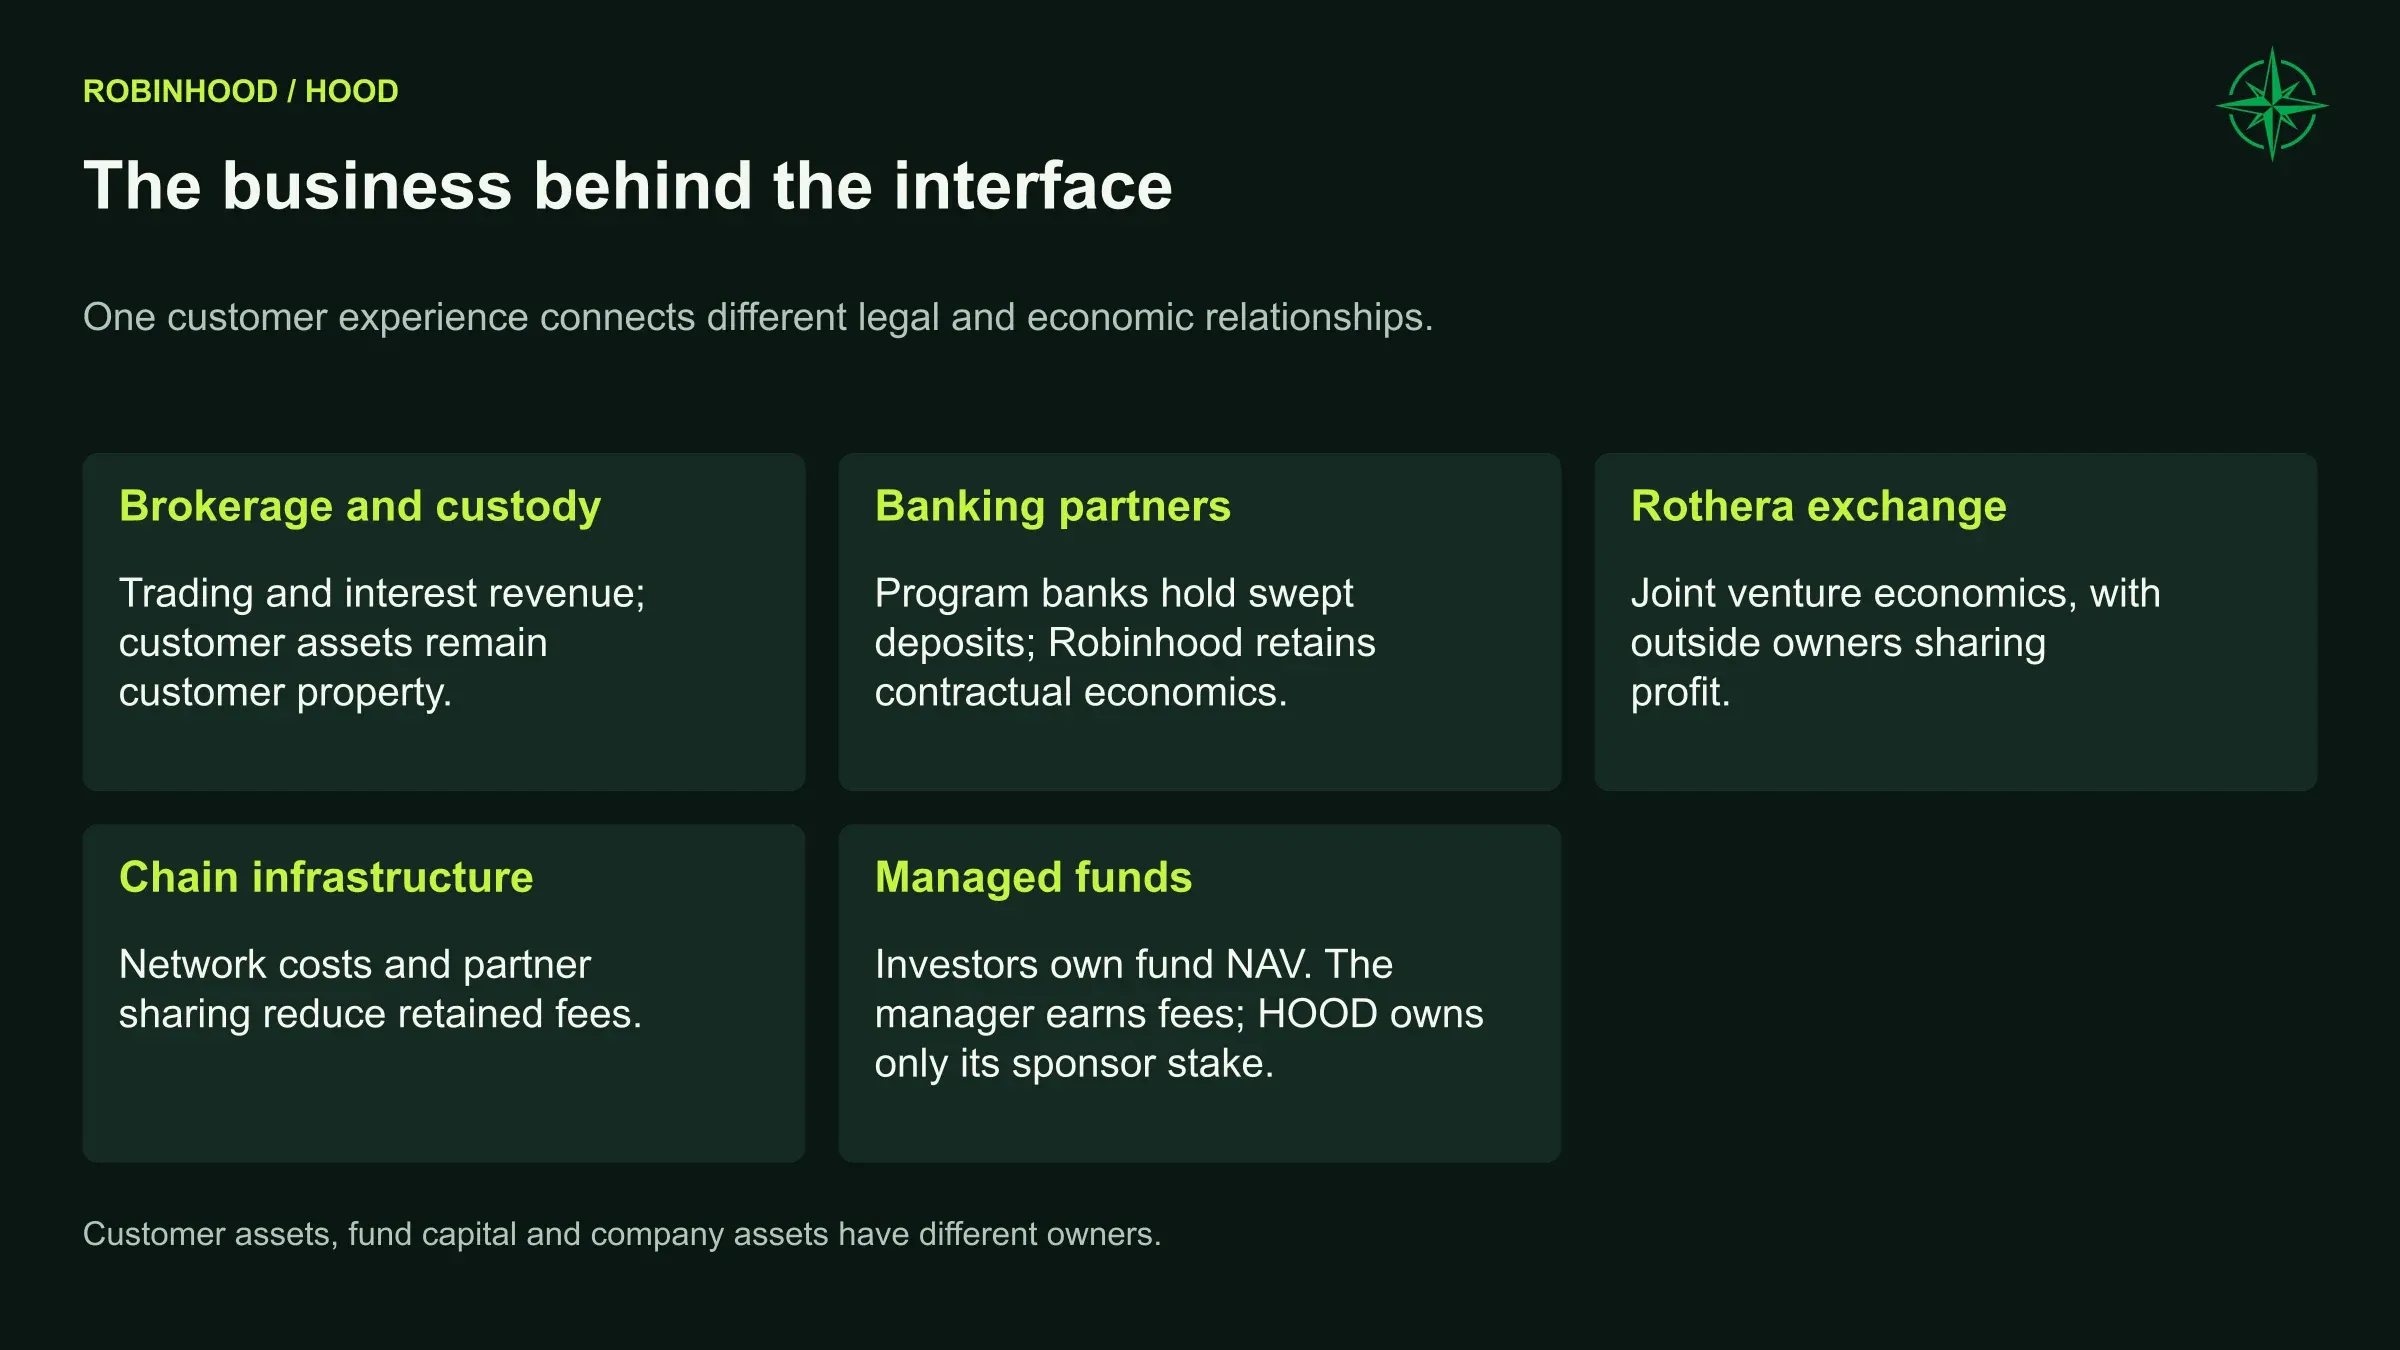
In our Base case, we expect $16.47 billion of revenue and $8.37 billion of normalized income attributable to Robinhood in 2030. After retaining capital and liquidity for the expanding business, we estimate approximately $4.06 billion of operating cash flow available to equity that year. Much of the earnings growth will need to stay in the business to finance larger balances and maintain liquidity.
Trading remains the foundation
Trading is a valuable business for Robinhood. The next opportunity is to build on that relationship as customers need banking, advice and retirement services.
The current business already provides a substantial financial foundation.
Reported financial results | Q1 2026 | Q2 2026 | First half 2026 |
|---|---|---|---|
Revenue | $1,067M | $1,308M | $2,375M |
Operating expenses | $656M | $734M | $1,390M |
Operating profit | $411M | $574M | $985M |
Net income attributable to Robinhood | $350M | $561M | $911M |
Diluted EPS | $0.38 | $0.62 | $1.00 |
First-half EPS uses the reported period figure.
Much of the recent growth comes from additional ways to trade. Transaction revenue represented 59.3% of Q2 revenue, up from 54.5% a year earlier. Event-contract revenue increased from $10 million to $156 million, supplying approximately 46% of the total year-over-year revenue increase. Gold subscriptions contributed $54 million, about 4% of the quarter. These percentages are calculated from the reported revenue breakdown.
Prediction markets broaden Robinhood’s trading business beyond equities, options and crypto. Revenue still depends on customers placing trades.
A brief increase in volatility can stimulate trading; a prolonged deterioration in household finances and market participation can affect several product categories together. A customer with Gold, margin and a crypto account is still one customer with one financial position.
Investment gains also lifted the quarter’s earnings. Robinhood reported $129 million of gains primarily associated with Robinhood Ventures Fund I, or RVI, contributing $0.14 of diluted EPS. Removing that contribution takes quarterly EPS from $0.62 to approximately $0.48 before other normalization adjustments. Consolidated net income was $573 million, while $561 million belonged to Robinhood after outside owners’ interests. (Q2 earnings reconciliation).
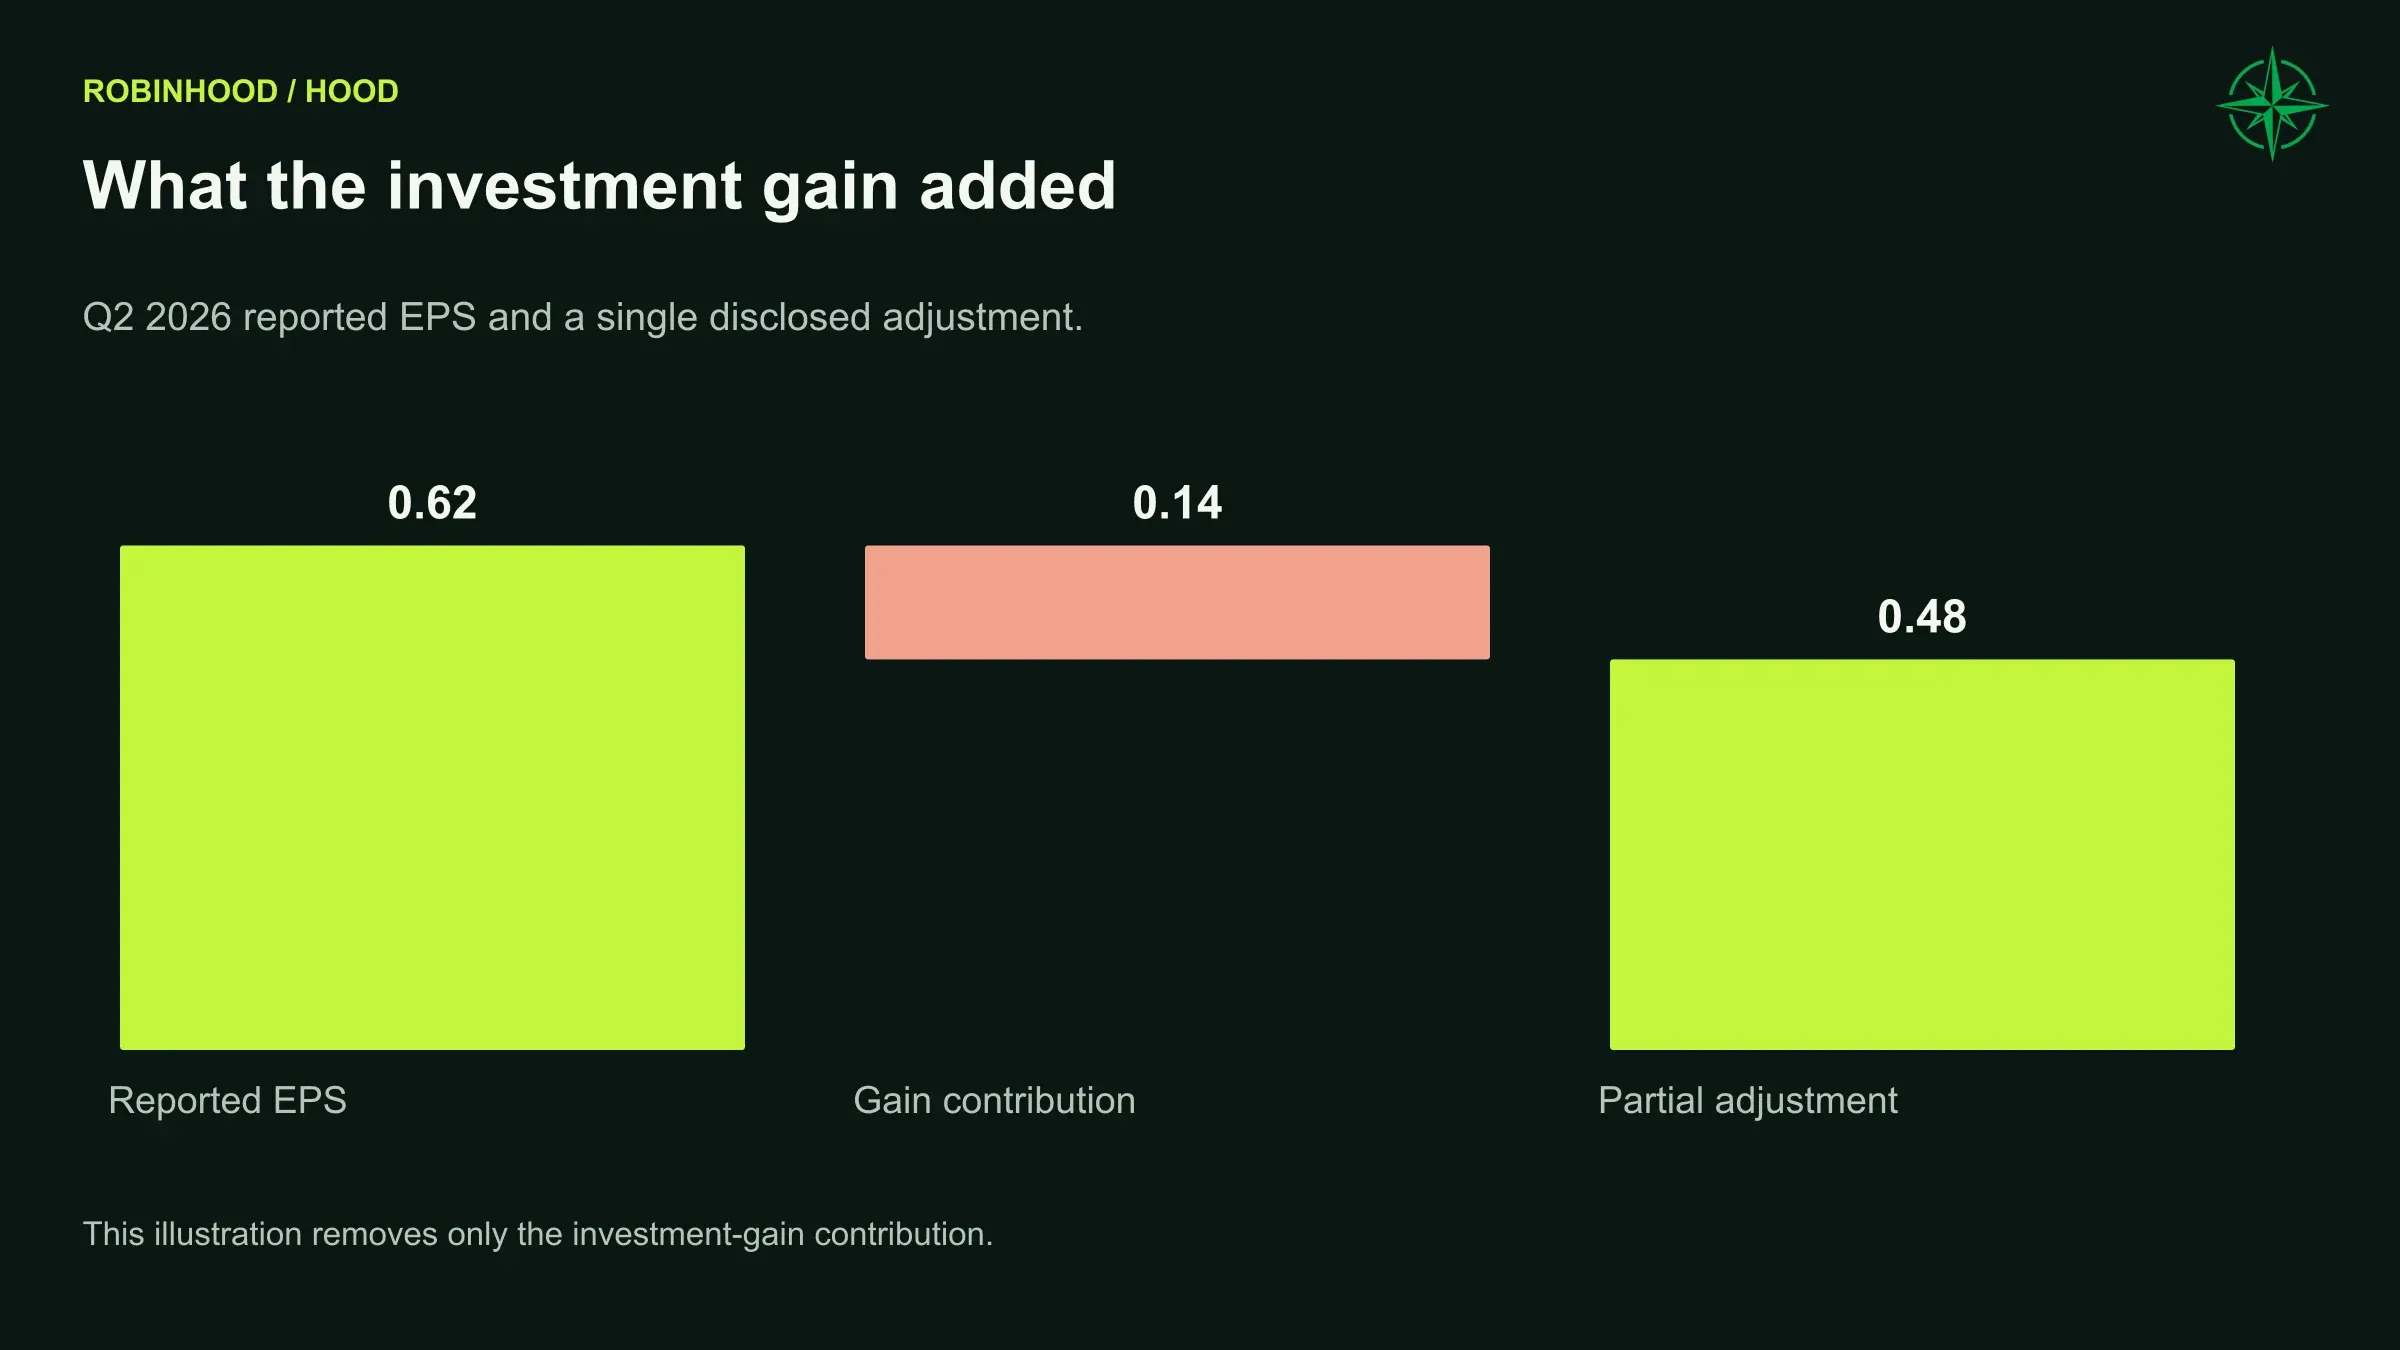
Our normalized earnings exclude specified unusual items and returns on Robinhood’s own fund investments, while retaining ordinary stock compensation as a cost.
The business remains strongly profitable after making those distinctions. It can fund experimentation from an established earnings base, which gives its product ambitions more substance than those of a company still searching for a viable core business.
The bigger account is the opportunity
The most persuasive part of the customer strategy is the effort to keep people from outgrowing Robinhood.
An individual stock portfolio can be relatively easy to accommodate. A household may also want joint accounts, retirement accounts, trusts, managed portfolios and advice. Each missing capability gives another institution an opportunity to take over more of the relationship.
Robinhood is steadily addressing those gaps. Strategies had more than 300,000 funded customers and nearly $2 billion of managed assets by the July earnings release. TradePMR had reached $50 billion in advisory-platform assets and launched the Robinhood Advisor Network. Retirement assets stood at $34.5 billion at June, up 82% year over year. (Q2 customer and product disclosures).
These services give customers more reasons to keep their next deposit, retirement rollover or advisory account with Robinhood.
Reaching $1.23 trillion in customer assets would require years of strong deposits.
Northwise Base forecast | 2026 | 2027 | 2028 | 2029 | 2030 |
|---|---|---|---|---|---|
Funded customers | 29.48M | 32.17M | 35.33M | 38.87M | 42.79M |
Platform assets | $422.00B | $536.37B | $710.19B | $935.43B | $1,227.46B |
Annual net deposits | $74.97B | $98.84B | $130.89B | $173.24B | $227.98B |
Retirement assets | $41.78B | $62.51B | $94.73B | $140.84B | $206.24B |
RIA-platform assets | $55.00B | $67.16B | $85.48B | $108.32B | $136.96B |
Strategies assets | $2.80B | $4.61B | $7.88B | $13.45B | $23.03B |
Northwise estimates as of September 23, 2026. Asset categories overlap. For 2026, we combine reported first-half results with our estimates for the rest of the year.
Getting to $1.23 trillion of platform assets requires almost $228 billion of net deposits in 2030. That is the scale of the commercial achievement we are underwriting.
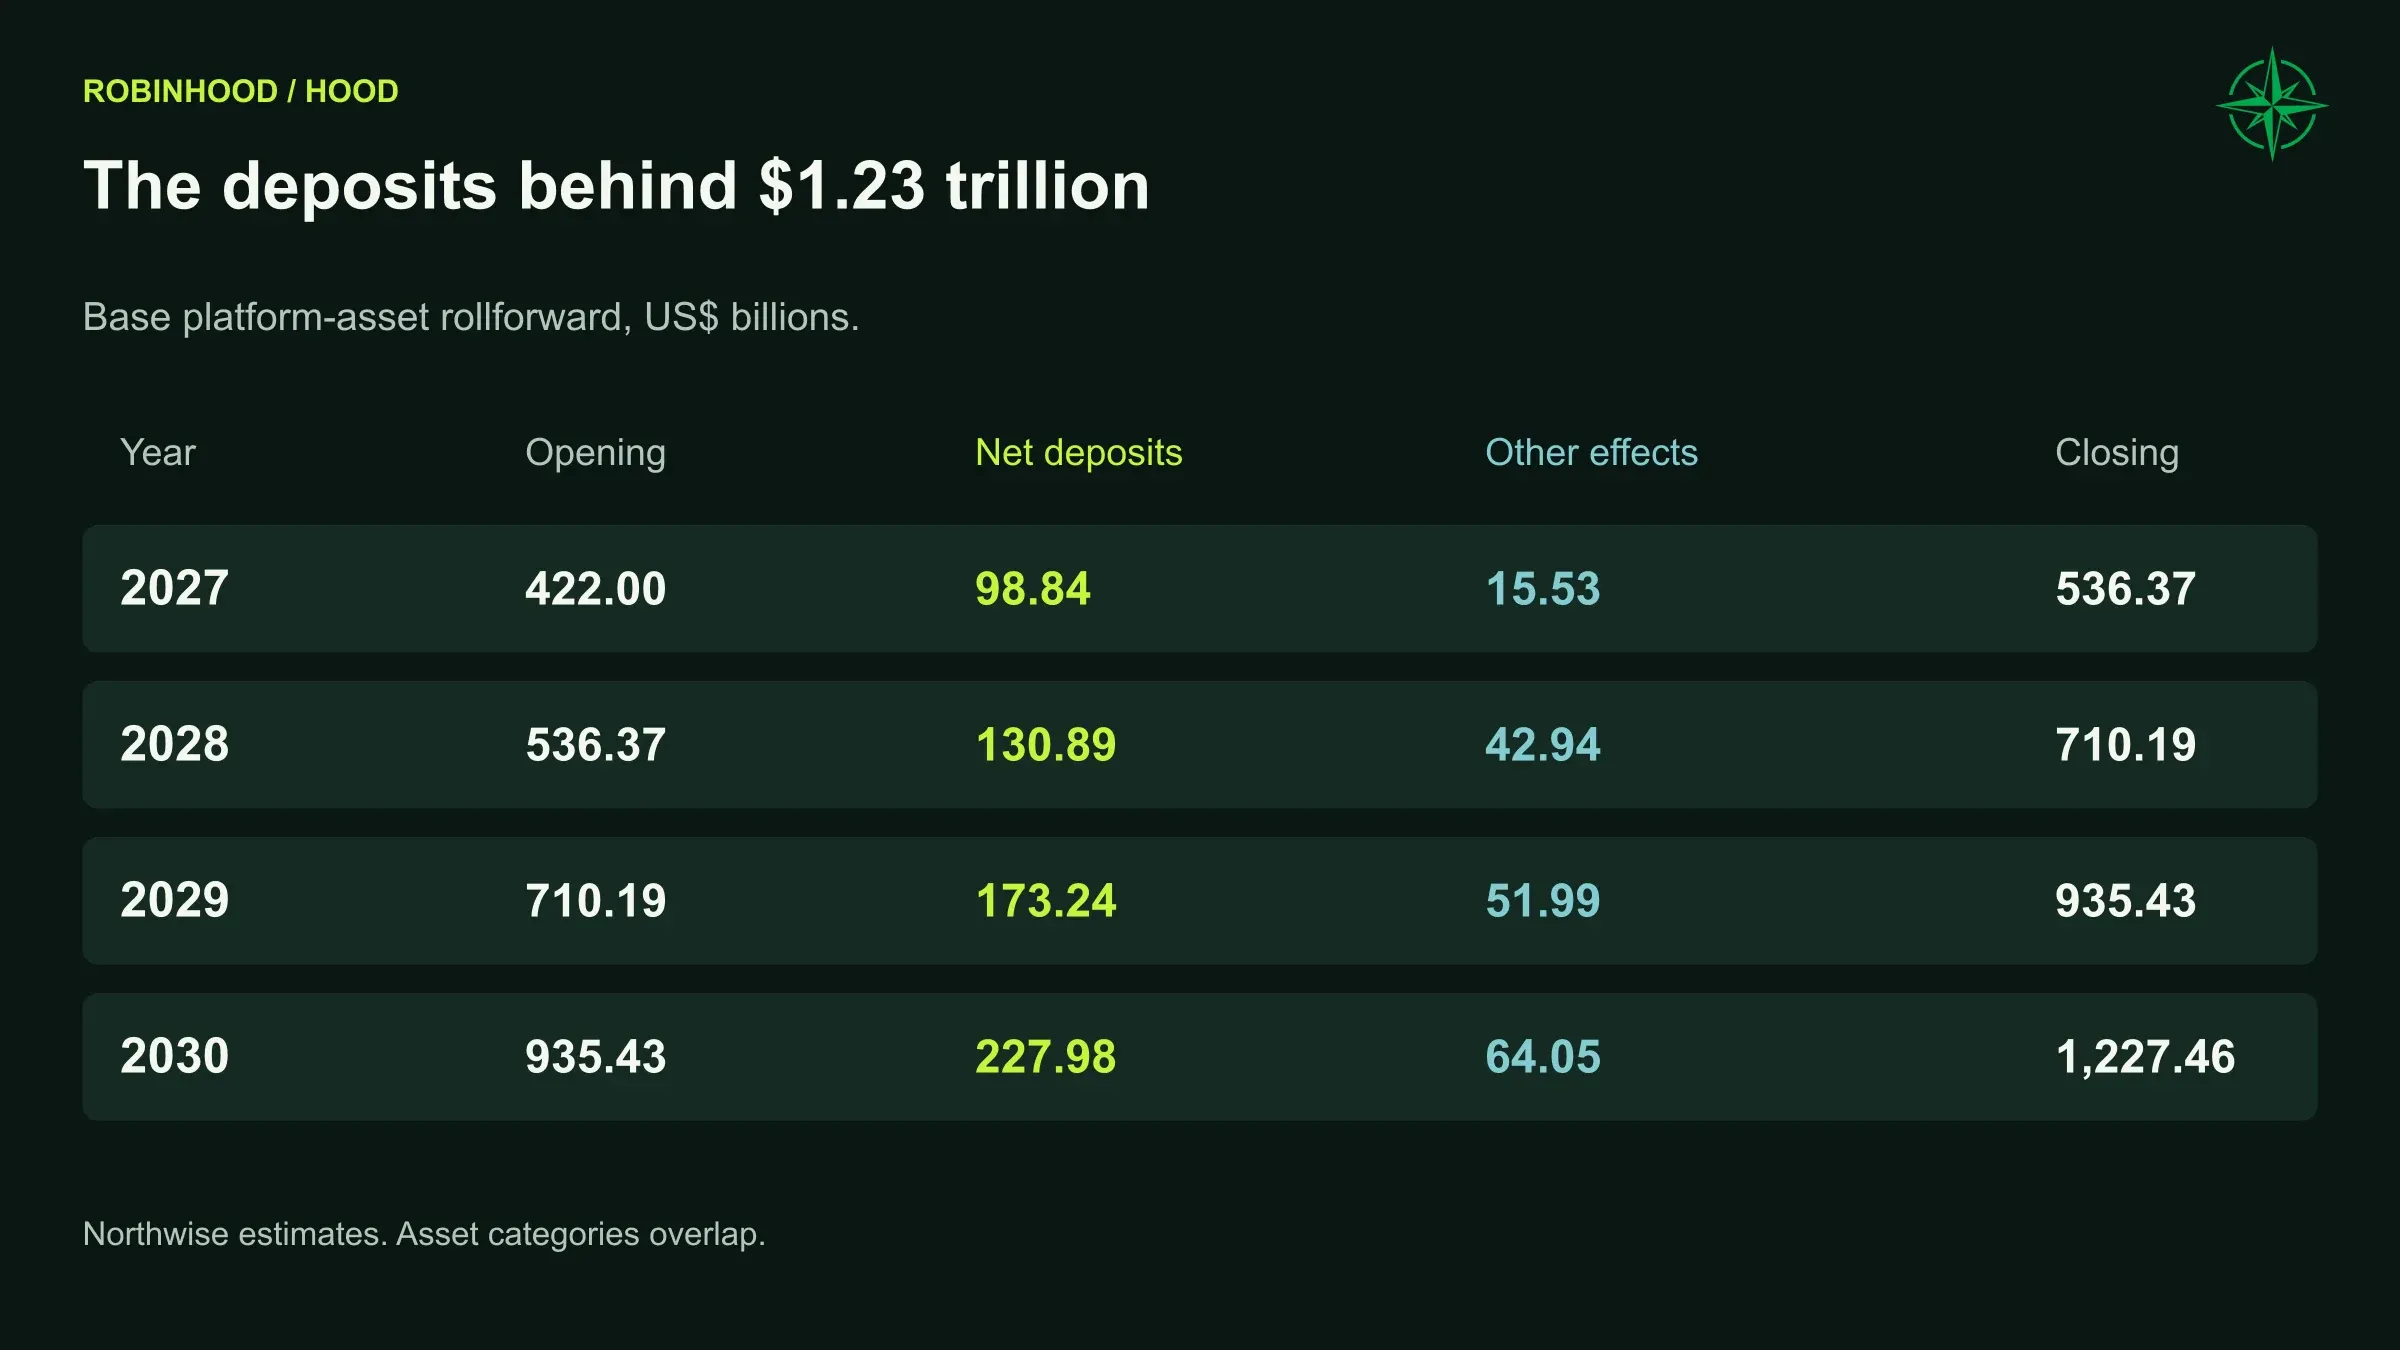
In our steady franchise setting, annual core net deposits equal 22% of beginning ordinary platform assets before macroeconomic adjustments. The weaker and stronger settings use 12% and 30%. Funded-customer growth begins at 4.5%, 9% and 14.5%, respectively. Management has described a roughly 20% long-run deposit ambition. The annual estimates here are our own.
There are two important limits to the headline asset figures. Robinhood’s definition includes relevant TradePMR adviser-managed assets held with other custodians. Its net-deposit measure also includes dividends, interest, staking rewards and certain promotional amounts. Reported deposits therefore include both external transfers and amounts earned or credited within the platform.
Adoption is growing and customers are using more services. Measuring each product’s effect on retention will require more detailed customer and acquisition-cost disclosures.
We expect the expanded offering to keep attracting assets through quieter markets and periods with fewer promotions. Recurring deposits and transfers from other institutions would help demonstrate that progress.
Gold matters beyond its subscription fee
Gold is useful evidence that customers are willing to pay for a Robinhood relationship.
At June, approximately 17% of funded customers subscribed, while about 40% of new funded customers signed up during Q2. A subscription provides a direct revenue stream, but its strategic value is the way it connects benefits across the rest of the offering.
We see Gold as a way to make consolidation more attractive. Better cash terms, retirement incentives, information and card access can give an existing customer reasons to bring more activity to Robinhood. That is more credible than expecting the company to win every additional product through a separate marketing campaign.
The subscription itself remains a minority of company revenue.
Northwise Base forecast | 2026 | 2027 | 2028 | 2029 | 2030 |
|---|---|---|---|---|---|
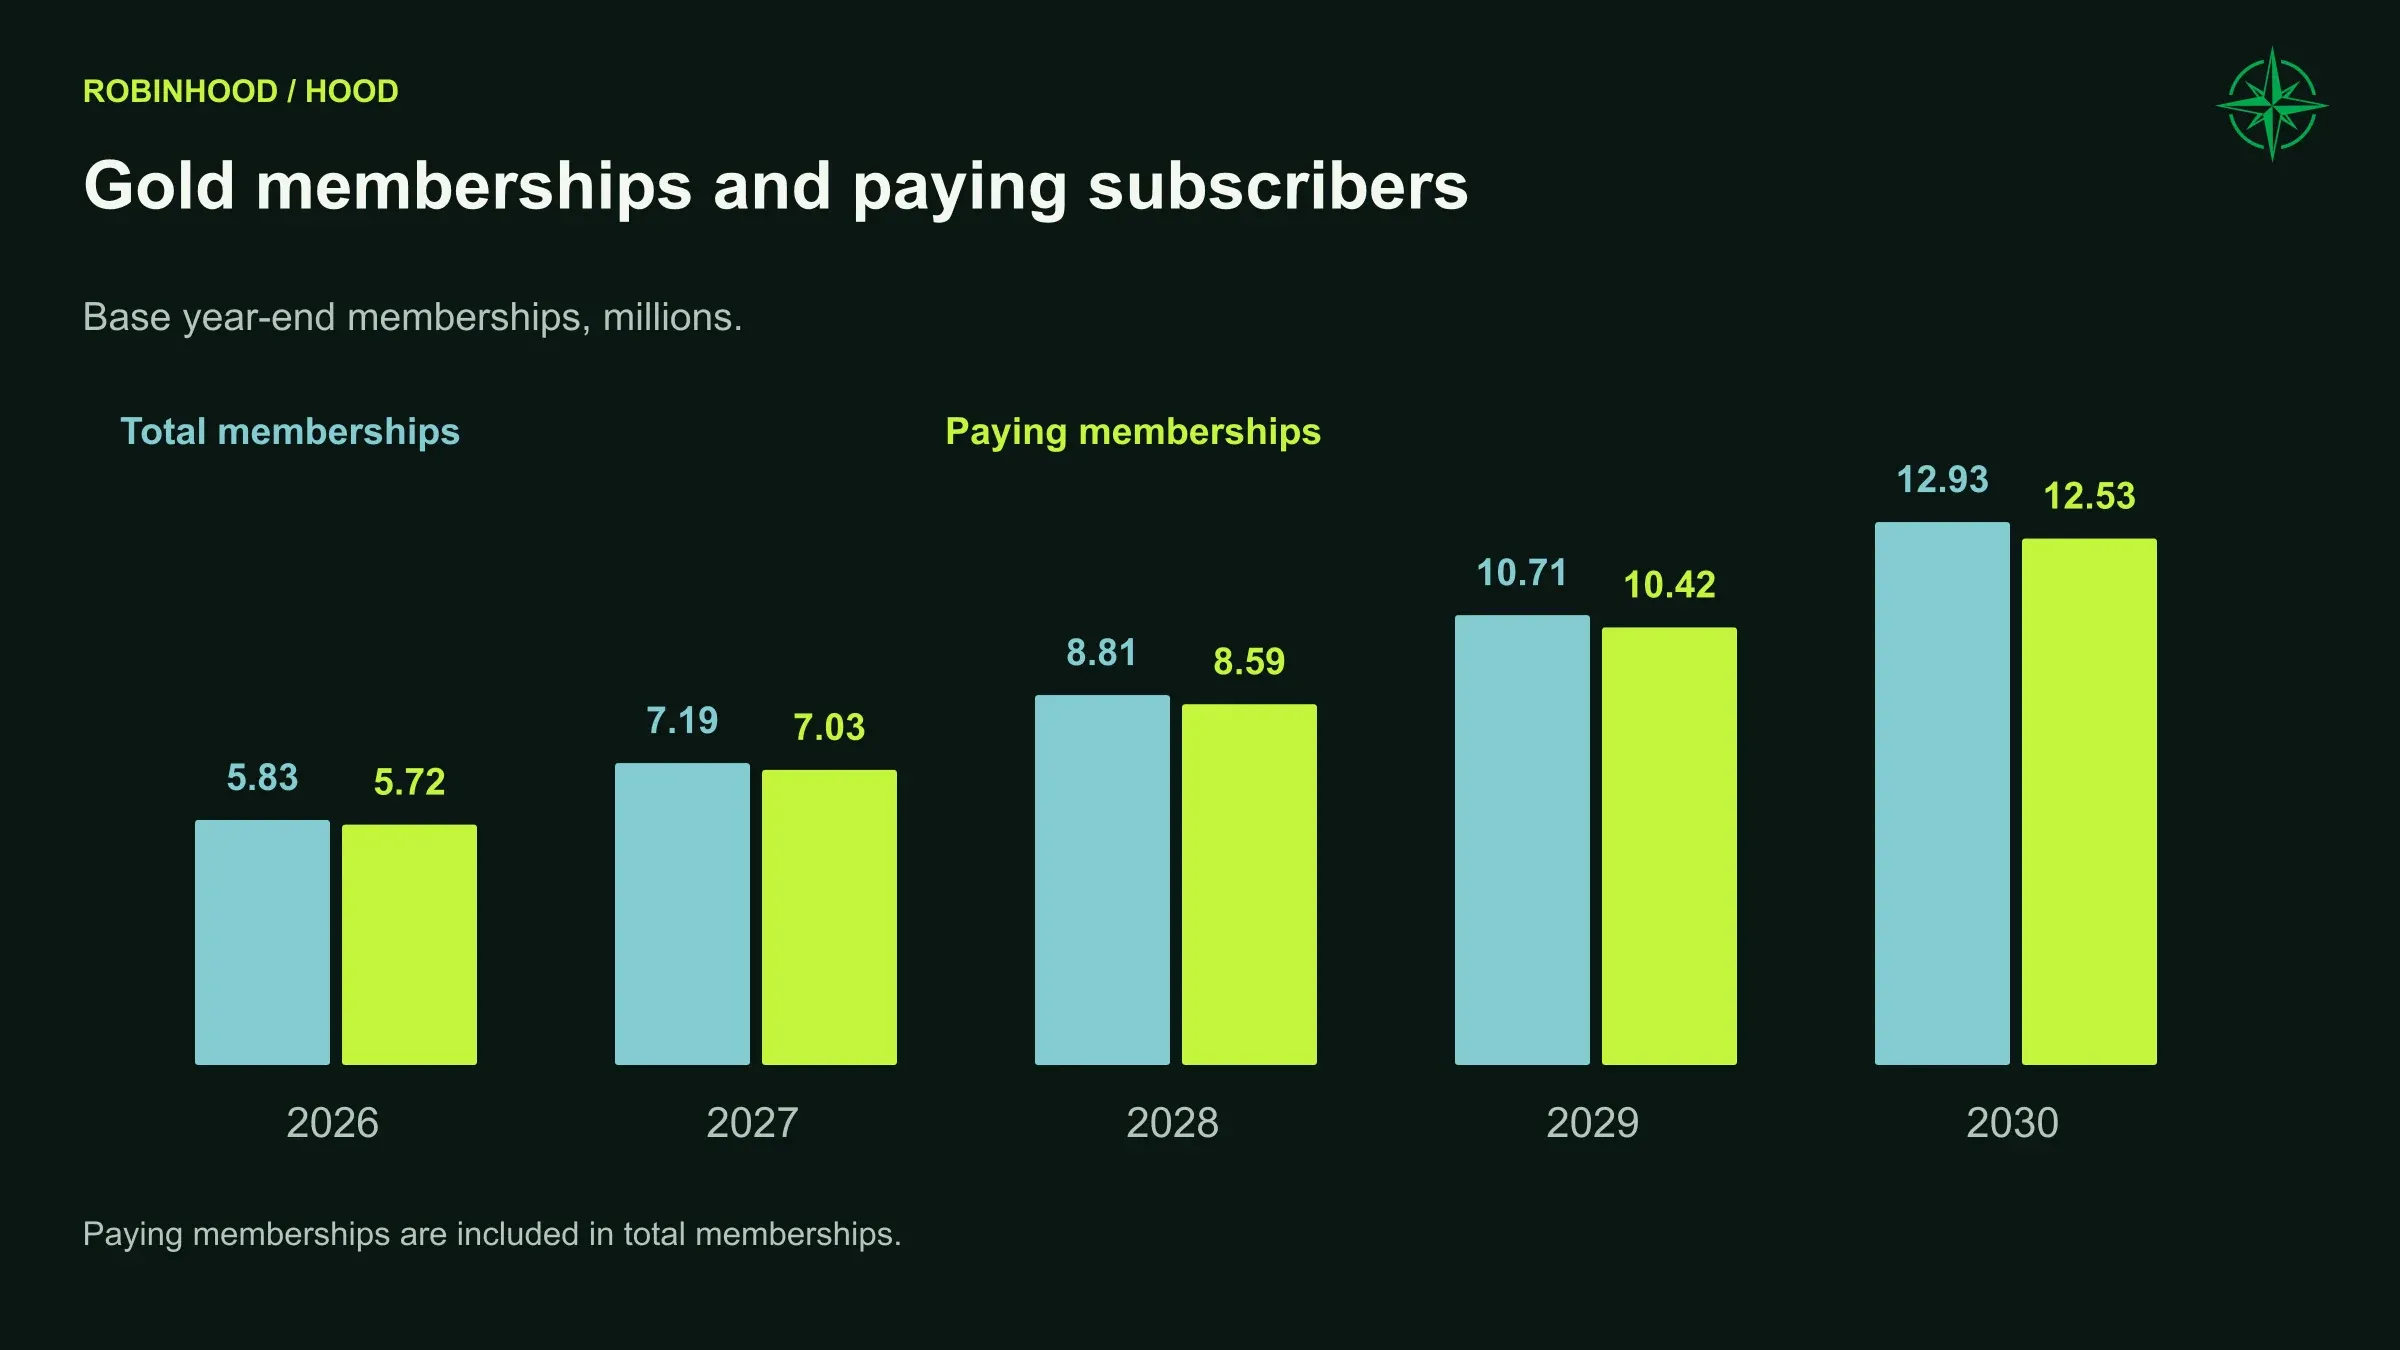
Gold memberships, including complimentary access | 5.83M | 7.19M | 8.81M | 10.71M | 12.93M |
Fee-paying memberships | 5.72M | 7.03M | 8.59M | 10.42M | 12.53M |
Gold subscription revenue | $231M | $312M | $384M | $471M | $585M |
Revenue uses average paying membership, realized fees and our allowance for incentives. Paying membership excludes complimentary premium-card access.
Our steady franchise assumption takes total Gold attachment toward 29% by 2030, compared with 21% and 36% in the weaker and stronger settings. Realized annual fee assumptions rise from $50 in 2027 to $53 in 2030 before incentive deductions. Those estimates reflect the fees we expect Robinhood to collect. Future list prices remain undisclosed.
The wealth offering provides somewhere for that relationship to develop. Strategies supplies managed portfolios. TradePMR connects Robinhood to advisers and their clients. Self-directed retirement supports a different customer need again.
A broader service offering gives customers more reasons to stay, with revenue depending on the services they use.
Strategies uses an assumed effective advisory yield of 18 basis points on average assets. RIA-platform service economics use five basis points, with an additional referral and service contribution phasing toward 2.5 basis points. Advisory fees apply to eligible managed assets.
TradePMR also came with a real investment: $169 million of cash consideration and approximately $100 million of post-close share compensation. The acquisition brought an established adviser platform and its operating capabilities.
The remaining challenge is confidence. A customer with meaningful wealth may choose an adviser or institution for reasons that have little to do with interface quality. Robinhood needs to make the service dependable enough that customers remain comfortable as the amounts get larger. We think its progress warrants a substantial growth assumption, while recognizing that trust takes longer to establish than product availability.
The money paid to win those assets
An upfront promotion can be a good investment when the customer relationship remains profitable for years.
The relevant question is how much Robinhood pays, how long the assets remain, and what it earns while they are there. We would be more concerned by a business that must continually renew the subsidy than by one that pays an upfront incentive and retains a profitable relationship for years.
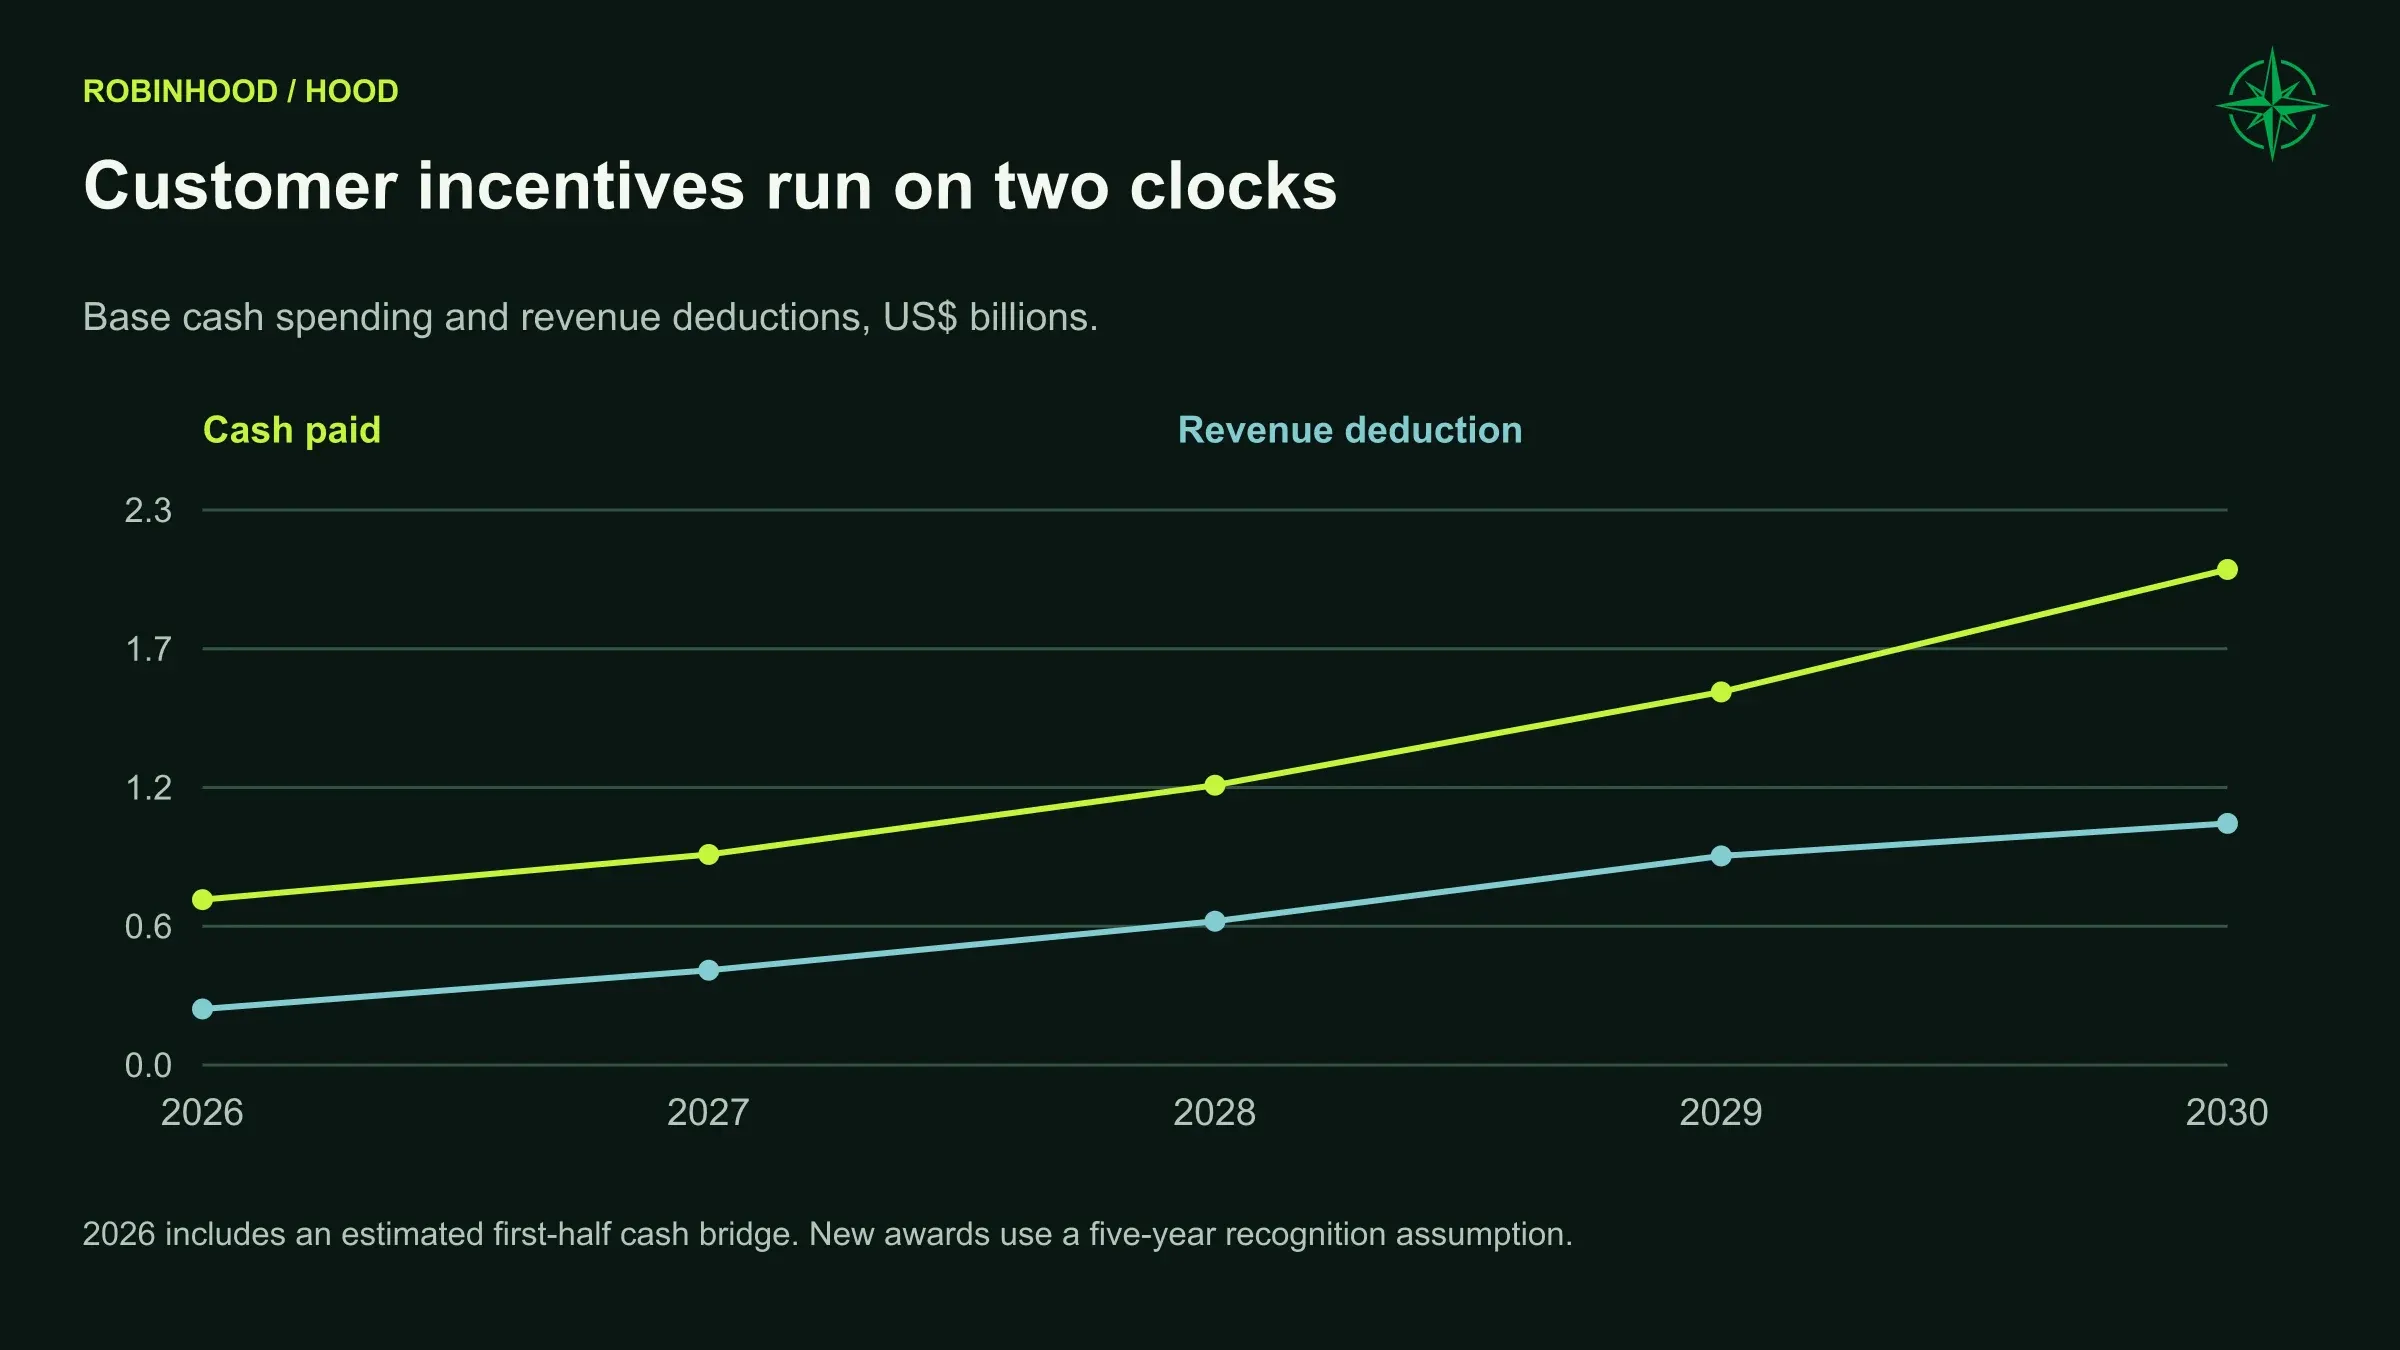
The accounting spreads part of that cost over time. Robinhood carried $799 million of deferred customer-match assets at June, compared with $613 million at year-end. Cash can leave before the full cost appears as a reduction of revenue.
We account for both the cash paid upfront and the expense recognized over time.
Northwise Base forecast | 2026 | 2027 | 2028 | 2029 | 2030 |
|---|---|---|---|---|---|
Cash spent on customer matches | $695M | $884M | $1,175M | $1,567M | $2,081M |
Match amortization and revenue deduction | $235M | $398M | $604M | $878M | $1,015M |
Ending deferred-match asset | $1,072M | $1,559M | $2,130M | $2,818M | $3,885M |
The 2026 cash-spending estimate includes a reconstructed first-half amount because a separate cash-award figure was unavailable.
We assume new awards are recognized over five years, with an estimated remaining life of 3.5 years for the opening June balance. New awards equal 0.65%, 0.90% or 1.15% of ordinary core deposits, depending on franchise execution.
By 2030, annual cash spending on matches is approximately twice that year’s revenue deduction. Rapid acquisition of new balances keeps the cash requirement ahead of recognition.
We also estimate a 4% historical incentive burden within selected revenue yields when inferring underlying monetization. The allocation is our estimate; Robinhood’s disclosures provide only the combined amounts.
We include these costs because the relationship has to work after paying to establish it. The cash leaves Robinhood when the incentive is paid, even when the expense is recognized later.
The traders are still paying the bills
Active traders remain central to Robinhood’s earnings and product development.
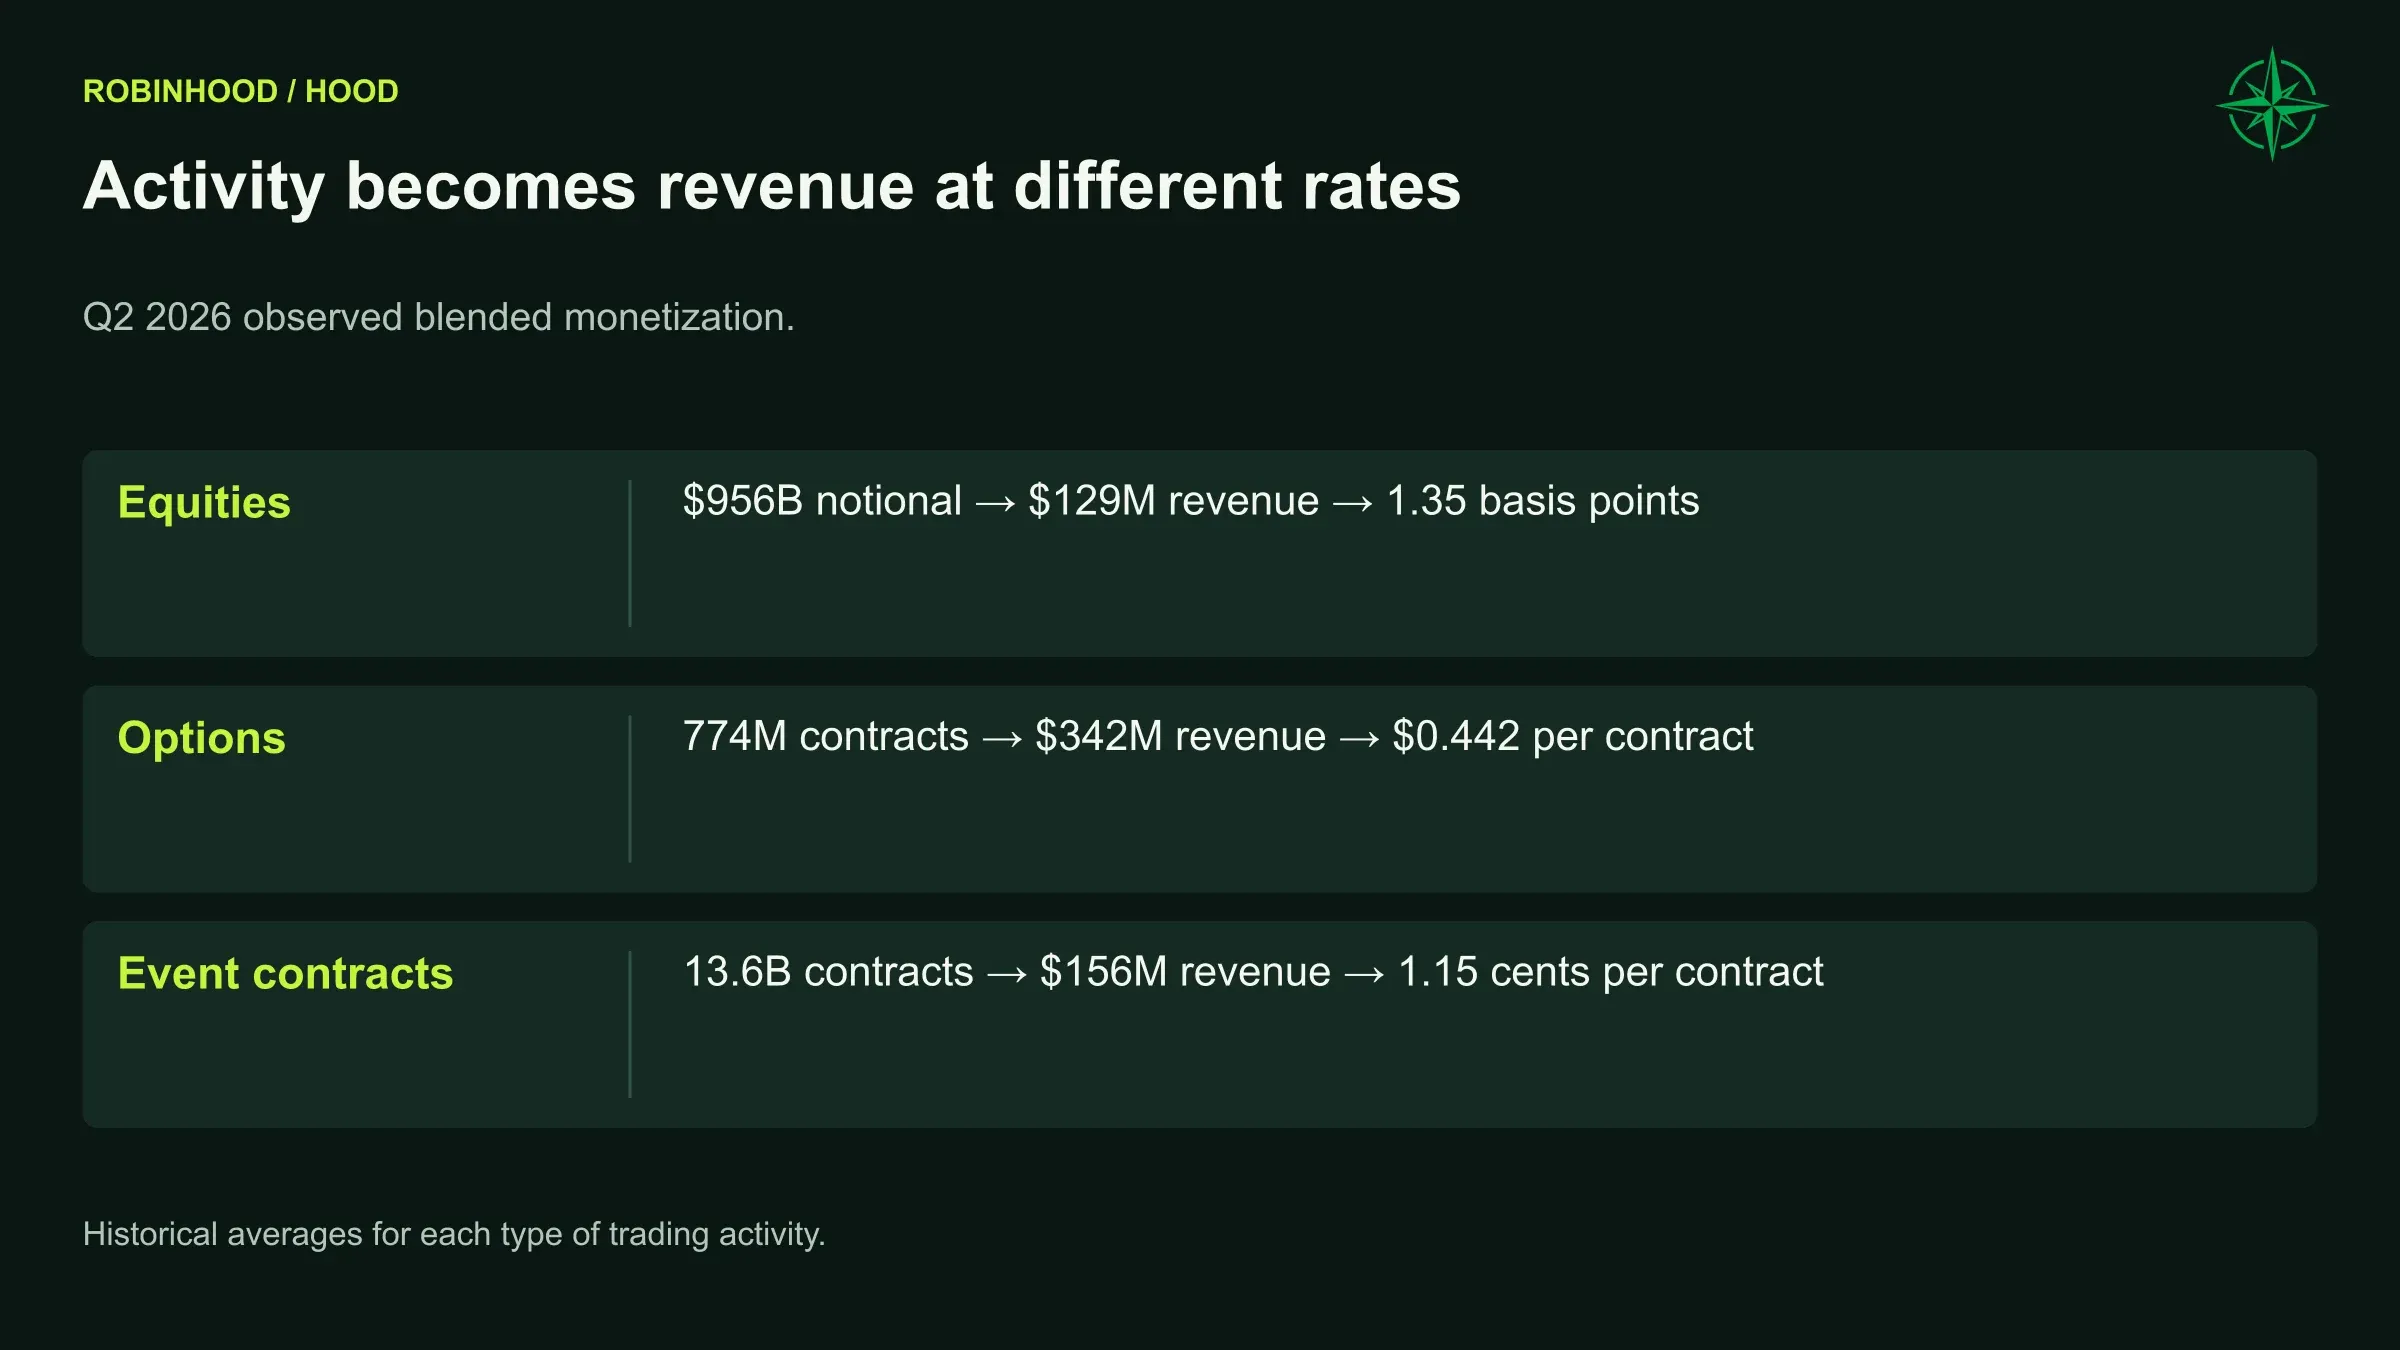
Options generated $342 million of Q2 revenue on 774 million contracts, approximately $0.442 per contract. Equities generated $129 million on $956 billion of notional volume, approximately 1.35 basis points. These averages reflect the mix of transactions during the quarter.
The opportunity is to make Robinhood useful enough that more involved traders no longer need to do as much elsewhere. Legend improves the trading workflow. Cortex brings information closer to the portfolio. Social aims to bring idea discovery closer to execution. Agentic trading opens a route for compatible AI tools to interact with separately funded accounts.
Each product can improve the trading experience and encourage more activity.
Nearly 100,000 customers had opened agentic accounts with more than $100 million of assets by the July release. The product initially required customers to connect tools to a separate account, and management acknowledged that setup remained too cumbersome for many users. Subsequent development broadened asset access and sought to reduce that friction.
Better tools could attract more active traders. Their effect on investment returns remains unproven, and faster execution can make trading mistakes easier to act on.
We expect the commercial benefit to come through more customers, greater activity and lower costs. Revenue earned through AI tools or Legend is included in the relevant trading category. The company defines its $100 million business milestones using quarterly revenue multiplied by four.
We allow trading intensity to increase while monetization declines gradually. In the steady franchise setting, equity turnover grows 3.5% annually and options intensity 7.5%, before macroeconomic adjustments. Revenue growth therefore depends on attracting more activity at gradually lower fees.
Execution arrangements also bring concentration risk. Transaction-based revenue from Citadel Securities represented 16% of Robinhood’s total Q2 revenue. That creates meaningful exposure to a single counterparty.
Crypto growth depends on who is trading
Retail and institutional crypto trades earn very different fees, making customer mix important to revenue.
Q2 crypto revenue fell 38% year over year to $100 million. Combined volume was approximately $40 billion, comprising $18 billion in the Robinhood app and $22 billion at Bitstamp. August then improved from July’s $10.9 billion to $17.5 billion, although the year-over-year comparison remained negative. (Robinhood Q2 results).
We expect a recovery, with considerable uncertainty about its pace and strength.
Bitstamp, acquired for $224 million after adjustments, expands Robinhood’s international and institutional activity. Its revenue per dollar traded is much lower than the app’s assumed rate. A growing institutional pool can therefore lower combined monetization even if comparable customers are paying unchanged prices.
Our app fee assumptions decline toward 38 basis points by 2030 before relevant incentive deductions. Bitstamp reaches 4.5 basis points. Applying the app fee to the combined volume would overstate revenue.
Northwise Base trading forecast | 2026 | 2027 | 2028 | 2029 | 2030 |
|---|---|---|---|---|---|
Equity notional | $3,725B | $4,895B | $6,596B | $8,869B | $11,810B |
Options contracts | 3.27B | 3.97B | 4.93B | 6.05B | 7.37B |
App crypto notional | $99.56B | $154.22B | $216.74B | $290.97B | $383.72B |
Bitstamp notional | $141.55B | $228.43B | $334.97B | $469.49B | $646.84B |
Notional measures the value traded. The options row measures contracts. Chain activity is separate from these crypto-volume measures.
The mixed macro setting applies a 30% crypto-activity recovery in 2027, followed by 10%, 8% and 6%, before separate franchise-growth factors. These assumptions describe trading activity. The resulting Base crypto revenue reaches approximately $1.68 billion in 2030.
We will look for returning customers, sustainable fees and additional profit as trading recovers.
A better cash experience still needs sound funding
Banking can change how often money arrives at Robinhood. Direct deposit brings money into the account regularly and makes it easier for customers to save and invest.
That is why we place considerable weight on banking adoption. But we separate the customer experience from the balance-sheet arrangements supporting it.
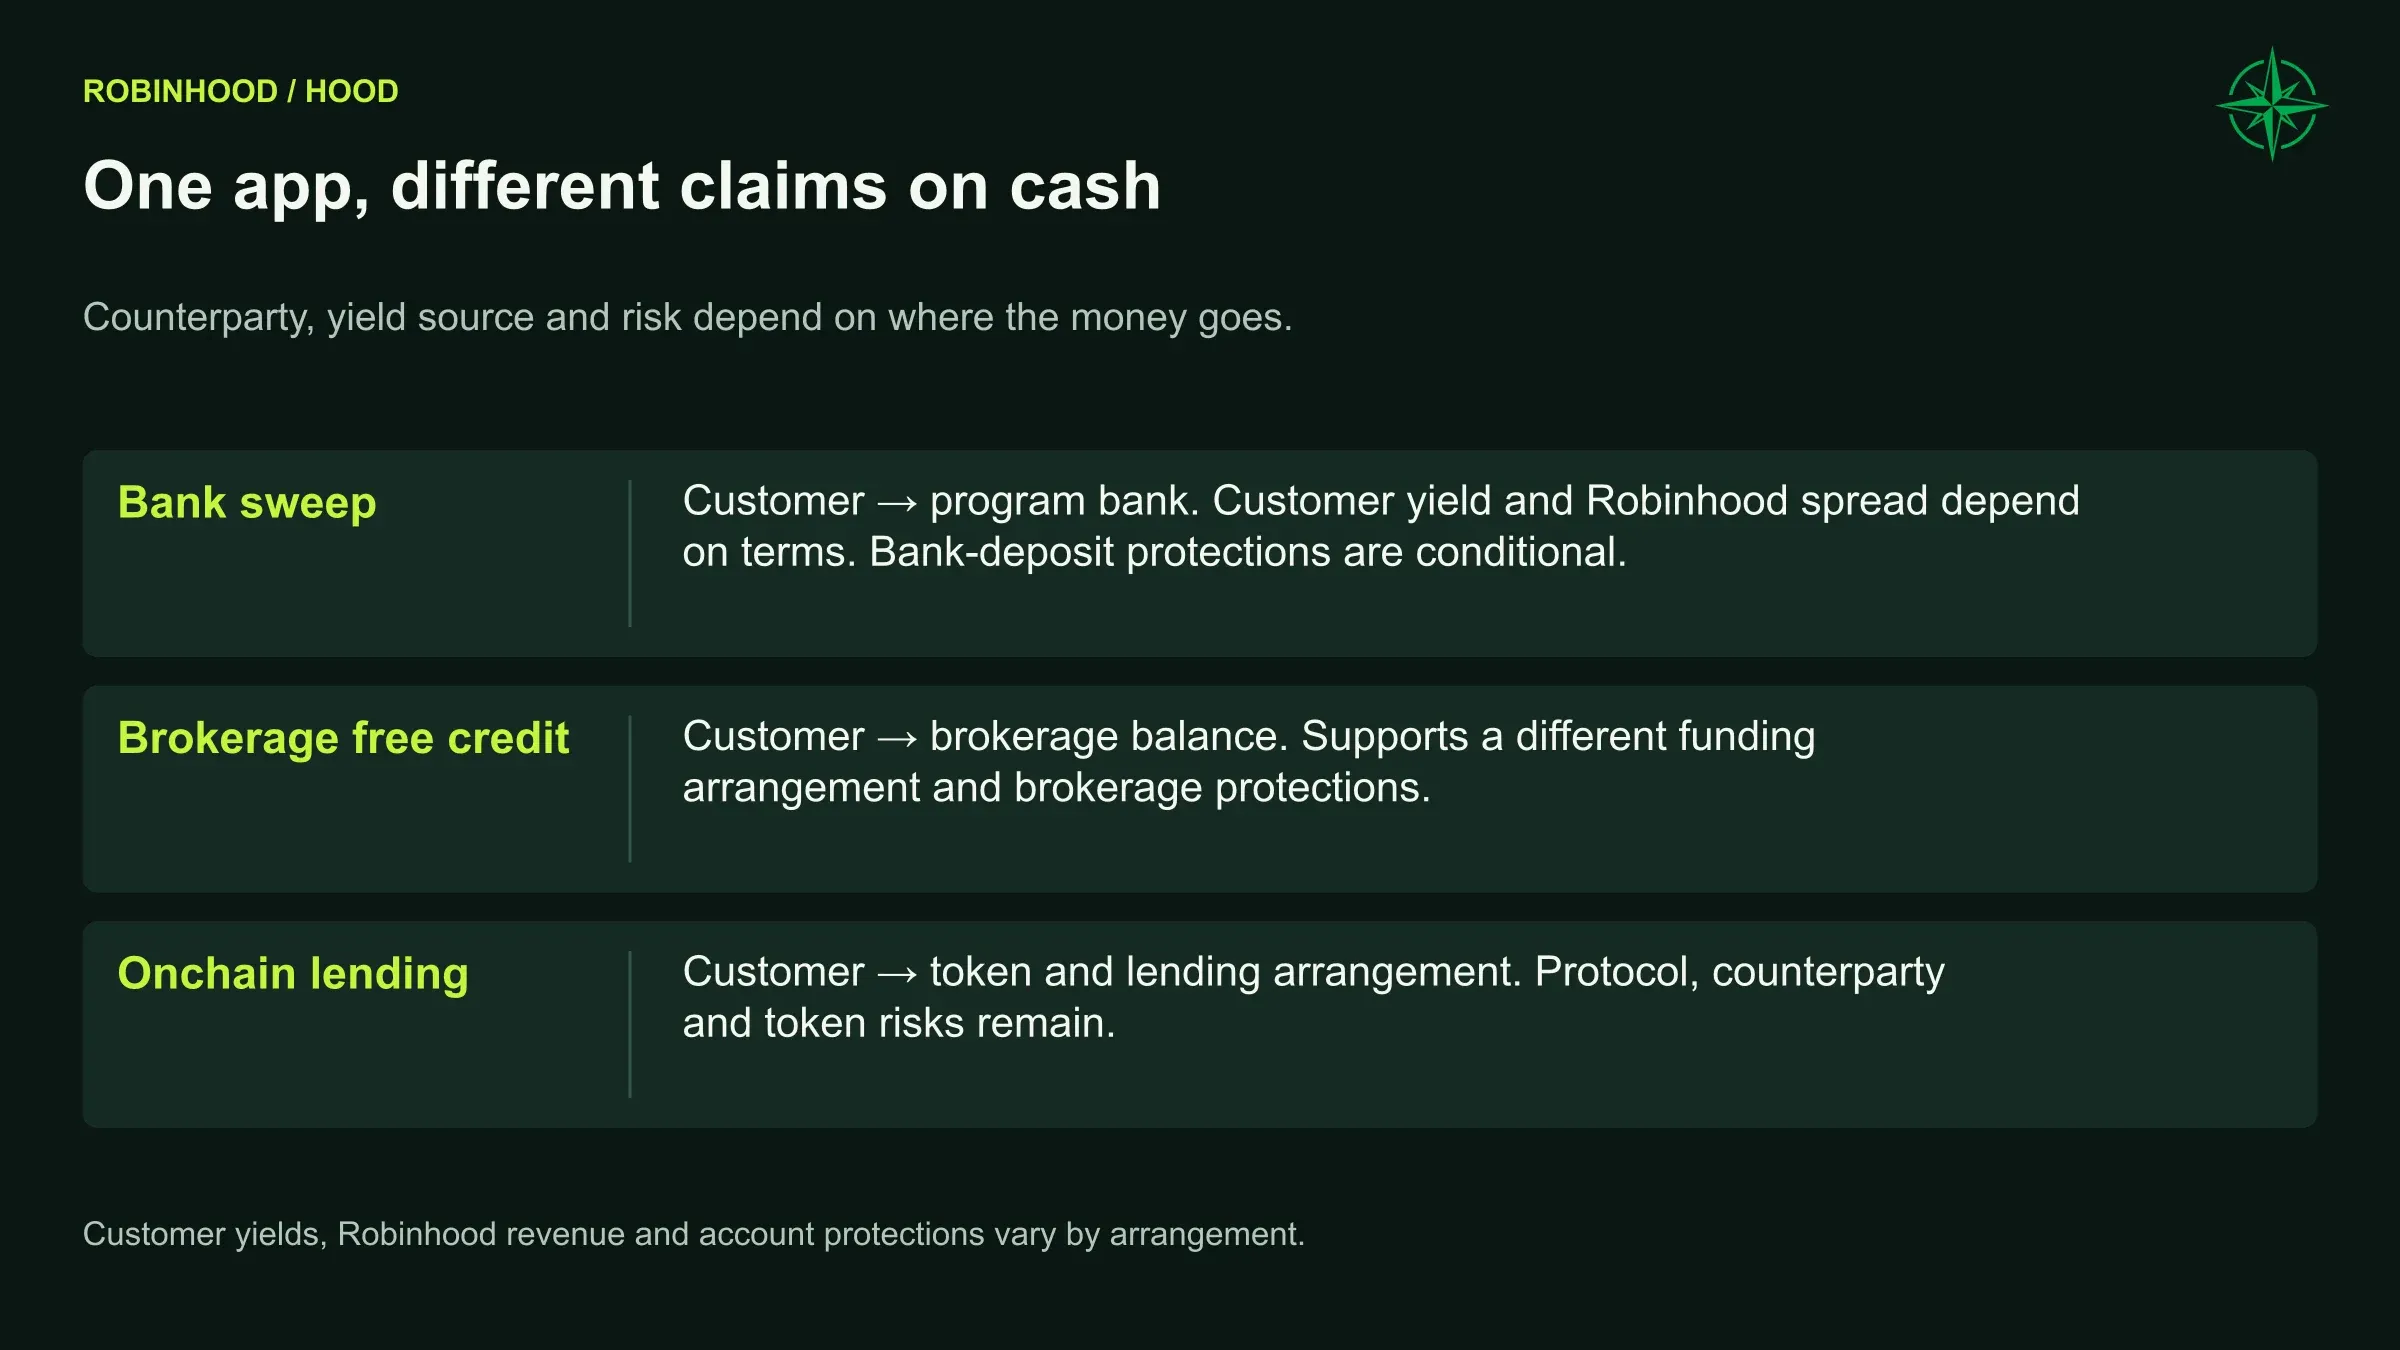
Cash swept to program banks earns Robinhood a net spread between the compensation received and the rate paid to customers. Brokerage free-credit balances follow a different funding arrangement. Onchain lending introduces yet another claim and risk profile. Each arrangement has different protections and risks.
The February movement of more than $6 billion from sweep balances into customer free-credit balances illustrates the point. It helped fund margin growth; the money remained within Robinhood even as sweep balances fell. (August operating data and definitions).
Margin lending has become a substantial business. The book reached $21.6 billion at June and generated $215 million of Q2 interest revenue. In our Base case, we expect it to reach $74.46 billion in 2030, producing approximately $2.63 billion of margin-interest revenue.
A growing asset base creates lending opportunities alongside credit and liquidity risks. Positions can become concentrated, prices can move through expected liquidation levels, and funding obligations remain even when customers are having a difficult week.
The steady assumption places margin at 6% of eligible platform assets by 2030, between 4.7% and 7.5% in the other franchise settings. Children’s assets are excluded. Margin pricing follows an assumed policy rate plus 85 basis points. Sweep uses retained spreads of 55, 60 or 65 basis points before the specified incentive treatment.
Our steady policy-rate assumptions are 4.125% in 2027, 3.75% in 2028 and 3.5% in 2029–2030. Average balances, customer compensation and funding costs then determine the revenue. The company’s June fixed-balance sensitivity of $350 million annually for a 100-basis-point move, excluding sweep, helps us assess rate exposure, but balances and funding costs will also change.
Larger interest-earning balances can support income as yields decline. They also require capital, and a sharp decline in spreads could outweigh the benefit of growth.
The card is attractive. The issuer still has to make money.
The Gold Card’s appeal is easy to understand. By the July release, it had passed one million customers and $17 billion of annualized purchase volume. Rewards redeemed into brokerage also create a practical connection between spending and investing.
We understand the enthusiasm from the customer’s side. From the shareholder’s side, we start with the cost of being generous.
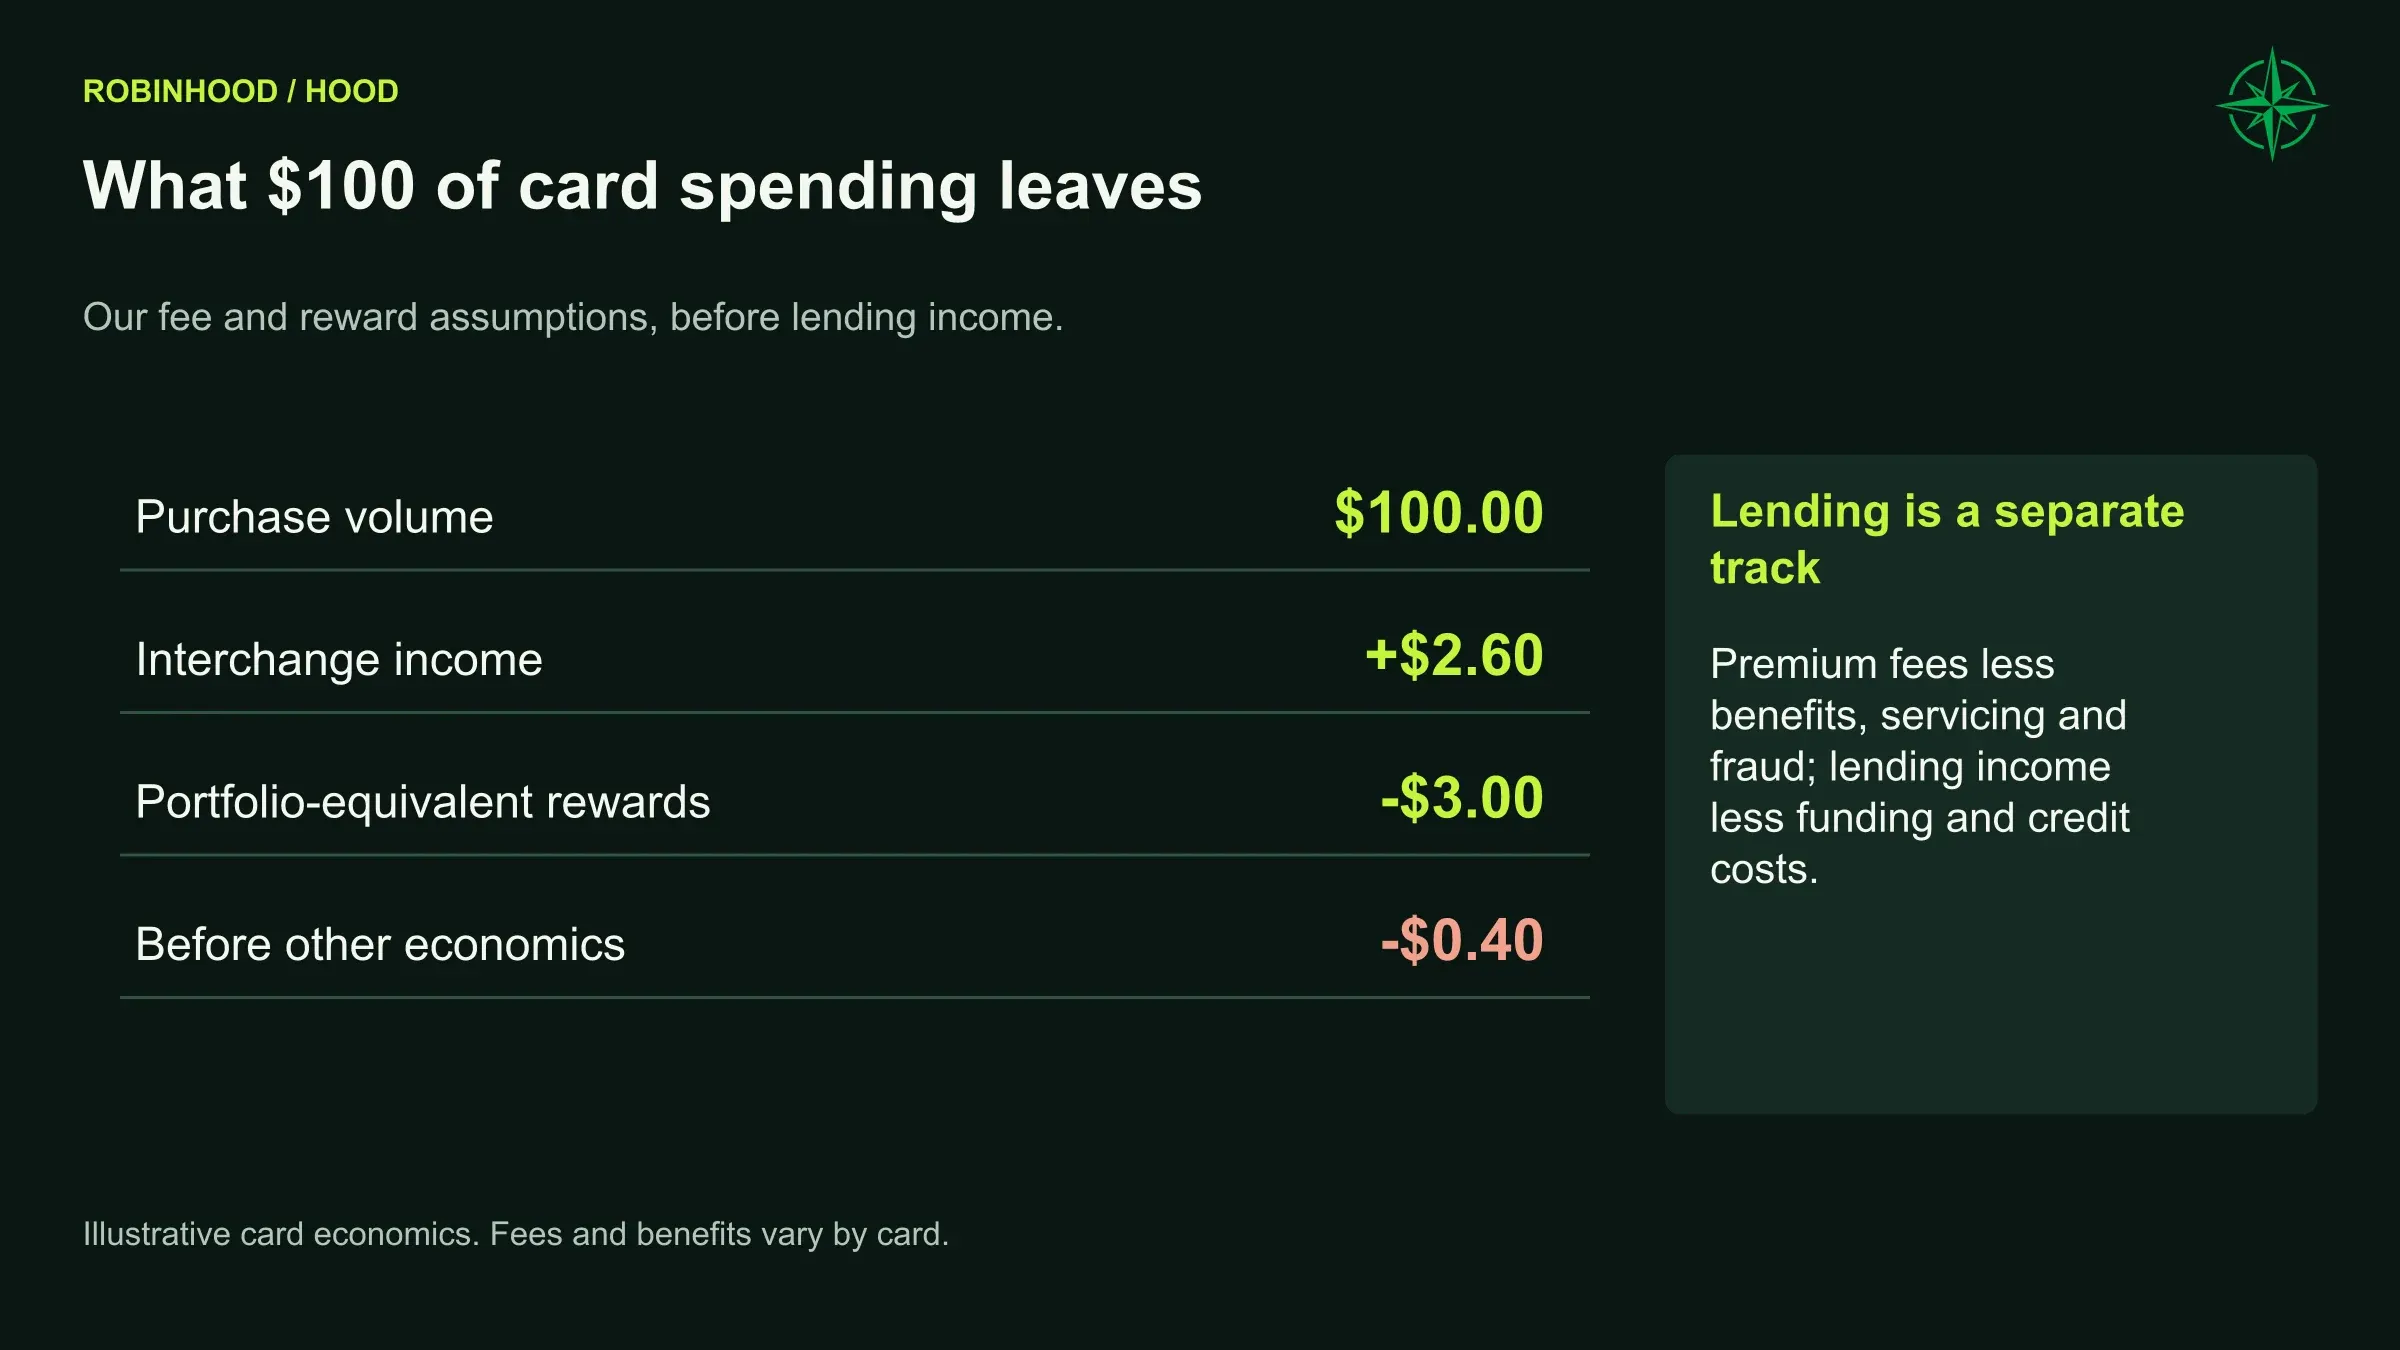
We assume 2.6% interchange and a 3% portfolio-equivalent rewards cost. On an illustrative $100 purchase, that is $2.60 coming in and $3 going back to the customer, before lending income, premium fees, servicing or fraud.
The rest of the economics must close that gap. A large spending number cannot do it on its own.
Premium-card fees help. We use a $695 annual fee and a $350 estimated annual economic cost for benefits, applied to average premium-card counts. That is our estimate of Robinhood’s cost to provide the benefits. Complimentary Gold access is removed from the paying subscriber calculation.
Lending contributes more income and introduces the credit risk. At June, the $1.457 billion portfolio included $87 million past due and $29 million at least 90 days past due. Receivables associated with FICO scores above 690 represented 76%, down from 78% at year-end. Those balances provide a snapshot of credit quality. Changes over time will help us assess how lending standards are holding up as the portfolio grows.
Q2 card-related provisions totaled $51 million. Some provision growth reflects the allowance needed on new loans before losses occur. Provisions recognize expected losses ahead of the eventual cash loss.
Northwise Base card forecast | 2026 | 2027 | 2028 | 2029 | 2030 |
|---|---|---|---|---|---|
Cardholders | 1.41M | 1.83M | 2.41M | 3.20M | 4.26M |
Annual purchase volume | $17.46B | $28.38B | $39.33B | $54.95B | $76.86B |
Card receivables | $2.01B | $2.69B | $3.61B | $4.88B | $6.60B |
Net payment fees after rewards and benefits | $(60)M | $(67)M | $(92)M | $(132)M | $(189)M |
Net card interest | $175M | $283M | $380M | $512M | $692M |
Card provisions | $202M | $235M | $311M | $441M | $597M |
Card funding debt | $1.33B | $1.78B | $2.39B | $3.23B | $4.37B |
Selected card operating and financial estimates.
Normal annual loss-rate assumptions rise from 5.5% in 2027 to 6.5% by 2029. Credit stress adds 3.5 percentage points, with a further adverse-macro increment in 2027. Provisions include both estimated losses and changes in the allowance.
We assume 86% of receivables are held on balance sheet and that debt finances 77% of that gross on-balance amount. A lower advance rate requires more equity even if it reduces borrowing expense. The company’s $1.55 billion of June revolving card commitments and July $500 million asset-backed issuance demonstrate current funding access. Future renewals and additional capacity will depend on lenders and market conditions.
The card could also attract deposits, paid memberships and longer customer relationships. We will look for measurable gains in those areas alongside the card’s own earnings. We count those benefits where they arise, and keep card earnings separate.
The household relationship can start much earlier
Trump Accounts give Robinhood a role at the beginning of the investment lifecycle.
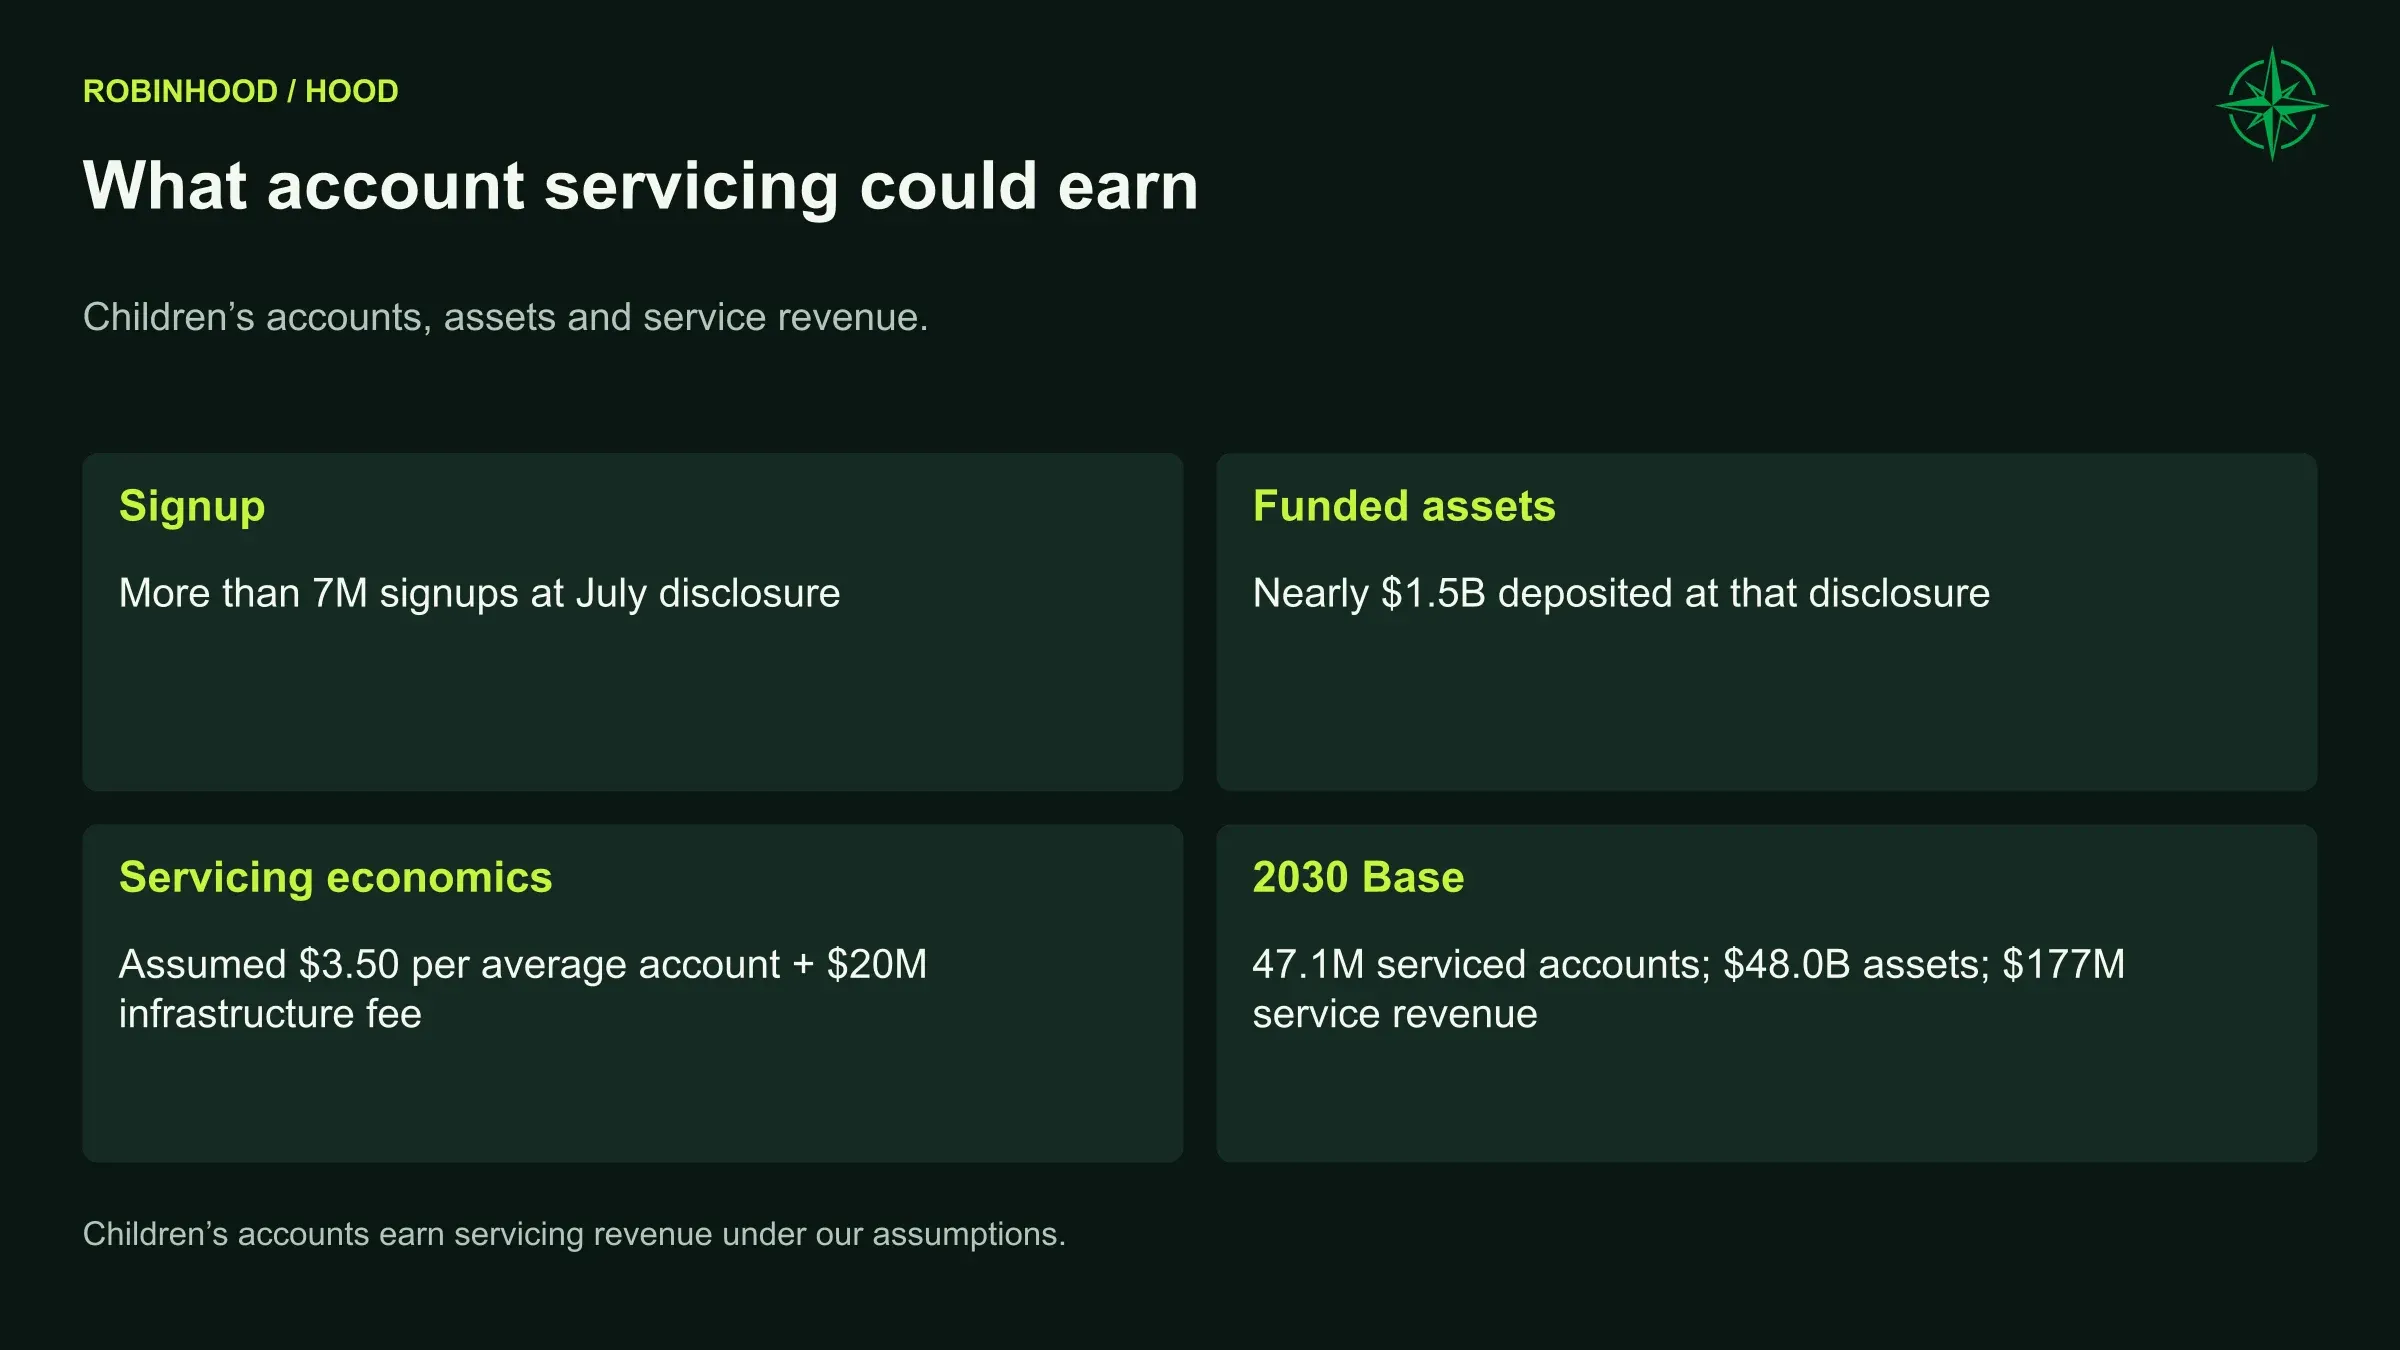
The disclosed arrangement makes Robinhood broker and sole initial trustee, working with BNY to provide technology, the front-end experience, education and customer support. The program launched on July 4 and had more than seven million signups with nearly $1.5 billion deposited by the earnings release.
The agreement gives Robinhood a potentially important relationship with children and their families, with revenue initially coming from account servicing.
We assess serviced accounts, contributions, assets and compensation separately. The central pricing assumption is $3.50 per average serviced account annually plus $20 million of infrastructure compensation, with lower and higher alternatives of $3 and $4. The commercial terms are undisclosed, so those prices remain estimates. Operations expense includes 65% of estimated service revenue.
The Base case reaches approximately 47.1 million serviced accounts, $48.0 billion of assets and $177 million of annual service revenue in 2030. We apply account-servicing economics to these balances.
The longer opportunity is familiarity across the household. Parents, employers and donors may contribute, and the relationship can continue as financial needs evolve. A later adult relationship could be valuable, though the conversion rate remains unknown.
This is a sizeable service contract with a potentially valuable relationship attached. Account servicing alone could make it worthwhile.
Football season has a number to beat
We expect football season to bring a substantial increase in event-contract trading.
Robinhood generated $156 million of Q2 revenue from 13.6 billion reported event contracts, approximately 1.15 cents of consolidated revenue per contract. Contract counts measure trading activity. Revenue depends on the fees earned from those contracts.
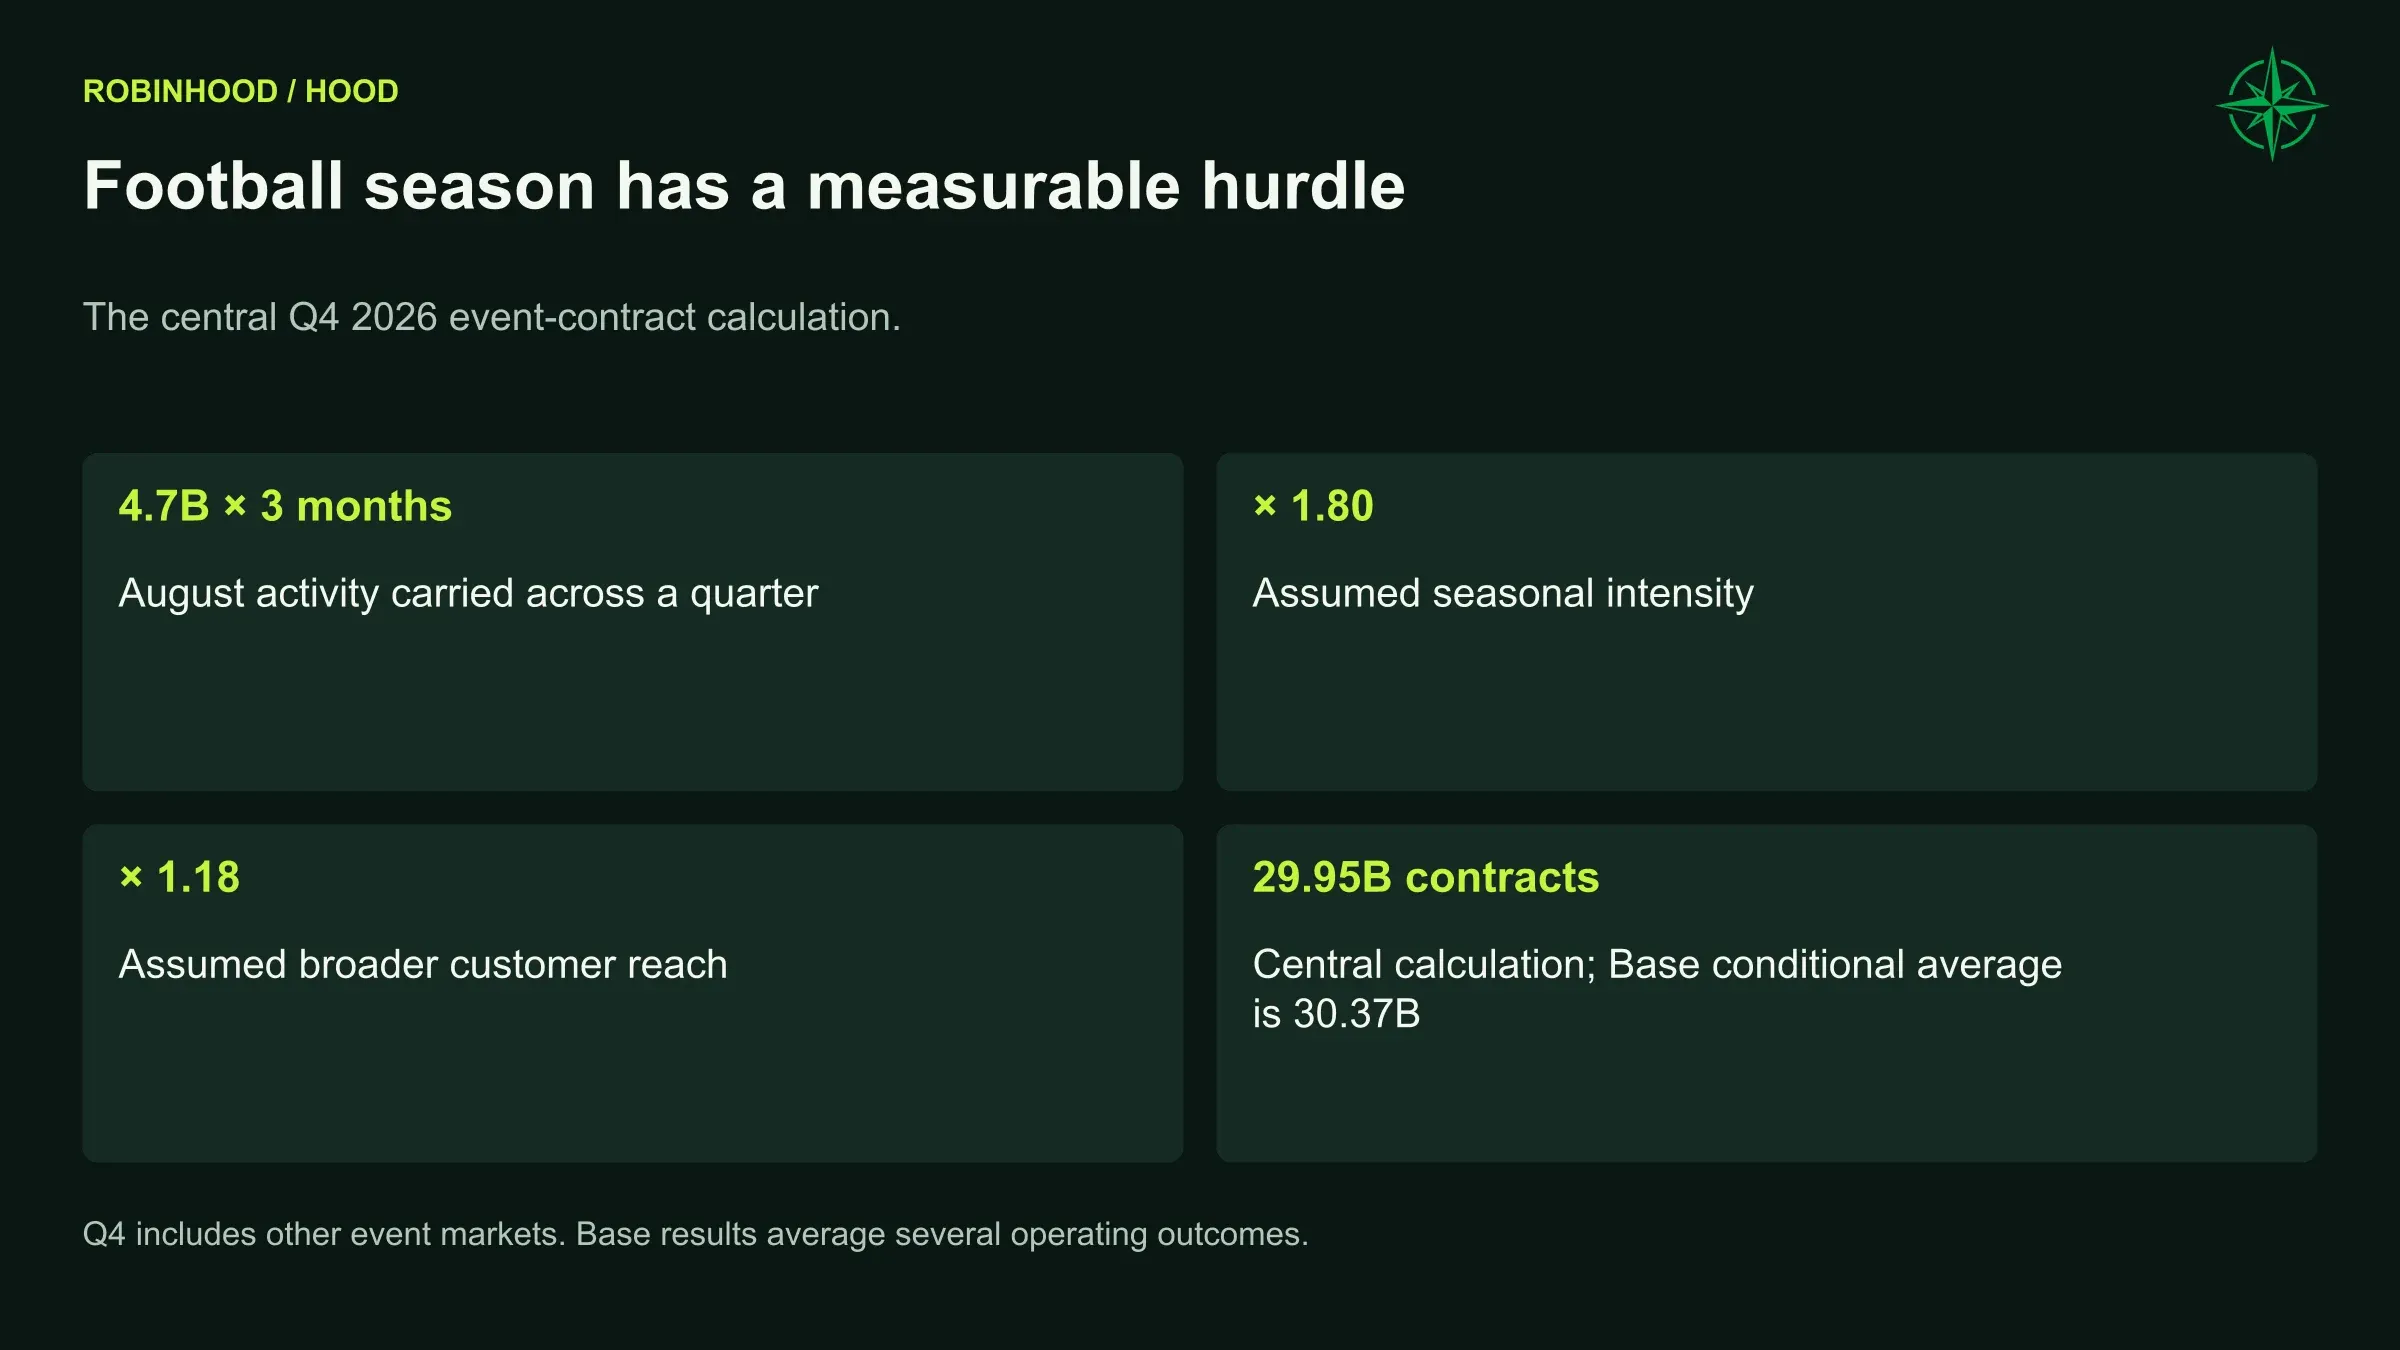
July volume was 6.1 billion contracts and August volume was 4.7 billion. Our central Q4 calculation uses three months at August’s level, multiplied by 1.8 for seasonal intensity and 1.18 for broader customer reach:
4.7 billion × 3 × 1.8 × 1.18 ≈ 29.95 billion contracts
Across the conditional Base paths, the resulting Q4 average is approximately 30.37 billion. The seasonal and reach multipliers reflect our judgment about demand. Q4 also includes non-football markets.
Reaching that level would require a sharp increase from August. Football, election activity and additional markets could bring more customers and trading, though the size of the increase remains uncertain.
By 2030, the Base case reaches approximately 229 billion annual contracts and $2.41 billion of event revenue. That requires adoption extending beyond one successful season. Management has described increasing traction in economics and crypto-related markets, alongside the initial sports demand.
We also include outcomes in which activity contracts. The restricted event setting begins with a 0.72 volume multiplier in 2027 before other adjustments. Restrictions could cause activity to fall.
The exchange interest adds a second opportunity
Rothera can earn from venue activity as well as Robinhood’s distribution. External intermediaries could eventually bring additional business to the exchange, extending the opportunity beyond the retail app.
The exchange could serve institutions directly. Management has explicitly discussed serving additional futures commission merchants, while continuing to connect its own customers to multiple venues.
Ownership limits how much of the resulting profit belongs to HOOD. Rothera acquired 90% of MIAXdx for approximately $79 million, with SIG contributing $41 million toward the price and related expenses. Robinhood’s ownership of the parent joint venture remains an assumption because the purchase contributions alone leave the stake uncertain.
We assume Robinhood owns 45% of the parent joint venture, giving 40.5% effective exposure under that assumption after the exchange’s 90% ownership layer. The 45% figure is an assumption.
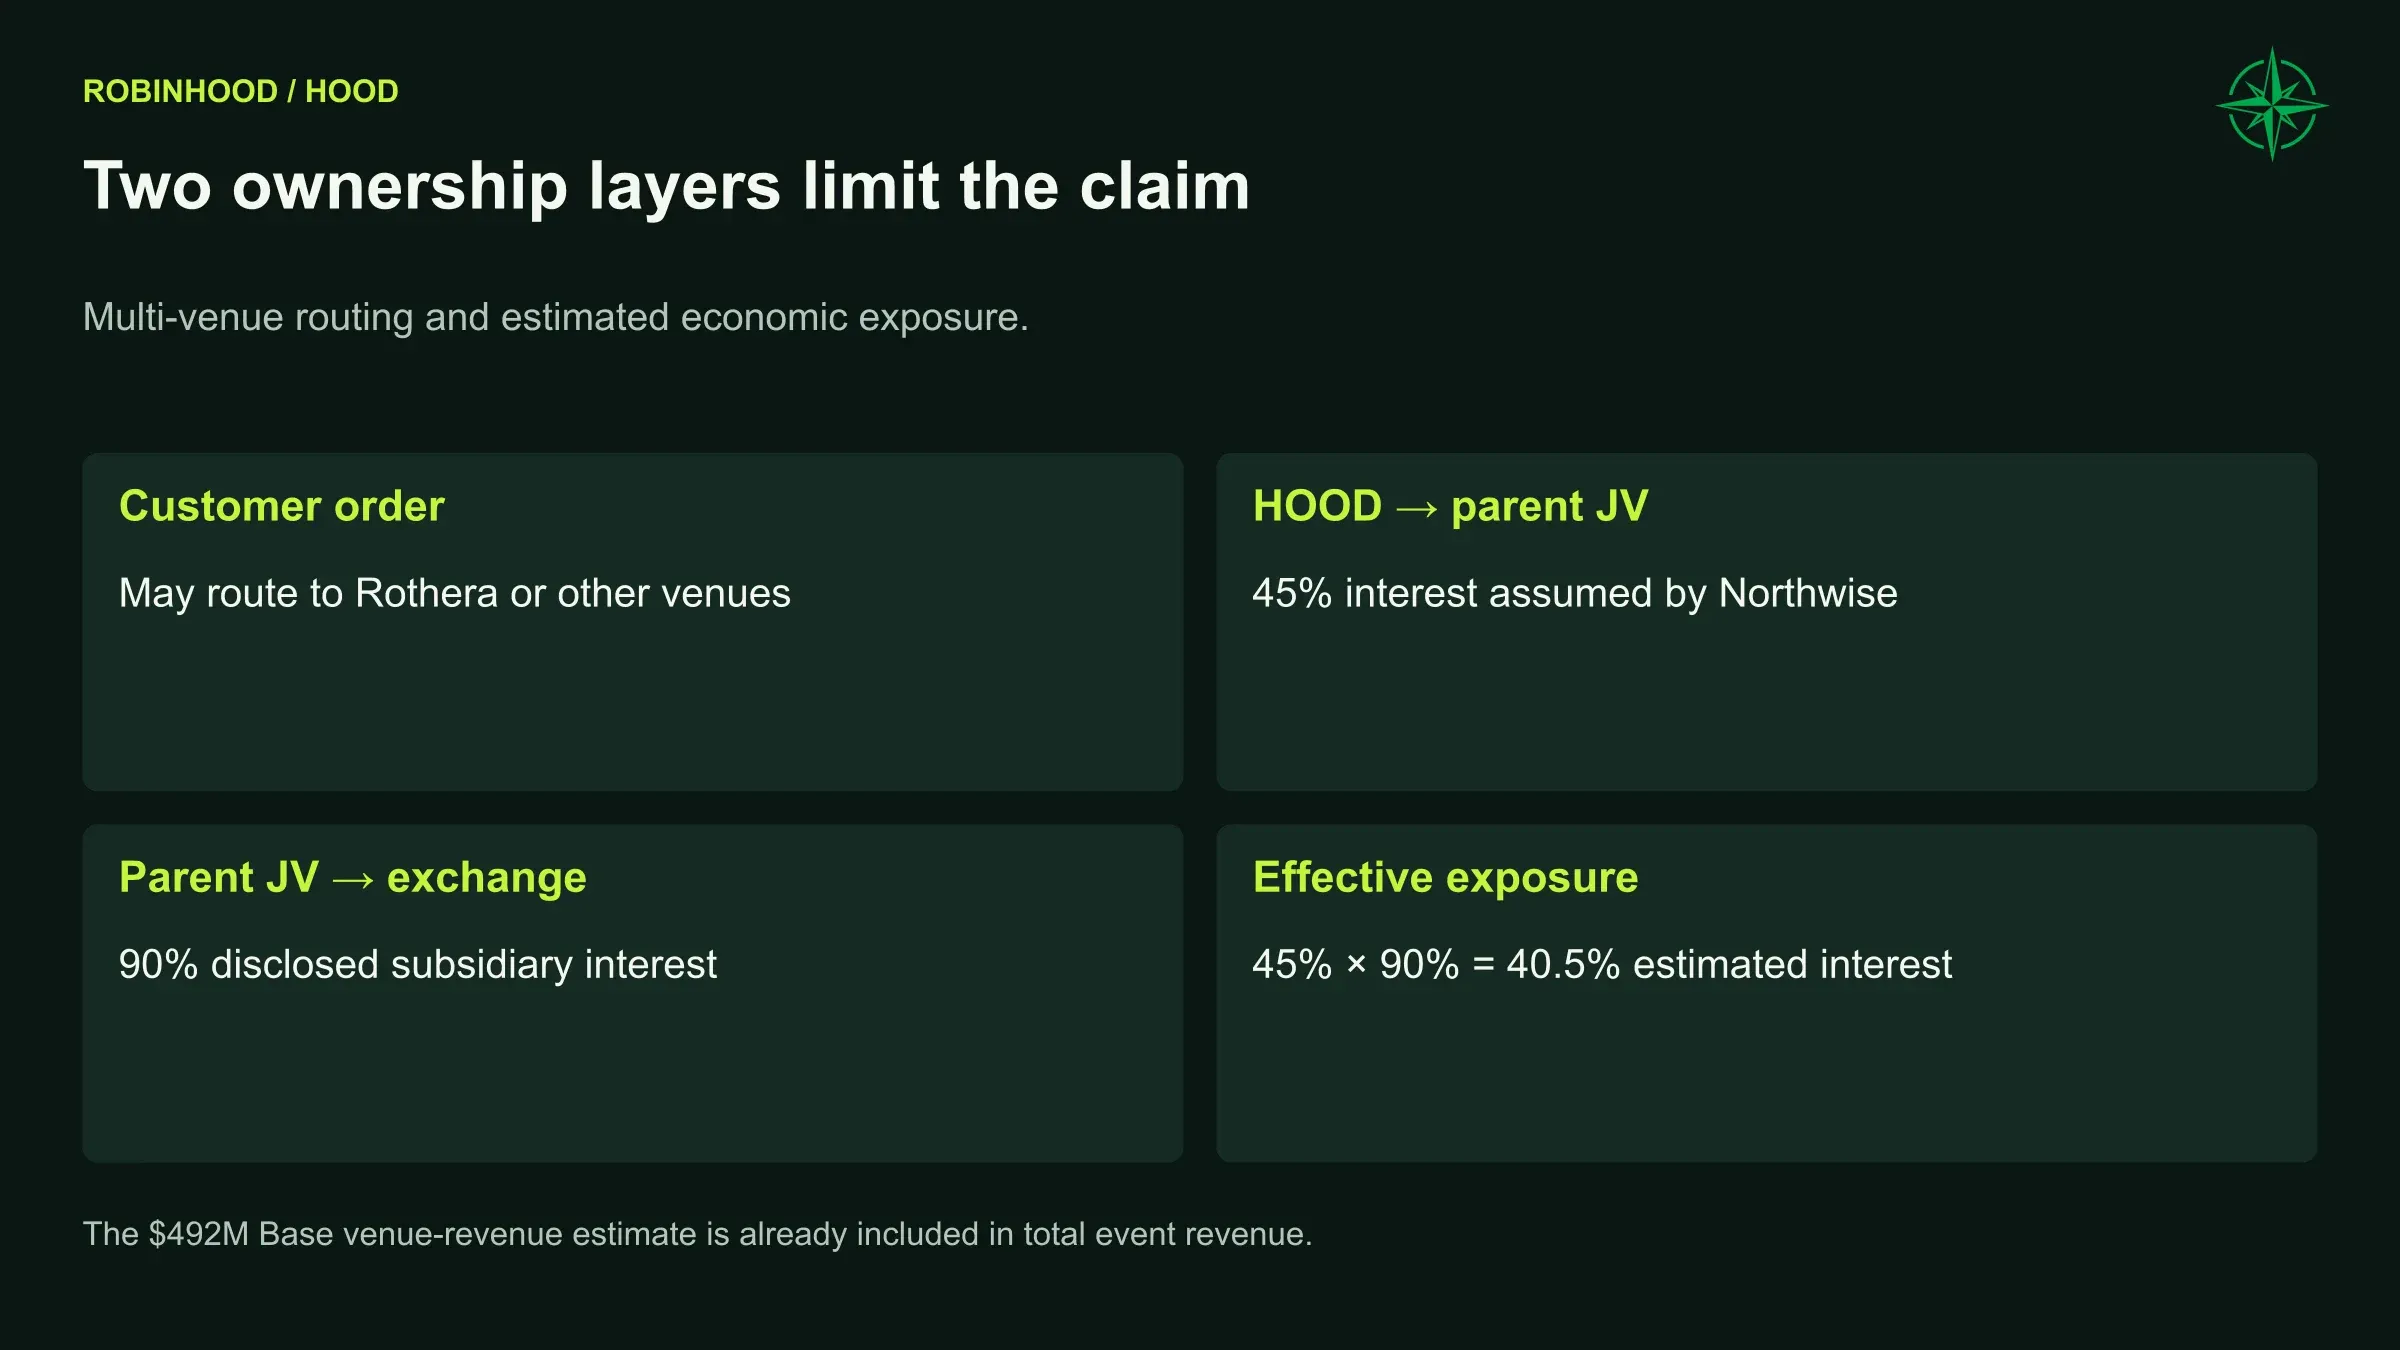
We account separately for broker fees, exchange activity, venue costs and earnings owed to outside owners. In the normal event setting, the routed share moves toward 68% by 2030 and external activity phases toward 10% of Robinhood’s own event-volume base. Base consolidated venue revenue reaches approximately $492 million, already included within total event revenue.
The value to shareholders depends on Robinhood’s ownership and its share of the fees and profit.
Revenue depends on where customers can trade
The regulatory case remains fragmented. The filings describe federal, state, tribal and private litigation affecting event contracts. Product availability will depend on the outcomes of several proceedings.
Taxes can also change the economics without eliminating a market. The Illinois measure described in the filing uses contract value as its tax base, subject to legal challenges. We lack the verified state-volume allocation needed to translate that into a precise company-wide tax forecast.
We allow for restrictions, pricing changes and compliance costs, and separately test a complete event-business shutdown from 2027. These proceedings could materially affect where customers can trade and what Robinhood earns.
Chain needs lasting activity to earn lasting revenue
We see Robinhood’s distribution as the strongest argument for Chain.
The company can bring customers, wallet access and recognizable financial products to a network that would otherwise have to build those relationships individually. Independent developers can then create applications around the assets and infrastructure.
That is also why the change between Robinhood’s earlier and newer stock tokens is useful evidence. The earlier product stayed within the app. The later tokens could move into compatible applications and trading pools. Management attributed stronger adoption to that expanded usefulness. Broader use gives customers a stronger reason to hold and trade the tokens.
A developer may be able to build around an existing token instead of recreating the asset-access relationship. Robinhood may earn through infrastructure even when that developer serves the end customer. That offers a route to growth beyond adding another feature to the retail interface.
Independent applications earn their own fees, separate from Robinhood’s network revenue. Trading volume, transaction count, application fees, sequencer fees and company revenue measure different things.
The sequencer orders transactions on the network. We start with the fees generated by that activity, deduct network and data costs, and account for the share owed to partners. Robinhood’s revenue depends on the fees it retains.
Average daily gross Chain-fee assumption | Weak adoption | Sustained adoption | Breakout adoption |
|---|---|---|---|
2027 | $0.15M | $0.90M | $3.50M |
2028 | $0.15M | $1.40M | $6.00M |
2029 | $0.20M | $2.00M | $9.50M |
2030 | $0.25M | $2.70M | $14.00M |
Adoption assumptions before economic and franchise adjustments.
We deduct a 10% network/data-cost allowance, then apply the cumulative sharing convention: 50% retention on the first $50 million of the pre-partner pool, 70% on the next $100 million and 85% above $150 million. The precise contractual threshold basis remains unclear. We assume the thresholds apply after the cost allowance. (Disclosed Chain sharing schedule).
Higher retention applies only to revenue above each threshold. Costs continue even when fees decline.
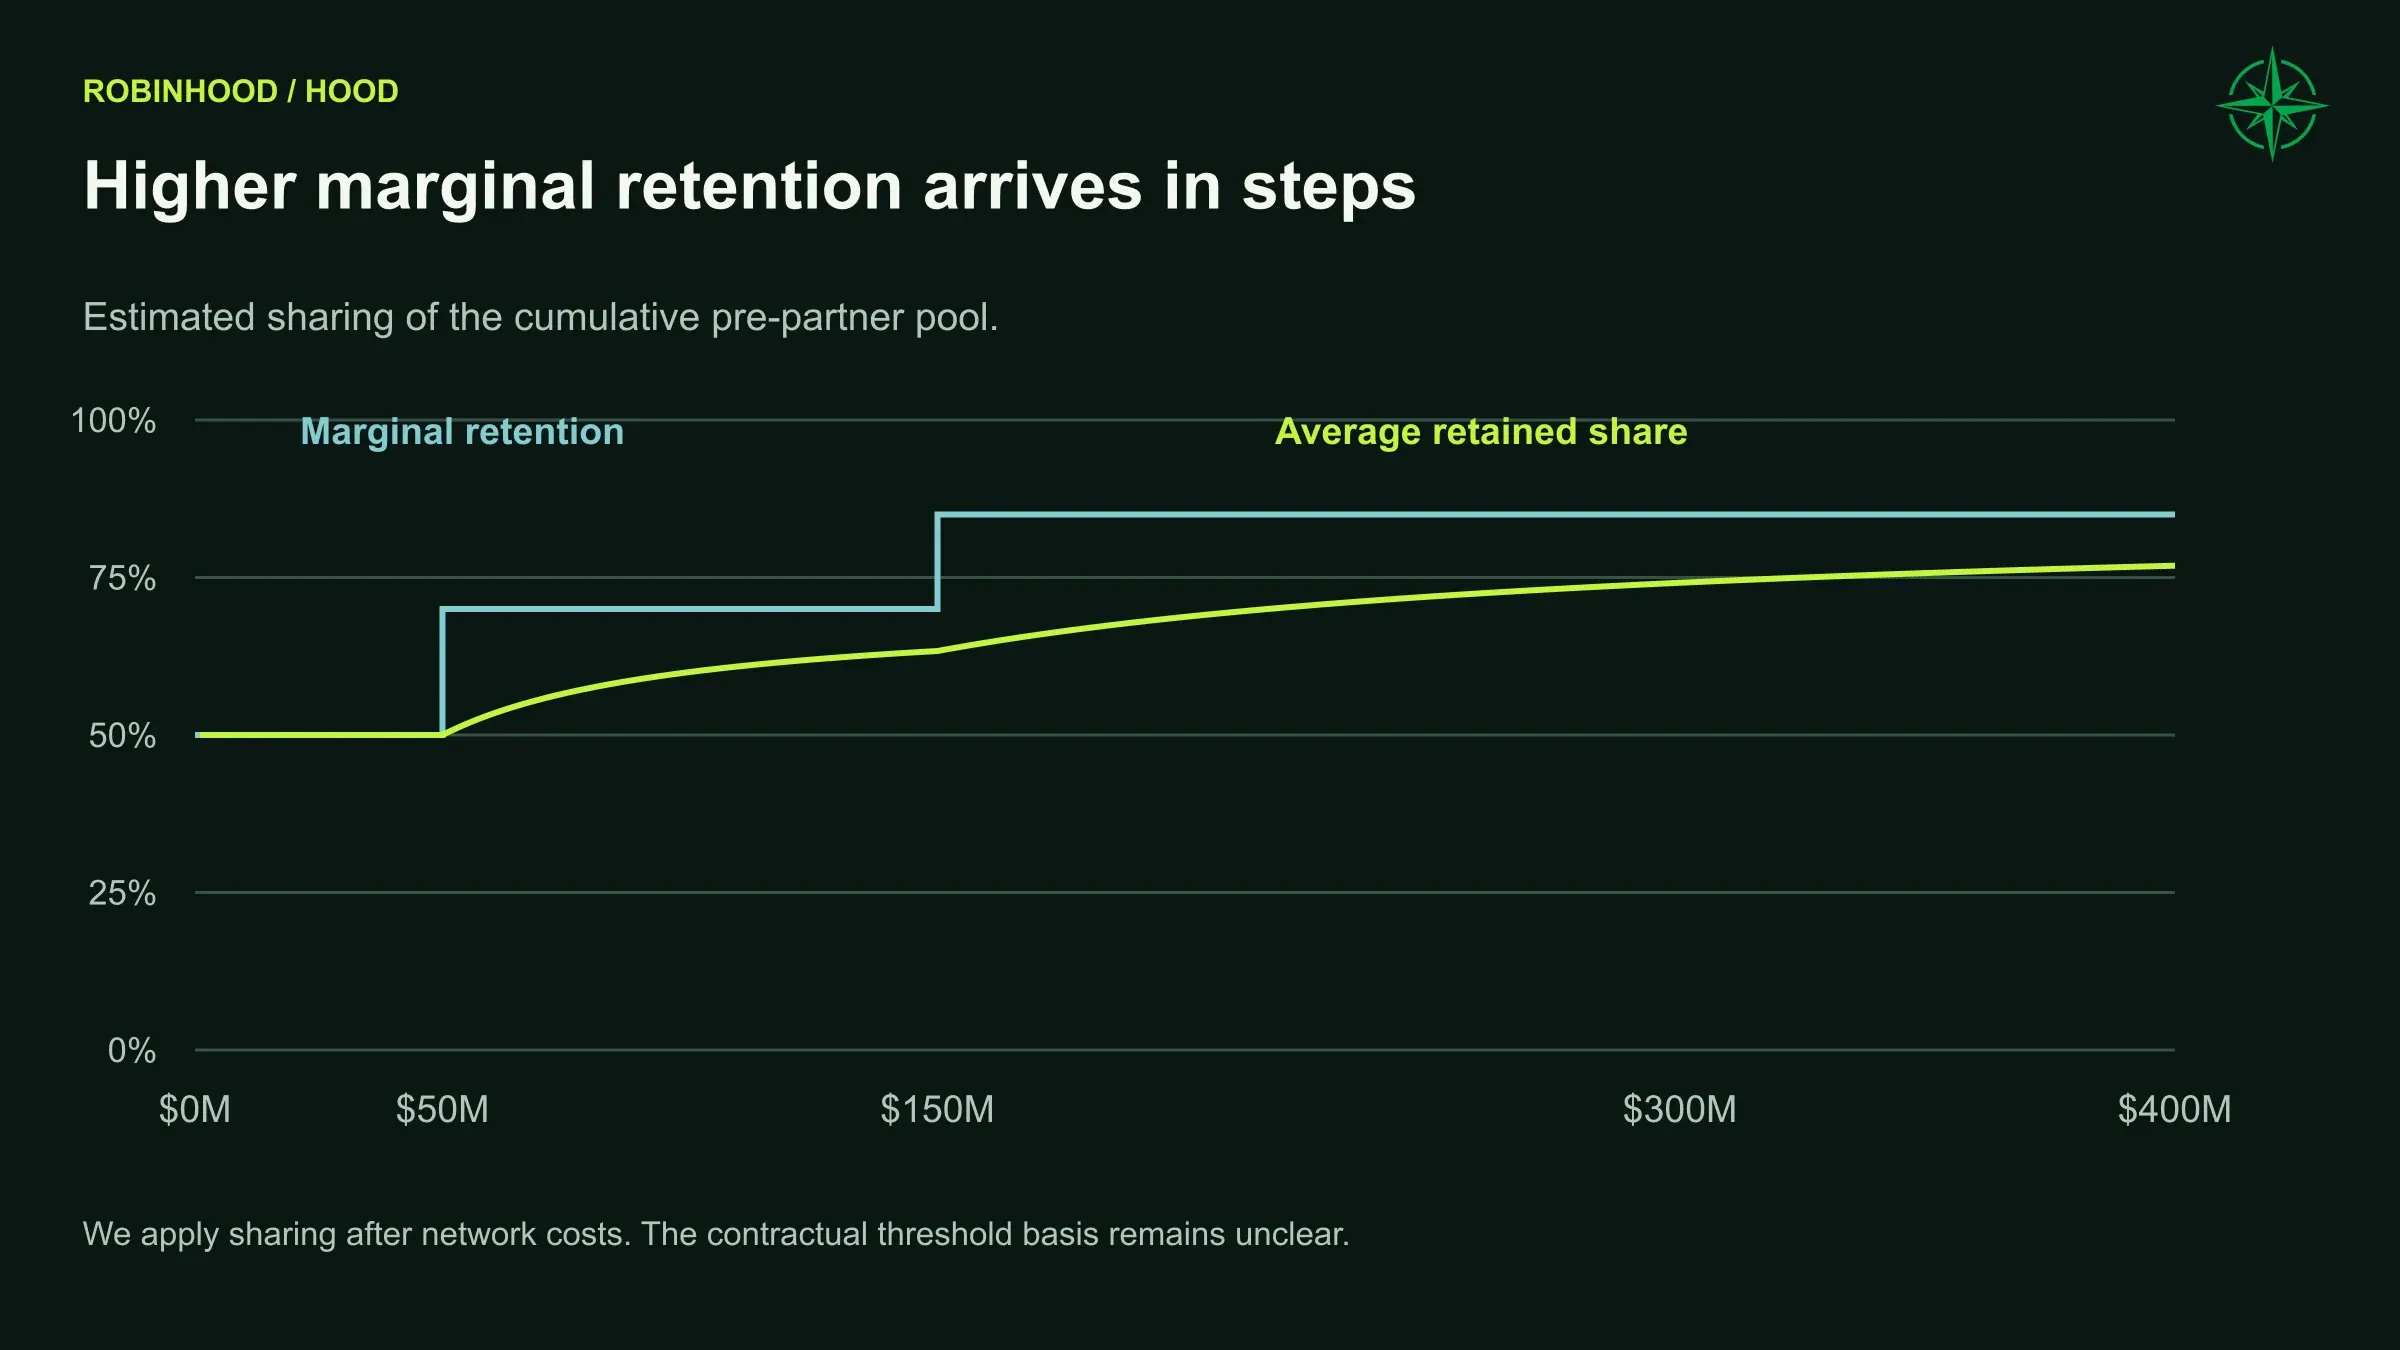
The Base case produces approximately $1.48 billion of gross Chain fees in 2030, a $1.33 billion pre-partner pool and $1.13 billion of retained sequencer revenue. Token-distribution and Earn economics contribute approximately $120 million separately.
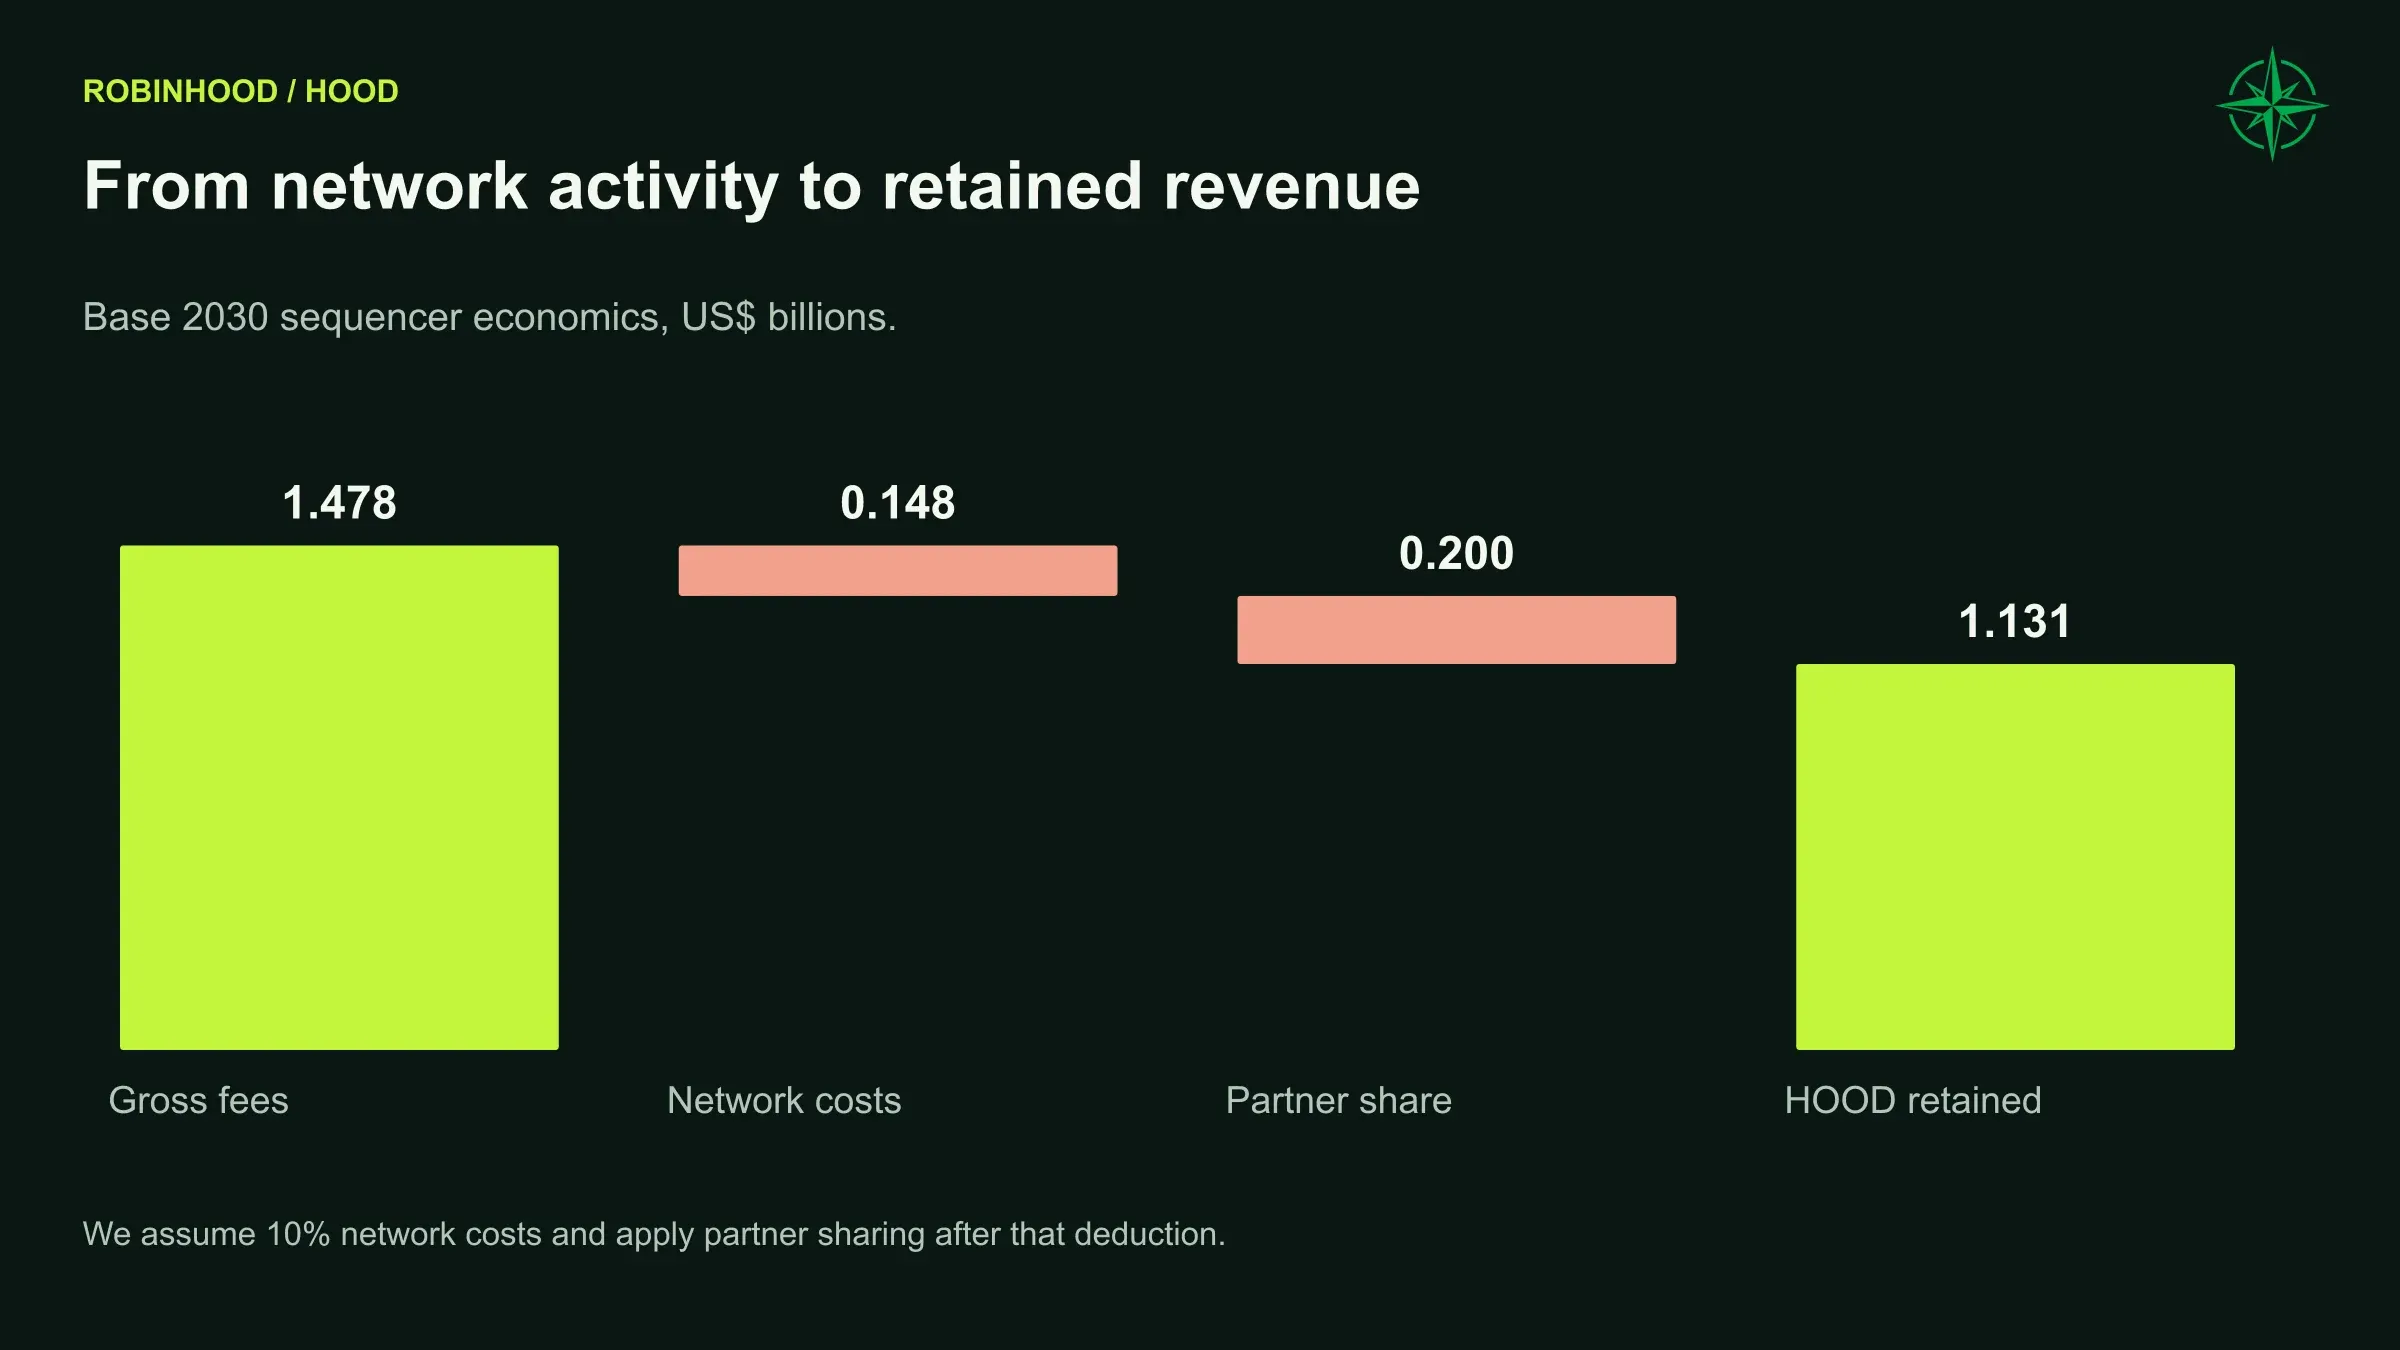
Management’s report of a peak day near $6 million in gross revenue demonstrates that activity can become substantial. Sustaining that level would require persistent demand. Management declined to annualize the peak day.
We see potential for a valuable network business if activity persists beyond launch periods and market surges.
The stronger evidence will be repeat usage, persistent liquidity and clearer reporting of retained fees. A network can remain busy while its owners earn less than expected if pricing falls, infrastructure costs rise or the most attractive revenue belongs to independent applications. Our activity and pricing stresses treat those as separate possibilities.
Tokenization still needs the right legal structure
The holder’s legal rights depend on the instrument’s structure.
Robinhood’s disclosed Jersey Stock Tokens are tokenized debt securities providing economic exposure to underlying shares. Holders have a debt claim providing price exposure, with legal and beneficial ownership of the shares remaining elsewhere.
The September 17 SEC Innovation Exemption included in this research provides a conditional five-year development path for qualifying tokenized-stock venues and liquidity providers. The conditions include equivalent underlying rights, issuer notice and objection processes, permissioned access, and symbol or volume limits. Robinhood would need to establish that its U.S. offering meets those conditions. (SEC exemption announcement).
Robinhood still needs to put the U.S. business into operation before it can earn revenue. There is no incremental U.S. tokenization revenue in 2026. The successful branch begins in 2027; the delayed branch has no volume in 2027–2028 and only a fraction of the successful branch thereafter.
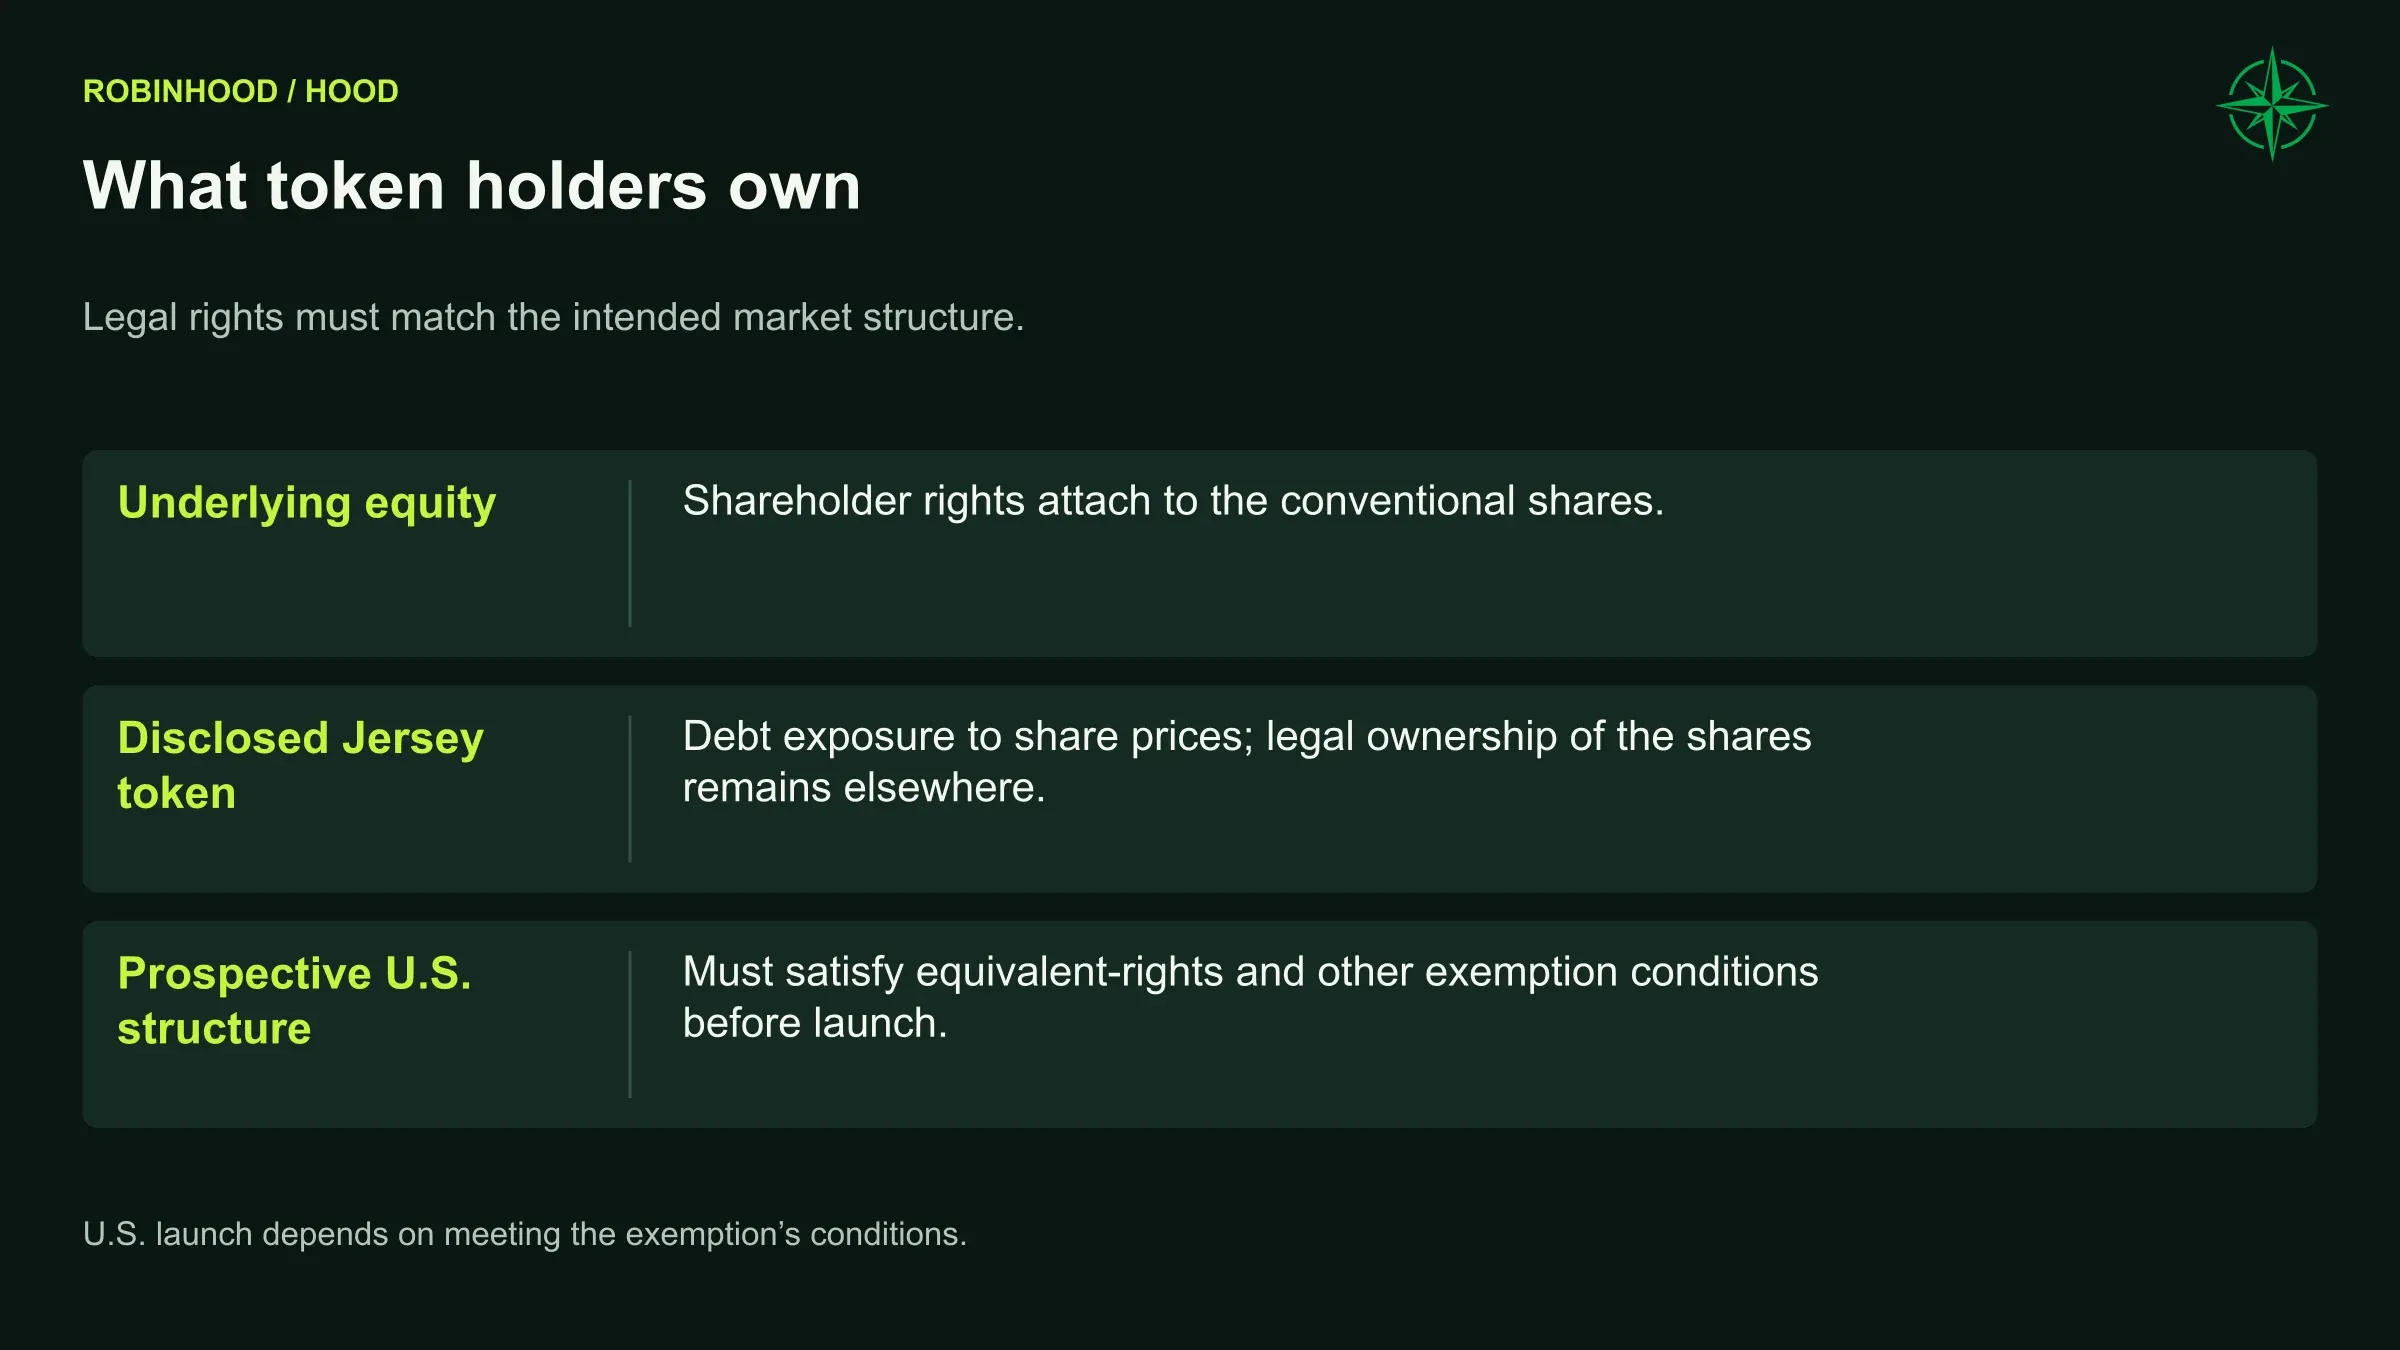
Across the Base category, the result is approximately $5 million in 2027, $22 million in 2028, $63 million in 2029 and $137 million in 2030. The assumed retained fee is 1.5 basis points after allowing for cannibalization. Some token trading could replace existing brokerage activity, reducing the incremental revenue.
We see a worthwhile opportunity here, but we expect it to contribute relatively little to earnings over the next five years. Legal structure and implementation remain important steps before revenue can grow.
International expansion requires similar care. Selected tokens are available across more than 120 countries. Brokerage and banking availability varies by market. Singapore’s July license was a step toward local brokerage services. Canada followed an acquisition-led route through WonderFi, bought for approximately $178 million.
Local tax wrappers, service, permissions and product completeness still matter. Shared technology can reduce development work, while local rules and customer needs shape each offering. We include international progress through customer growth, trading and infrastructure adoption; the available disclosures leave the eventual overseas revenue share uncertain.
Ventures is becoming a repeat business
RVI and RVII are the beginnings of a broader fund-management business.
The filing anticipates additional advised vehicles and further seed commitments. Management has also described a broader ambition to offer private-company exposure across the company lifecycle. Continued fund development belongs in our central operating assumptions.
The appeal is clear. Robinhood already reaches investors who may want private-market exposure but cannot easily build a portfolio of private companies themselves. It can distribute a managed vehicle through a familiar investing relationship.
The difficult part is turning distribution into a durable manager. Fundraising, investment results, fees, liquidity and investor expectations all have to work. A successful initial offering is the beginning of that record.
We separate the fund, the management company and Robinhood’s own investment. Capital raised by a fund belongs to its investors. Management fees belong to the manager. Sponsor gains and losses belong to Robinhood to the extent of its own holding.
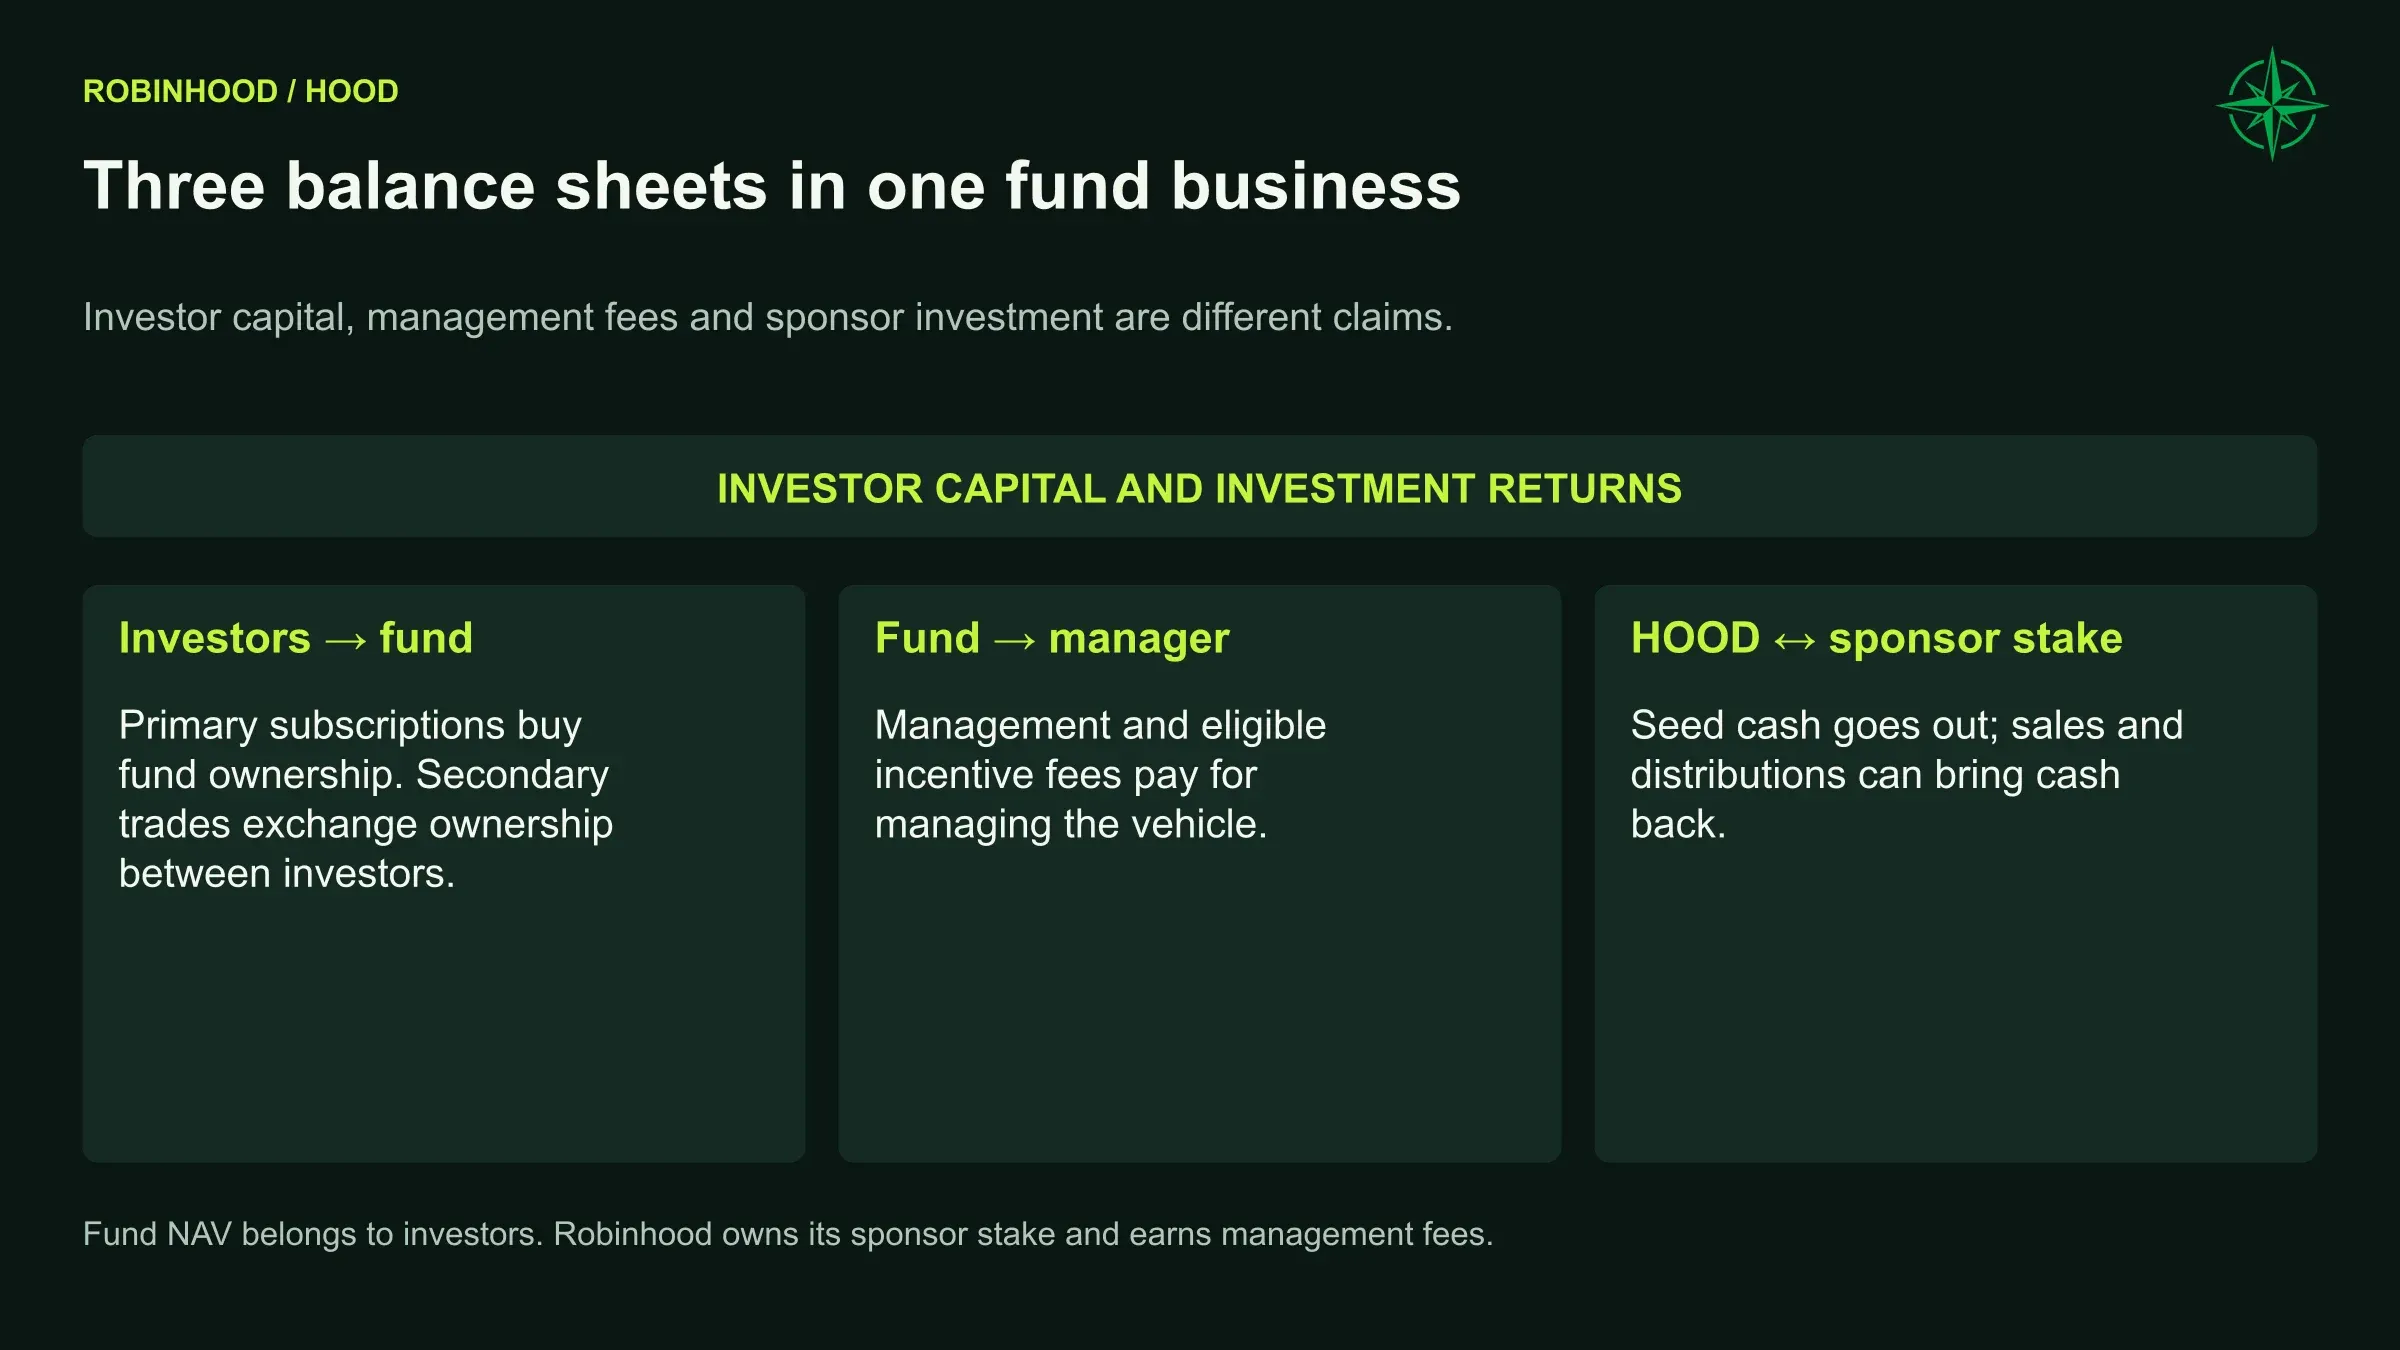
RVI’s June deconsolidation illustrates the distinction. Robinhood lost control, removed the fund’s full assets and liabilities from its accounts, and retained the advisory relationship plus an investment valued at $437 million at June 30. The $106 million deconsolidation gain largely reflected the remeasurement of its retained stake.
RVI charges a 2% annual management fee on the stated net-asset base, with an initial six-month reduction to 1%, and no RVII-style incentive fee. RVII combines a 2% management fee with a 20% capital-gains incentive fee after the required deductions for realized losses, unrealized depreciation and previous payments. Its March fiscal year-end matters for cash crystallization. (RVI fee disclosure).
Our central realization schedule first produces an RVII cash incentive payment in Q1 2030. The timing depends on our assumptions about investment realizations. A portfolio can appreciate for years without generating an equivalent cash incentive fee.
RVII’s announced $200 million primary offering and $225.5 million gross initial fund size also represent different measures. Those amounts belong to the fund’s capital raising; Robinhood earns management and eligible incentive fees. We retain explicit assumptions for offer costs, sponsor capital and post-IPO consolidation where the disclosed parent accounting is incomplete. (RVII IPO announcement).
The fund family through 2030
The steady franchise path adds one fund in each year from 2027 through 2030, with initial gross sizes of $400 million, $600 million, $800 million and $1 billion. Together with RVI and RVII, that creates six vehicles. Weaker execution produces fewer and smaller launches; stronger execution supports more.
For future vehicles, we assume a 1.75% management fee, a 20% incentive fee and 10% sponsor seed capital. Those are estimates for unannounced funds. Follow-on primary issuance can expand existing funds as well.
Northwise Base fund-family forecast | 2027 | 2028 | 2029 | 2030 |
|---|---|---|---|---|
Ending net asset value | $1.69B | $2.96B | $5.07B | $7.86B |
Management fees | $27.5M | $47.9M | $82.0M | $130.0M |
Cash-crystallized incentive fees | 0 | 0 | 0 | $8.3M |
Management-company costs | $25.0M | $29.4M | $36.8M | $46.1M |
Management-company pretax profit | $2.6M | $18.4M | $45.1M | $92.1M |
New sponsor seed capital | $52.7M | $63.8M | $105.4M | $105.8M |
Ending Robinhood-owned fund holdings | $519.7M | $600.5M | $707.3M | $809.7M |
Conditional Base averages across different launch, fundraising and investment outcomes.
By 2030, fund fees could become a useful additional source of profit as the manager builds its record.
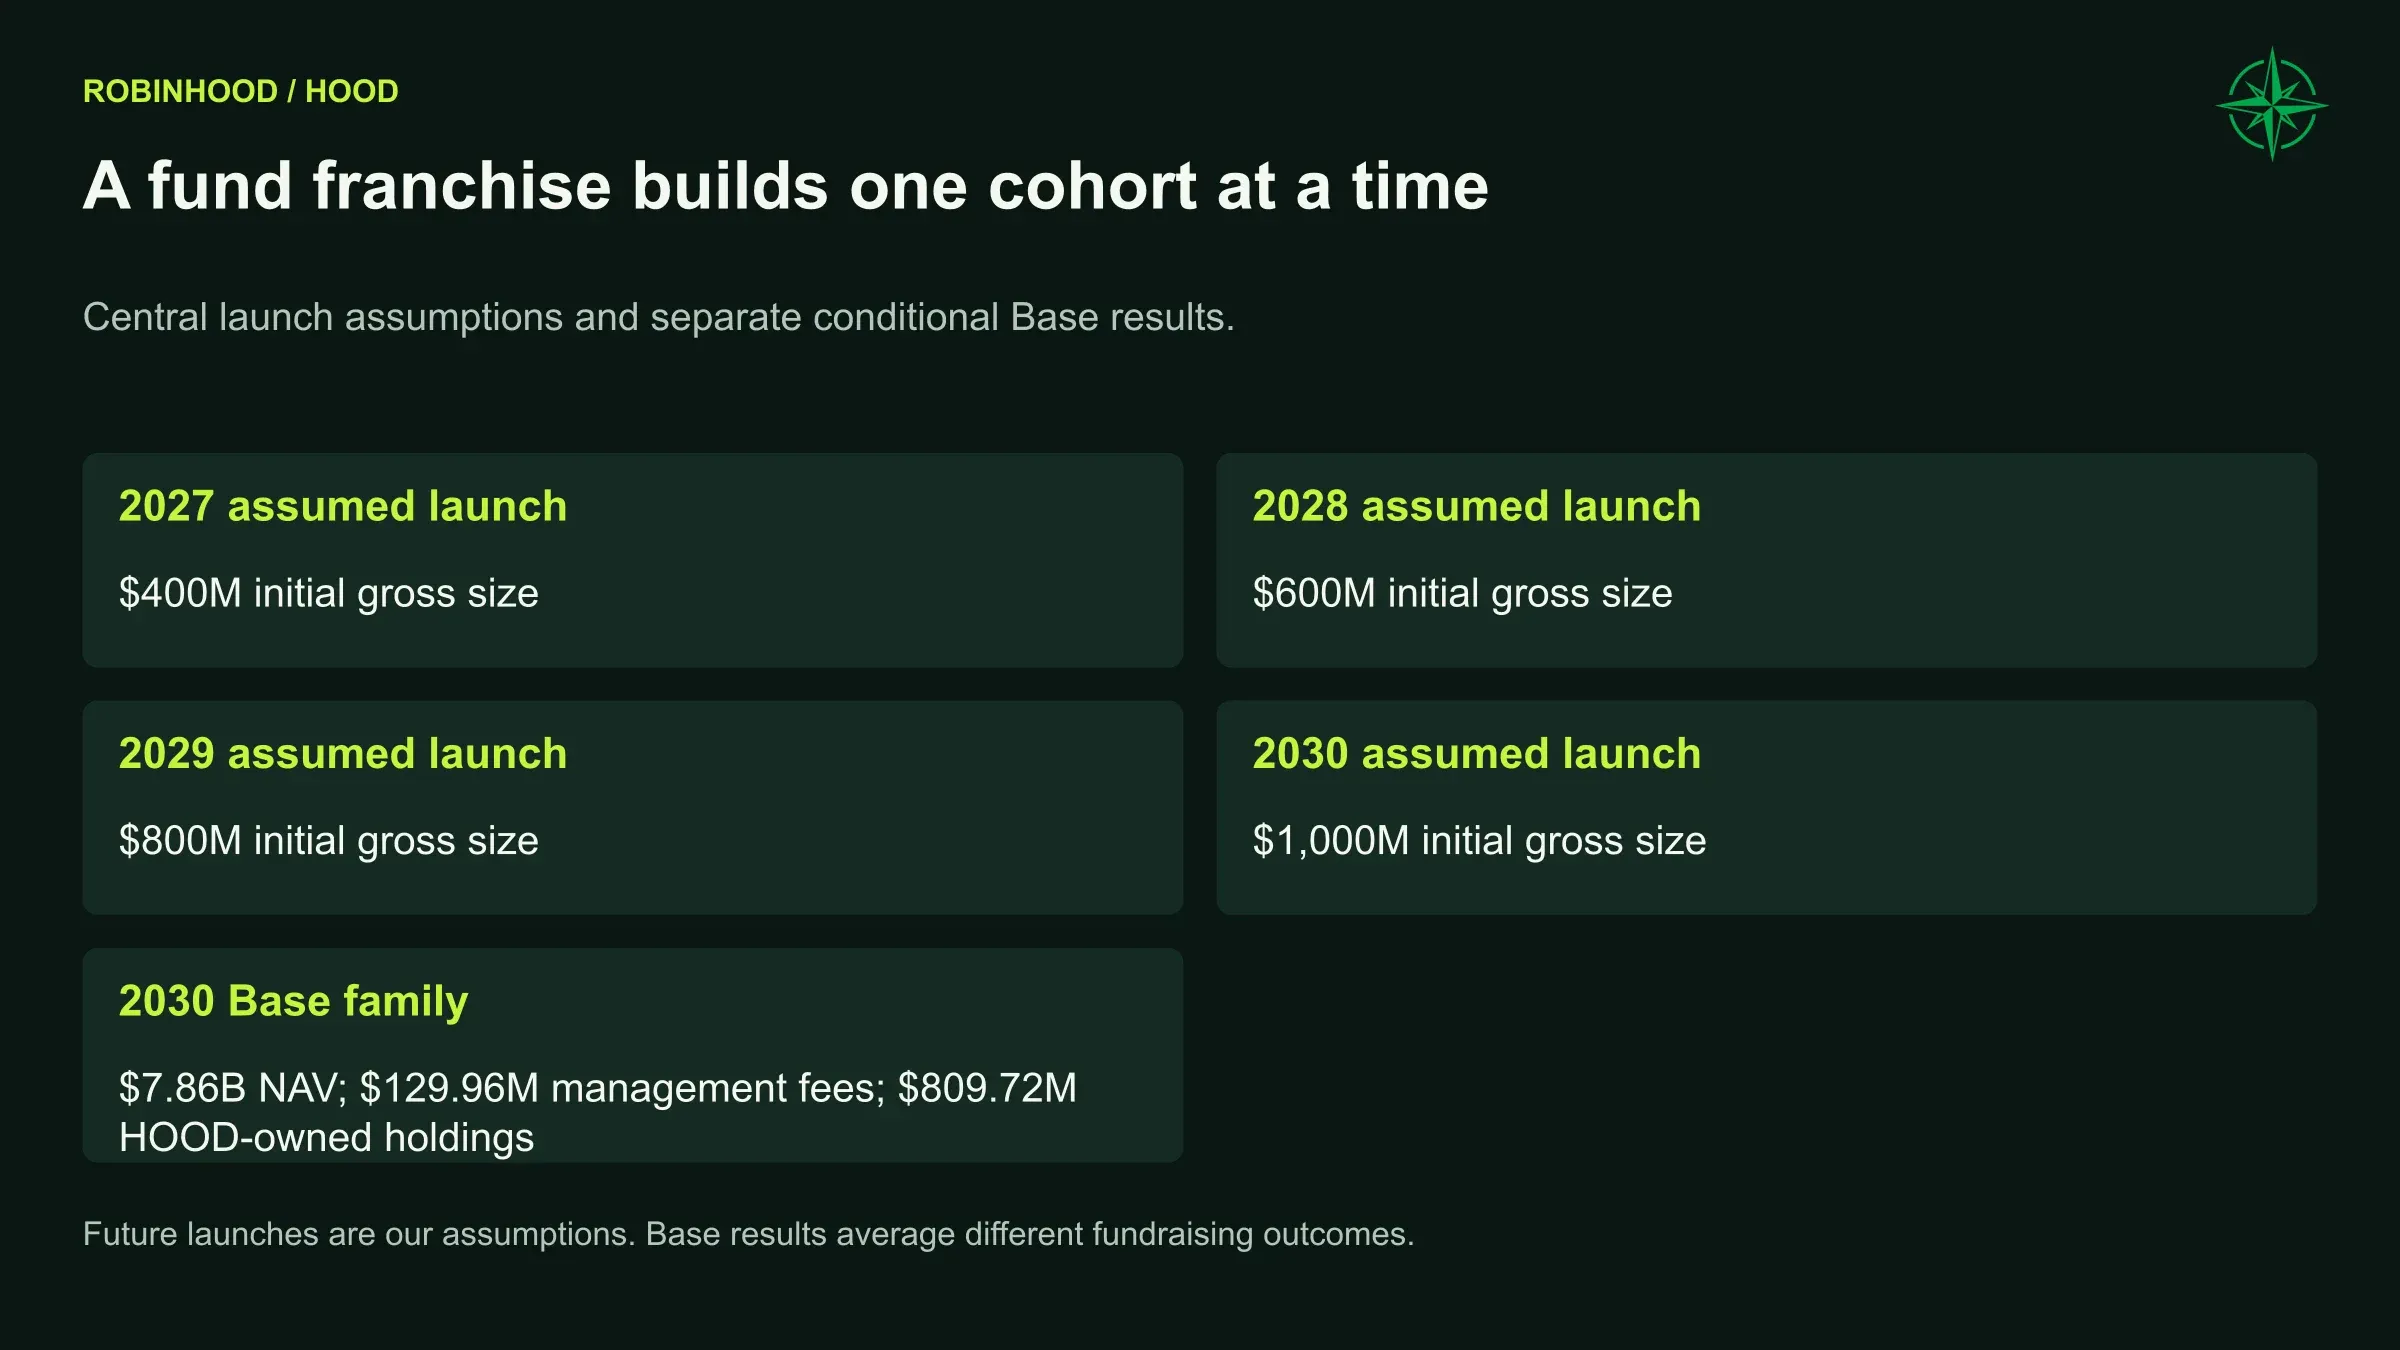
There is room for a more substantial outcome after 2030 if performance and fundraising reinforce each other. There is also a cost to failure: weak performance can reduce fees, discourage later issuance and leave Robinhood holding seed investments longer than expected.
Growth depends on new primary capital, sustainable fees and Robinhood recovering seed investments to fund later launches. In our Base case, the funds hold $7.86 billion of net assets on behalf of investors, including approximately $810 million owned by Robinhood.
Can earnings grow much faster than expenses?
The company’s product range is now broad enough that the important management question is selection.
Which businesses should Robinhood own? Which should it access through partners? Where does a better interface create a genuine advantage, and where does the company need an expensive new operational capability?
We favor management’s willingness to invest while the core business is profitable. We also expect that investment to earn a return. Running a card portfolio, serving advisers, administering accounts, operating international crypto businesses and managing funds involves more than extending the same software to another screen.
Founder control puts considerable discretion over those decisions in a small number of hands. The filing reports approximately 12% economic ownership by founders and related entities alongside more than half of voting power. That can support long-term investment; it also leaves outside shareholders with less influence over capital allocation.
Our most demanding assumption concerns profitability. We expect revenue to grow much faster than expenses, reaching a 50.8% normalized net margin in 2030.
That would be a demanding level of profitability.
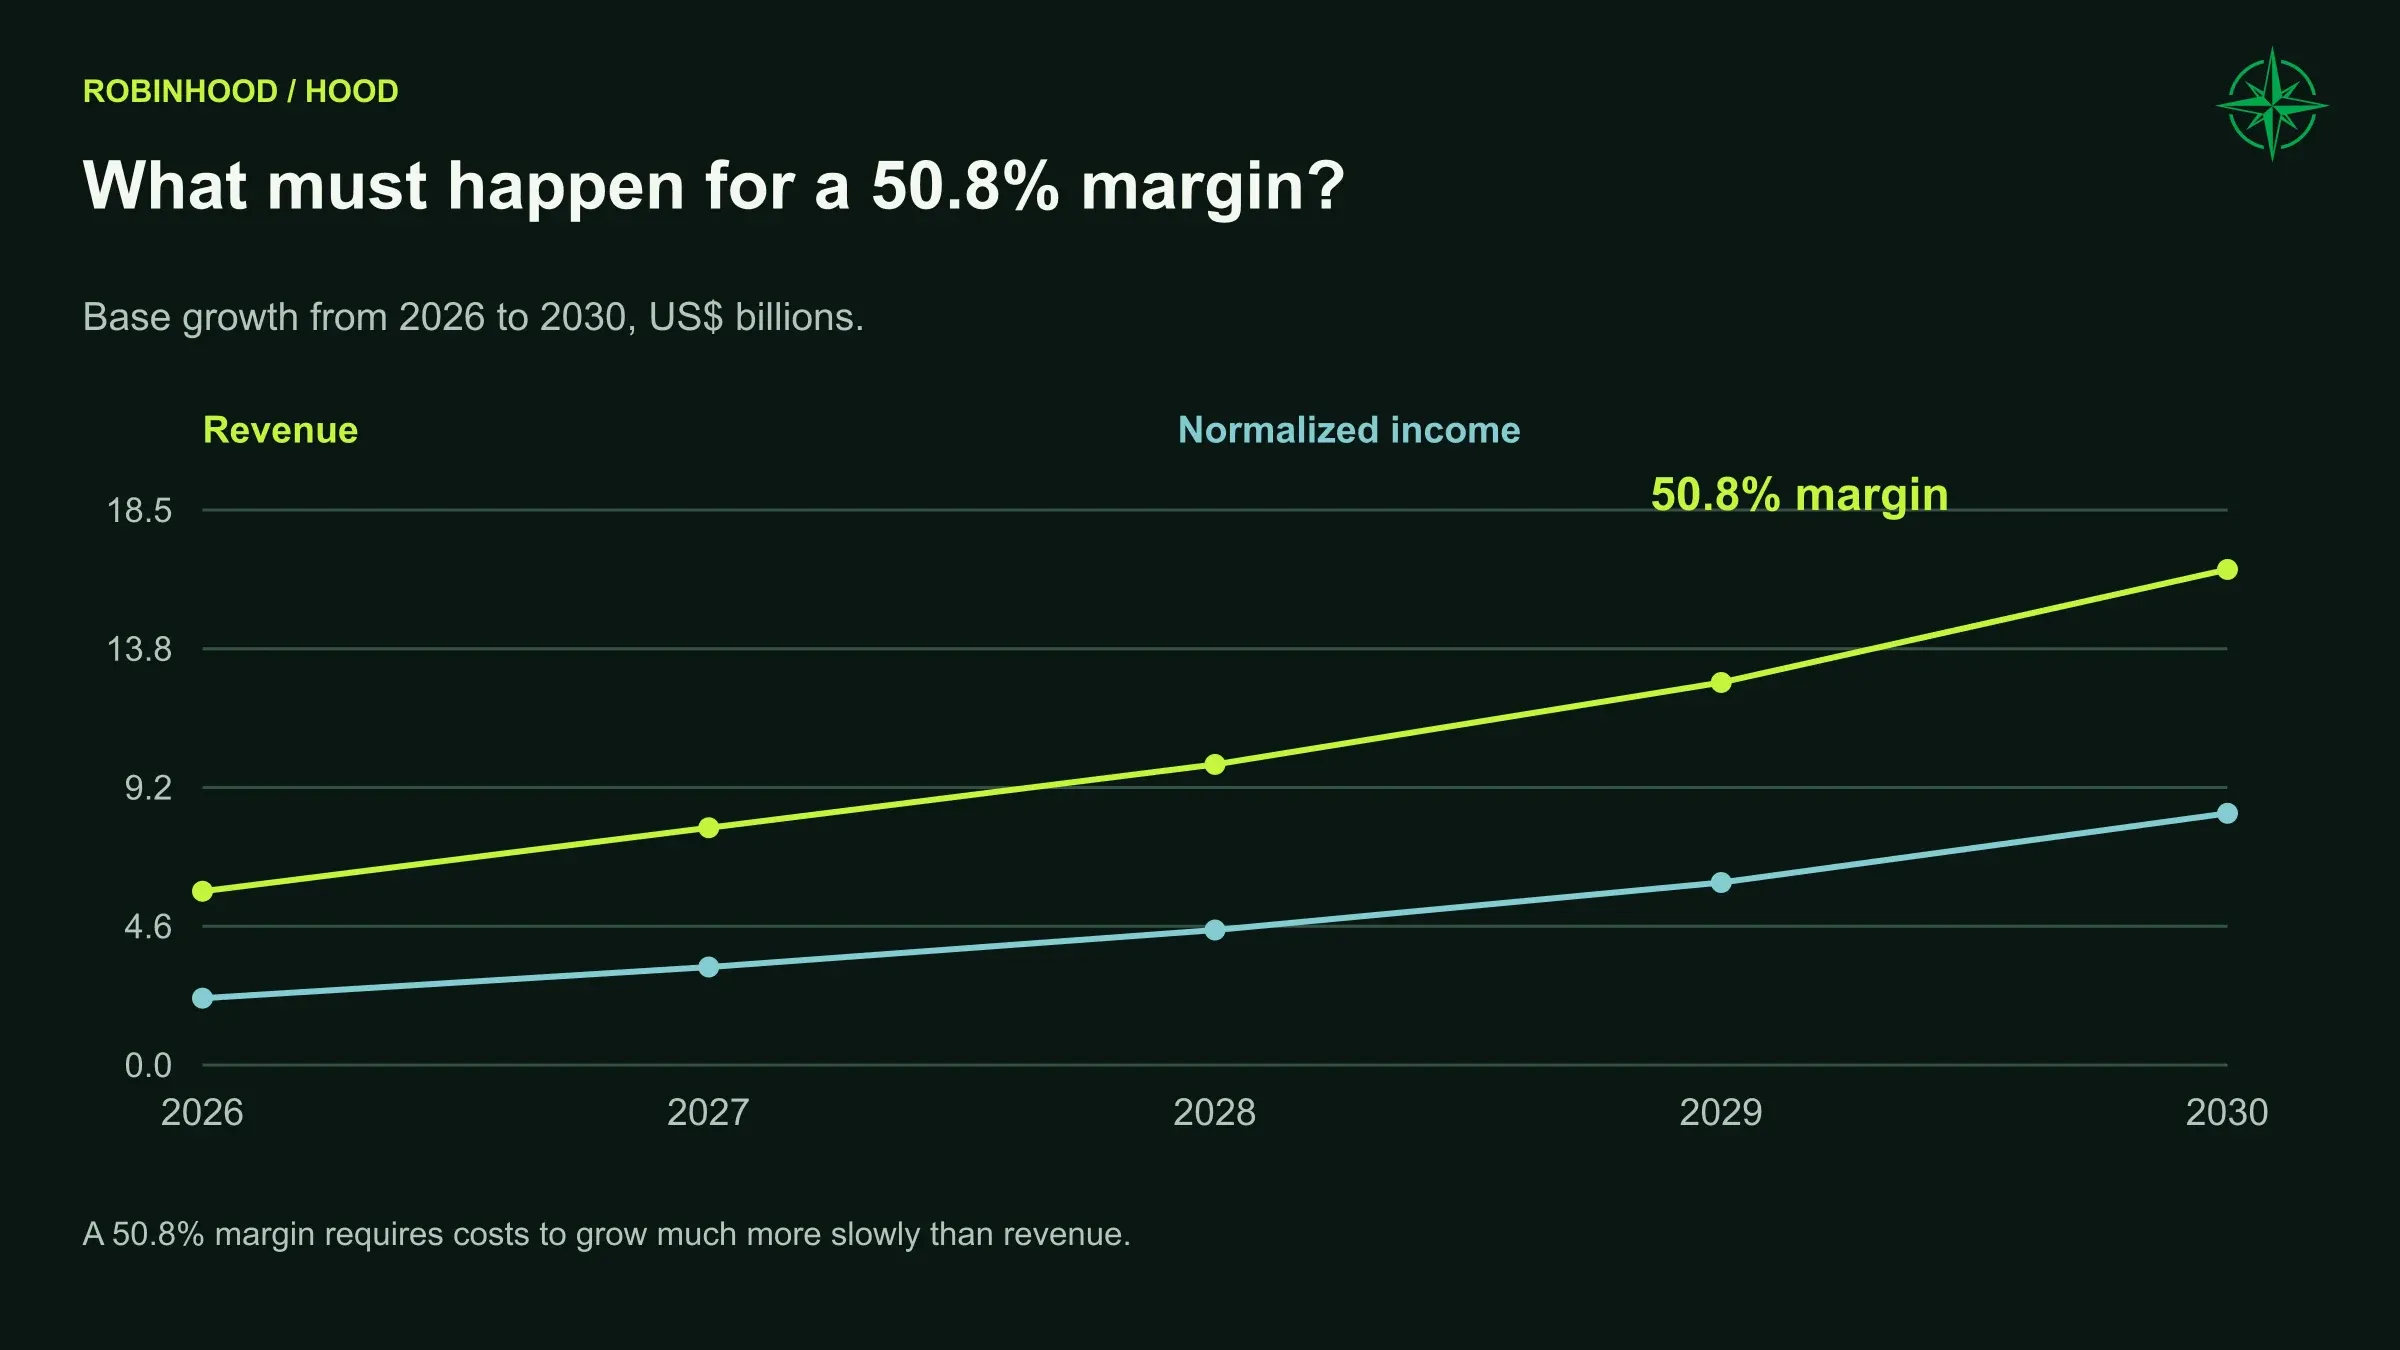
There is a credible route to it: more assets and activity flowing across an established distribution and technology base, with high-margin transaction and interest revenue doing much of the work. The competing interpretation is that customer service, risk management, compliance and product complexity require considerably more spending than we allow.
Expense growth will be an important test of the thesis.
The second-half starting point
Reported first-half revenue was $2.375 billion. July and August activity informs our expectations for the rest of the year. We estimate September separately and expect a strong Q4 as event trading, crypto, customer assets and Chain revenue grow.
Financial bridge | Q1 actual | Q2 actual | Q3 estimate | Q4 estimate | 2026 |
|---|---|---|---|---|---|
Revenue | $1,067M | $1,308M | $1,520M | $1,881M | $5,776M |
Core expenses, including ordinary SBC | $607M | $641M | $725M | $763M | $2,735M |
Total operating expenses | $656M | $734M | $792M | $832M | $3,014M |
Attributable net income | $350M | $561M | $585M | $824M | $2,320M |
Diluted EPS | $0.38 | $0.62 | $0.64 | $0.90 | $2.54 |
Annual EPS uses the annual earnings and share calculation. Normalized 2026 EPS is approximately $2.43 after specified unusual items and sponsor investment returns.
Q4 revenue would be approximately 44% above Q2. This already asks for a strong finish to the year.
Costs rise too. The company’s $2.675–$2.775 billion outlook covers adjusted operating expenses plus ordinary SBC. Provisions and other GAAP expenses sit outside that measure. Our approximately $2.74 billion of core costs falls within that framework; we expect total expenses to reach approximately $3.01 billion after provisions and other items.
We expect spending to rise as the business expands.
The operating forecast through 2030
Our expectations through 2030 depend on customer and asset growth, trading activity, pricing, credit losses, costs and funding. Changes in the economy can affect several of these at once.
The mixed-expansion setting assumes 6.5% annual equity-asset returns. The adverse path begins with a 20% decline in 2027, weaker deposits and customer growth, and a later recovery. Crypto activity, credit and interest rates have separate related adjustments.
The main franchise settings are:
Northwise assumption | Weaker | Steady | Stronger |
|---|---|---|---|
Annual funded-customer growth | 4.5% | 9.0% | 14.5% |
Core net deposits / beginning assets | 12% | 22% | 30% |
Gold attachment in 2030 | 21% | 29% | 36% |
Annual cardholder growth | 14% | 30% | 43% |
Annual RIA-asset growth before market adjustment | 12% | 24% | 35% |
Annual Strategies growth before market adjustment | 35% | 65% | 90% |
Margin / eligible assets in 2030 | 4.7% | 6.0% | 7.5% |
Sweep / eligible assets in 2030 | 7.5% | 9.5% | 11.5% |
Inputs before applicable macroeconomic and product adjustments.
For expenses, the steady setting uses 11% underlying technology growth, 16% marketing growth and 9% administration growth, before specified additions. Customer operations and brokerage costs respond to their own business drivers. Fund management and U.S. implementation have explicit costs. Future tax assumptions normalize toward 23% in the steady franchise, as the unusually low first-half effective rate rises.
Ordinary stock compensation remains an expense because it is a recurring cost of employing staff.
Complete Base revenue forecast
Revenue, $M | 2026 | 2027 | 2028 | 2029 | 2030 |
|---|---|---|---|---|---|
Equities | 496.6 | 636.5 | 834.0 | 1,091.6 | 1,442.7 |
Options | 1,439.3 | 1,693.4 | 2,053.9 | 2,459.2 | 2,982.6 |
Crypto | 556.3 | 786.1 | 1,027.3 | 1,311.1 | 1,679.9 |
Event contracts | 799.2 | 1,106.5 | 1,495.5 | 1,922.0 | 2,412.1 |
Other transaction revenue, net | 196.4 | 255.9 | 293.4 | 334.4 | 382.3 |
Margin interest | 931.8 | 1,331.0 | 1,559.2 | 1,947.2 | 2,625.5 |
Segregated cash income, net | 269.7 | 360.8 | 396.8 | 464.1 | 585.3 |
Cash sweep | 181.1 | 234.4 | 313.9 | 428.1 | 593.7 |
Card net interest | 175.3 | 283.1 | 379.7 | 511.8 | 692.2 |
Corporate cash interest | 153.6 | 227.5 | 241.4 | 264.6 | 300.8 |
Securities lending, net | 15.0 | 33.8 | 82.3 | 159.7 | 278.4 |
Facility interest expense | (43.0) | (56.3) | (74.9) | (100.2) | (134.0) |
Other net interest | 9.0 | 7.6 | 8.4 | 9.2 | 10.2 |
Gold subscriptions | 231.2 | 311.5 | 384.2 | 471.3 | 585.1 |
Proxy revenue | 74.0 | 82.9 | 91.0 | 100.1 | 110.2 |
Other services | 186.7 | 211.9 | 267.5 | 329.4 | 400.7 |
Ventures management fees | 7.3 | 27.5 | 47.9 | 82.0 | 130.0 |
Ventures incentive fees | 0 | 0 | 0 | 0 | 8.3 |
Retained Chain sequencer revenue | 84.6 | 318.7 | 522.8 | 793.8 | 1,130.9 |
Token distribution and Earn | 12.0 | 28.6 | 45.6 | 73.7 | 120.3 |
Incremental U.S. tokenization | 0 | 5.4 | 22.5 | 63.4 | 136.5 |
Total revenue | 5,776.3 | 7,887.1 | 9,992.5 | 12,716.7 | 16,473.6 |
Northwise forecasts. The economic presentation uses retained Chain revenue and net card-fee treatment. Future GAAP gross-versus-net presentation may differ without an equivalent change in profit. Totals use unrounded calculations.
Options, margin lending, events, equities and crypto remain the largest contributors. Chain becomes meaningful, while subscriptions, advice, services and funds broaden the opportunity.
Most of the earnings growth still depends on the brokerage and its customers. Tokenization adds to that opportunity.
Base earnings and expenses
Financial forecast, $M except EPS | 2026 | 2027 | 2028 | 2029 | 2030 |
|---|---|---|---|---|---|
Revenue | 5,776.3 | 7,887.1 | 9,992.5 | 12,716.7 | 16,473.6 |
Core expenses, including ordinary SBC | 2,735.1 | 3,328.9 | 3,742.7 | 4,246.9 | 4,818.1 |
Credit provisions | 224.6 | 278.6 | 341.3 | 473.5 | 632.8 |
Specified special expenses | 50.0 | 46.2 | 0 | 0 | 0 |
Debt-cost amortization | 4.7 | 9.4 | 9.4 | 6.5 | 0 |
Total operating expenses | 3,014.4 | 3,663.1 | 4,093.5 | 4,726.9 | 5,450.9 |
Operating profit | 2,761.8 | 4,224.0 | 5,899.0 | 7,989.8 | 11,022.7 |
Normalized attributable income | 2,221.3 | 3,257.4 | 4,487.3 | 6,067.1 | 8,367.9 |
Normalized diluted EPS | $2.43 | $3.57 | $4.93 | $6.68 | $9.24 |
Expensed SBC, included above | 417.0 | 482.2 | 553.9 | 636.7 | 732.3 |
Normalized income excludes specified unusual items and sponsor investment returns. Ordinary stock compensation is retained, and cash tax refunds in loss scenarios are excluded.
We expect Robinhood to earn much more from each additional dollar of revenue. The revenue mix and existing scale make that plausible. Reaching a 50.8% net margin would still require tight cost control over several years.
Earnings must finance the balance sheet before they finance buybacks
Robinhood needs to fund a growing balance sheet before it can return more cash through buybacks.
A financial company’s cash-flow statement includes customer and collateral movements that remain committed to the business.
In the first half, Robinhood reported $2.758 billion of operating cash flow. That included an $8.91 billion increase in securities-loaned liabilities and a $5.20 billion increase in payables to users, alongside substantial asset and collateral uses. Those movements reflect funding obligations within the business.
Securities lending makes the mechanics easier to understand. Cash posted to borrow securities creates a right to recover that collateral. Cash received when lending securities creates an obligation to return it. At June, the relevant gross balances were $6.036 billion and $20.536 billion. The larger liability carries an obligation to return the collateral.
We therefore calculate the capital Robinhood would need to support that growth before arriving at cash available to equity.
Our core allowance is 12% of margin receivables, plus 0.2% of platform assets and $500 million. Card equity, deferred incentives, software, investments and other assets receive separate treatment. The operating liquidity buffer begins at $3 billion and rises $150 million annually. These allowances estimate the capital needed to operate and grow. Legal reserves and intraday clearing obligations require separate liquidity assessments.
Northwise Base capital forecast | 2026 | 2027 | 2028 | 2029 | 2030 |
|---|---|---|---|---|---|
Core financial-capital allowance | $4.25B | $5.30B | $6.91B | $9.05B | $11.89B |
Total capital tied up | $7.27B | $9.00B | $11.45B | $14.58B | $18.83B |
Operating cash flow available to equity | $0.60B | $1.45B | $2.01B | $2.91B | $4.06B |
Cash after financial-investment flows | $0.45B | $1.37B | $1.94B | $2.83B | $4.02B |
Ending corporate cash | $5.76B | $7.26B | $9.02B | $9.30B | $12.71B |
Common book equity | $10.80B | $14.01B | $18.21B | $23.82B | $31.48B |
Convertible principal outstanding | $2.20B | $2.20B | $2.20B | 0 | 0 |
Annual repurchases | $0.92B | $0.40B | $0.76B | $1.00B | $1.32B |
Weighted-average diluted shares | 912.27M | 911.31M | 910.36M | 908.12M | 905.17M |
Operating cash available to equity deducts operating-capital and liquidity needs. The 2026 figure includes an estimated first-half capital bridge. Some corporate cash may be subject to transfer restrictions.
By 2030, approximately $8.37 billion of normalized attributable earnings supports about $4.06 billion of operating cash available to equity. Growth uses much of the difference.
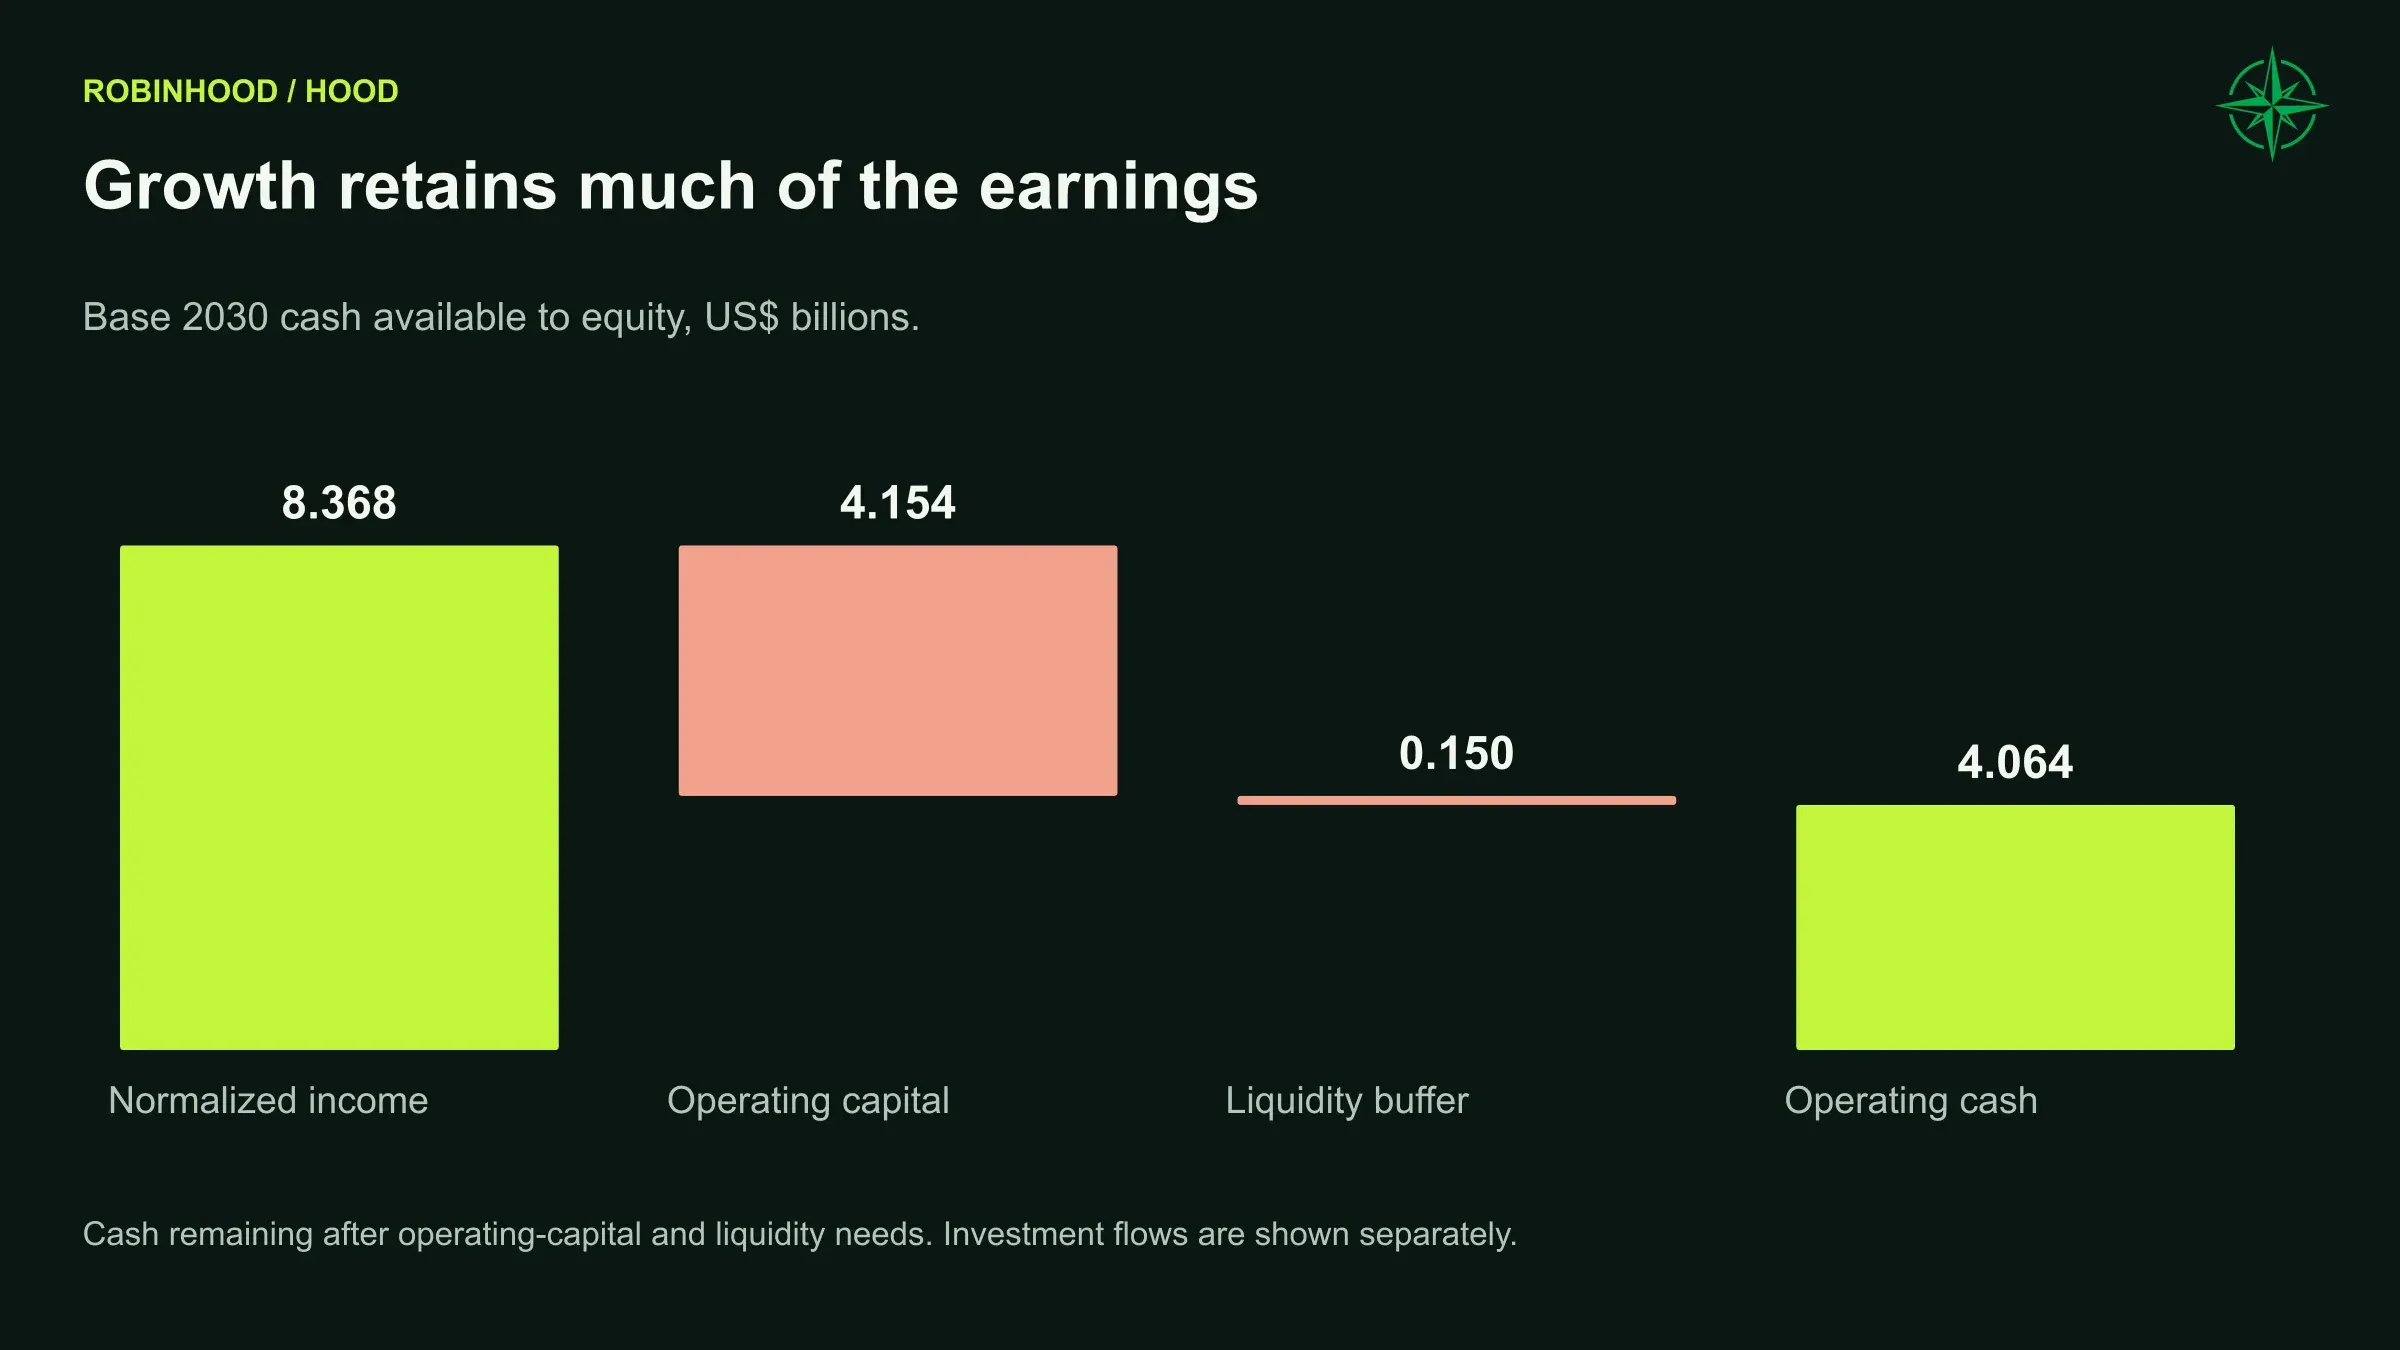
The $2.2 billion convertible adds a specific obligation. The notes mature on October 1, 2029, and principal must be settled in cash upon conversion. The zero coupon limits annual interest expense, while the principal still requires cash repayment.
The capped-call protection runs from approximately $174.42 to $237.85 per share. Separate warrants cover 8.74 million shares at $26.60. We also include employee issuance, capitalized compensation and cash withholding. The concurrent June repurchase is already reflected in the opening share count.
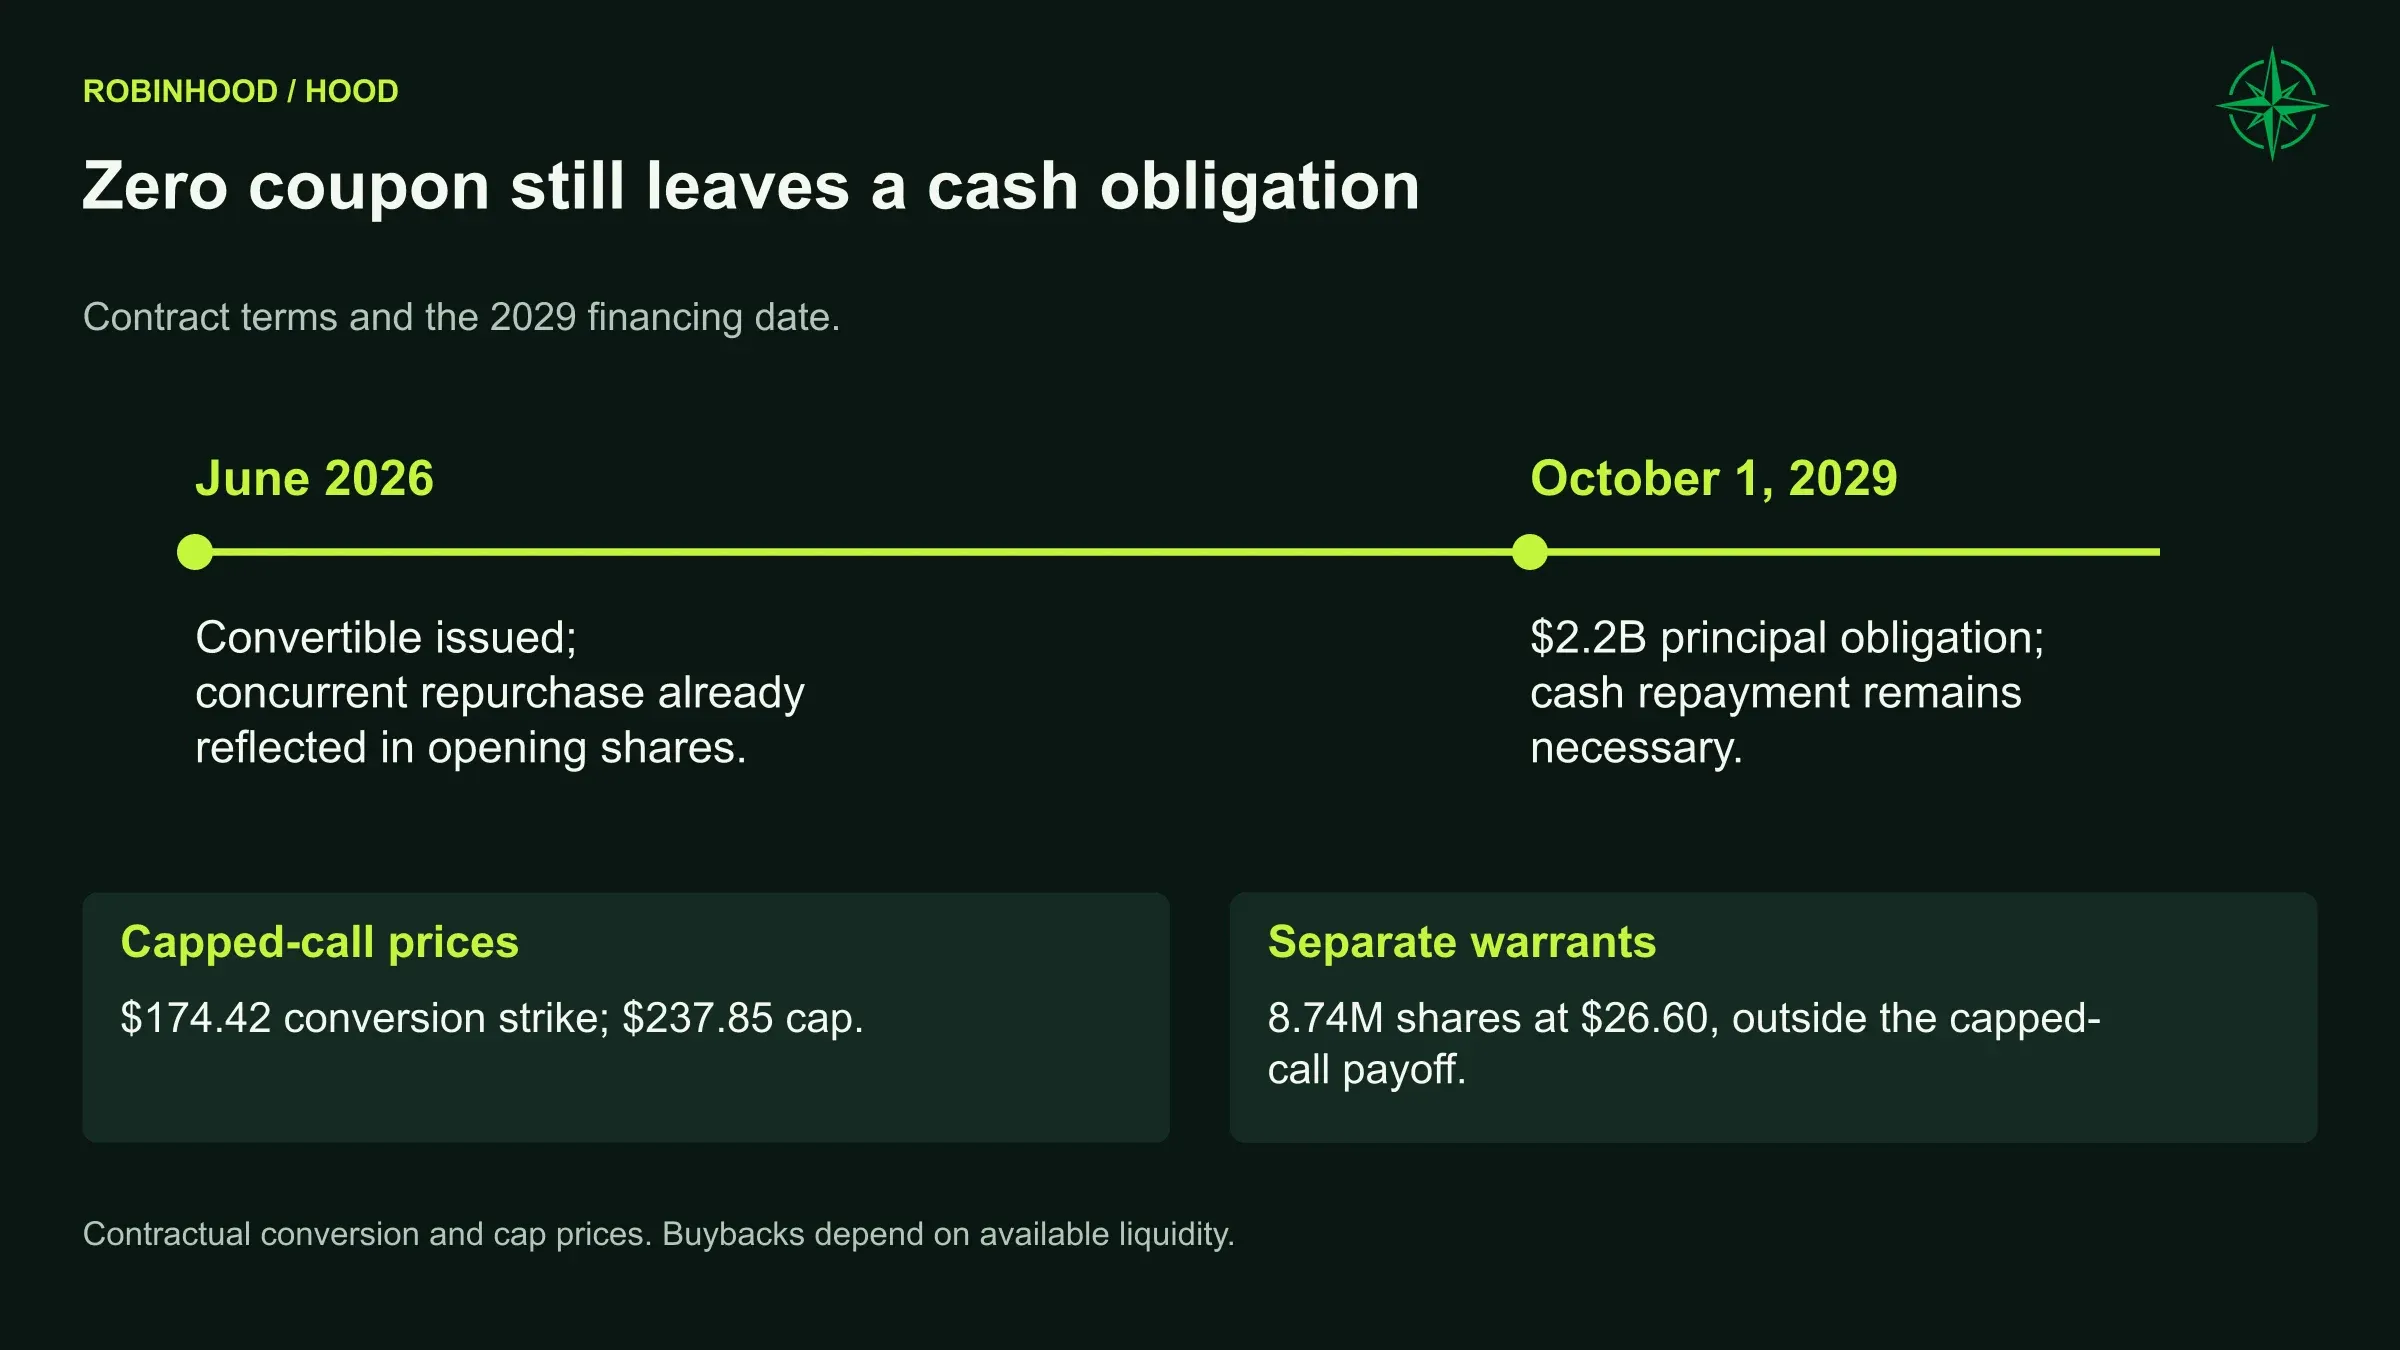
We expect Robinhood to limit repurchases to preserve liquidity and prepare for the approaching debt maturity. They offset much of the ongoing dilution, producing only a modest reduction in diluted shares by 2030.
Higher earnings drive the growth in EPS; buybacks make a smaller contribution.
How we arrive at Bear, Base and Bull
Our Bear, Base and Bull cases group a range of possible business outcomes.
We consider three economic environments, three levels of franchise execution, three Chain outcomes, three event-market outcomes, and two outcomes each for credit stress and U.S. implementation. That creates 324 combinations.
Macro probabilities are 22% adverse, 56% mixed expansion and 22% favorable. Other likelihoods depend on the surrounding conditions. Strong franchise execution becomes less likely in a poor macro environment; credit stress becomes more likely. Chain and event-market success can differ within the same path.
We then group the combinations by business outcome. Bear includes weak franchise development without a Chain breakout, or adverse macro conditions combined with restricted event markets. Bull includes strong franchise execution with a Chain or event breakout, or adequate franchise execution with both. The remaining combinations form Base.
The calculated weights are 17.39% Bear, 64.46% Base and 18.15% Bull.
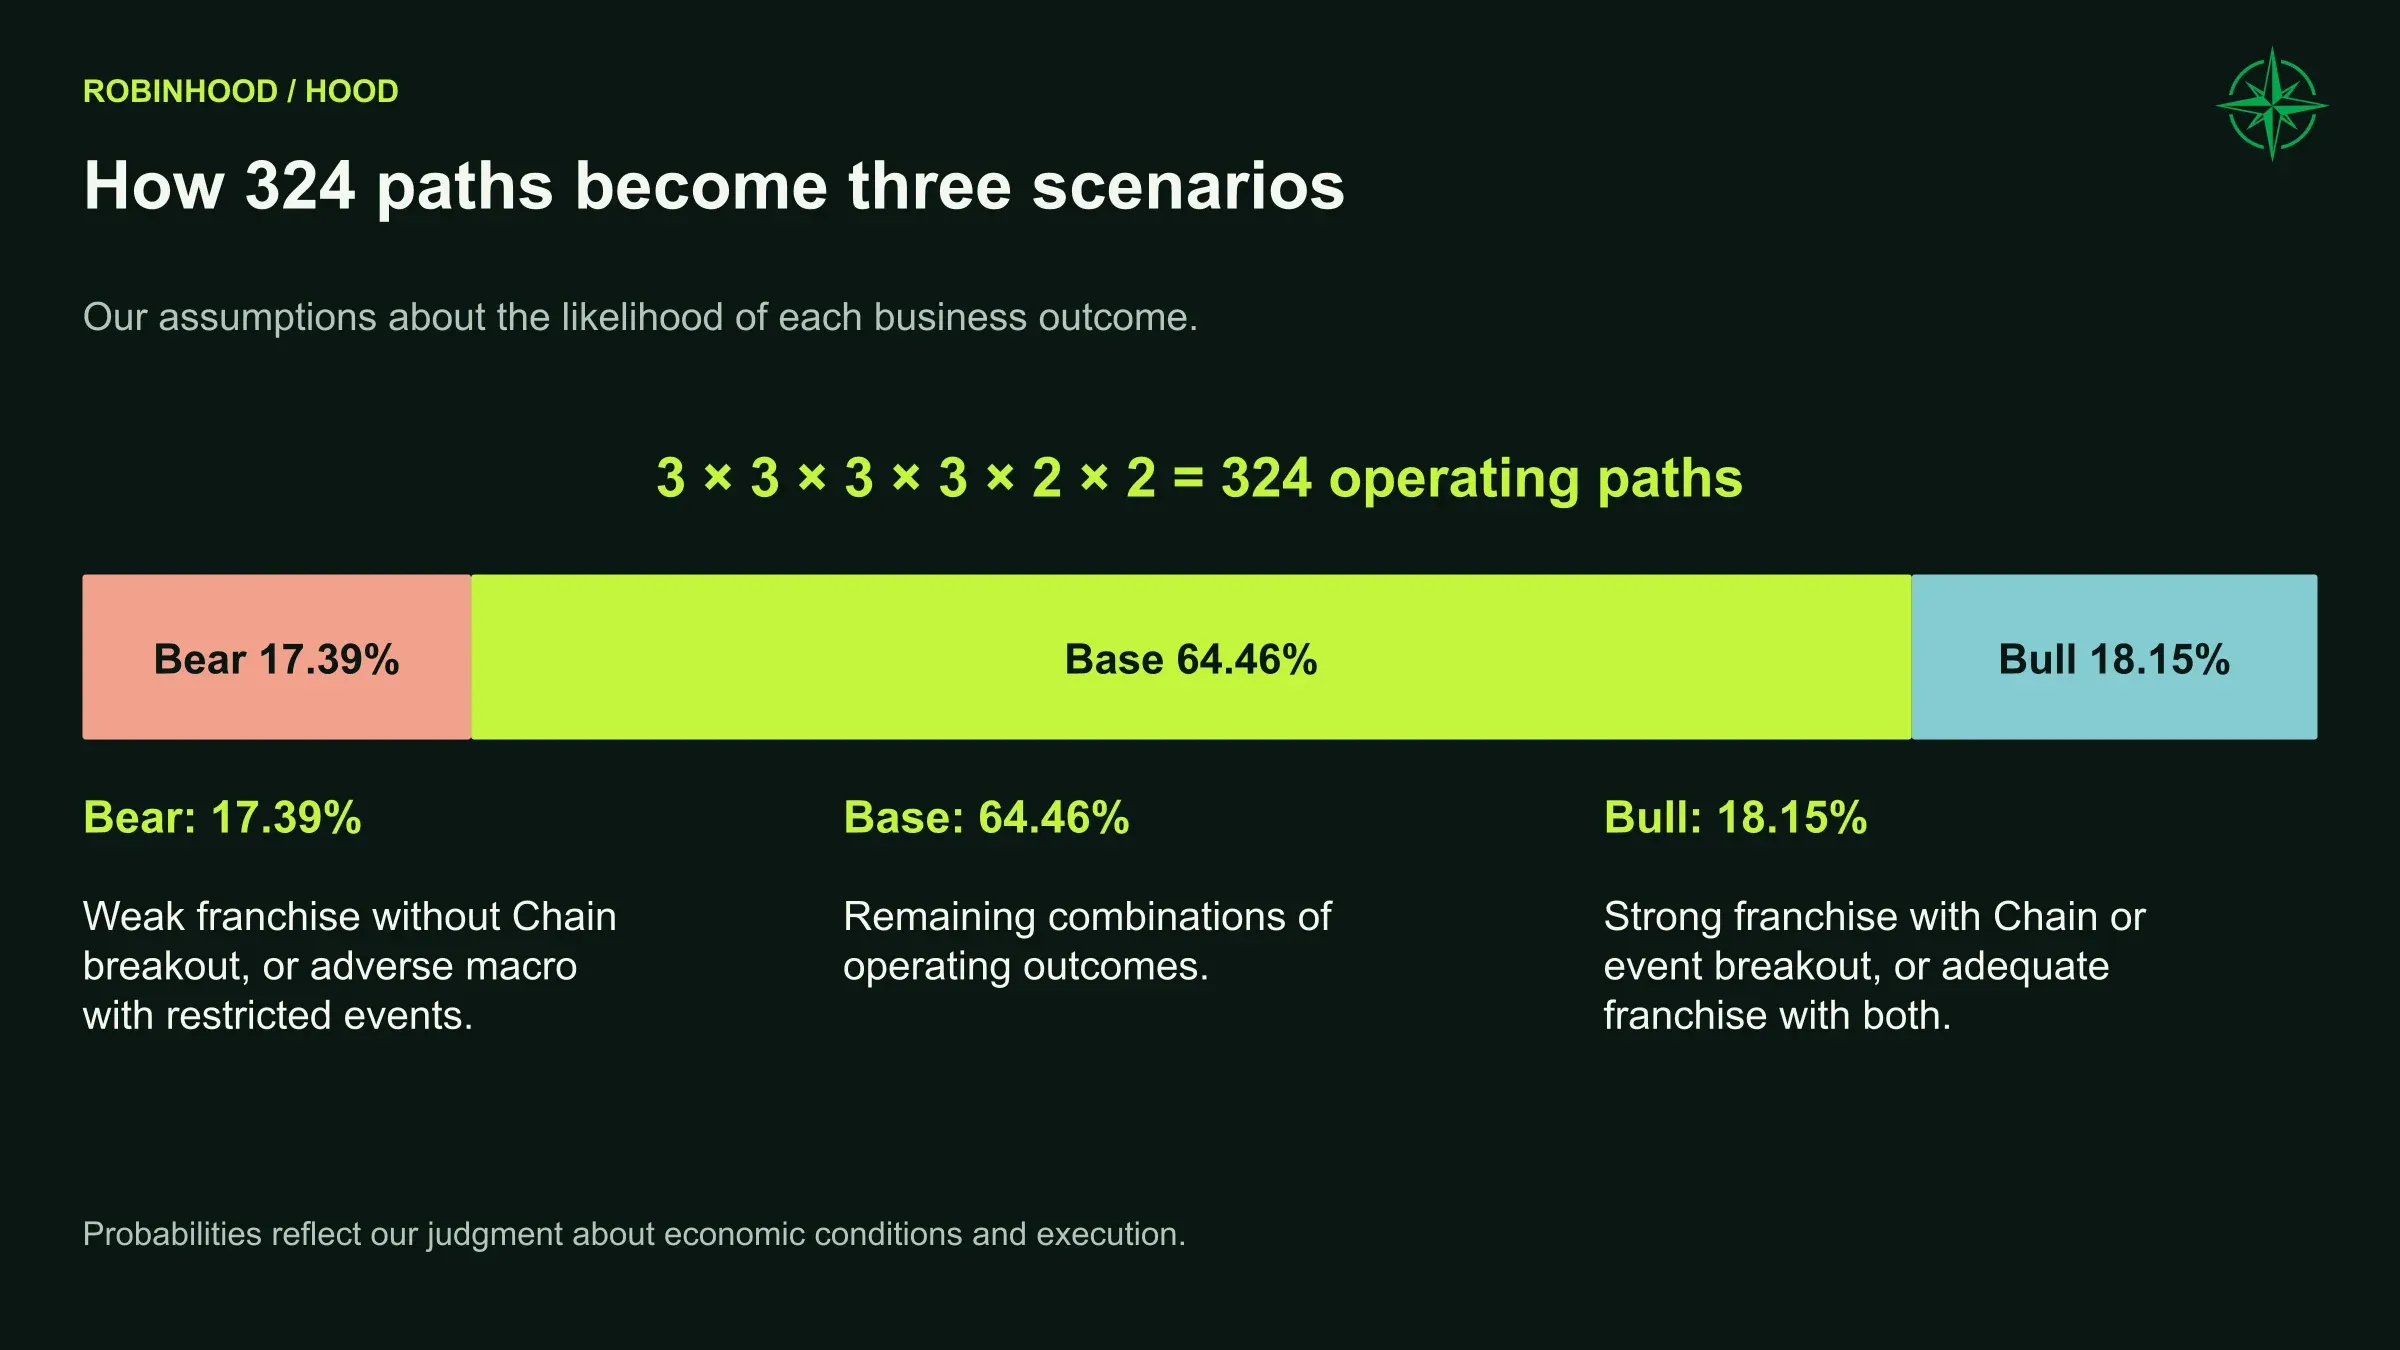
We assign the probabilities using our judgment about the business and economic conditions. They are estimates and remain open to challenge.
The workbook shows the probability assumptions so readers can change them and test the effect.
Annual Northwise forecast | 2026 | 2027 | 2028 | 2029 | 2030 |
|---|---|---|---|---|---|
Bear revenue | $5.59B | $6.21B | $6.79B | $7.68B | $8.93B |
Bear normalized income | $2.09B | $2.06B | $2.36B | $2.75B | $3.40B |
Bear normalized EPS | $2.29 | $2.26 | $2.60 | $3.04 | $3.77 |
Base revenue | $5.78B | $7.89B | $9.99B | $12.72B | $16.47B |
Base normalized income | $2.22B | $3.26B | $4.49B | $6.07B | $8.37B |
Base normalized EPS | $2.43 | $3.57 | $4.93 | $6.68 | $9.24 |
Bull revenue | $5.99B | $9.54B | $13.56B | $18.91B | $26.41B |
Bull normalized income | $2.37B | $4.39B | $6.87B | $10.19B | $14.99B |
Bull normalized EPS | $2.59 | $4.82 | $7.54 | $11.21 | $16.55 |
Probability-weighted revenue | $5.78B | $7.90B | $10.08B | $12.97B | $16.97B |
Probability-weighted normalized income | $2.22B | $3.25B | $4.55B | $6.24B | $8.71B |
Probability-weighted normalized EPS | $2.44 | $3.57 | $5.00 | $6.87 | $9.63 |
Categories are conditional averages. EPS divides aggregated earnings by aggregated shares.
The Bull category requires exceptional execution and earnings conversion. Equally, the Bear business remains profitable and grows, but fails to realize much of the opportunity described in the more favorable paths.
An interesting consequence is that slower growth can release more near-term cash. In 2027, Bear operating cash available to equity is approximately $1.84 billion, compared with $1.45 billion in Base, because the slower-growing business needs less incremental capital.
Lower near-term cash generation can accompany valuable growth when the money supports profitable lending and customer relationships.
What could put growth and funding under pressure?
Our stress tests change activity, pricing, costs, credit and funding in both directions. They show how better and worse operating conditions affect earnings and funding.
The starting point for the following comparisons is the probability-weighted 2030 forecast of approximately $16.97 billion in revenue and $8.71 billion of normalized attributable income.
Separate operating stress | 2030 revenue | 2030 normalized income | Funding-dependent paths |
|---|---|---|---|
Chain fee pool 50% lower | $16.29B | $8.23B | 0.00% |
Chain fee pool doubled | $18.31B | $9.66B | 0.00% |
Entire Chain-linked business unavailable | $15.34B | $7.55B | 0.00% |
Core expenses 15% higher | $16.93B | $8.12B | 0.10% |
Core expenses 15% lower | $17.00B | $9.30B | 0.00% |
No incremental U.S. token launch | $16.82B | $8.65B | 0.00% |
No additional funds | $16.87B | $8.66B | 0.00% |
No event contracts from 2027 | $13.89B | $6.68B | 0.00% |
Combined operating and capital stress | $13.76B | $5.86B | 71.52% |
Each row is a separate recalculation. Funding dependence is the combined probability we assign to outcomes requiring uncommitted financing. Actual default risk would require a separate assessment.
The combined stress cuts the Chain fee pool to one-quarter, halves the remaining-2026 event and crypto assumptions that establish subsequent activity, reduces equity/options monetization by 15%, raises core costs by 15%, and increases capital requirements by 50%.
The business still earns money at the endpoint. Many paths cannot finance the intervening balance sheet as assumed.
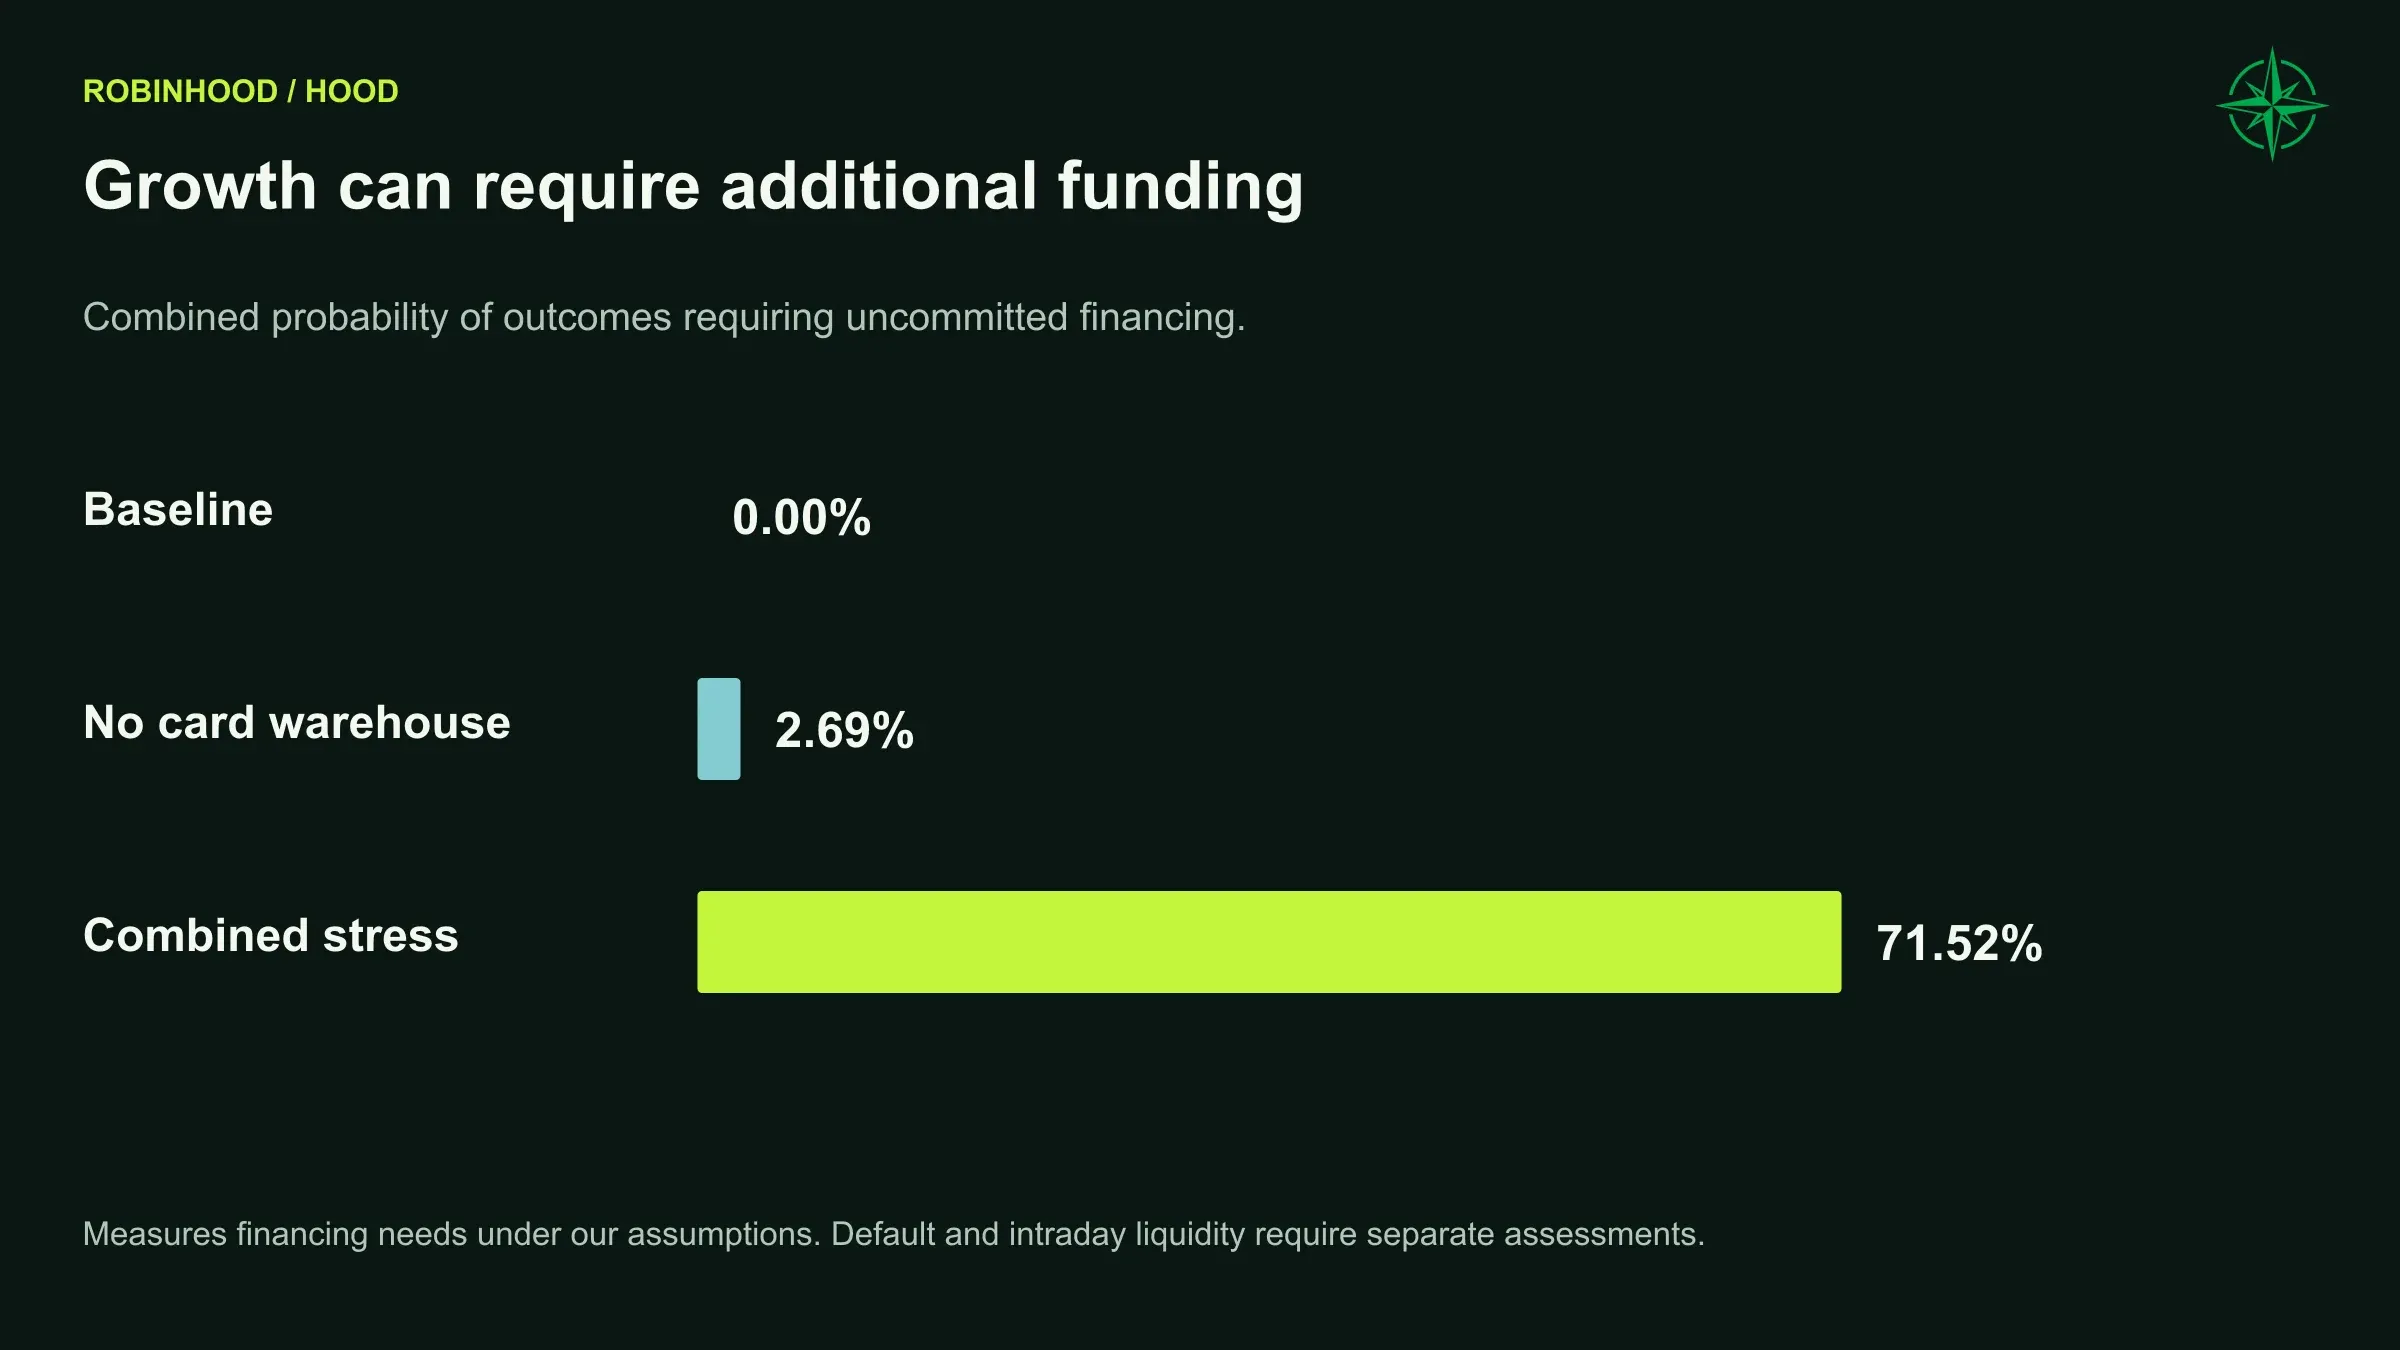
The need for financing could become the immediate constraint on growth. Management could stop repurchases, slow lending growth, change pricing or seek capital. Those responses would change the outcome for shareholders. Access to new equity and its cost would depend on market conditions.
The tests also put the newer businesses in perspective. U.S. tokenization and the next several funds make relatively small contributions to our earnings estimates. Event markets and Chain are more consequential, but the broader brokerage and asset relationship remains substantial without them.
Custody failures, cyberattacks, legal recoveries and counterparty crises could create losses beyond these stress tests. Annual cash estimates cannot tell us whether Robinhood will have enough eligible collateral at every point during a trading day. The company’s ambition to hold more important household assets raises the standard of reliability it needs to meet.
The evidence we will watch
We will judge progress through customer behavior and financial results.
We want deposits to remain strong after adjusting for market gains, acquisition scope and promotions. We want paying Gold adoption and managed assets to grow. We want trading activity to translate into retained revenue at the fees we expect. In cards, we want losses and funding needs to remain manageable as the book expands. In Ventures, we want primary fundraising and investment performance that support a continuing manager.
Chain requires clearer fee attribution and persistent use. Event contracts have a specific seasonal hurdle and an evolving availability risk. Expenses need to grow more slowly than the revenue they support without undermining service or controls.
We remain constructive because the company has an existing earnings base, real customer adoption and several credible ways to deepen the relationship. We would become less constructive if progress increasingly depended on subsidies, favorable market conditions or unmeasured cross-selling benefits.
Premium members can download the complete workbook, including our assumptions, annual projections and sensitivity tests.
For the earlier research baseline, see our Robinhood Strategic Forecast 2030. Our Robinhood revenue guide explains the underlying revenue categories.
Northwise Premium
Choose how to continue with Northwise
Join Northwise Premium
Unlock the rest of this report, its complete valuation, the downloadable model, portfolios, and action framework.
Join Northwise PremiumCreate a Free Account
Continue across Free Northwise research, follow companies, save reports, and receive updates.
Create a Free Account
Robinhood Strategic Forecast 2030
HOOD stock forecast 2030 analyzing Robinhood’s shift into tokenization, banking, and advisory to capture the generational wealth transfer.

How Does Robinhood Make Money?
How Robinhood makes money: Q2 2026 revenue categories, trading mix, interest sensitivity, Gold, advisory and bank-partner services.

Bitstamp By Robinhood
Robinhood has officially completed its acquisition of Bitstamp, a pivotal move that broadens their reach and signals serious intent to win in crypto.
Northwise Portfolios
See how the research becomes real decisions
Reader discussion
Discuss the research
Premium access is required to join this report's discussion.
Join Northwise Premium
No comments yet. Start a thoughtful discussion.