
Grab Stock Forecast 2030

A Grab Stock Forecast 2030 scenario modeling revenue, margins, cash, and valuation through across bear, base, bull, and a possible GoTo Merger.
In this article

Grab Stock Forecast 2030: A Platform Valuation Under Structural Constraint
An enterprise value–anchored scenario analysis of Grab Holdings through 2030, grounded in platform economics, regulatory ceilings, competitive pressure, fintech realism, and consolidation risk.
Executive Orientation
This thesis exists for one reason. Grab has crossed an important threshold. It has demonstrated profitability at scale, stabilized its core platform, and accumulated a balance sheet that introduces real strategic optionality. At the same time, the market continues to struggle with how to value a Southeast Asian superapp whose economics do not map cleanly to United States or European platform analogs.
That tension is the starting point. Grab is no longer an early-stage platform fighting for survival, yet it also operates inside markets where price elasticity, labor sensitivity, and political oversight impose structural ceilings on margin expansion and pricing power. Both realities coexist. Any valuation framework that ignores one in favor of the other will fail.
This work is built around an enterprise value lens rather than an earnings narrative. Stock based compensation, foreign exchange translation, fintech accounting, and interest income distort per share metrics in ways that obscure the underlying platform trajectory. EBITDA, while imperfect, provides a cleaner bridge between operating scale, margin discipline, and long-duration valuation outcomes. Cash liquidity is treated as real strategic capacity rather than cosmetic balance sheet support, with explicit assumptions about how that liquidity evolves across scenarios.
The core objective is clarity rather than conviction. This is not a tactical forecast or a twelve-month price call. It is a structured attempt to reconcile what Grab has become with the constraints it operates under, and to translate that reconciliation into auditable valuation outcomes through 2030.
Competition remains active across Southeast Asia, though its form has changed. Regulatory exposure has increased as platform labor has become politically salient. Fintech has matured into infrastructure that supports retention and liquidity rather than a standalone profit engine. Advertising has emerged as a high-margin lever inside the ecosystem without yet displacing the core economics of mobility and deliveries. Consolidation with GoTo represents a plausible structural shift, though one accompanied by dilution, integration friction, and political oversight that alters the risk-reward profile.
Each of these forces is incorporated directly into the scenario framework that follows. Revenue growth, margin ceilings, valuation multiples, cash outcomes, and share count are varied deliberately and sparingly. The result is a bounded set of outcomes that reflect execution quality, regulatory constraint, and capital discipline rather than narrative enthusiasm.
This is an enterprise value trade. The upside, where it exists, comes from operating leverage and disciplined scale within constraint. The downside comes from persistent pricing pressure, labor cost resets, and capital absorption inside fintech. The purpose of this thesis is to make those paths explicit, measurable, and comparable so that the reader can decide whether the expected value justifies the risk.
Table of Contents
- How Grab Actually Makes Money
- Why Platform Economics Look Different in Southeast Asia
- Mobility as the Economic Anchor of the Platform
- The Profitability Pivot and Its Structural Ceiling
- Competition Did Not End. It Changed Form
- Regulation and Labor as Persistent Margin Constraints
- Fintech as Support Infrastructure Rather Than a Profit Engine
- Advertising as a Margin Lever Inside the Ecosystem
- Scenario Framework and Valuation Methodology
- Bear Case: Persistent Price Pressure and Cost Drag
- Base Case: A Durable Utility With Constrained Upside
- Bull Case: Standalone Execution Within Platform Limits
- Bull Case: Consolidation With GoTo Under Political Constraint
- Probability Weighting and Expected Value Interpretation
- What Would Break This Thesis
- Is Grab Stock a Buy?
1. How Grab Actually Makes Money
Grab operates a multi-sided platform that monetizes movement, consumption, and financial activity across Southeast Asia. The company reports through three operating segments: Mobility, Deliveries, and Financial Services. Advertising is embedded primarily within Deliveries and increasingly across merchant-facing surfaces, while Financial Services sits adjacent to the core platform as enabling infrastructure rather than a standalone earnings engine.
Mobility remains the foundation. Ride-hailing generates revenue through commission-based take rates on completed trips, supplemented by ancillary fees tied to service levels and fulfillment. The economics are driven by trip density, pricing discipline, incentive intensity, and labor costs.
While network effects matter, they do not eliminate price sensitivity. Public transportation, motorcycles, and informal alternatives remain viable substitutes in many markets, which places an upper bound on sustainable pricing power. As a result, Mobility behaves less like a pure software platform and more like a scaled logistics utility with technology-enabled coordination.
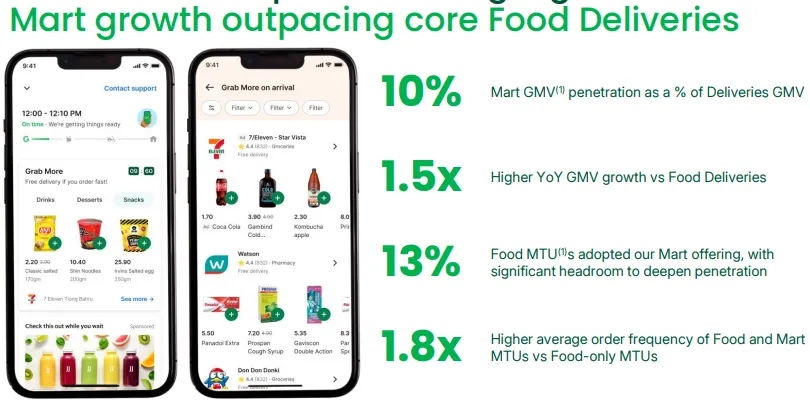
Deliveries extends the same coordination layer into food and merchant commerce. Revenue is derived from merchant commissions, delivery fees, and consumer-facing service charges. The segment has improved materially as incentive intensity has declined and order density has increased, though margins remain sensitive to competitive pricing and courier costs.
Advertising is layered on top of this base. Merchants pay for placement, visibility, and conversion within high-intent surfaces where transaction data and user behavior improve return on spend. Advertising carries structurally higher margins than core delivery activity and increasingly supports segment profitability, though it does not replace the underlying economics of fulfillment.
Financial Services includes payments, lending, and digital banking initiatives. These products are integrated into the platform to reduce friction, increase retention, and improve liquidity across riders, drivers, and merchants. Revenue is generated through transaction fees, interest income, and lending spreads, offset by provisioning and operating costs.
The segment has absorbed capital during its build-out phase and introduces credit cycle exposure that the rest of the platform does not carry. For modeling purposes, Financial Services is treated as infrastructure that supports the ecosystem rather than a driver of consolidated returns. The assumption is that it reaches self-funding status over time and ceases to consume group liquidity, without becoming the primary source of distributable cash.
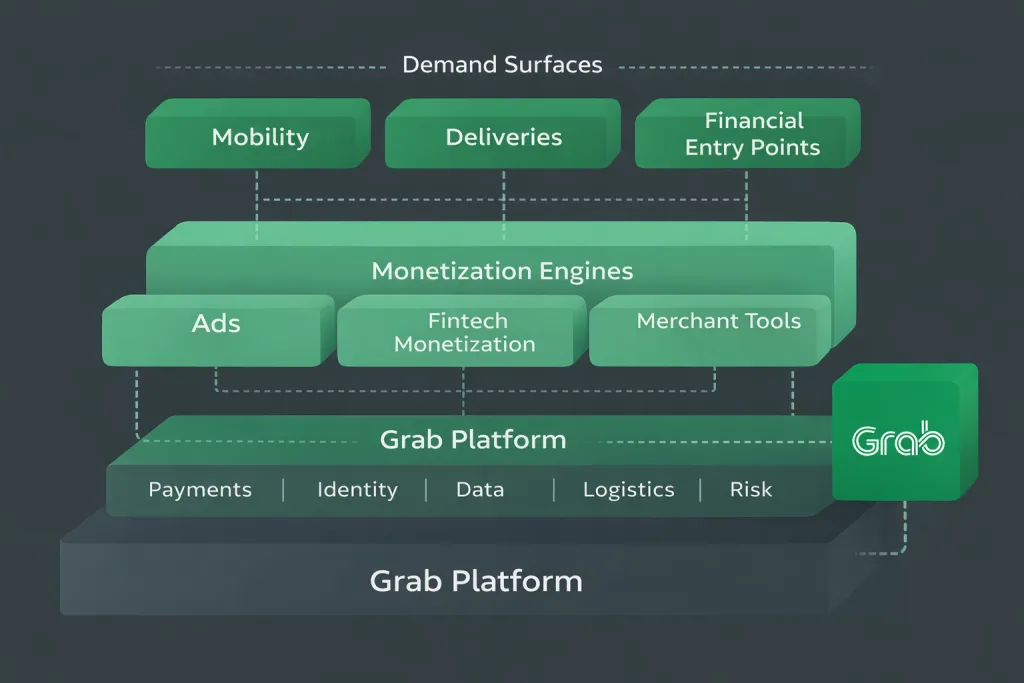
Across all segments, Grab reports in United States dollars while operating in local currencies. Foreign exchange translation affects reported growth and margin comparability, particularly during periods of volatility. Stock based compensation and interest income further complicate per-share metrics. For these reasons, consolidated EBITDA serves as the primary operating proxy in this analysis, with enterprise value used as the valuation anchor.
The result is a business that generates value through scale, coordination, and incremental monetization rather than pure pricing power. Understanding how each segment contributes, and where its limits lie, is essential before evaluating growth trajectories, margin ceilings, or consolidation outcomes involving Grab Holdings.
2. Mobility as the Economic Anchor of the Platform
Mobility is the segment that determines whether Grab’s platform works economically. It sets the baseline for labor exposure, pricing elasticity, incentive behavior, and regulatory visibility. The data from 2025 makes this explicit. Ride-hailing is already operating at scale with positive economics, and the shape of those economics explains both the upside and the ceiling for the rest of the platform.
In Q2 2025, Mobility GMV reached $1.883B, growing 19% year over year on a constant-currency basis. Revenue grew in line at $295M, also 19% year over year, while segment adjusted EBITDA reached $164M, up 27% year over year. EBITDA margin expanded to 8.7% of GMV, up from 8.2% in the prior year.
Transactions increased 23% year over year, outpacing user growth, and monthly active drivers rose 18% year over year to a new high. These figures point to improved utilization rather than price escalation as the primary driver of margin expansion.
That pattern continued in Q3 2025. Mobility GMV increased to $2.041B, up 20% year over year on a constant-currency basis. Revenue reached $317M, growing 17% year over year, while segment adjusted EBITDA rose to $181M, up 21% year over year.
EBITDA margin improved further to 8.9% of GMV. Transactions accelerated to 30% year over year, materially faster than GMV growth, while transactions per active driver reached new highs and driver retention remained stable.
Two signals matter here. First, transaction growth consistently outpaced GMV growth across both quarters. That indicates rising utilization and density rather than increased pricing or take rates. Second, revenue growth lagged GMV modestly in Q3, reinforcing the point that recent profitability gains are not being driven by aggressive monetization. Mobility is scaling through volume and efficiency, not extraction.
These numbers define the structural role of ride-hailing inside the platform. Mobility is already a $2B+ quarterly GMV business with high single-digit EBITDA margins that are improving gradually. Incentive intensity has declined relative to prior years while demand and supply have continued to grow. That combination confirms a transition into a durable operating regime.
At the same time, the ceiling is visible. Driver compensation remains the dominant variable cost. Substitutes such as public transit, motorcycles, and informal transport remain viable across many markets. Competition in dense urban corridors places pressure on pricing discipline without requiring national share displacement. Regulatory and political sensitivity around driver income constrains commission flexibility. These forces do not reverse the gains achieved since 2024. They limit how far margins can expand from here.
For modeling purposes, Mobility behaves as a scaled coordination utility. Efficiency improves with density. Margins expand as incentives normalize. Beyond that point, expansion slows as labor costs, substitution risk, and oversight assert themselves. This is why Mobility anchors the valuation framework. Deliveries inherit similar labor dynamics. Advertising monetizes intent generated by mobility traffic. Financial Services exists in part to stabilize driver liquidity and participation.
Understanding Mobility at this level, with numbers rather than abstractions, clarifies why Grab can sustain profitability while remaining structurally constrained. With that anchor established, the next step is to explain why these dynamics manifest differently across Southeast Asia and why developed-market platform analogies fail when applied mechanically.
3. Why Platform Economics Look Different in Southeast Asia
Platform economics in Southeast Asia impose constraints that differ meaningfully from those observed in the United States or Europe. Demand is more price elastic, substitutes are more available, and labor and transportation are politically salient in ways that directly influence unit economics. These conditions do not prevent scale or profitability. They define the boundaries within which both must operate.
In mobility, public transportation, motorcycles, and informal ride options remain credible alternatives across many urban centers. A marginal increase in pricing or fees can shift demand quickly, particularly during periods of inflation or fuel cost volatility. This limits the degree to which take rates can rise without triggering volume loss or renewed incentive spend. Network density still matters, but it does not override consumer sensitivity to price in the way it can in higher-income markets.
Deliveries face a similar dynamic. Consumers exhibit strong responsiveness to fees and promotions, while merchants remain highly attentive to commission levels. The result is a ceiling on monetization that is enforced by behavior rather than theory. Scale improves routing efficiency and order density, but sustained margin expansion requires careful calibration between pricing, incentives, and service quality rather than unilateral extraction.
Labor further complicates the picture. Drivers and couriers are visible participants in the economic system and are often framed as partners rather than contractors. That framing invites political involvement. Regulatory interventions around benefits, contributions, and protections introduce recurring cost adjustments rather than one-time shocks. These adjustments reset the margin baseline and constrain how much operating leverage can be captured during growth phases.
Foreign exchange adds another layer. Revenues and costs accrue in local currencies while financial reporting occurs in United States dollars. Periods of currency weakness can suppress reported growth and compress margins even when underlying unit economics remain stable. This translation effect contributes to valuation discounts that persist independently of operational performance.
Taken together, these factors shape a platform profile that resembles a coordinated utility more than a pure software marketplace. Scale delivers resilience and efficiency, but pricing power remains bounded by substitution, labor sensitivity, and political oversight.
This distinction is central to how the business should be valued. Applying developed-market platform multiples without adjusting for these structural conditions leads to misinterpretation in both directions, overstating upside during favorable cycles and understating durability during periods of pressure.
With this context established, the analysis can move to how recent profitability improvements fit within these constraints and where the limits to margin expansion are likely to emerge.
4. The Profitability Pivot and Its Structural Ceiling
Grab’s profitability pivot is observable in reported results, but its durability must be interpreted through the composition of earnings rather than headline status alone.
By the third quarter of 2025, Grab had delivered consecutive periods of GAAP profitability alongside sustained positive adjusted EBITDA at the group level. This outcome reflects a multi-year shift in operating posture. Incentive intensity across Mobility and Deliveries has been structurally reduced. Order density has improved. Fixed cost growth has been restrained relative to revenue. These changes have translated into real operating leverage, not a one-quarter anomaly.
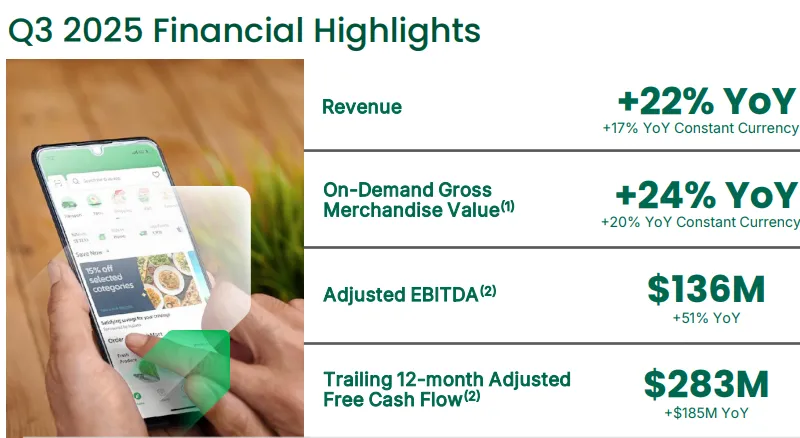
However, the sources of reported profitability matter. As of Q3 2025, Grab reported gross cash liquidity of $7.431 billion and net cash liquidity of $5.294 billion, after deducting loans and borrowings. That liquidity base generates meaningful finance income in a higher-rate environment. While this income supports GAAP profitability, it is not operating leverage. It fluctuates with interest rates and should not be capitalized as a permanent earnings contributor in a long-duration valuation framework.
Adjusted EBITDA offers a clearer view of platform economics, but it is not complete. Stock based compensation continues to be excluded from adjusted metrics, even as dilution remains an economic cost borne by shareholders. The presence of sustained adjusted EBITDA does indicate that core on-demand operations have crossed into a self-sustaining phase. It does not imply that per-share value creation scales linearly with reported margins.
The margin ceiling becomes apparent when these components are considered together. On-demand segments have benefited from lower incentives and higher monetization, including incremental contribution from advertising. At the same time, labor costs remain structurally sensitive to regulatory and political pressures.
Financial Services continues to absorb capital and provisioning expense during its growth phase, even as management guides toward breakeven in the second half of 2026. These forces place bounds on how far consolidated margins can expand, even under disciplined execution.
This is why the profitability pivot should be viewed as a regime change rather than an endpoint. Grab has moved from subsidized growth to controlled scale. It has demonstrated the ability to generate operating profits while maintaining platform relevance. What it has not demonstrated, and is structurally constrained from demonstrating, is unconstrained margin expansion comparable to developed-market platform peers.
The next question, therefore, is not whether Grab can remain profitable. It is how competition expresses itself once profitability becomes the baseline rather than the objective. That competitive evolution plays a central role in determining where margins settle over time and how much of today’s operating improvement can be sustained through the end of the decade.
5. Competition Did Not End. It Changed Form
The reduction in industry-wide subsidy intensity has altered how competition expresses itself across Southeast Asia. Market pressure has shifted away from platform-wide incentive wars toward targeted challenges that exploit cost structure, service differentiation, and regulatory asymmetry. These challenges do not need to displace Grab at the national level to influence economics. They only need to apply pressure at the margin in high-frequency markets.
In Vietnam, the most visible competitive disruption has come from Xanh SM, operated by GSM Group. Xanh SM entered the market with a vertically integrated electric vehicle fleet, allowing it to control vehicle supply, reduce per-trip operating costs, and standardize service quality.
Within its first year of scaled operations, Xanh SM achieved meaningful share in Hanoi and Ho Chi Minh City, at times ranking among the top ride-hailing providers by trip volume in those urban centers. Even where precise market share figures vary by source, the economic impact is clear. Vertical integration lowers breakeven pricing and weakens the assumption that independent driver networks always hold the cost advantage.
This form of competition does not require national dominance. Concentration in dense urban corridors is sufficient to influence pricing discipline and incentive behavior. Grab can remain the leading platform while still facing pressure on take dollars in the most economically important markets.
Indonesia presents a different competitive pattern. The largest incumbent competitor remains GoTo, whose Gojek platform continues to command significant share in ride-hailing and food delivery.
Rather than exiting the market, competition has fragmented further. Lower-cost aggregators such as inDrive and Maxim have expanded by targeting price-sensitive riders and drivers with simpler service offerings and reduced commission structures. These platforms do not replicate Grab’s ecosystem. They undercut pricing in specific segments.
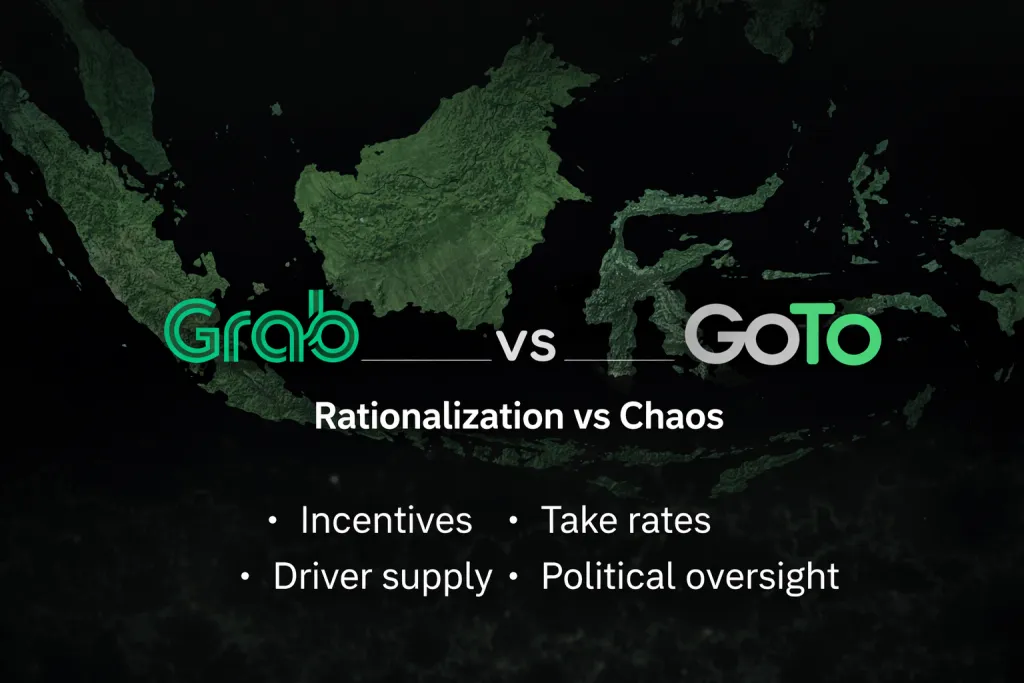
The result is tiered competition. Grab defends volume through budget options such as Saver tiers, which preserves gross transaction volume but compresses average order value and limits take-dollar growth. Reported take rates may appear stable at the consolidated level, but the underlying mix shifts toward lower-margin transactions. This dynamic explains why revenue can grow while margin expansion slows.
Across both markets, competition has become asymmetric. Some rivals prioritize cost efficiency through vertical control. Others prioritize price leadership through minimal service layers. Grab responds by preserving breadth and reliability rather than maximizing extraction. This choice supports platform relevance but constrains monetization.
The implication for valuation is not catastrophic. Competition does not invalidate Grab’s scale or durability. It establishes ceilings. Pricing power becomes situational. Incentive intensity declines but does not disappear. Margins expand, then flatten. These outcomes are consistent with a mature platform operating in emerging markets rather than a winner-take-most software marketplace.
This competitive reality interacts directly with regulatory exposure. When pricing, labor, and platform economics are politically visible, competitive behavior becomes inseparable from policy response. That interaction defines the next layer of constraint on margin durability.
6. Regulation & Labor as Persistent Margin Constraints
Regulation and labor costs function as recurring constraints on Grab’s economics rather than episodic shocks. As the platform has scaled and embedded itself into daily transportation and commerce, labor has become politically salient. That visibility has translated into formal policy responses that reset cost structures and narrow the range of monetization outcomes.
In Singapore, the introduction of the Platform Workers Act formalized protections for ride-hailing and delivery workers, including mandatory contributions that mirror elements of the CPF system. The economic implication is straightforward. Per-trip costs increase structurally, either through direct employer contributions or via higher platform fees. Demand elasticity limits the extent to which these costs can be passed through to consumers, particularly given the availability of public transportation. The result is a higher cost floor that persists across cycles and caps margin expansion in one of Grab’s most visible and regulated markets.
In Indonesia, labor dynamics are shaped less by codified frameworks and more by political sensitivity. Drivers are widely viewed as micro-entrepreneurs and a critical employment cohort. Periodic protests and public pressure have kept commission structures and fare adjustments under scrutiny. While Indonesia has not imposed uniform national caps comparable to Singapore’s formalization, the risk profile is different rather than lower. Pricing flexibility is constrained by the threat of intervention, which influences platform behavior even in the absence of explicit regulation.
These labor dynamics intersect with competitive behavior. When platforms face cost increases that cannot be fully passed through, competition shifts toward cost containment rather than price escalation. Lower-cost entrants can use simplified models or alternative labor arrangements to undercut pricing in specific segments, forcing incumbents to defend volume. This interaction reinforces the ceiling effect on margins that emerges from competition alone.
From a modeling perspective, this is why margin assumptions do not extrapolate recent improvements indefinitely. Regulatory and labor adjustments tend to ratchet costs upward in steps, while revenue and monetization adjust more gradually. Once protections are formalized, they rarely reverse. They become part of the baseline economics.
This does not undermine Grab’s viability. It clarifies the nature of the business. Grab operates as a scaled coordination platform within jurisdictions that treat mobility and delivery as essential services. That status confers durability and relevance, but it also invites oversight. Over time, that oversight translates into a margin profile that reflects negotiated balance rather than unconstrained extraction.
With regulatory and labor ceilings established, the next question is whether adjacent businesses can offset these constraints. Financial Services is the most commonly cited candidate. Its role within the platform requires careful framing to avoid overstating its contribution to long-term value creation.
7. Fintech as Support Infrastructure Rather Than a Profit Engine
Grab’s Financial Services segment exists for functional reasons rather than narrative ones. It was created to stabilize the economics of the core platform in markets where payments, credit access, and financial identity are fragmented, uneven, or costly to access through traditional banking systems.
At the platform level, fintech serves four primary purposes.
First, it reduces friction in payments. By embedding wallets and payment rails directly into the app, Grab lowers transaction failure rates, shortens settlement cycles, and improves conversion across Mobility and Deliveries. This directly supports gross transaction value by making rides and orders easier to complete, particularly in cash-heavy markets.
Second, it stabilizes driver and merchant supply. Access to working capital, float, and short-term credit improves participation and retention among drivers and merchants who operate with limited liquidity. This support is not designed to maximize lending margins. It is designed to reduce churn, smooth supply availability, and limit the need for platform-funded incentives during demand fluctuations.
Third, it enables monetization in ways that avoid direct price increases. Credit, wallet usage, and embedded financial products allow Grab to support higher order frequency and merchant activity without raising commissions or consumer fees. This functions as an indirect lever on GMV and monetization that is less visible to regulators and less sensitive to price elasticity than explicit take rate increases.
Fourth, it generates data that improves unit economics. Transaction histories, repayment behavior, and merchant cash flow patterns improve underwriting and pricing across the ecosystem. That data advantage feeds back into advertising efficiency, risk management, and incentive calibration rather than standalone financial returns.
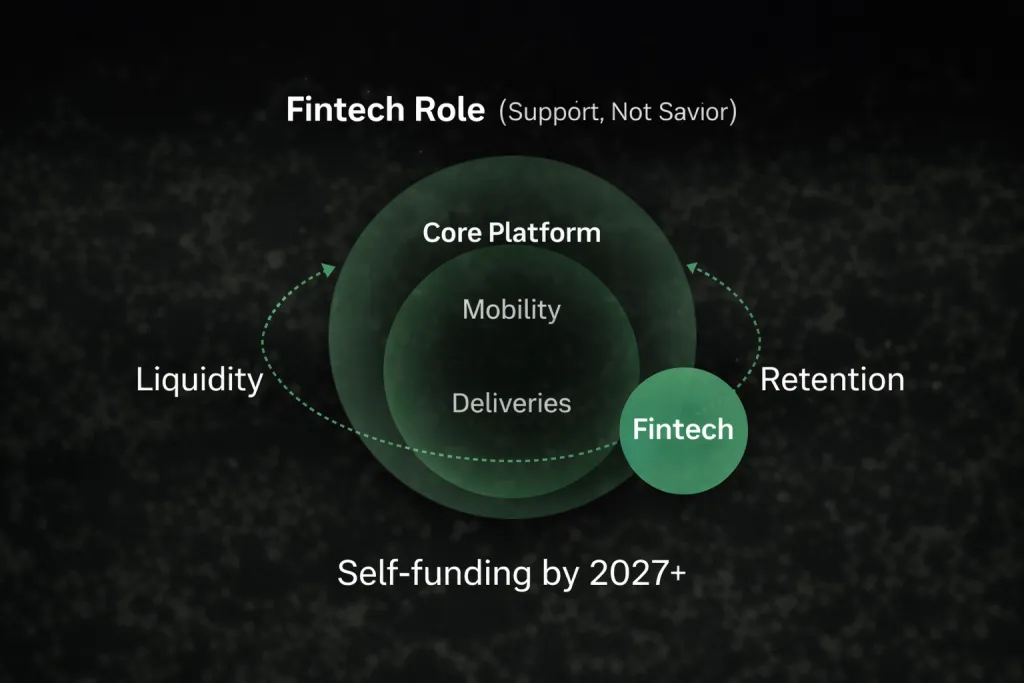
These functions explain why Grab invested heavily in Financial Services despite near-term losses. As of Q3 2025, the segment continued to operate at an adjusted EBITDA loss, with Q2 2025 losses of approximately $26 million, driven primarily by credit provisioning as lending scaled. Management has consistently guided toward adjusted EBITDA breakeven in the second half of 2026. That timeline supports the assumption that Financial Services becomes self-funding beginning in 2027.
The balance sheet provides the buffer required to execute this strategy. As of Q3 2025, Grab reported gross cash liquidity of $7.431 billion and net cash liquidity of $5.294 billion, after loans and borrowings. This liquidity allows the company to absorb fintech volatility without compromising the economics of Mobility and Deliveries. It also limits the need to pursue aggressive growth in lending volumes that would increase risk.
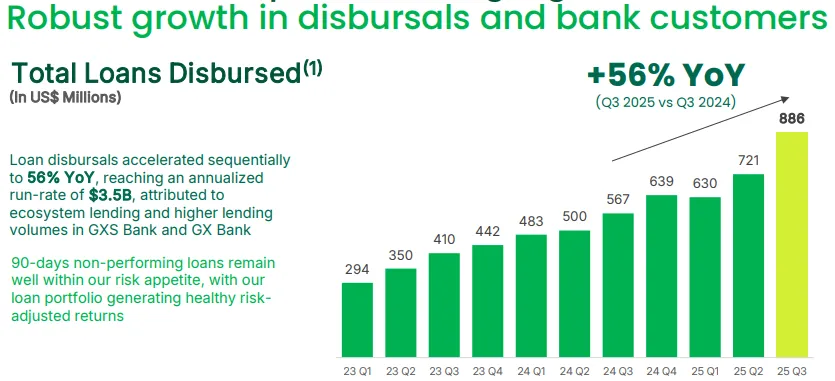
What Financial Services is not designed to do is generate bank-like returns on equity or drive a consolidated multiple re-rating. Credit provisioning introduces cyclicality that core on-demand operations do not face. Regulatory frameworks around digital banking and lending remain in flux across Southeast Asia. These factors cap the reliability and scalability of fintech profits over a full cycle.
For modeling purposes, fintech is treated as infrastructure. Losses narrow and eventually stabilize. Capital absorption declines. The segment stops consuming group liquidity. The value it creates appears indirectly through improved retention, higher frequency, lower incentive intensity, and better monetization elsewhere in the platform.
This framing is deliberate. It recognizes why fintech exists, why Grab continues to invest in it, and why it should not be allowed to dominate the valuation narrative. The upside in this model comes from operating leverage and monetization within the core platform, not from transforming Grab into a financial institution.
Next section addresses the monetization layer that operates directly inside that core flow and carries structurally higher margins without introducing balance sheet risk.
8. Advertising as a Margin Lever Inside the Ecosystem
Advertising is the cleanest source of incremental margin inside Grab’s on-demand stack. It monetizes intent that already exists, and it does so without importing the labor sensitivity that caps Mobility and Deliveries margins. The company’s own disclosures in 2025 show advertising scaling as a measurable layer on top of Deliveries GMV, with improving penetration and rising merchant spend.
In Q1 2025, Grab reported that Advertising revenue as a percentage of Deliveries GMV expanded to 1.7%, up from 1.3% in the prior year period, and stable versus Q4 2024. Over the same quarter, the number of monthly active advertisers on the self-serve platform increased 49% year over year to 191,000, while average spend per monthly active advertiser increased 30% year over year. Deliveries segment adjusted EBITDA as a percentage of GMV improved to 2.0% from 1.6%, with the improvement attributed primarily to higher advertising contribution and operating leverage.
By Q2 2025, Grab quantified the advertising ramp more directly. It stated that Advertising revenue grew 45% year over year to an annualized run-rate of $236M. In the same quarter, advertising penetration rose again, with Advertising revenue as a percentage of Deliveries GMV at 1.7%, up from 1.4% in the prior year. Self-serve platform breadth expanded to 220,000 quarterly active advertisers, up 31% year over year, while average spend per quarterly active advertiser increased 42% year over year. Deliveries segment adjusted EBITDA as a percentage of GMV improved to 1.8% from 1.5%, with management again attributing the improvement primarily to increased advertising contribution and operating leverage.
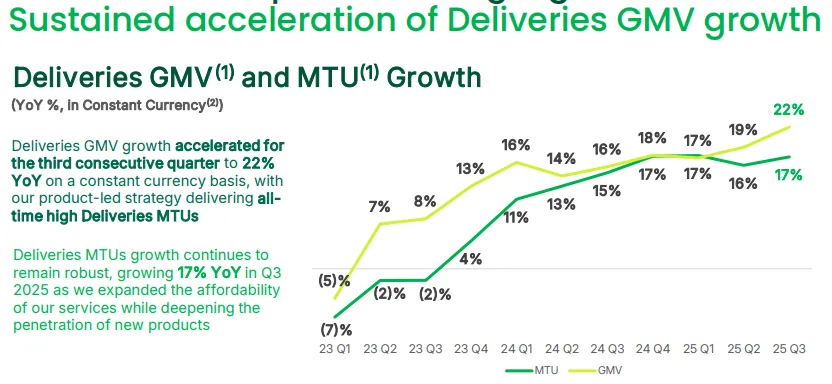
In Q3 2025, the same pattern continued. Deliveries GMV rose to $3.733B, up 26% year over year, and Deliveries segment adjusted EBITDA as a percentage of GMV increased to 2.1% from 1.8%, with management citing increased advertising contribution and operating leverage as the drivers. The merchant-side advertising base continued to broaden, with 228,000 quarterly active advertisers, up 15% year over year, and average spend per quarterly active advertiser up 41% year over year.
The interpretation is narrow. Grab is disclosing three concrete things that matter for the model. First, ad penetration has reached 1.7% of Deliveries GMV and has held that level across multiple quarters, implying that the ad layer is no longer experimental.
Second, advertiser count and spend per advertiser are compounding simultaneously, which supports continued growth even if penetration advances slowly.
Third, the Deliveries segment’s EBITDA margin has improved from 1.6% in Q1 2024 to 2.0% in Q1 2025, then to 2.1% in Q3 2025, and management has repeatedly tied that margin lift to advertising contribution rather than to aggressive fee expansion.
For this thesis, advertising functions as a margin lever that can raise consolidated EBITDA without requiring additional subsidy intensity or regulatory negotiation. We do not need to invent an explicit ads revenue forecast to incorporate this properly. The disclosed penetration and growth metrics already justify why base and bull scenarios can support higher consolidated EBITDA margins over time while still respecting the structural ceiling imposed by labor and competition.
Next section moves to the mechanics of the scenario framework, the EV/EBITDA method, and how each lever is backsolved to a per-share target.
9. Scenario Framework and Valuation Methodology
This thesis is structured around a constrained scenario framework rather than a single forecast. The objective is not to identify a point estimate, but to map a bounded range of outcomes that emerge from explicit operating assumptions and translate cleanly into enterprise value.
All scenarios are built from the same base inputs. The anchor revenue run-rate is approximately $4.0B, reflecting the consolidated business exiting 2025. The terminal year is 2030, which allows operating leverage, monetization layers, and capital discipline to express themselves without relying on short-cycle timing assumptions. Valuation is anchored on EV to EBITDA, with per-share outcomes derived only after enterprise value is established and net cash is added back.
EBITDA is used as the primary operating metric for three reasons.
First, stock-based compensation remains a real economic cost that distorts per-share earnings in the near to medium term.
Second, foreign exchange translation introduces noise into reported net income that does not reflect underlying platform performance.
Third, the Financial Services segment introduces accounting complexity that obscures consolidated earnings power before it reaches self-funding status.
EBITDA provides the cleanest bridge between operating scale and valuation in this context.
The framework deliberately limits the number of moving parts. Across all scenarios, only five variables change:
- Revenue compound annual growth rate from 2025 through 2030
- Consolidated EBITDA margin in 2030
- Terminal EV to EBITDA multiple
- Net cash position in 2030
- Share count, adjusted only in the consolidation scenario
All other assumptions are held constant. Country-level financials are not modeled. Take rates are not forecast explicitly. Advertising is not broken out as a standalone revenue line. Fintech is not treated as a profit engine. These decisions are intentional. They avoid false precision and keep the model auditable.
Revenue growth assumptions are informed by disclosed GMV and revenue trends across Mobility and Deliveries in 2025. Mobility has demonstrated high-teens to low-twenties GMV growth with transaction growth outpacing GMV, indicating volume-driven expansion rather than pricing.
Deliveries GMV has grown at a faster rate, with advertising contributing incremental revenue and margin. These data points define the feasible growth envelope across scenarios rather than dictating a single path.
Margin assumptions are constrained by observed segment economics. Mobility EBITDA margins have reached the high single digits, improving gradually quarter over quarter. Deliveries margins have moved from the mid-one percent range toward just over 2% of GMV, driven in part by advertising.
Financial Services losses are narrowing, with management guiding to adjusted EBITDA breakeven in the second half of 2026. Together, these trends support margin expansion over time while making unconstrained outcomes implausible.
Terminal multiples reflect both platform quality and regional risk. Southeast Asia imposes higher political, regulatory, and currency risk than developed markets. Even in strong execution scenarios, multiples are capped below those of comparable United States platforms. In weaker scenarios, margin pressure and oversight justify compression.
Net cash is treated as strategic capacity rather than a passive asset. As of Q3 2025, Grab reported gross cash liquidity of $7.431B and net cash liquidity of $5.294B. Scenario assumptions adjust this figure based on free cash flow generation, reinvestment needs, capital returns, and, in the consolidation case, integration costs and dilution. Cash is added back to enterprise value only after operating outcomes are established.
Each scenario is fully backsolved. Revenue growth produces a 2030 revenue base. Margins convert that base into EBITDA. Multiples translate EBITDA into enterprise value. Net cash converts enterprise value into equity value. Share count converts equity value into a per-share outcome. No price target appears without this chain being explicit.
This structure is what allows the scenarios that follow to be compared meaningfully. Differences in outcomes are driven by changes in operating reality, not by shifting narrative emphasis. With the framework established, the analysis can now turn to the downside case and work upward from constraint rather than optimism.
Northwise Premium
Choose how to continue with Northwise
Join Northwise Premium
Unlock the rest of this report, its complete valuation, the downloadable model, portfolios, and action framework.
Join Northwise PremiumCreate a Free Account
Continue across Free Northwise research, follow companies, save reports, and receive updates.
Create a Free Account
GRAB Stock Forecast 2030: What the Next Ride Earns
Northwise models Grab through 2030: rides, delivery, advertising, lending, cash flow and dilution, with operating scenarios and Premium valuation analysis.

Grab Advertising
Grab advertising is lifting delivery margins through intent-based monetization that avoids labor costs, increased regulation, and pricing scrutiny.

Grab’s Fintech Business
Grab’s fintech business is infrastructure, not upside. Lending, payments, and ads stabilize drivers and merchants and narrow valuation errors.
Northwise Portfolios
See how the research becomes real decisions
Reader discussion
Discuss the research
Premium access is required to join this report's discussion.
Join Northwise Premium
No comments yet. Start a thoughtful discussion.