GRAB Stock Forecast 2030: What the Next Ride Earns

Northwise models Grab through 2030: rides, delivery, advertising, lending, cash flow and dilution, with operating scenarios and Premium valuation analysis.
In this article
More customers are using Grab for more of their day. Turning that habit into lasting earnings requires the service to work for the passenger, the driver and the merchant before it can work for shareholders.
Updated September 15, 2026

A taxi carrying a passenger from Singapore into Malaysia has two journeys to think about. The outward trip earns a fare. The return trip can consume some of it through fuel, vehicle costs and time spent driving an empty car.
Grab’s cross-border service offered a way to improve that calculation. Passengers could book through the app, while licensed drivers could find return passengers at designated pickup points. Restrictions on where those journeys could begin still applied, but a vehicle that had to make the trip anyway had more opportunities to earn from it.[1]
Grab is the Singapore-based company behind an app used to book rides, order meals and groceries, make payments and access financial services across Southeast Asia. A customer might encounter it while looking for a taxi, then return to order dinner or arrange a delivery for a small business. Its shares trade on Nasdaq under GRAB, and by the second quarter of 2026 it was reporting nearly 54 million monthly transacting users.[2][2a]
The taxi’s return journey is a useful introduction to the company because it reveals the kind of improvement Grab needs to keep making. In a price-sensitive market, charging more is not always the best route to better earnings. Helping a driver complete more paid work, or a restaurant serve another profitable order, can leave more money available without making the service unaffordable.
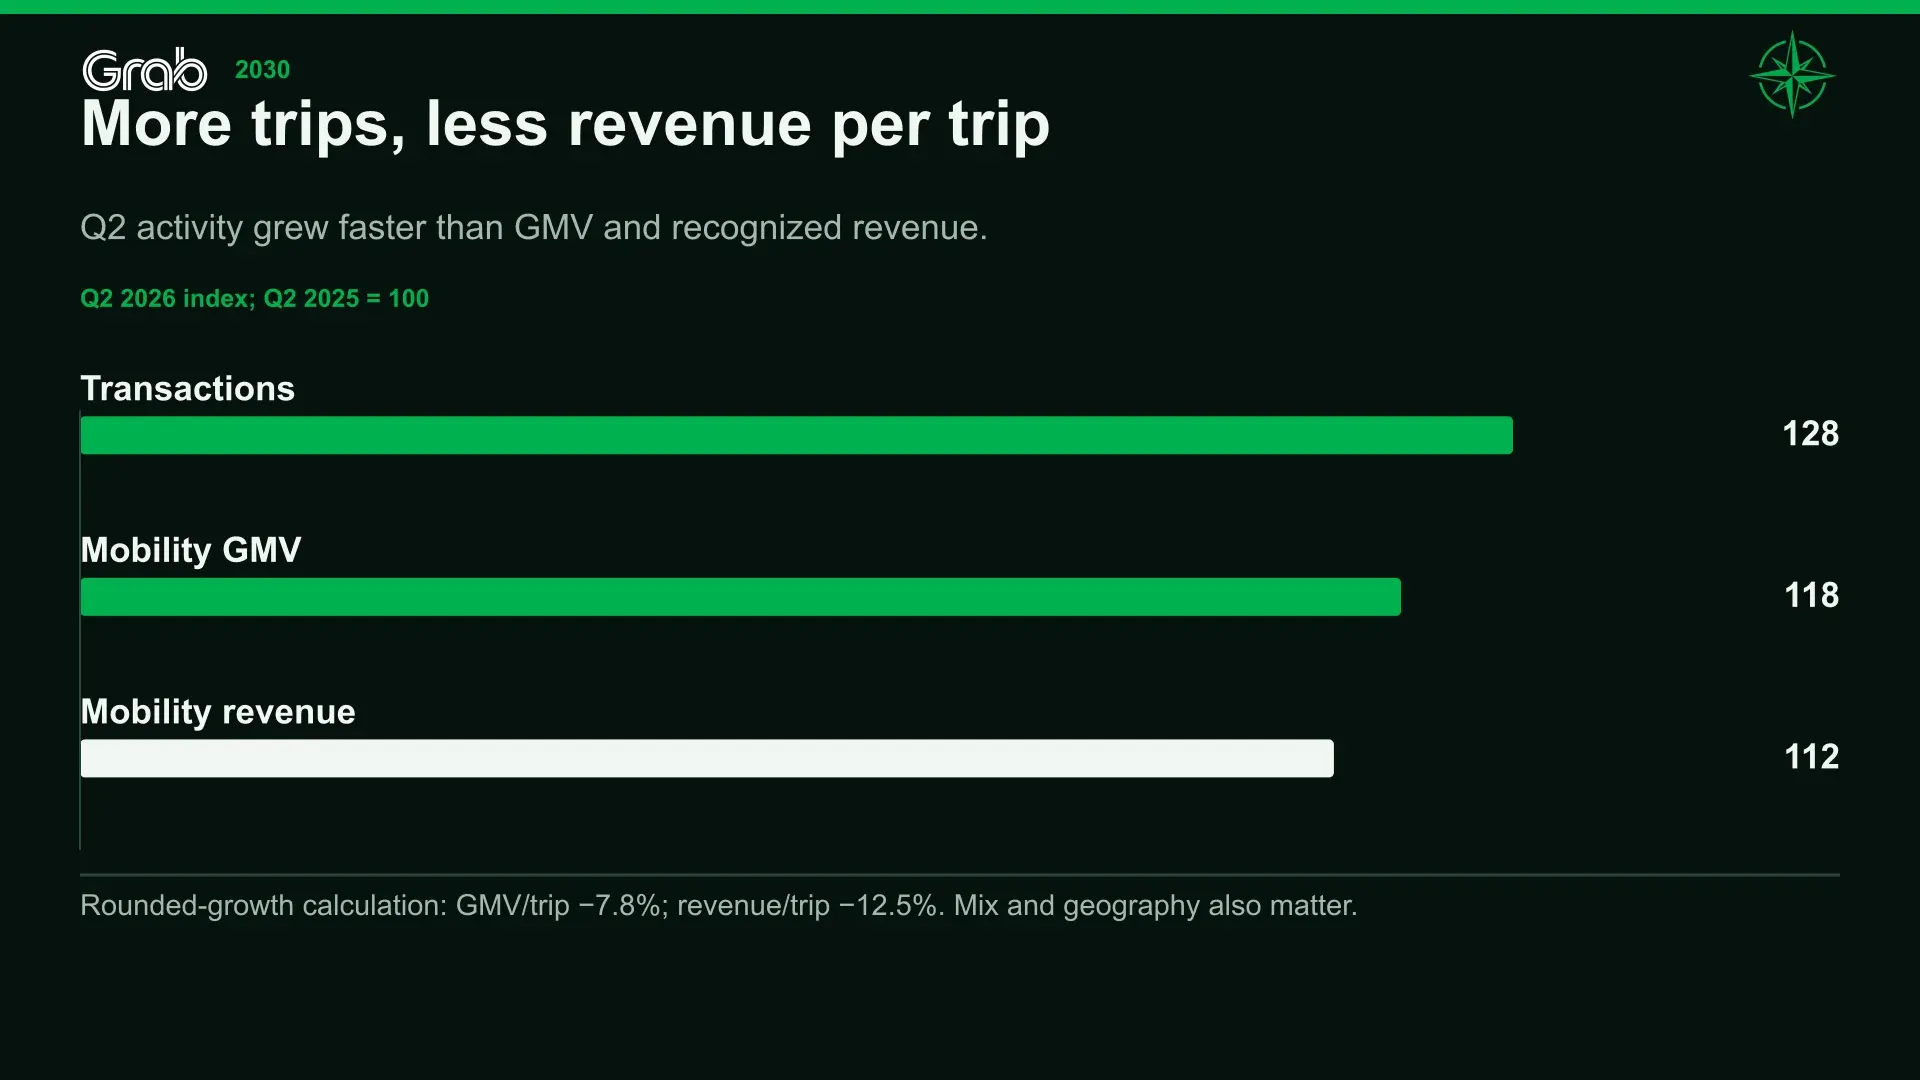
The second-quarter results suggest that Grab is finding some of those improvements. Mobility transactions increased 28% from a year earlier, while their value increased 18% and recognized revenue grew 12%. Segment adjusted EBITDA, its operating earnings measure before several expenses, increased 16% to $191 million. The company was collecting less revenue per transaction on average, but earning more across the business.[2][2a]
There is room for a serious disagreement about the quality of that growth. Grab spent approximately $706 million on partner and consumer incentives during the quarter. On-demand incentives rose to 10.9% of transaction value, up 72 basis points from the previous year. A skeptic could reasonably argue that the company is still spending heavily to keep customers and drivers engaged, just with a more developed product range surrounding the promotions.[2][2a]
We think that interpretation understates the earnings opportunity, although it identifies a real constraint. Grab has more ways to earn from its customer relationships than it did when the debate centered on whether ride-hailing could stop losing money. Advertising is contributing more to Deliveries, while the financial businesses have a plausible route to direct profits rather than merely supporting activity elsewhere in the app.
Our forecast gives those opportunities room to develop. It also charges the credit losses, capital requirements, corporate expenses and dilution needed to support them. The resulting business outlook is substantially stronger than our previous coverage allowed, but it depends on improvements we can identify and follow. The customer’s budget, the driver’s working day and the restaurant’s margin remain central to the investment case.
1. Several businesses behind one app
Grab’s core operations span Cambodia, Indonesia, Malaysia, Myanmar, the Philippines, Singapore, Thailand and Vietnam. It offers services in more than 900 cities, although the usefulness of the network still has to be established locally. A broad regional footprint does not help a passenger waiting for a driver who is unavailable nearby.[2][2a]
The company reports three major businesses. Mobility includes ride-hailing and vehicle rentals. Deliveries includes meals, groceries and other merchant activity, with advertising reported inside the segment. Financial Services combines payments, lending and banking and now includes the U.S. investing platform Stash. A small Others segment contains activities that are not individually material.
The app makes those services appear closely connected. The accounts show how differently they earn money.
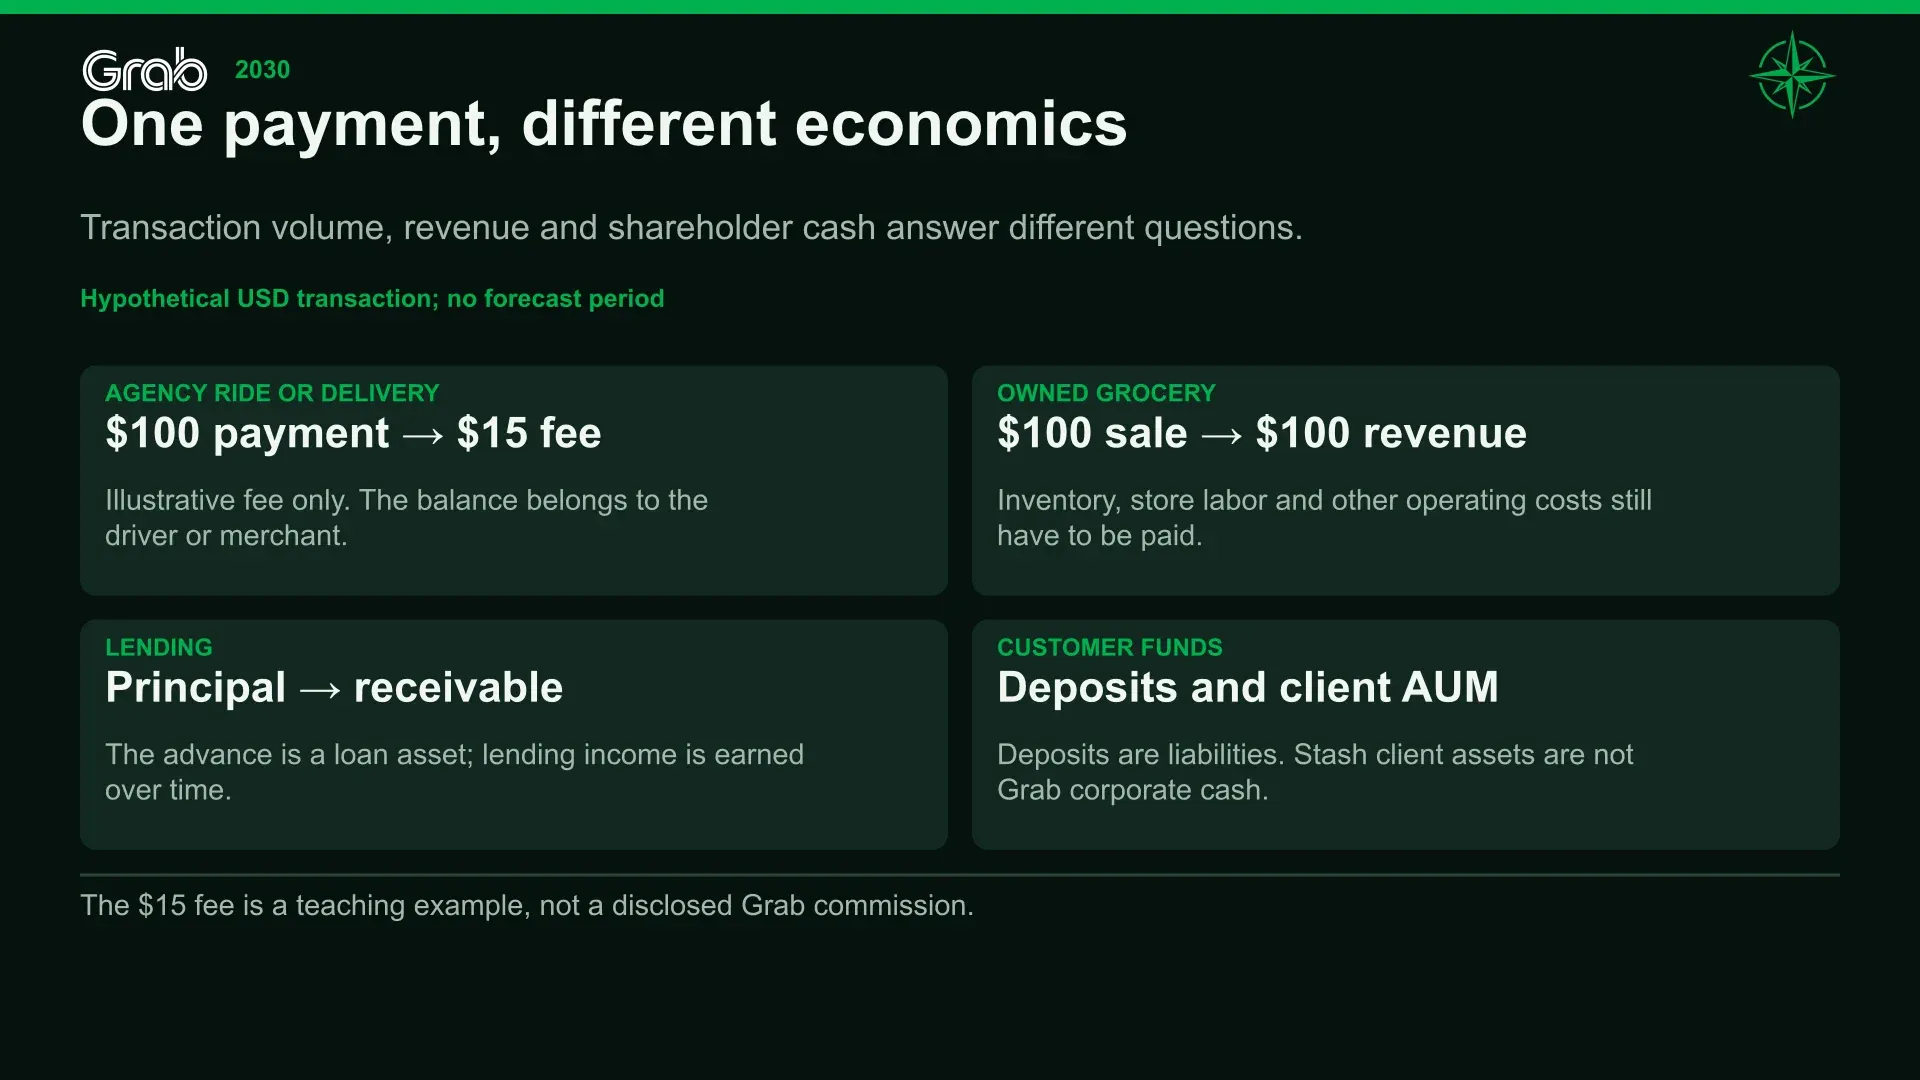
In a marketplace transaction, much of the customer’s payment belongs to the merchant or driver. Depending on the arrangement, Grab recognizes its fee rather than the entire purchase. An owned supermarket can recognize the full sale of groceries, then record the inventory and operating costs needed to make that sale.
Consider two hypothetical $100 purchases. A marketplace earning a $15 fee could recognize $15 of revenue. A retailer selling $100 of its own inventory could recognize $100, even if its eventual profit were smaller. A shift toward owned retail would increase reported revenue without creating a proportionate increase in earnings.
Grab’s gross merchandise value, or GMV, measures the dollar value of activity across its products and services. Its definition includes certain taxes, tips and fees, offline supermarket sales, and supporting services such as advertising and vehicle rentals. Dividing revenue by GMV therefore does not reveal one universal commission charged to drivers or merchants.[3]
Incentives require similar care. Many discounts and partner incentives already reduce the revenue Grab recognizes; certain delivery-partner incentives appear in costs instead. Our revenue yields and margins incorporate those economics. Subtracting the entire incentive bill again would charge the same spending twice.[3]
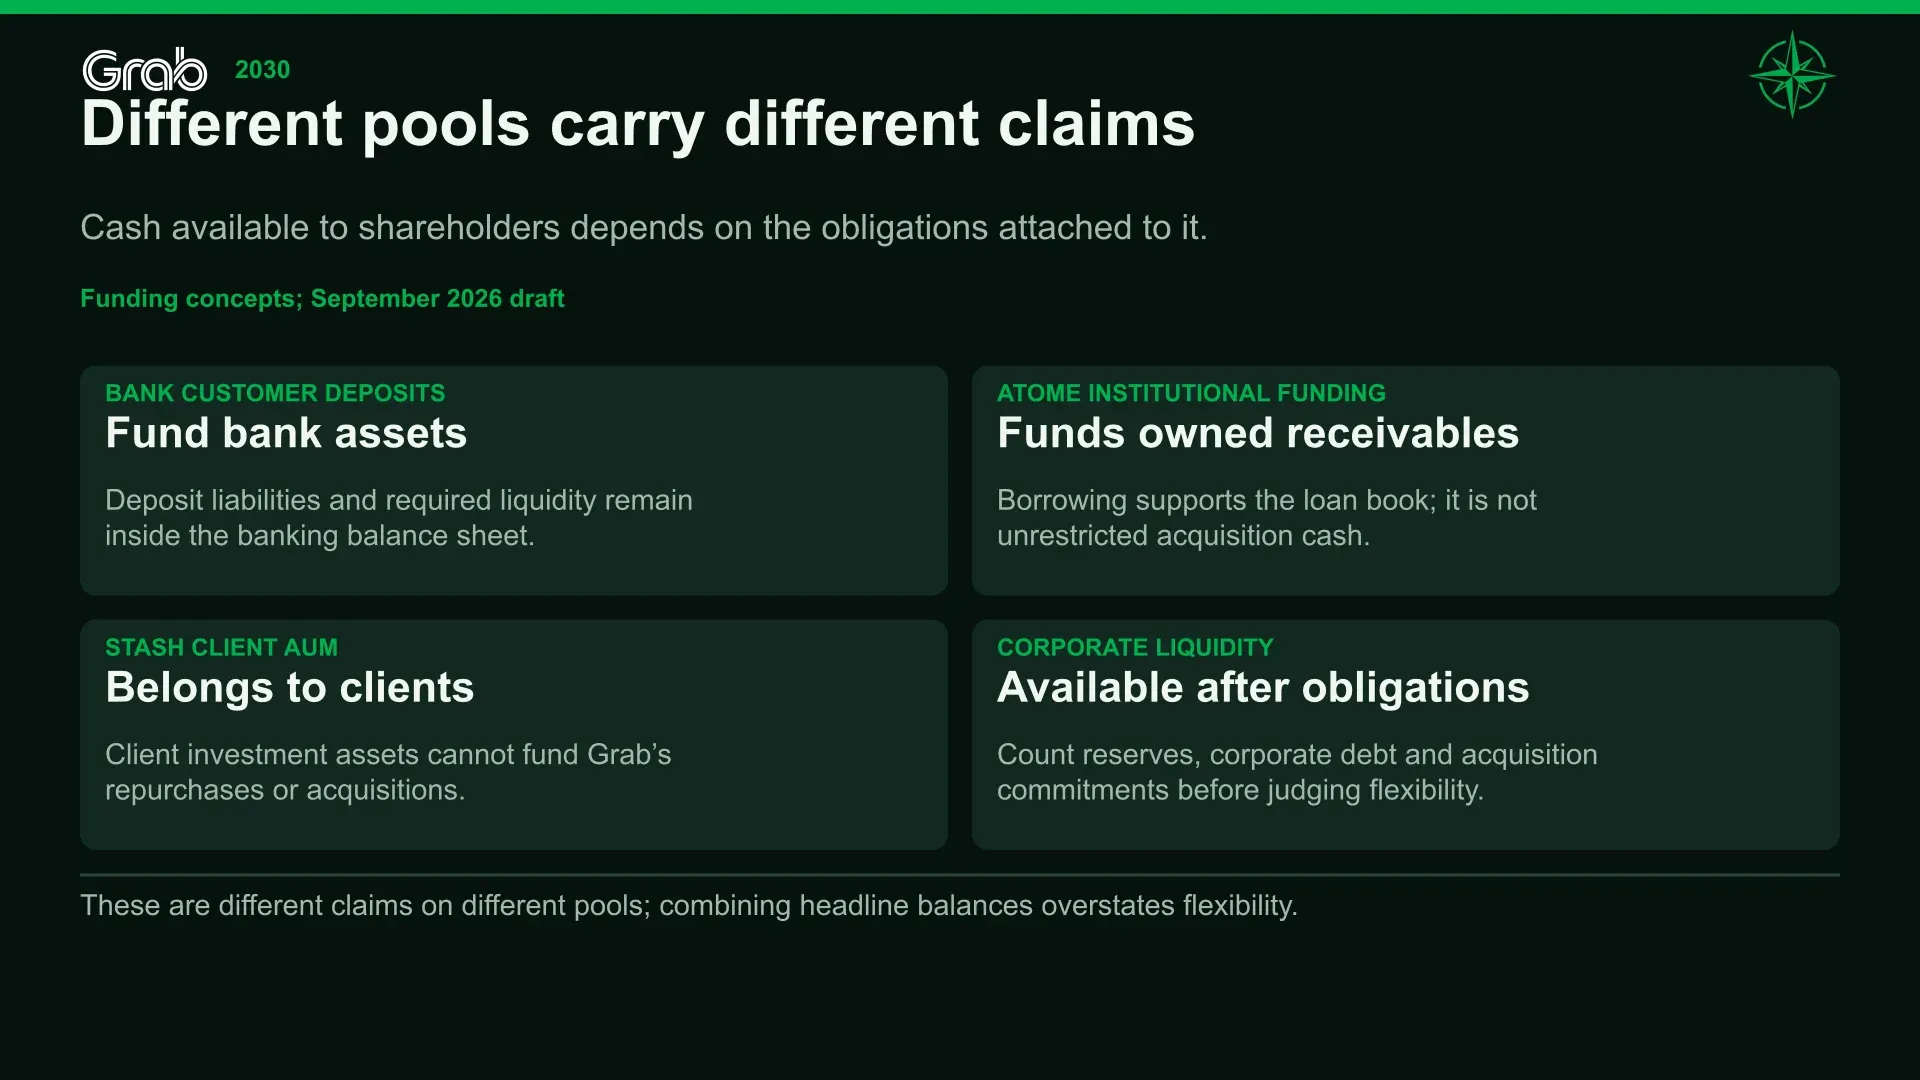
The financial businesses introduce further differences. A loan disbursement creates a receivable; it is not revenue equal to the amount lent. A bank deposit is money owed to a customer. Assets managed through Stash belong to its clients. These balances describe the scale of a financial relationship, but cannot all be counted as money earned or owned by Grab.
Where the revenue comes from
Reported 2025 revenue | USD millions |
|---|---|
Malaysia | 1,039 |
Singapore | 727 |
Indonesia | 715 |
Philippines | 316 |
Thailand | 288 |
Vietnam | 255 |
Remaining Southeast Asian markets | 30 |
Total | 3,370 |
Reported 2025 revenue, from Grab’s annual report.[3]
Malaysia’s contribution includes the owned-supermarket business alongside platform activity. Its share of reported revenue should not be read as its share of Grab’s market position or profits.
Our forward country allocation is illustrative rather than a country-by-segment earnings model. Historical revenue provides a useful picture of exposure, but it does not supply a reliable profit forecast for every service in every market. The acquired consumer-credit business is kept geographically separate where its future revenue allocation is not disclosed.
2. Convenience has to fit the household budget
Southeast Asia offers Grab a large pool of potential customers. Population alone, however, is a poor starting point for an earnings forecast. A household needs more than a smartphone to become a frequent, profitable customer. It needs a reason to use the service, confidence that it will work and enough disposable income to pay for the convenience.
We see the long-term opportunity in how that calculation changes. Higher incomes can make outsourcing a shopping trip or journey more attractive. Better availability and lower fees can make a service worthwhile even before a household’s income has risen very far. Grab can grow faster than the economy by reaching more customers and serving more occasions within their existing budgets.
That requires much more than a favorable regional growth rate. The Asian Development Bank’s July outlook projected 4.6% growth for developing Southeast Asia in 2026, while warning about weaker external demand and higher commodity costs. Our forecast has Grab’s revenue growing much faster over the coming years. The measures are not directly comparable, since real regional GDP and a company’s nominal dollar revenue cover different things, but adoption, frequency and monetization must supply much of the underlying growth.[6]
A local-services business is not insulated from international trade simply because it sells rides rather than exports. A factory worker’s overtime, a hotel employee’s shifts or a merchant’s sales may depend on demand originating abroad. We view trade and tourism conditions as influences on the income available to spend through Grab, rather than looking only for a direct tariff exposure in its accounts.
Fuel connects the macroeconomy to the app even more quickly. A driver needs more money to complete a trip at the same time that a passenger may have less left after paying other household bills. Restaurants face higher delivery and ingredient costs. Some of those drivers, merchants and consumers are also borrowers. The ADB’s July assessment highlighted the spread from energy disruption into production costs and broader price pressures.[6]
Cheaper service tiers give Grab a way to respond. Retaining a customer who trades down to Saver can be better than losing the transaction entirely. We would not treat that as a reliable recession hedge. A lower-priced ride still competes with public transport, a personal vehicle or deciding not to make the trip. Keeping the customer and preserving the profit on that customer are separate achievements.
There is a related weakness in the argument that lower regional wages automatically make delivery economics attractive. Lower wages can reduce fulfillment costs, but lower incomes can also limit what customers are willing to pay to save time. We expect productivity and repeat usage to improve that relationship; we do not assume a developed-market convenience budget will appear simply because an app is available.
Acquisitions contribute to the consolidated growth forecast as well. We separate that purchased revenue from growth in rides, delivery spending and the financial products Grab already distributes. A stronger group growth rate after consolidation is not proof that existing customers have suddenly begun spending faster.
The dollar investor has another variable
Grab earns much of its revenue in local currencies and reports in U.S. dollars. In Q1, revenue grew 24% as reported but 19% at constant exchange rates. Currency helped that comparison. It will not always do so.[1]
For illustration, 15% local-currency growth combined with a 5% decline in the currency’s dollar value produces 9.25% dollar growth. Local costs may translate lower too, so this does not necessarily imply a weaker local operating margin. It does change the dollar earnings available to shareholders.
Our Base forecast assumes neutral currency translation. The Bear case includes adverse translation, and a separate stress applies a persistent 5% annual headwind. Regional growth and currency movements are modeled separately rather than assuming a good local business will deliver the same growth rate in dollars.
3. The driver’s working day
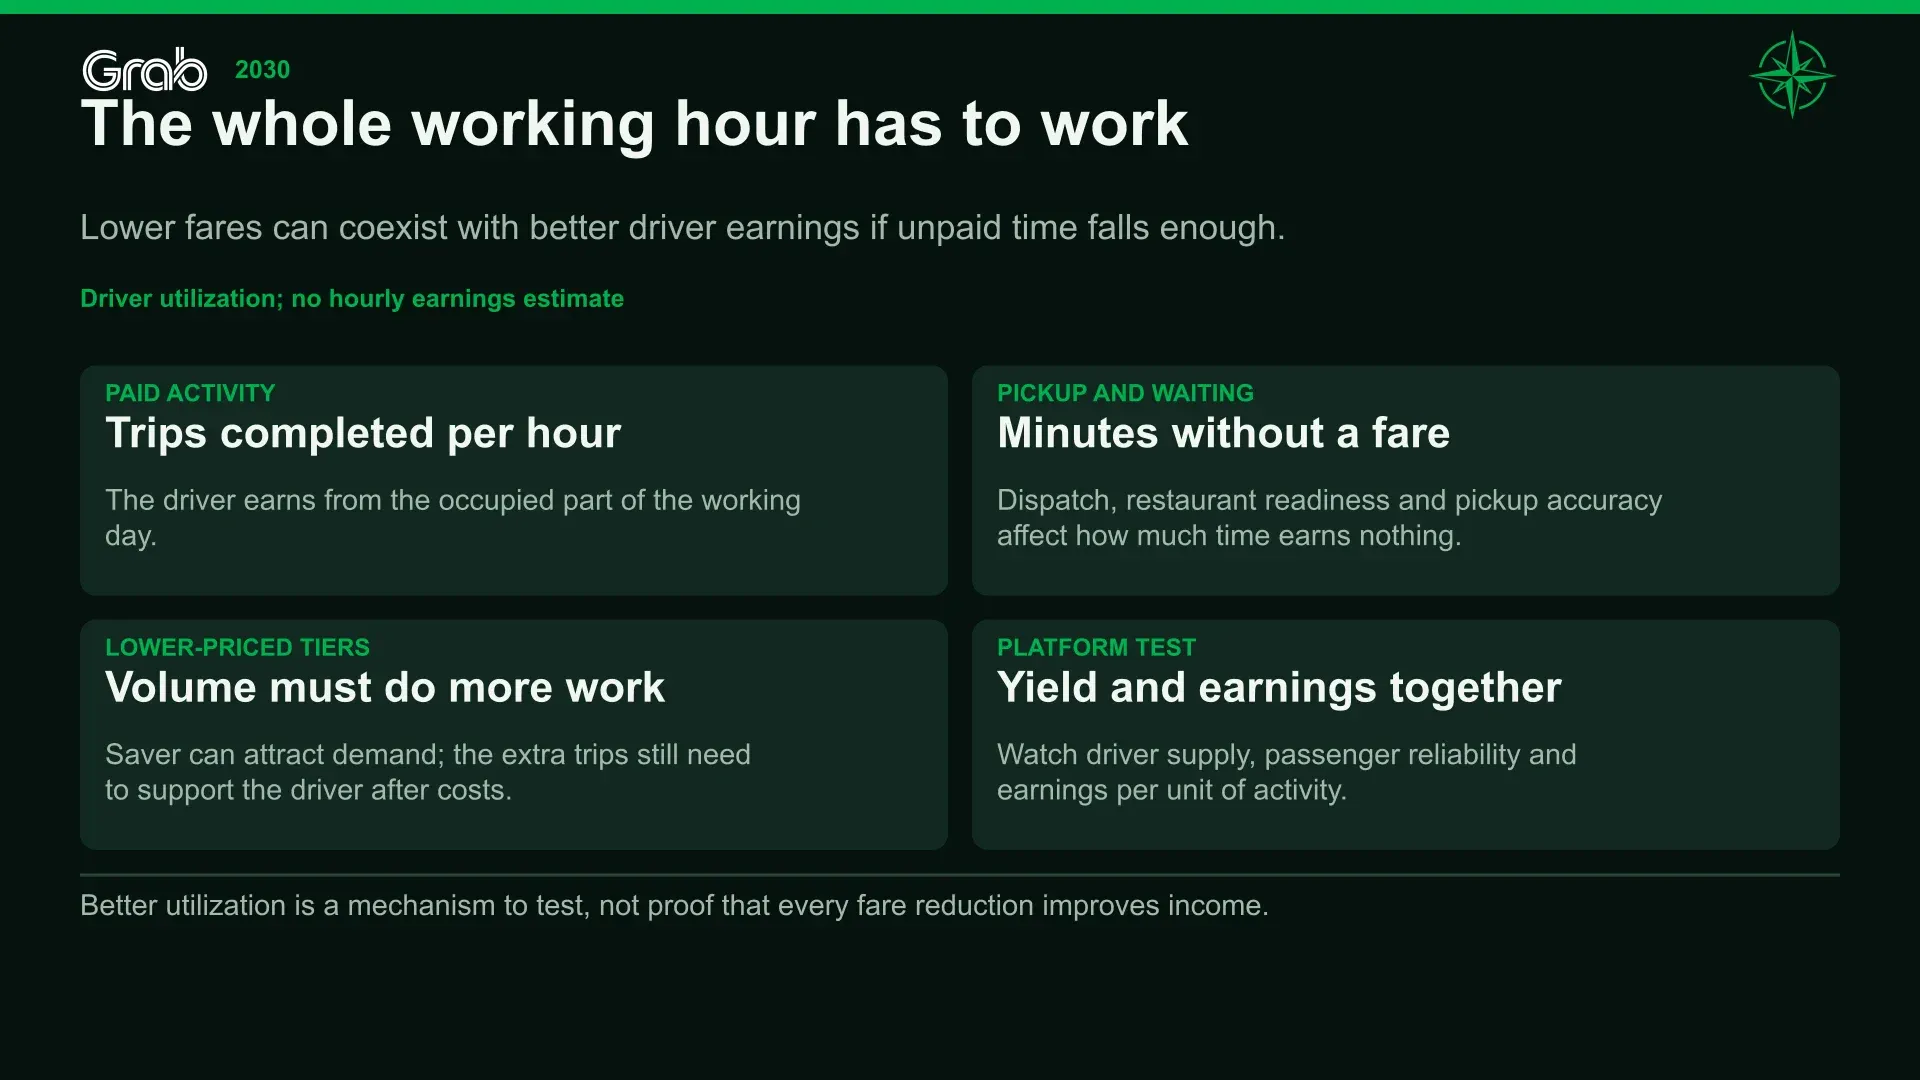
A passenger usually judges a ride by the quoted fare, pickup time and reliability. A driver has to judge the whole working day, including the minutes spent waiting, traveling to pickups and repositioning without a passenger.
Grab has to make those interests compatible. A lower fare can work if the driver completes more paid activity per hour. A higher fare can still be unattractive if too much of the day is spent earning nothing.
The company’s product range increasingly reflects those different needs. In Q2, one in four new Mobility users entered through a Saver ride. At the other end of the market, high-value rides grew more than twice as quickly as overall transport activity, supported by corporate customers seeking reliability and comfort.[2][2a]
This is more promising than trying to make every passenger pay a higher price. It also complicates the headline growth rates. A changing mix of trips, including more affordable services, can cause transactions to grow much faster than GMV and revenue.
Mobility generated $2.214 billion of GMV, $331 million of revenue and $191 million of adjusted EBITDA in Q2. Its EBITDA margin was 8.6% of GMV, slightly below the previous year as incentives were directed toward driver supply. The monthly active driver base grew 19%.[2][2a]
Adjusted EBITDA needs a brief explanation because it appears throughout our forecast. EBITDA stands for earnings before interest, taxes, depreciation and amortization. Grab’s adjusted version also excludes stock-based compensation and selected other expenses. Segment figures exclude shared regional corporate costs. It helps compare operating progress, but is not the final income belonging to shareholders.[3]
We expect Mobility to remain the largest individual source of segment earnings through 2030. The Base forecast takes GMV from $9.23 billion in 2026 to $15.57 billion in 2030, with revenue reaching $2.27 billion and adjusted EBITDA $1.40 billion. After the specific Indonesian commission reduction, the EBITDA margin is approximately 9.0% of GMV.
The improvement is gradual. Most of the additional profit comes from a larger volume of activity at modestly better economics. That leaves room for continued driver support and competitive pricing, rather than assuming scale gives Grab an unrestricted ability to increase its share of every fare.
The bearish interpretation remains straightforward: lower-value service mix, higher driver support and competitive promotions could absorb more of the utilization benefit than we expect. We would become less confident if transactions continued growing strongly but the revenue and earnings generated from that activity deteriorated for a sustained period.
4. Who absorbs the next cost increase?
The shareholder’s margin forecast is another person’s income statement.
For a driver, a larger platform deduction or fuel bill can reduce the value of a day’s work. For Grab, insufficient driver earnings can lead to weaker supply, longer waits and additional spending to keep partners active. Governments have their own reasons to intervene when a widely used transport service becomes an important source of employment.
Indonesia’s commission change brought those interests into direct negotiation. The June implementation announcement specified an 8% commission structure for two-wheel passenger ride-hailing from July 1, down from the previous 20% cap. The change is severe for the affected service, but does not apply to every Grab ride, order or financial transaction.[7]
Management described the affected ojol, or motorcycle passenger ride-hailing, activity as less than 6% of total Mobility GMV. Our forecast uses a 5.5% exposure estimate and applies the twelve-percentage-point reduction to that portion of the business.[1]
We assume changes in the surrounding economics offset 15% of the direct loss in H2 2026, rising to 55% by 2030. After those offsets, the modeled reduction is approximately $27 million in the second half of this year and $46 million in 2030. The offsets are Northwise assumptions; the evidence does not establish that Grab will recover a precise share of the lost commission.
The broader issue is how far similar obligations spread. Singapore’s Platform Workers Act introduced requirements covering statutory contributions, work-injury compensation and worker representation. Grab disclosed that it increased platform fees to help offset the associated costs.[3]
Such protections can improve the durability of the labor relationship while reducing the economics retained by the platform. We consider that part of the cost of operating a lasting business. The commercial test is whether service quality and productivity absorb enough of the increase, or whether customers accept it through higher fees.
Passing through a cost is not the end of the analysis. Higher fees can reduce demand, encourage customers to select cheaper tiers or improve the appeal of competing services. Holding prices steady can protect usage while lowering margins.
A small direct exposure to one rule therefore does not eliminate broader regulatory risk. Our stresses include deterioration in Mobility and Deliveries margins across the business, not just the loss associated with one service in Indonesia.
5. A regional platform still faces local competition
A competitor does not need to recreate Grab’s entire app to interfere with its returns.
It can offer a driver a lower commission, persuade a restaurant to direct orders through its own channel or provide more consistent vehicles in one city. The customer may continue using Grab for other services. A broad relationship can survive while a profitable part of it moves elsewhere.
Grab identifies competitors including Gojek, Foodpanda, ShopeeFood, Line Man Wongnai, Xanh SM, Bolt, inDrive and Maxim, alongside taxis, public transport, personal vehicles and merchants’ own ordering channels. Its annual report also acknowledges that businesses focused on fewer services or markets can concentrate resources more narrowly and operate with lower overhead.[3]
We see Grab’s breadth as an advantage when customers genuinely find several services useful. It is less persuasive when used to excuse weak economics in one business because another might eventually benefit. Each major segment needs a credible contribution before the group’s shared costs are deducted.
The proposed Uber–Delivery Hero combination adds a significant competitive consideration. The July agreement includes Foodpanda businesses in several of Grab’s markets and envisages completion in the second half of 2027. The companies say they will continue operating independently until closing. A completed transaction could bring greater resources to existing competitors, although that outcome should not be treated as already achieved.[8]
There is also a contractual question. Grab’s annual report says its non-compete with Uber expires one year after Uber disposes of all its Grab holdings. A departure from Grab’s board does not establish that every share has been sold or that the agreement has been waived. Grab’s August remarks continued to refer to dialogue with Uber as a shareholder.[3][2][2a]
We reflect competitive pressure through customer growth, revenue yield, incentives and operating costs. This makes the forecast sensitive to the cost of defending the business without pretending to know the outcome of every pending transaction or contractual discussion.
The useful question is not simply whether Grab remains large. It is how much it must spend, and how much of the revenue it must surrender, to remain the service customers and partners choose.
6. The grocery order is a different kind of habit
A meal-delivery order can be an occasional indulgence. Groceries are recurring household spending, although having them delivered remains a convenience choice.
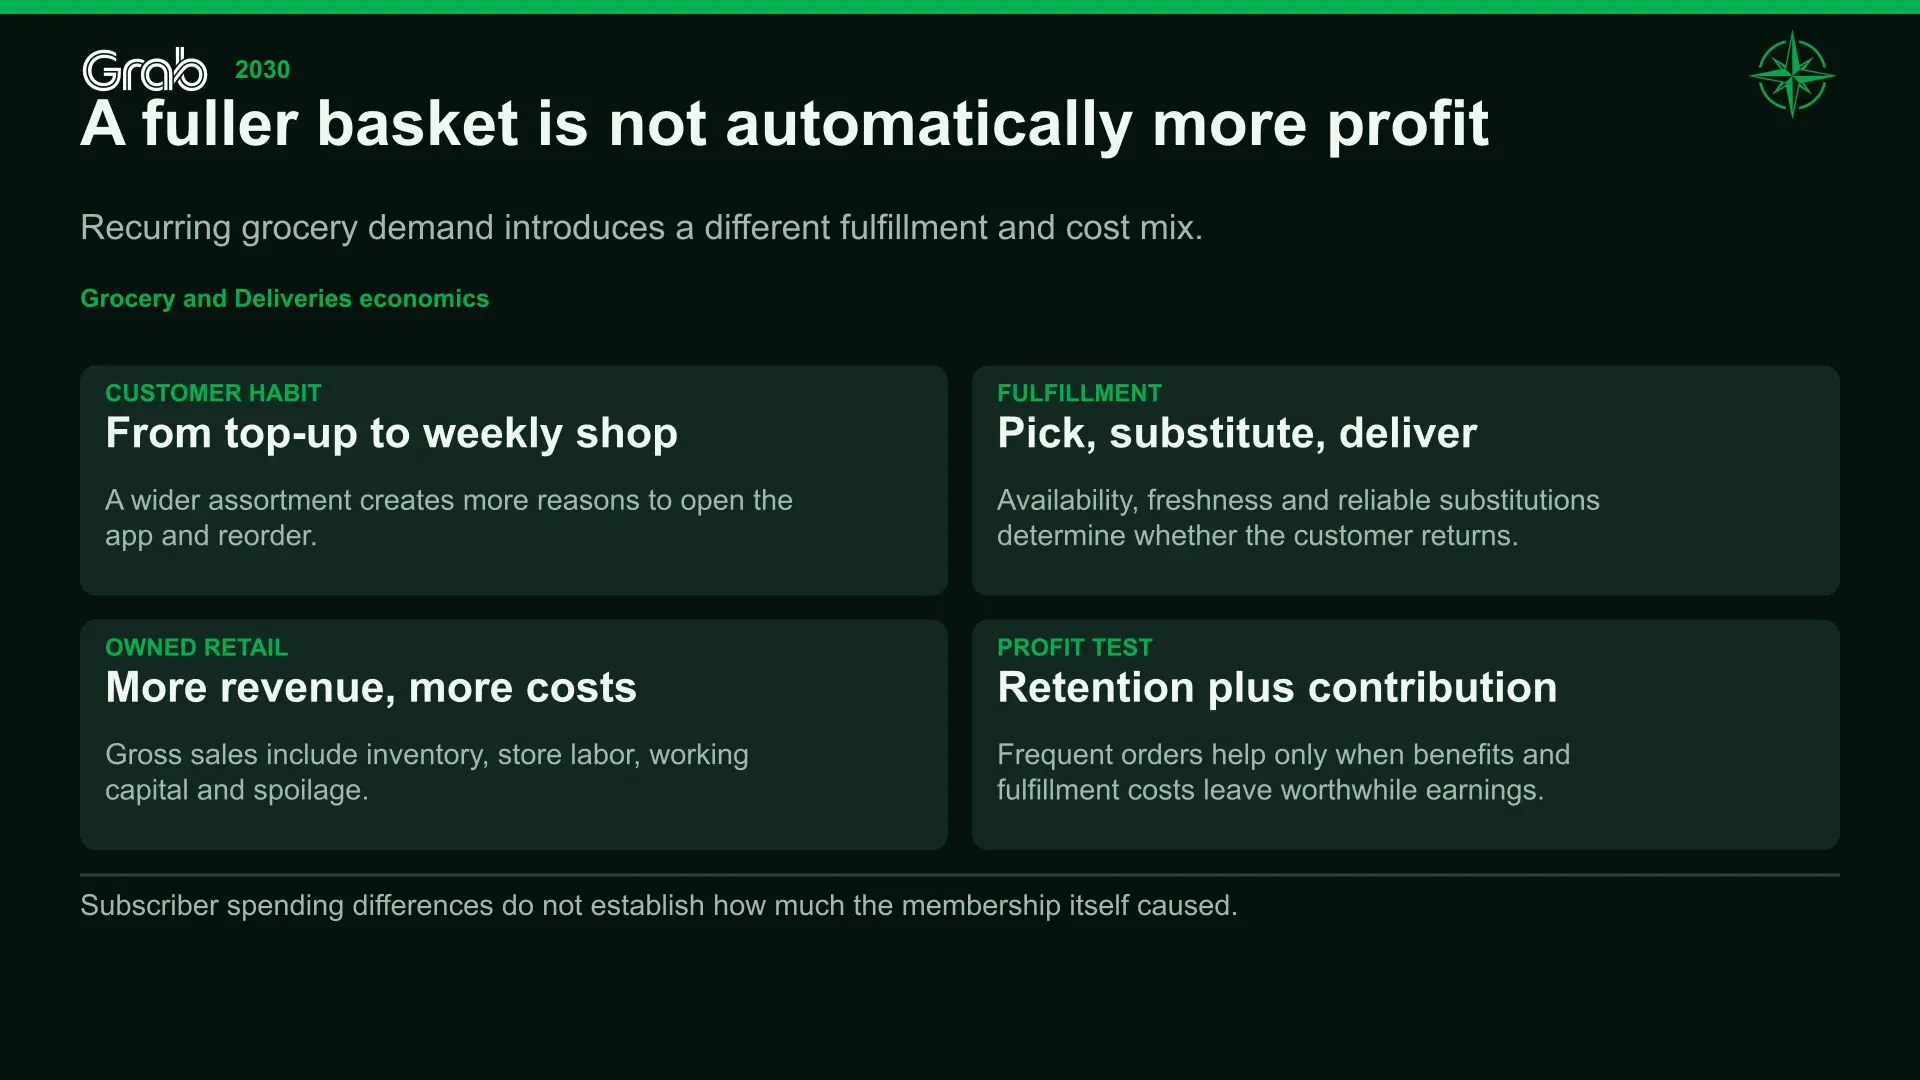
That gives Grab an attractive expansion opportunity. A customer may begin by adding a few household items to a food order, then become comfortable using the app for planned shopping. The service can become part of a routine rather than a decision made only when the customer is too busy to cook or travel.
GrabMart grew at 1.7 times the rate of Food Deliveries in Q2. Management pointed to supermarket partnerships, broader assortment and the owned Jaya Grocer and Everrise businesses in Malaysia as foundations for the expansion. Tools for assembling and reordering baskets are intended to make the service useful for planned shopping as well as immediate needs.[2][2a]
The work involved is different from collecting a prepared meal. Products have to be in stock, located, substituted when necessary and delivered in suitable condition. Owned retail offers more control over inventory and assortment, but also requires stores, staff, working capital and tolerance for spoilage. Grab’s Q2 release explicitly identified the expansion of Jaya and Everrise as a contributor to higher cost of revenue.[2][2a]
We therefore support the growth opportunity without assigning all grocery revenue marketplace-like margins. The mix can expand reported revenue faster than economic profit because some sales are recognized gross. Our separate GMV, revenue and EBITDA forecasts keep that accounting effect from becoming a substitute for better operating performance.
GrabUnlimited, the paid loyalty program, provides evidence of the value of frequent customers. Subscribers grew 20% in Q2 and contributed 35% of Deliveries GMV. Management reported four times as many transactions, five times the spending and more than twice the retention of non-subscribers.[2][2a]
Those figures describe an attractive customer group, but the most frequent users also have the strongest reason to subscribe. We do not attribute their entire spending advantage to the membership itself. The more useful conclusion is that Grab already has a substantial group for whom the service has become habitual.
The earnings opportunity comes from serving that habit efficiently. A subscription supported by expensive benefits is not automatically more profitable than an occasional customer paying the ordinary fee. Retention, frequency and contribution have to improve together.
The economic value can extend beyond the delivery charge. More recurring grocery use makes the app relevant to additional retail brands, creating more occasions for advertising. That opportunity is valuable only if merchants continue finding profitable demand rather than paying more for the same sales.
7. The restaurant has to want to buy the next advertisement
Advertising is one of the strongest reasons to reconsider Grab’s earnings potential.
A restaurant appearing in front of someone already deciding what to eat has a valuable commercial opportunity. Grab can connect that placement to an order, payment and delivery, providing a clearer picture of the transaction than an advertising channel that stops at a click.
The restaurant still has to make money. An advertisement that produces an additional profitable order is useful. One that merely takes credit for business the restaurant would have received anyway can look better in a dashboard than in the bank account.
Grab’s recent results suggest merchants continue finding value. Quarterly active advertisers on its self-service platform increased 21% in Q2, while spending per advertiser grew 24%. The company also attributed part of Deliveries’ improvement in profitability to advertising.[2][2a]
We forecast advertising separately within Deliveries because its contribution has become too important to leave inside a general margin assumption.
Base advertising forecast | 2026 | 2027 | 2028 | 2029 | 2030 |
|---|---|---|---|---|---|
Revenue, $m | 354 | 476 | 635 | 794 | 970 |
Revenue / Deliveries GMV | 2.05% | 2.30% | 2.60% | 2.80% | 3.00% |
Contribution margin | 65% | 65% | 65% | 65% | 65% |
Northwise estimates. Advertising is included in Deliveries revenue and earnings. Absolute advertising revenue and contribution margins are not separately disclosed at this level.
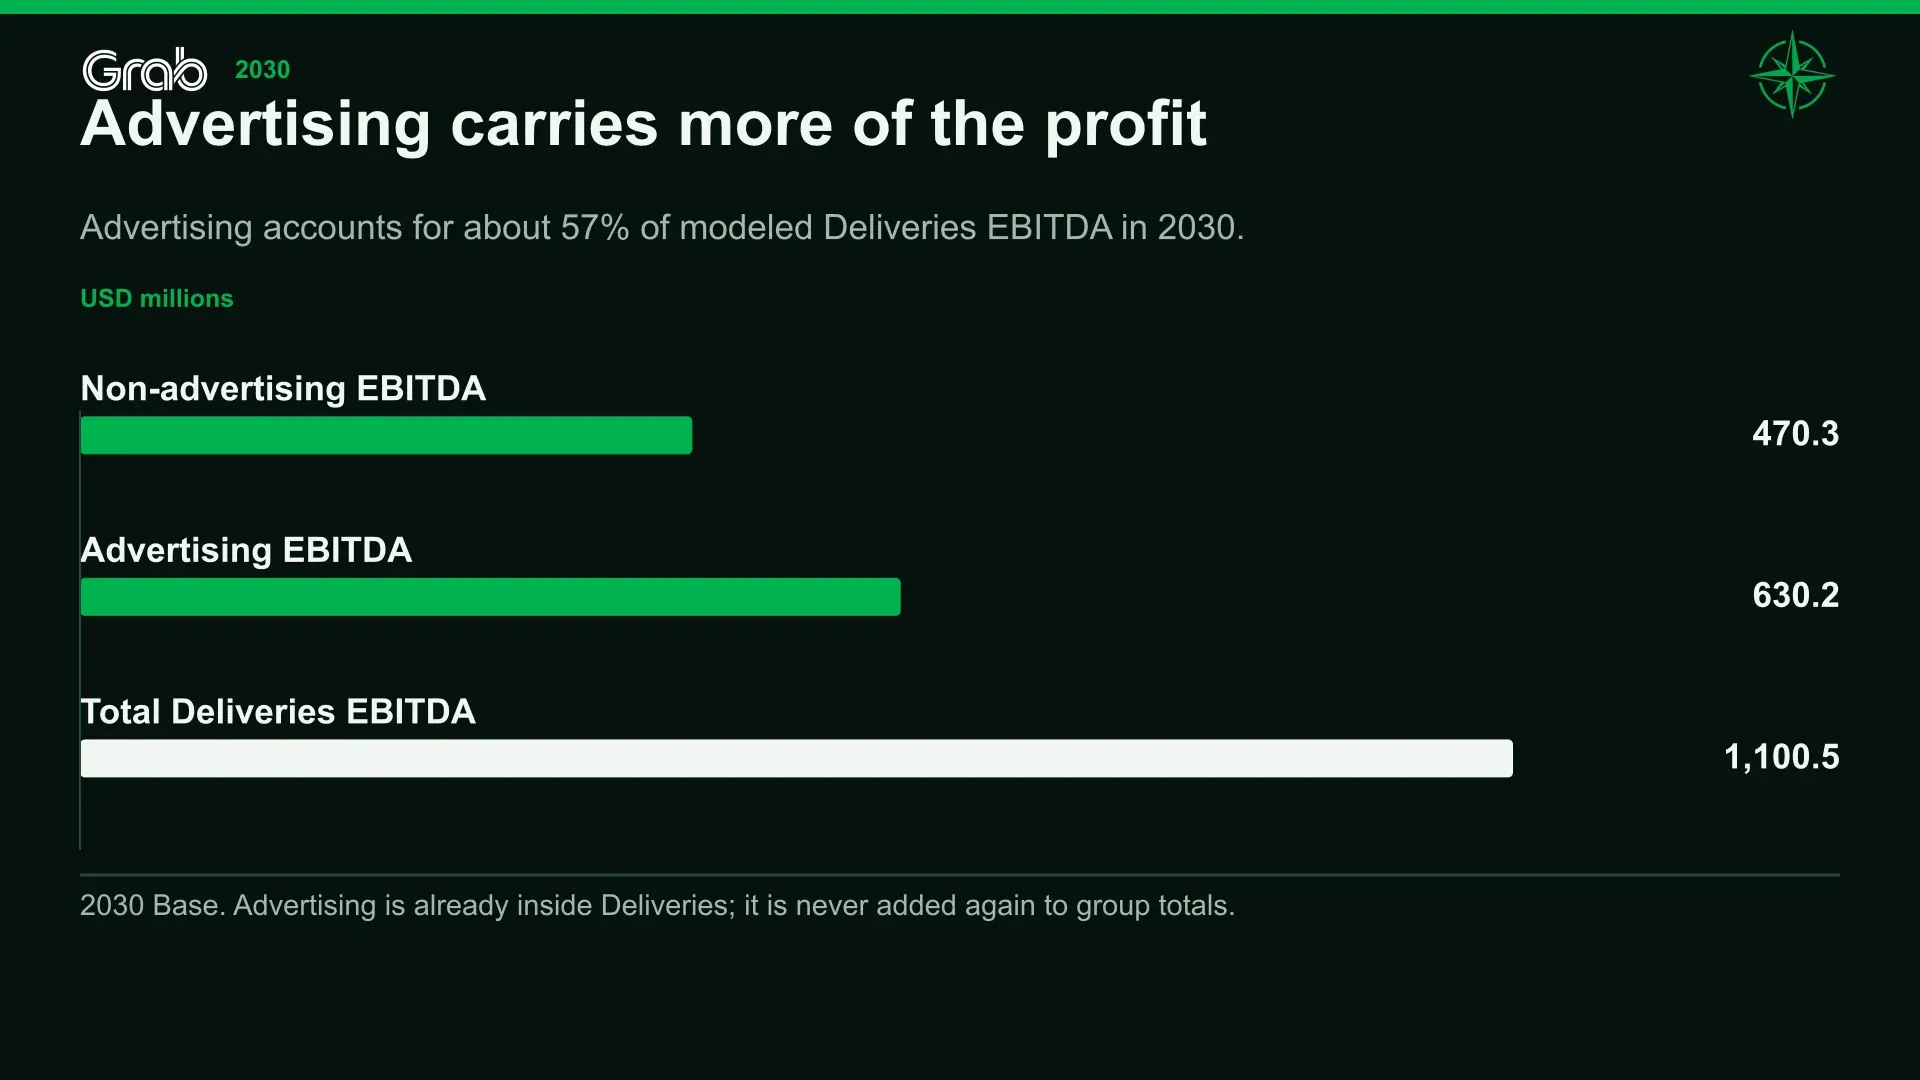
By 2030, advertising contributes approximately $630 million of the Base forecast’s $1.10 billion of Deliveries adjusted EBITDA. The remaining $470 million comes from non-advertising activity. Advertising therefore supplies roughly 57% of forecast segment earnings.
That is a substantial dependency. It gives us a reason to expect better group profitability, while also identifying where our forecast can be challenged. The case needs merchants to support higher spending because the resulting sales are worthwhile, not merely because more advertising is required to maintain their existing visibility.
Grocery expansion could help by introducing more brands and purchasing occasions. A broader transaction history can improve relevance, and easier campaign tools can reduce the work required from smaller merchants. Those advantages support our judgment, but none establishes an unlimited advertising budget.
We would become concerned if advertiser spending kept rising while merchant economics weakened. A platform can initially benefit from selling more prominent placement, then discover that it has made participation less attractive for the businesses generating the orders. Our forecast assumes a more durable exchange: the merchant receives enough additional contribution to justify buying the next advertisement.
We do not credit additional merchant-network synergies in this advertising forecast. Any subsequent cross-selling benefit needs to appear in participation, sales and merchant returns before it warrants another increase in expected earnings.
Keep following the Grab business
Explore Northwise’s Grab research and model history alongside the operating assumptions in this report.
Explore Grab research →
8. AI has useful work to do here
Many of Grab’s expensive problems involve prediction and coordination.
A driver arriving too early at a restaurant waits without earning. Arriving too late leaves food waiting and a customer disappointed. A poor pickup estimate can turn a worthwhile fare into a frustrating trip. A lending decision based on incomplete information can create losses that only become visible months later.
Grab’s transaction history and local operating information are relevant to those tasks. In its first-quarter remarks, management described a dataset exceeding 20 billion transactions and broad adoption of driver and merchant assistance tools. Selected adopters showed better earnings or sales than non-adopters. Those comparisons are encouraging, although they do not isolate the amount of improvement caused by AI alone.[1]
The wider technology cycle also changes how customers may arrive. Grab has been making food and dining services discoverable through external AI interfaces, hoping to turn recommendations into transactions fulfilled on its network. A general-purpose assistant may help someone choose dinner, but someone still has to connect the restaurant, payment and delivery.[1]
Our view is that this physical network gives Grab a role that is harder to replace than a recommendation screen. We would still watch who controls the customer’s choice. An external agent comparing several providers could direct more business to Grab while increasing price competition and reducing the value of placement within Grab’s own app. More AI-generated demand would not necessarily preserve the existing economics of discovery.
The cost side is already visible. Grab says its cost per AI interaction more than halved from June 2025, while development and analytics tools reduced staff time. Regional corporate costs nevertheless reached $104 million in Q2, compared with $92 million a year earlier. Falling unit costs can coexist with a larger total bill when usage and infrastructure expand.[2][2a]
Our Base forecast allows the existing regional corporate cost base to rise from $425 million in 2026 to $558 million in 2030. Additional support for the enlarged financial business brings consolidated regional corporate costs to $588 million in 2030. Revenue still grows substantially faster, creating operating leverage rather than relying on an absolute reduction in technology spending.
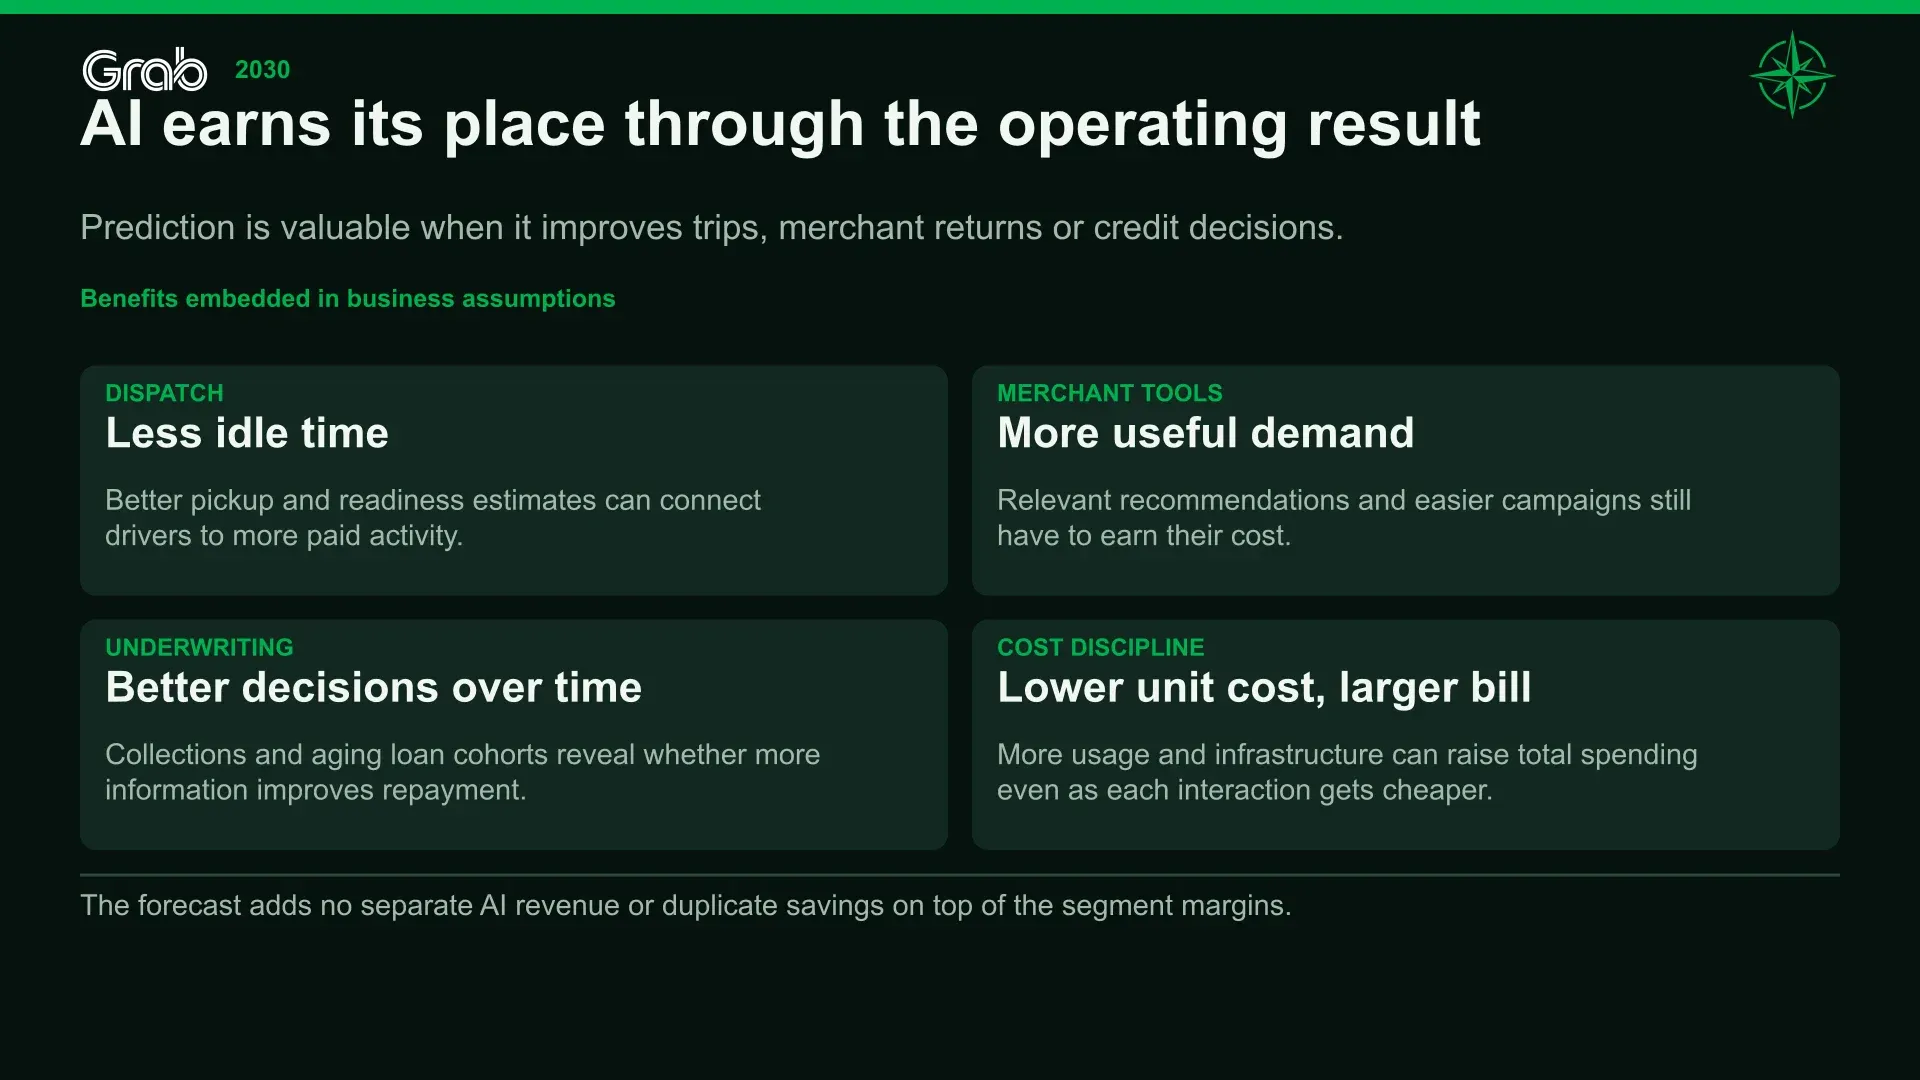
Benefits from routing, advertising and underwriting are reflected in their respective business assumptions. There is no separate AI revenue line or additional collection of savings layered on top of the same margin improvements.
Privacy restrictions, fraudulent information, incorrect decisions and outages can all interfere with those benefits. Grab identifies risks involving automated decisions and reliance on external cloud infrastructure in its annual report. A technically sophisticated system still has to operate reliably at a cost its customers’ activity can support.[3]
The electric vehicle has its own financing problem
Grab’s September EV announcement included a useful account from a long-serving GrabRentals driver. After switching to an electric vehicle, he had accumulated around fifteen charging apps. The company’s response brings charging discovery and payment into the driver app, alongside vehicle sourcing and financing. It is another example of improving the working day by reducing the small complications around each trip.[4]
Financing can create a different risk from the fuel exposure it helps reduce. Eligible new EV and hybrid purchases may receive up to 100% financing for as long as ten years. Those are maximum product terms, not the average loan in the portfolio. They can reduce the initial cash barrier while extending the lender’s exposure to driver income, maintenance, battery condition and resale value.[4]
We see potential benefits from more economical vehicles, but a lower fuel bill does not settle whether the associated loan is well priced. The lender’s commitment can extend long after the immediate operating improvement.
Autonomous vehicles remain earlier in their commercial development. Grab reported more than 9,000 unique riders and 90,000 autonomous kilometers for its Singapore Ai.R service by Q2. Our principal forecast includes no separate autonomous-driving earnings surge through 2030 because those milestones do not yet provide the fleet, utilization and full-cost assumptions needed to underwrite one.[2][2a]
9. When the driver becomes a borrower
A driver can generate a regular stream of fares without looking like a conventional salaried borrower. A restaurant may have a viable business but an uneven flow of working capital. Grab already sees some of the activity that can help evaluate those customers.
That is the distribution argument behind Financial Services. Payments, operating history and frequent contact can make it easier to reach a borrower and understand how the business is performing. Grab said that almost seven in ten driver-partners who took a loan in 2025 were accessing formal credit for the first time. That describes its borrowing-driver cohort, rather than the whole region, but it gives substance to the opportunity.[1]
Financial access is not the same as profitable lending. A business may be poorly documented yet creditworthy; it may also be well documented and unable to afford another obligation. Better information helps distinguish between them, but cannot create repayment capacity.
The segment is progressing. Financial Services revenue grew 59% in Q2 to $134 million, while its adjusted EBITDA loss narrowed to $15 million. Management expected the overall segment to become profitable on that measure in the second half, assisted by core lending growth, Superbank and Stash.[2][2a]
Our forecast allows Financial Services to become a meaningful source of direct earnings. The earlier view, which largely treated it as supporting infrastructure that would eventually stop consuming cash, gave too little weight to that possibility. We still distinguish segment breakeven from mature shareholder profitability.
Base Financial Services earnings, $m | 2026 | 2027 | 2028 | 2029 | 2030 |
|---|---|---|---|---|---|
Existing core lending and payments adjusted EBITDA | (44) | 34 | 135 | 234 | 326 |
Stash adjusted EBITDA | 15 | 35 | 60 | 80 | 100 |
Atome adjusted EBITDA, for assumed consolidated periods | — | 52 | 307 | 377 | 449 |
Total Financial Services adjusted EBITDA | (29) | 120 | 502 | 691 | 875 |
Existing core normalized after-tax earnings, before minority interests | (105) | (34) | 48 | 120 | 186 |
Northwise estimates. Existing core excludes Stash and Atome. The proposed Atome purchase, discussed below, is consolidated only after the assumed first closing. Segment totals may differ from the sum of displayed rounded amounts.
Core lending and payments become positive on adjusted EBITDA before they produce positive normalized after-tax earnings. The difference represents costs that the business has to cover as it develops. We retain those costs even when the total segment receives earnings from other businesses.
Superbank changes the scale and the comparison
Grab began consolidating Superbank in June after increasing its shareholding above 50%. The gross loan portfolio reached $2.318 billion, including approximately $758 million from Superbank. The previously consolidated portfolio was about $1.56 billion and had itself roughly doubled from a year earlier.[2][2a]
Both organic growth and consolidation contributed. Treating the whole increase as organic would overstate the pace; attributing it all to the acquisition would overlook the underlying progress.
Superbank also has meaningful overlap with the broader group. Management reported that more than 60% of its 7.4 million customers used Grab or OVO, its Indonesian payments business. That provides an existing audience for financial products, without establishing that every customer is an active borrower or every application will produce a worthwhile loan.[2][2a]
The larger economic shift toward digital finance can benefit several providers at once. Grab itself warns that wider use of bank cards could reduce demand for its wallets, while cash still accounted for 27% of its transactions in 2025. We see financial formalization as an opportunity to compete for useful products, not a guarantee that every movement away from cash will belong to Grab.[3]
10. Lending growth has to survive its credit costs
A lender can accelerate revenue by issuing more credit. Establishing the return on that growth takes longer.
Grab disbursed $1.239 billion of loans during Q2, while its outstanding gross portfolio ended the quarter at $2.318 billion. The first number measures lending during a period; the second measures the balance still owed at a point in time. Repayments, write-offs and acquired balances explain why they are different.[2][2a]
Our Base forecast increases the existing core gross loan portfolio from $3.1 billion at the end of 2026 to $7.5 billion by 2030, excluding receivables from the proposed acquisition. Lending income is calculated from average balances during the year using a 17.5% blended yield. This is a Northwise assumption across the portfolio, not a disclosed rate charged to every customer.
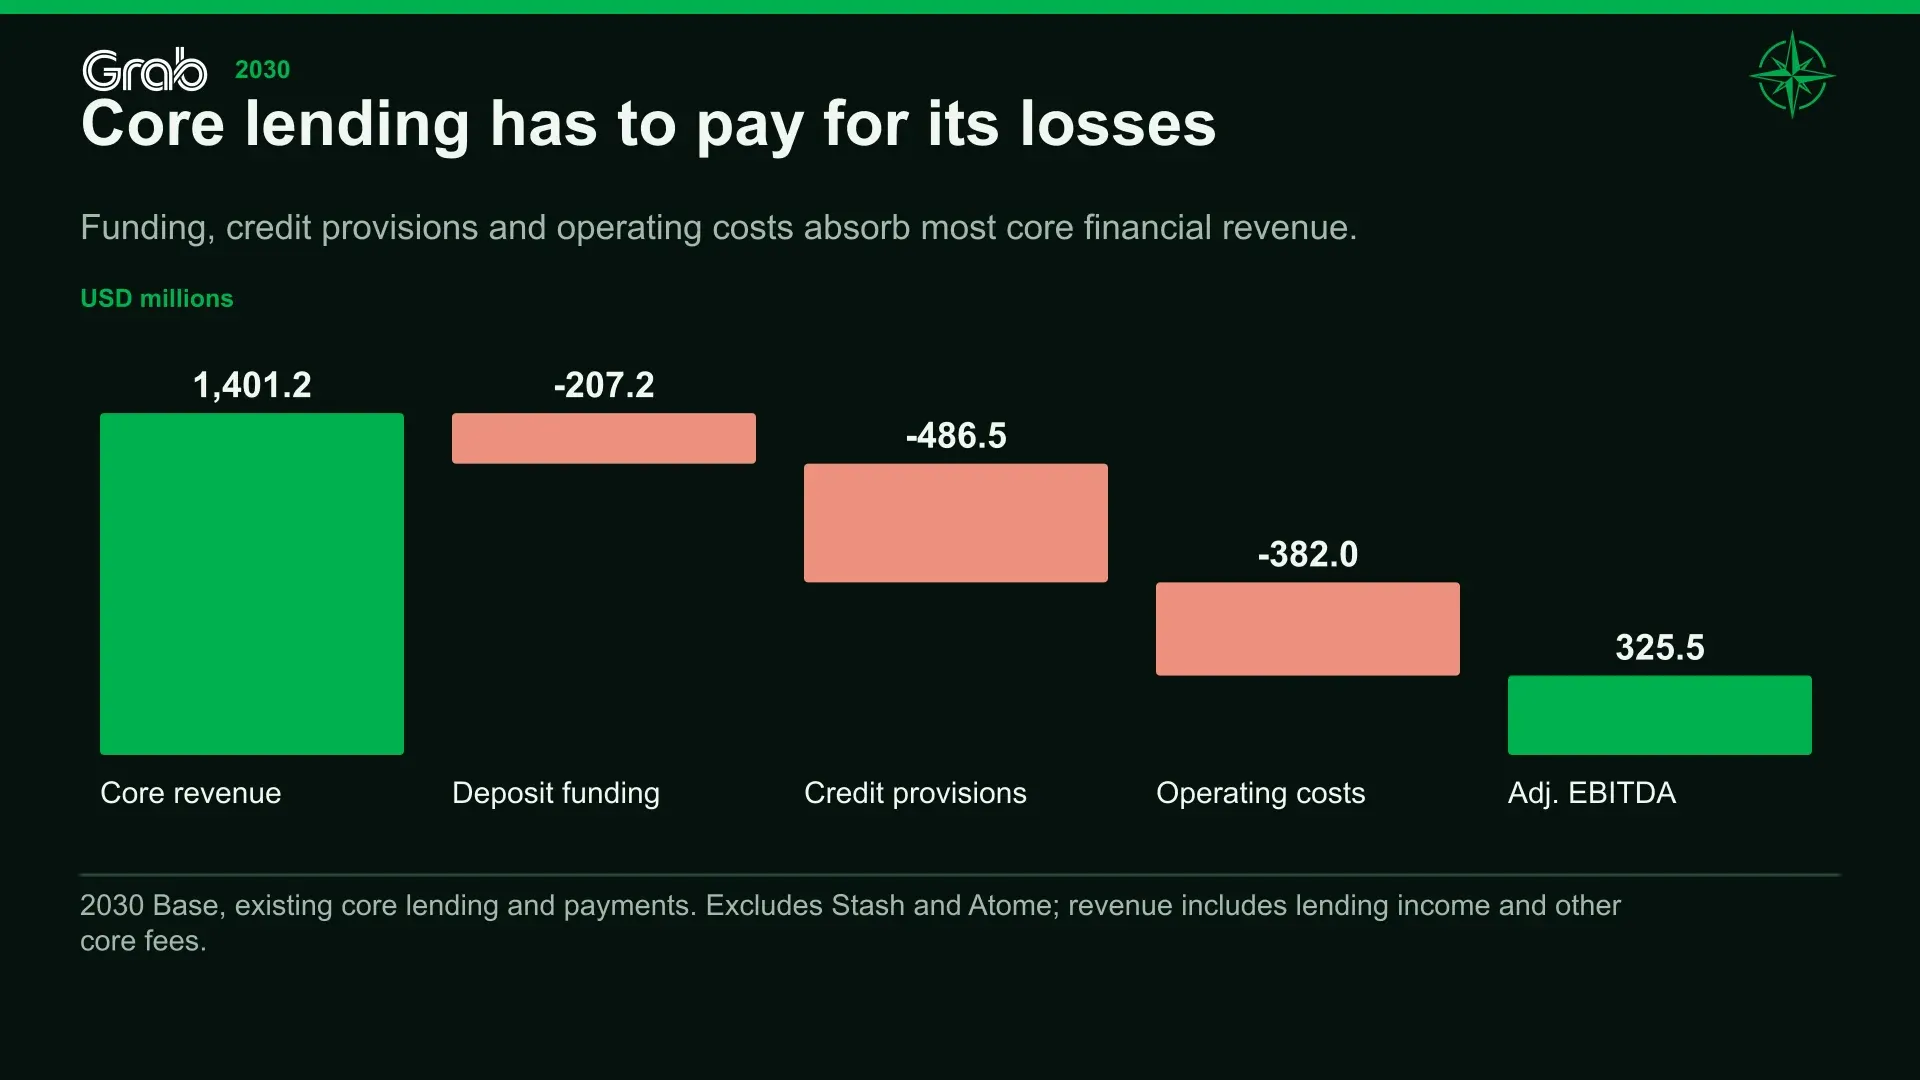
In 2030, the calculation uses $6.95 billion of average core gross loans and produces approximately $1.22 billion of lending income. Funding, credit provisions and operating expenses then absorb most of it.
Existing core Financial Services economics in 2030 | USD millions |
|---|---|
Lending income | 1,216 |
Other core Financial Services revenue | 185 |
Deposit funding costs | (207) |
Recurring credit provisions | (487) |
Core operating expenses | (382) |
Core Financial Services adjusted EBITDA | 326 |
Northwise estimates for existing core lending and payments, excluding Stash and Atome. Funding costs and credit losses remain operating costs.
The recurring provision rate declines from 8.8% of average core gross loans in the early forecast to 7.0% in 2030. The dollar expense still increases because the portfolio becomes larger. This is not a forecast in which better underwriting makes credit losses immaterial.
Management described stable nonperforming-loan ratios in Q2. The available disclosures do not provide a sufficiently detailed bank-by-bank history of loan vintages to establish a precise through-cycle loss rate. A vintage follows loans originated at the same time as they age, helping reveal whether later losses are developing as expected. Rapid growth can make the blended portfolio look healthier simply because it contains more young loans.[2][2a]
Our confidence in the eventual credit cost is therefore lower than our confidence in Mobility’s established earnings. There is a longer operating record for rides than for the enlarged banking portfolio.
Following the loss into cash
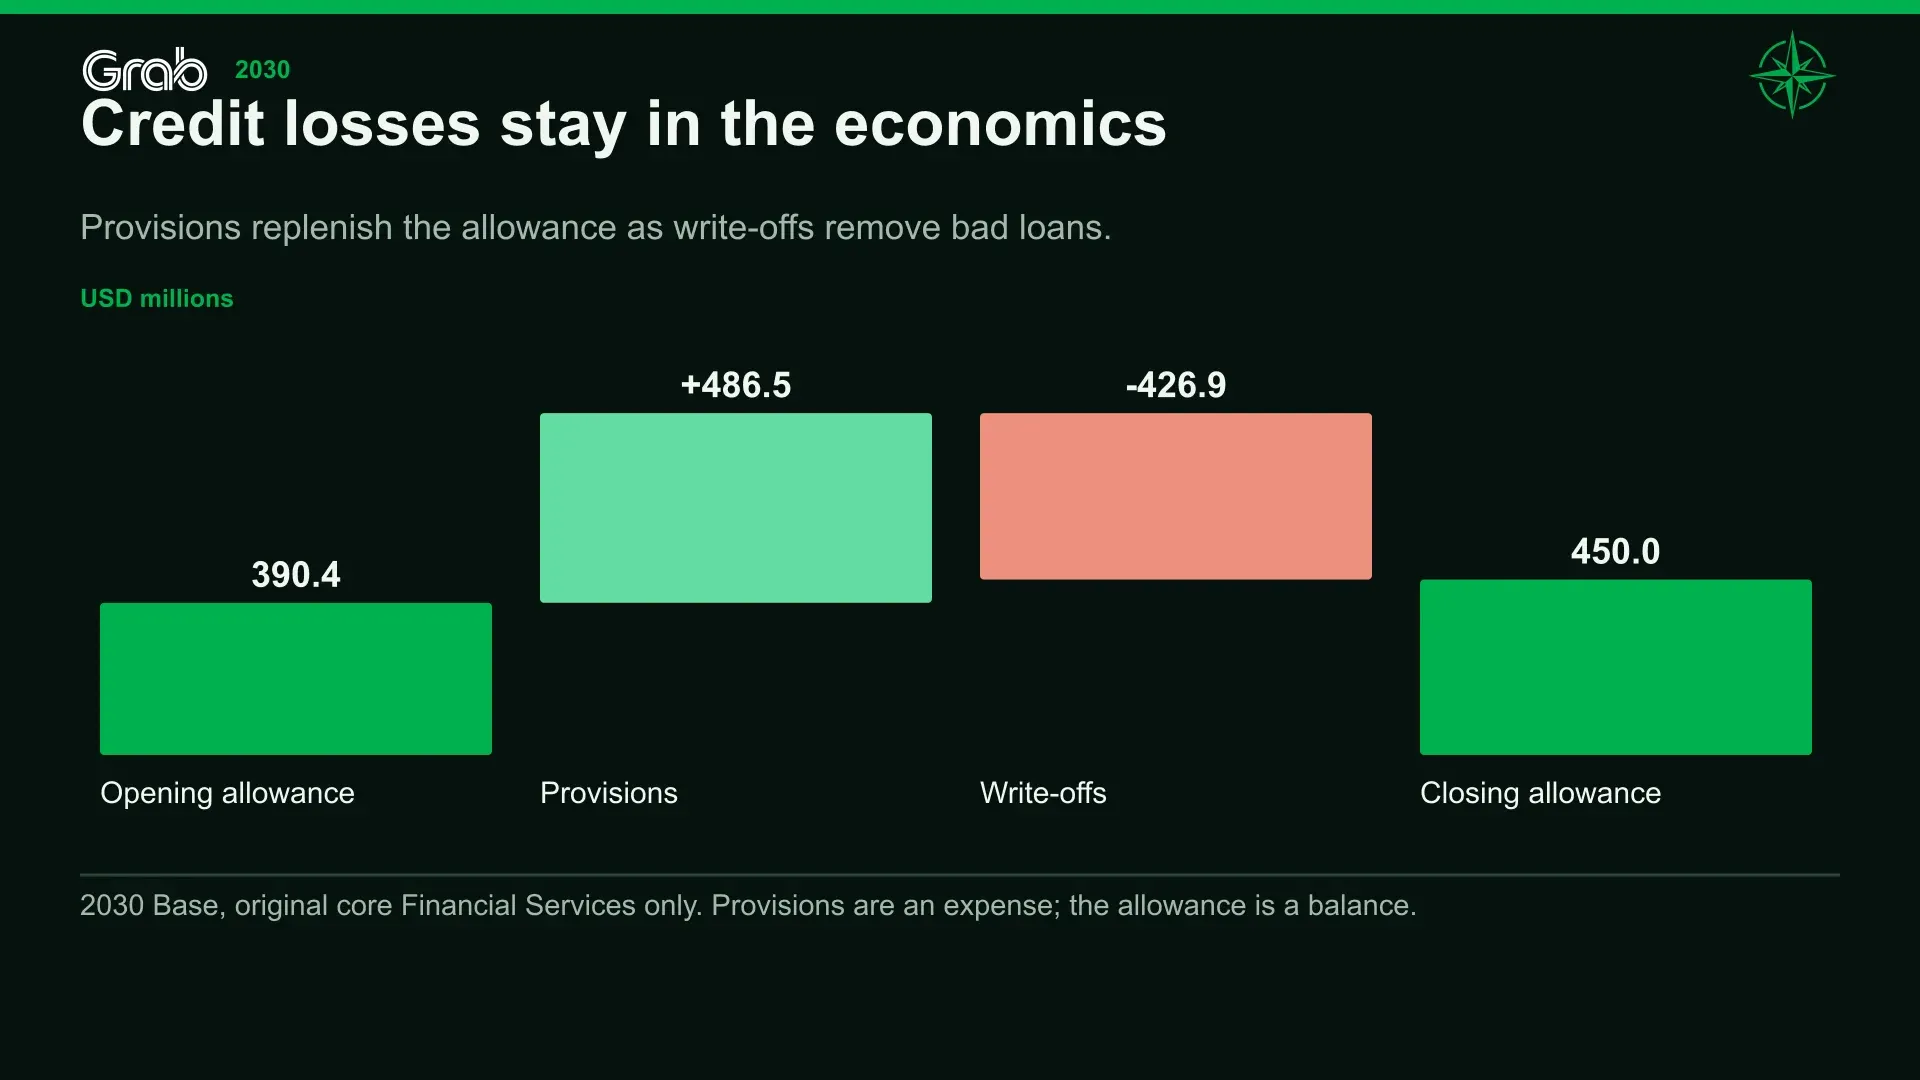
A provision is an expense recognized during a period. The allowance is the balance-sheet reserve against expected losses. A write-off reduces the receivable and its corresponding allowance when the amount is treated as uncollectible.
Our existing-core Base 2030 schedule starts with a $390 million allowance, adds approximately $487 million of provisions and deducts $427 million of write-offs, leaving a $450 million ending allowance. That equals 6% of gross loans. Cash lending requirements include replacing losses as well as expanding the portfolio.
The provision may be noncash when it is recognized, but cash was advanced to the borrower earlier. Adding the expense back in a cash-flow calculation does not recover money that will never be collected.
The Bear forecast makes that exposure visible. The existing-core lending yield declines to 15.5% by 2030, while recurring provisions remain at 10.5% of average loans and funding is more expensive. Core lending remains loss-making despite its larger portfolio. Under those conditions, lending more does not repair the business because the economics of the additional credit are inadequate.
Deposits fund the business
Grab reported $2.513 billion of banking deposits at June 30. Our Base forecast increases the balance to $8 billion in 2030, with a later-year funding cost of 2.8%. On the average deposit balance during 2030, that produces approximately $207 million of expense.[2][2a]
Deposits can provide attractive funding, but customers remain entitled to repayment. Banks need capital to absorb losses and liquidity to meet cash demands. An institution can have assets worth more than its liabilities while still facing difficulty if it cannot turn those assets into cash quickly enough.
We reserve at least $1.5 billion of allocated capital for existing core Financial Services in Base, with a larger requirement when the loan portfolio or liquidity constraint demands it. By 2030, the portfolio-based requirement increases the allocation to $1.65 billion.
Existing core bank and lending balance sheet in 2030 | USD millions |
|---|---|
Gross loans | 7,500 |
Expected-loss allowance | (450) |
Net loans | 7,050 |
Reserved bank liquidity | 2,600 |
Total modeled assets | 9,650 |
Customer deposits | 8,000 |
Allocated capital | 1,650 |
Total funding | 9,650 |
Northwise allocation for the existing core businesses, not a bank-by-bank regulatory-capital calculation. Separate reserves support the acquired lender, wallets and platform operations.
The $2.6 billion liquidity reservation is unavailable for ordinary corporate uses in this forecast. Treating it as excess cash while separately assigning value to the bank would give shareholders credit for money needed to support the business.
Ownership requires another adjustment. Consolidation puts an entity’s accounts within Grab’s financial statements, but does not mean every dollar of its income belongs to Grab shareholders. We use a 65% blended economic participation assumption for existing core Financial Services and 100% for Stash. The 65% is an estimate across different arrangements, not the legal ownership percentage of each bank. The proposed consumer-credit acquisition has its own explicit ownership schedule.
Interest rates can help one part of this business while hurting another. Lower deposit rates would reduce funding costs, all else equal, but lending yields may also decline and corporate cash would earn less. Higher rates can support treasury income while putting more pressure on borrowers. We assess those effects separately rather than treating a rate change as uniformly favorable for the group.
11. Stash adds earnings and a purchase price that can change
Stash brings Grab into a different financial business: a U.S. digital-investing and subscription platform. At the time of the acquisition update it had $5.5 billion of client assets under management and was described as adjusted-EBITDA positive. Those assets belong to clients; Grab’s opportunity lies in the revenue and earnings associated with serving them.[2][2a]
The strategic fit is plausible, although less immediate than lending to a restaurant already selling through the app. Stash adds investing capabilities and an established customer proposition that may eventually be adapted for Southeast Asia. It also adds a business operating under different customer expectations and regulations.
Its payment structure deserves attention. Grab acquired 100% of the equity in July, but paid for 50.1% at closing. The remaining consideration is payable at fair market value over three years. The announced enterprise-value reference was $425 million.[2][2a][9]
Our forecast assumes 60% of the initial payment is cash and 40% shares, with no initial adjustment between the announced enterprise value and equity purchase value. That produces approximately $128 million of closing cash, $85 million of share consideration and $212 million of unpaid consideration.
In Base, the unpaid amount increases with 10% annual fair-value growth before the assumed payments in 2027–2029. Those payments total approximately $257 million. The exact initial mix and future resets remain estimates rather than disclosed settlement amounts.
Grab receives the full earnings interest immediately, but success can make the later payments more expensive. The unpaid portion is an acquisition obligation in our forecast, not an additional ownership interest received without cost.
We estimate Stash revenue of $64 million for H2 2026, rising to $280 million in 2030. Adjusted EBITDA increases from $15 million to $100 million. The $60 million estimate for 2028 is close to the threshold identified in the acquisition outlook. We do not add another independent revenue stream for a future Southeast Asian rollout that has yet to be established.
Those assumptions remain part of the group’s financial forecast. Buying another business does not remove the cash still owed for this one.
12. Atome extends the consumer-credit business
The September 15 agreement to acquire Atome Financial expands the opportunity beyond the driver and merchant relationships around which Grab built much of its original lending business.
Atome includes buy-now-pay-later products, cards, consumer cash loans and the Indonesian digital lender Kredit Pintar. It operates in Singapore, Malaysia, the Philippines and Indonesia, with a minority interest in a Thai joint venture. Its reported network includes more than 30,000 brands and 25 million cumulative transacted users. That user measure is neither a monthly audience nor a disclosed increment to Grab’s customers; we do not add it to Grab’s monthly user count.[10]
The strategic fit is credible. Checkout financing reaches consumers during different purchase occasions and gives Grab a broader financial product range. The extra distribution also brings more exposure to consumer repayments and institutional funding. We evaluate it as a purchased business with its own economics, rather than assuming the combined customer networks automatically generate synergies.
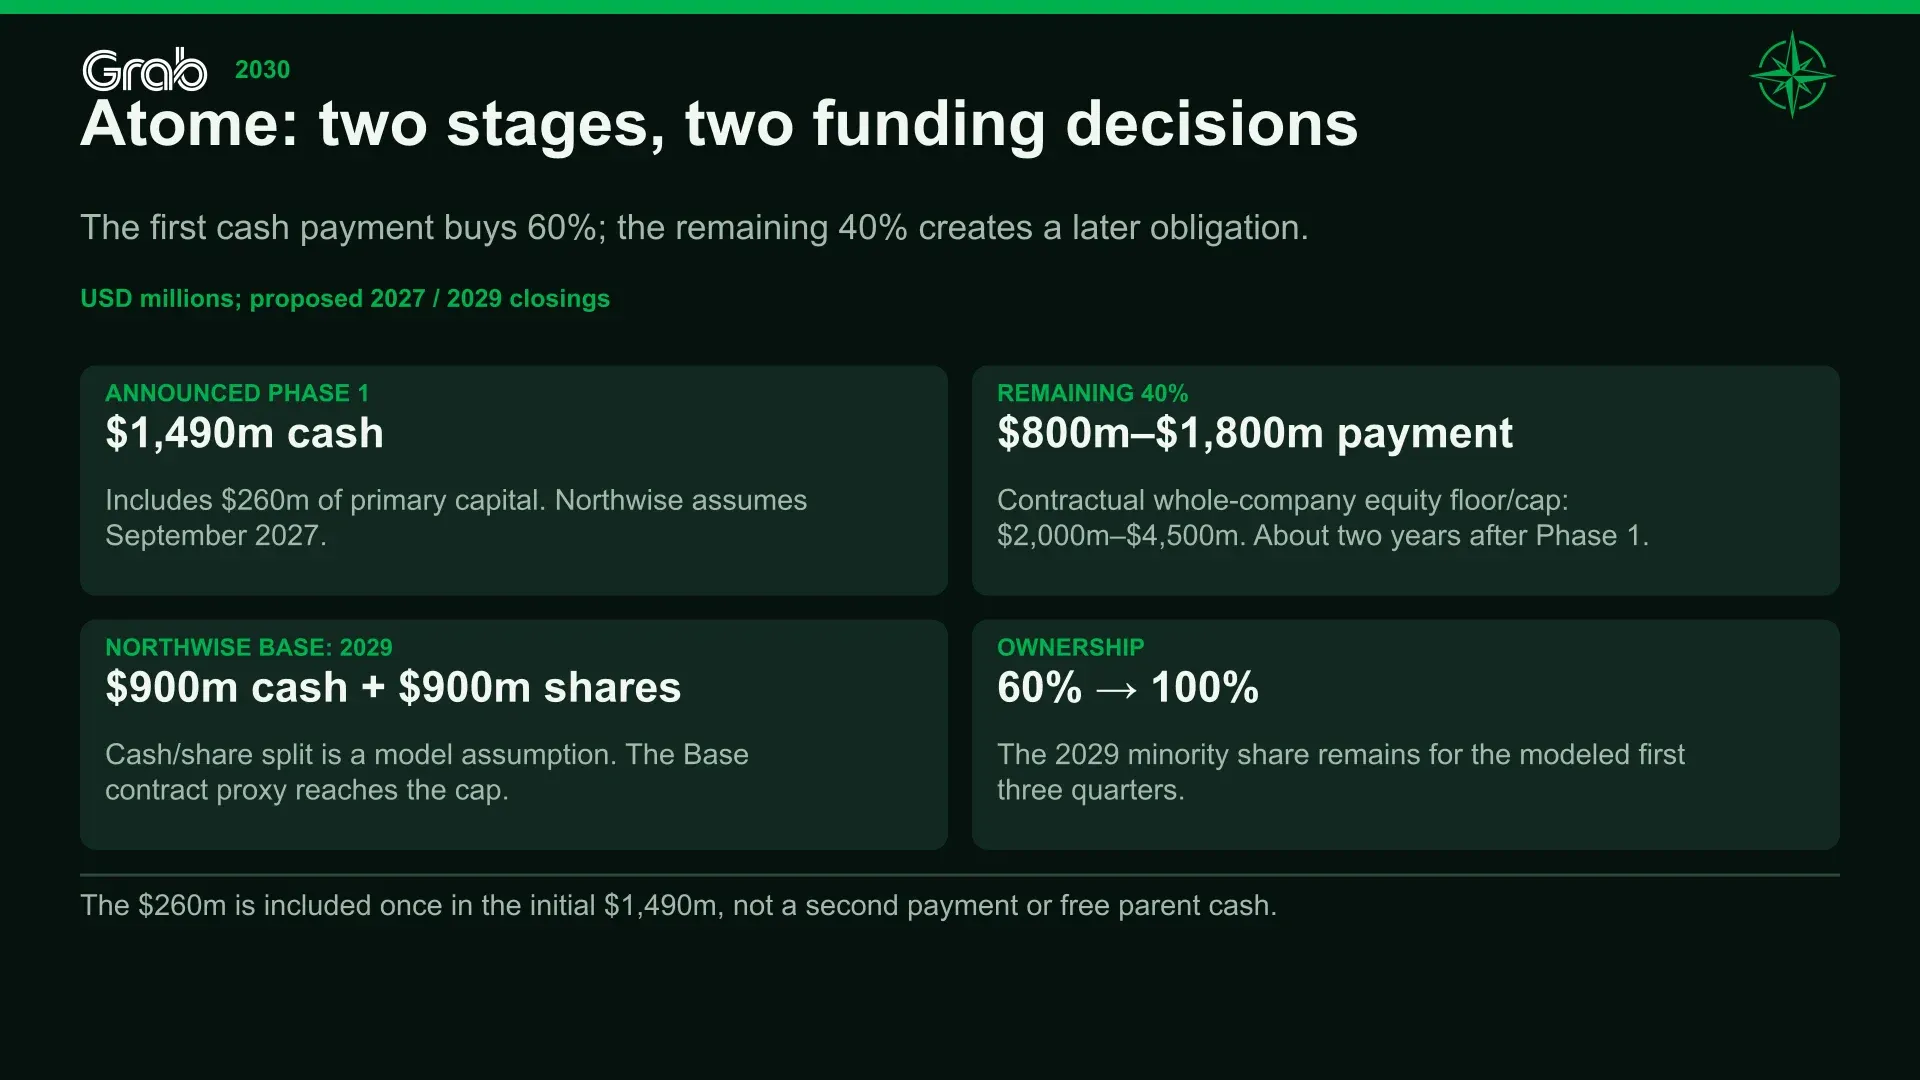
The agreement commits $1.49 billion in cash for an initial 60% interest, including $260 million of primary growth capital. The initial closing is expected by Q3 2027, subject to approvals. Grab has also agreed to buy the remaining 40% approximately two years later, with at least half of that consideration in cash.[10]
The second price depends on performance. Its whole-company equity value combines a 75% weight on 13 times annualized adjusted EBITDA and a 25% weight on 2.5 times annualized revenue, measured from the preceding six months. A $2 billion floor and $4.5 billion cap translate into an $800 million–$1.8 billion payment for the remaining stake. These are contractual purchase terms, not our valuation of Grab’s shares.[10]
Our Base assumes September 30, 2027 and September 30, 2029 closings. It therefore includes no Atome operating results in 2026, one quarter in 2027 and a full year from 2028. Minority owners receive 40% of earnings until the second close. In Base, the remaining-stake price reaches the cap; we assume $900 million of cash and $900 million of shares at an illustrative $7 issue price, adding approximately 129 million shares. The dates, settlement mix and issue price are assumptions.
Advance Intelligence Group’s financial summary reported $470 million of 2025 revenue and an approximately $800 million annualized net-revenue run-rate by June 2026. It did not provide a complete audited target income statement or usable standalone adjusted EBITDA amount. The run-rate is not full-year realized revenue, and its terminology still needs to be reconciled with what Grab will consolidate.[12]
We estimate $850 million of standalone 2026 revenue, with annual growth moderating from 30% in 2027 to 17% in 2030. The contribution to Grab is smaller initially because of the assumed closing date.
Atome Base forecast, $m | 2026 | 2027 | 2028 | 2029 | 2030 |
|---|---|---|---|---|---|
Standalone full-calendar-year revenue | 850 | 1,105 | 1,381 | 1,658 | 1,939 |
Revenue consolidated into Grab | — | 276 | 1,381 | 1,658 | 1,939 |
Adjusted EBITDA consolidated into Grab | — | 52 | 307 | 377 | 449 |
Normalized target income consolidated into Grab | — | 28 | 182 | 228 | 275 |
Year-end owned gross receivables, consolidated | — | 1,280 | 1,680 | 2,120 | 2,560 |
Target capital reservation | — | 610 | 610 | 636 | 768 |
Northwise estimates, conditional on closing. Target income precedes minority allocation and incremental parent costs; the 2027 contribution covers one quarter.
The reported $1 billion portfolio also needs care: its definition covers loans current through 90 days past due and is not a complete reconciliation to owned receivables. We assume 80% of the managed indicator is on balance sheet, testing alternatives of 50% and 100%. Institutional borrowing funds 85% of net owned loans in Base, with later funding costs of 7.5%. This funding is not treated as customer deposits or as an automatic claim on cash held at Grab’s banks.[10]
Our recurring provision rate declines from 14% to 13% of average owned loans, while cash operating expenses decline from 60% to 54% of revenue. Compensation, depreciation, acquired-intangible amortization and taxes are charged separately. The target’s allocated capital increases from $610 million at first closing to $768 million in 2030. The $260 million primary injection is part of the initial purchase payment and remains within the target; it is not counted again as unrestricted corporate cash.
Those assumptions produce approximately $449 million of additional segment adjusted EBITDA in 2030, before $30 million of additional regional corporate costs. Their reliability is limited by missing credit-vintage, funding and balance-sheet detail. Provisional purchase accounting assumes $350 million of pre-primary tangible equity and $300 million of amortizable intangibles over ten years. The later minority purchase changes equity ownership rather than creating a second goodwill asset.
The deal increases our earnings forecast and reduces the cash available for other uses. Its effects are included in the group’s annual accounts, share count and stress tests below. The principal forecast is conditional on both stages closing; a no-close outcome remains a separate comparison. None of this changes the operating assumptions for Mobility or the existing Deliveries and advertising businesses.
13. The profit shareholders can rely on
Grab’s operating improvement is visible in its accounts. Revenue increased from $2.36 billion in 2023 to $3.37 billion in 2025, while adjusted EBITDA moved from a loss to $500 million. Operating profit became positive in 2025, although depreciation, stock compensation and other expenses left it well below the adjusted measure.[3]
Reported results, $m | 2023 | 2024 | 2025 |
|---|---|---|---|
Revenue | 2,359 | 2,797 | 3,370 |
Adjusted EBITDA | (22) | 313 | 500 |
Operating profit / loss | (519) | (168) | 65 |
Income attributable to owners | (434) | (105) | 268 |
Stock-based compensation | 304 | 279 | 241 |
Reported historical results. Adjusted EBITDA excludes selected expenses, including depreciation, amortization and stock compensation.[3]
The recent net-profit figures require more interpretation.
Grab reported $235 million of net profit in Q2, compared with $19 million of operating profit. The difference included a $307 million noncash gain from remeasuring its previously held Superbank interest, other finance movements and a tax credit. The acquisition created both a larger consolidated business and a substantial accounting gain in the same quarter.[2][2a]
We do not treat that net-profit figure as a clean quarterly run-rate. Our normalized earnings remove specified nonrecurring effects while retaining stock compensation, depreciation, operating taxes and the share belonging to minority owners. They are Northwise analytical estimates, not management’s forecast of every future IFRS accounting entry.
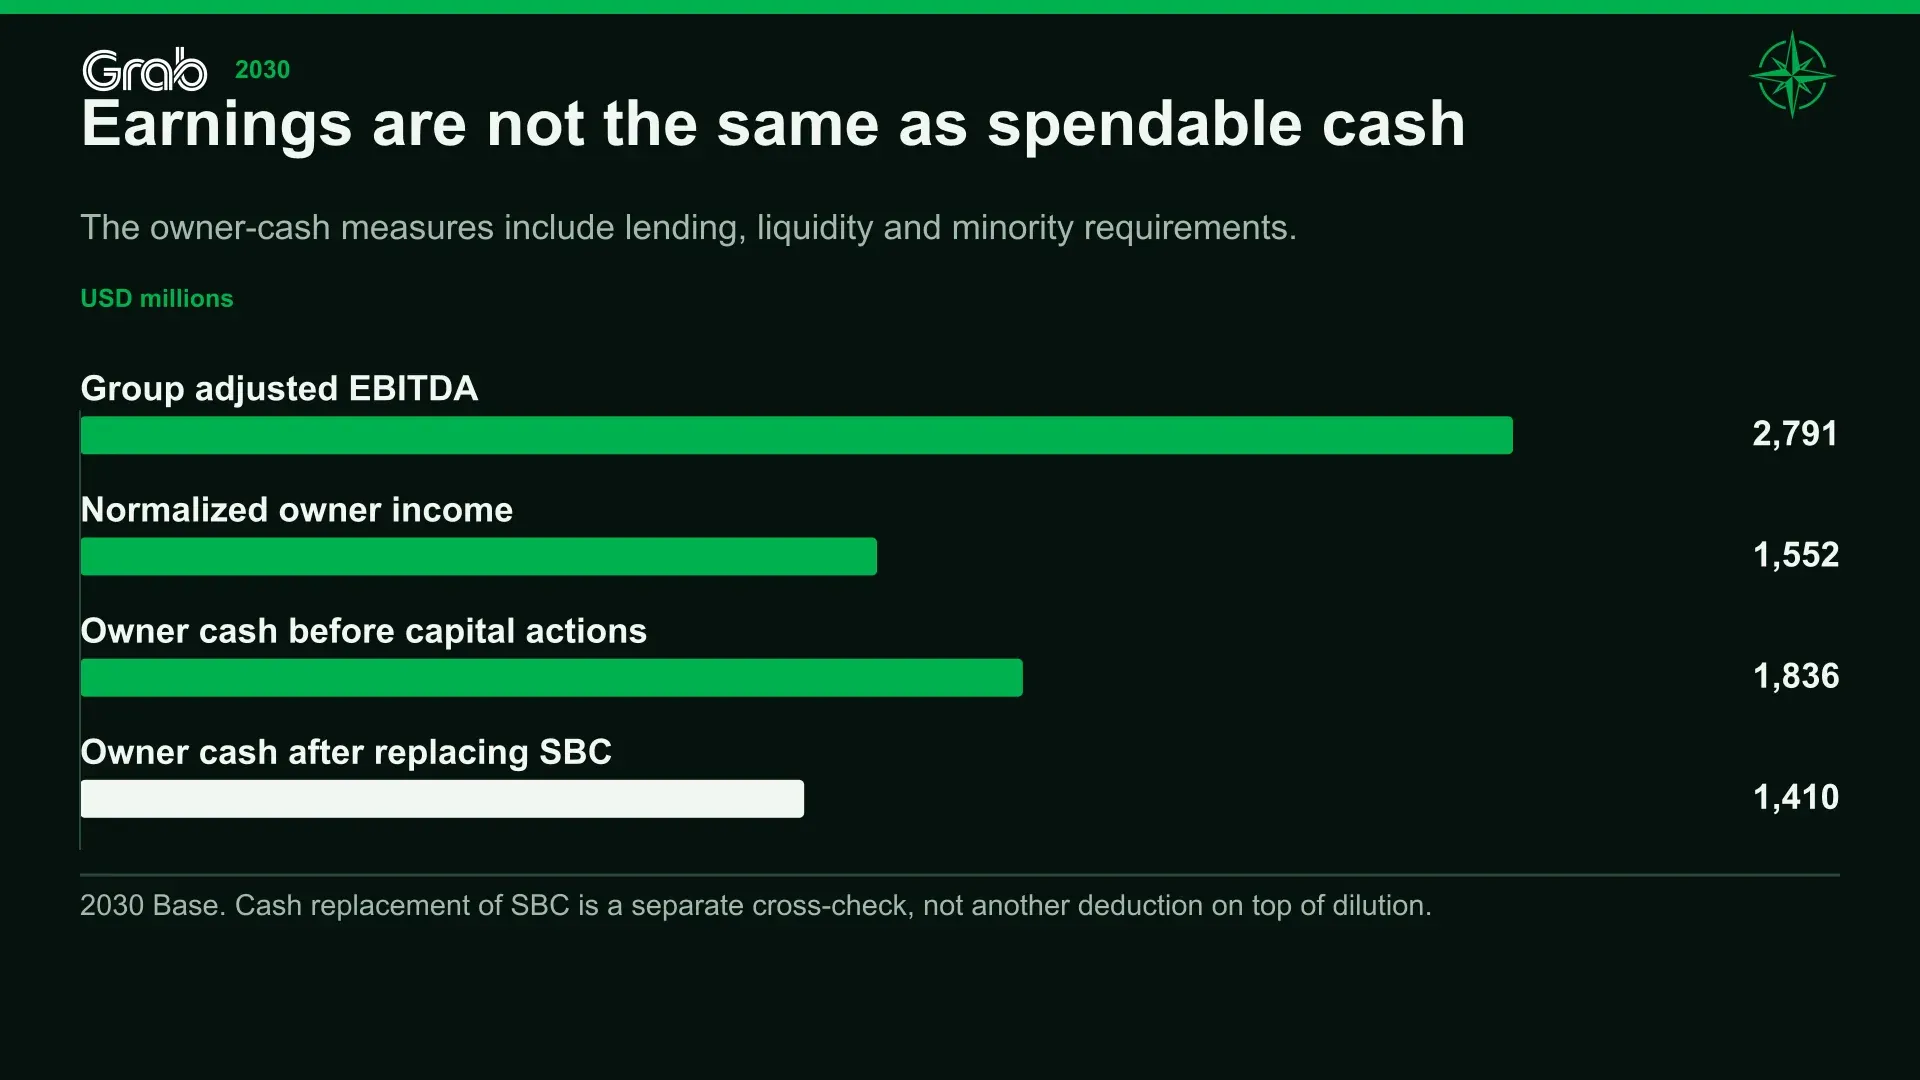
The updated Base forecast produces approximately $291 million of normalized owner income in 2026, rising to $1.55 billion in 2030. Stock compensation increases from $256 million to $426 million over that period, while depreciation and amortization reach $338 million by 2030. These costs reduce the income generated by the forecast’s $2.79 billion of adjusted EBITDA.
Taxes are not simply one rate applied to globally netted profits and losses. A loss in one jurisdiction may not shelter a profit elsewhere. We therefore do not automatically credit tax benefits to every loss-making financial operation or assume that increases in Stash’s deferred purchase price are deductible.
Minority interests also affect the result. They can absorb a share of losses in an early-stage subsidiary before later sharing its profits. The income belonging to Grab shareholders is therefore not always the same as consolidated net income. The forecast follows each ownership claim rather than treating control as 100% economic participation.
Cash has obligations of its own
Reported operating cash flow and adjusted free cash flow answer different questions for a group containing banks.
In H1 2026, operating cash flow was negative $3 million. Grab reported positive $171 million of adjusted free cash flow after capital spending, disposal proceeds and adjustments for lending, deposits and treasury-liquidity movements. The treasury adjustment was introduced in Q2.[2][2a]
Reported H1 2026 cash reconciliation | USD millions |
|---|---|
Operating cash flow | (3) |
Capital expenditures | (82) |
Disposal proceeds | 7 |
Loan-receivable adjustment | 369 |
Customer-deposit adjustment | (25) |
Treasury-liquidity adjustment | (95) |
Adjusted free cash flow | 171 |
Reported company reconciliation.[2][2a]
The measure helps isolate cash generation outside those banking movements. It does not remove the need to fund lending and maintain reserves.
Our owner-cash measure accounts for modeled banking and lending reservations, lease principal, corporate interest and minority distributions. It measures cash generation before capital actions, rather than promising that every dollar can immediately be distributed.
USD millions unless stated | 2026 | 2027 | 2028 | 2029 | 2030 |
|---|---|---|---|---|---|
Adjusted FCF estimate on a company-like basis | 553 | 1,204 | 1,914 | 2,357 | 2,815 |
Owner cash before capital actions | 480 | 960 | 1,367 | 1,667 | 1,836 |
Owner cash after cash replacement of SBC | 224 | 674 | 1,014 | 1,275 | 1,410 |
Pooled gross liquidity | 7,300 | 6,615 | 6,197 | 6,690 | 8,611 |
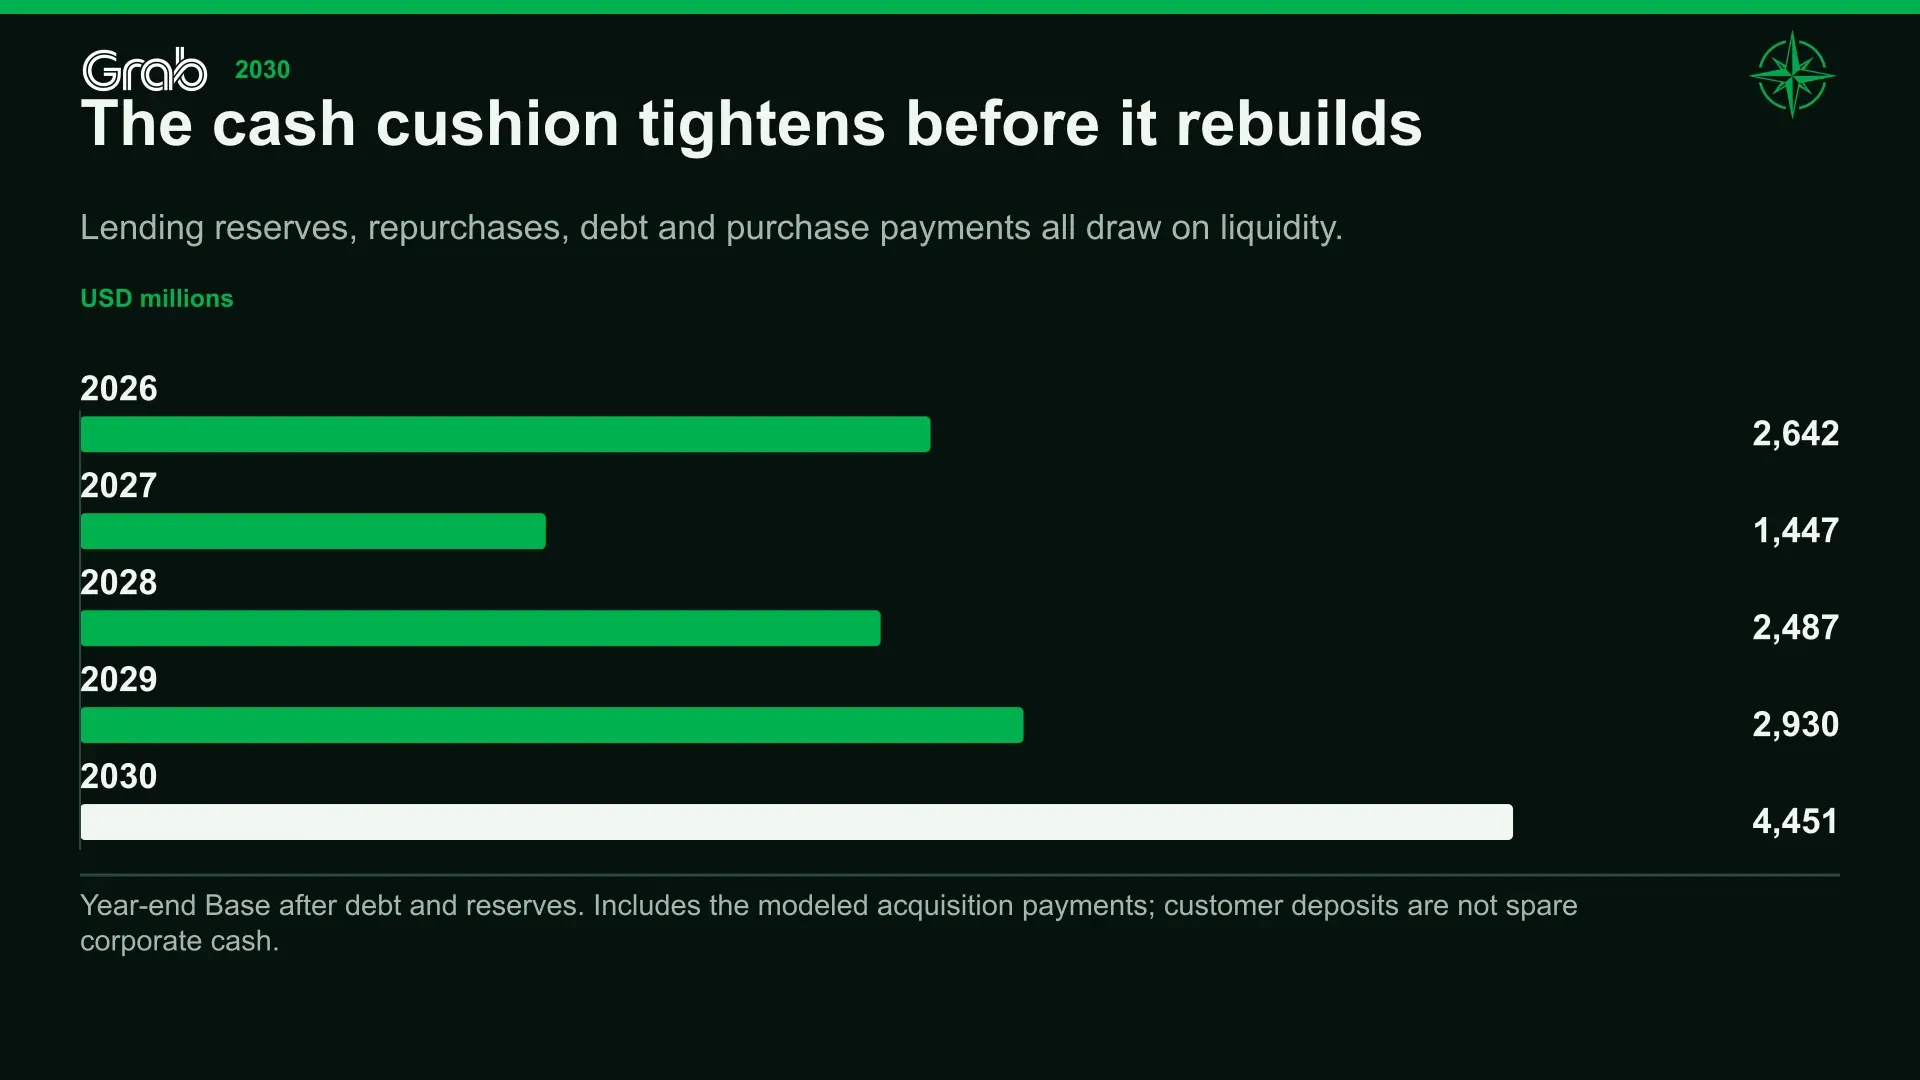
Net corporate liquidity after debt and reserves | 2,642 | 1,447 | 2,487 | 2,930 | 4,451 |
Northwise estimates. Owner cash incorporates lending and liquidity requirements and minority distributions. Cash replacement of stock compensation is a separate cross-check, not an extra deduction charged on top of the primary earnings and dilution treatment.
The gap between the adjusted FCF estimate and owner cash is close to $1 billion in 2030. That is large enough to change how the earnings opportunity should be understood. The financial businesses can be profitable while still retaining considerable resources to support their portfolios.
The cash path also reflects acquisitions, repurchases and debt repayment. Pooled liquidity falls in 2028 because Base assumes repayment of the $1.5 billion convertible principal. Net corporate liquidity after debt can increase in the same year because the obligation disappears alongside the payment. A lower gross cash balance alone would not establish weaker operations.
By 2030, the updated forecast has approximately $4.45 billion of net corporate liquidity after debt and reserves. That includes the cost of the proposed purchases and capital needed to support them. It is the relevant cash measure for the parent’s flexibility, rather than the much larger pooled balance before those claims.
14. Repurchases have to outrun the other share claims
A repurchase authorization provides flexibility to return capital, but it does not retire shares until purchases are made. The number of shares removed also depends on the execution price and the issuance occurring elsewhere.
Grab’s August announcement added $750 million to its authorization. On September 15, management said it intends to execute the remaining approximately $900 million over the following twelve months, subject to market conditions and board discretion.[2][2a][11]
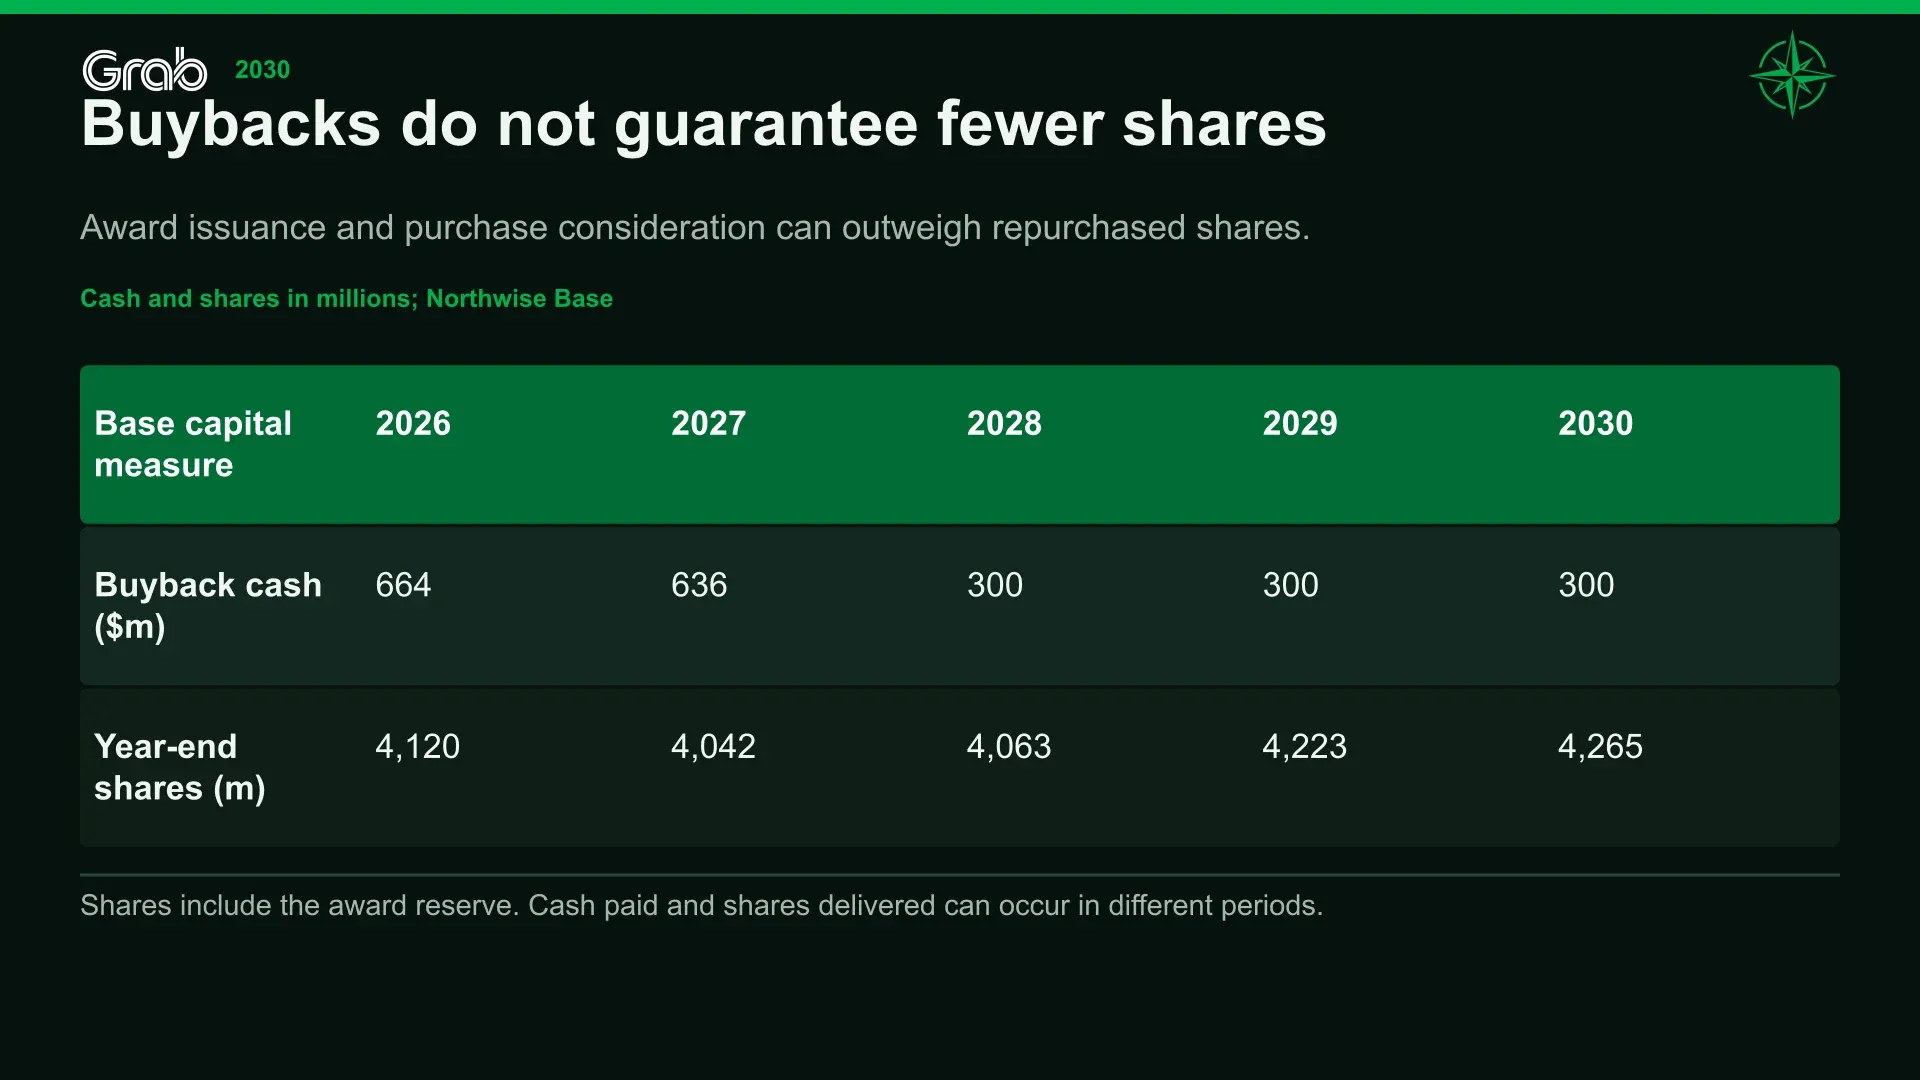
We allocate that remaining amount across the rest of 2026 and the first part of 2027. Including the $400 million already reported in the first half, the forecast contains approximately $664 million of repurchase cash in 2026 and $636 million in 2027. Later Base repurchases are $300 million annually. Those later amounts are Northwise capital-allocation assumptions, not company commitments.
The recent transactions also show why cash payment and share delivery should be followed separately. The H1 cash-flow statement recorded $400 million spent on repurchases. The July update described execution of $250 million under an accelerated repurchase and $101 million under a contingent-forward arrangement. Some shares can arrive after their purchase cash has already been paid.[2][2a]
Our schedule estimates the incremental July share delivery using the disclosed notional and an assumed execution price. It includes no unconfirmed $49 million refund. Subsequent repurchases are modeled alongside employee vesting, employee purchases and acquisition shares.
Base capital and share schedule | 2026 | 2027 | 2028 | 2029 | 2030 |
|---|---|---|---|---|---|
Full-year repurchase cash, $m | 664 | 636 | 300 | 300 | 300 |
Year-end shares including award reserve, millions | 4,120 | 4,042 | 4,063 | 4,223 | 4,265 |
Convertible principal outstanding, $m | 1,500 | 1,500 | — | — | — |
Stash deferred consideration, $m | 212 | 156 | 86 | — | — |
Atome acquisition cash paid, $m | — | 1,490 | — | 900 | — |
Northwise estimates. The share measure includes employee claims beyond issued shares and is not the statutory weighted-average diluted denominator.
Repurchases initially reduce the share count. Employee awards and acquisition consideration offset part of that benefit later. Base ends 2030 with approximately 4.27 billion shares including the award reserve. A buyback program can improve per-share value without producing a steadily declining denominator.
The zero-coupon note still has to be settled
Grab’s $1.5 billion convertible notes carry no regular coupon, but holders can require cash repurchase in June 2028, ahead of the June 2030 maturity. The initial terms imply approximately 229 million conversion shares at a price near $6.55. Bear and Base reserve for cash repayment in 2028; the specified Bull forecast assumes equity settlement in 2030. One uses liquidity, while the other preserves cash and increases dilution.[3]
Those are financing scenarios, not predictions of every holder’s decision. Debt removal and any corresponding conversion shares are modeled together. Existing warrants are excluded from later-year shares on the assumption that they expire under their stated December 1, 2026 terms; an extension would require an update.
The purchase commitments make the intervening cash schedule more demanding. Base year-end 2027 net corporate liquidity is approximately $1.45 billion after modeled debt and current reserves. Additionally setting aside the future $900 million second-stage cash payment would leave approximately $547 million. That comparison reserves a later commitment early; it does not mean the payment is due in 2027.
The ability to invest and repurchase shares simultaneously depends on cash arriving when required, not just on a large 2030 earnings estimate. That is why we retain both the share forecast and the full funding schedule.
15. The financial forecast, year by year
The operating outlook is stronger than the old permanent-margin-ceiling argument allowed. Management’s 2026 guidance midpoints already imply an adjusted EBITDA margin of approximately 17.7%, close to the 18% we previously assumed for 2030. Holding margins near that level indefinitely would require advertising, Financial Services and corporate operating leverage to make little further contribution.
We now consider a more substantial improvement the better central forecast.
Our 2026 Base estimate is $4.134 billion of revenue and $733 million of adjusted EBITDA, within management’s $4.10 billion–$4.15 billion and $720 million–$740 million ranges. It begins with published cumulative H1 revenue of $1.953 billion and adjusted EBITDA of $323 million, then adds our second-half forecast. The supplied 2026 operating guidance is unchanged by the proposed purchase; pre-closing costs and the repurchase schedule still affect income, cash and shares.[2][2a]
Growth moderates over time, but remains meaningful.
Base operating assumptions | 2027 | 2028 | 2029 | 2030 |
|---|---|---|---|---|
Mobility GMV growth, constant currency | 17% | 15% | 13% | 11% |
Deliveries GMV growth, constant currency | 20% | 18% | 16% | 14% |
Mobility EBITDA / GMV before the Indonesian reduction | 9.0% | 9.1% | 9.2% | 9.3% |
Advertising / Deliveries GMV | 2.3% | 2.6% | 2.8% | 3.0% |
Non-advertising Deliveries EBITDA / non-advertising GMV | 1.17% | 1.28% | 1.40% | 1.50% |
Existing-core credit provisions / average gross loans | 8.8% | 7.8% | 7.3% | 7.0% |
Bank deposit funding cost | 3.0% | 2.9% | 2.8% | 2.8% |
Northwise assumptions. Base currency translation is neutral, and incentives are already reflected in yields and margins. The acquired lender has separate assumptions set out above.
The annual sequence has specific financial consequences. The 2027 forecast includes a full year of Stash, a larger existing banking base and one quarter of the proposed consumer-credit acquisition. In 2028, a full year of the enlarged group is set against the modeled convertible repayment. Stash’s deferred payments finish in 2029, when we also assume the purchase of the remaining Atome interest. The 2030 results depend on the businesses sustaining their forecast operating returns and capital requirements.
Management’s revised 2028 outlook provides a useful comparison.
2028 comparison, $m | Management outlook | Northwise Base |
|---|---|---|
Group revenue | Above 7,404 implied threshold | 7,517 |
Financial Services adjusted EBITDA | 500 | 502 |
Group adjusted EBITDA | 1,700 | 1,795 |
Management’s revenue threshold is calculated from more than 30% annual growth on reported 2025 revenue of $3.370 billion. It is not an exact revenue point forecast. The outlook is subject to transaction timing.[10]
Our Financial Services estimate is close to management’s target. Group adjusted EBITDA is approximately 5.6% higher, reflecting our broader Mobility, Deliveries and corporate-cost assumptions. We are not describing the whole forecast as a conservative copy of guidance. The updated owned-receivables forecast is also not exactly comparable to management’s portfolio target because managed balances and aging definitions require further reconciliation.
Base: stronger earnings from an evolving mix
USD millions unless stated | 2026 | 2027 | 2028 | 2029 | 2030 |
|---|---|---|---|---|---|
Mobility GMV | 9,226 | 10,795 | 12,414 | 14,028 | 15,571 |
Deliveries GMV | 17,260 | 20,712 | 24,440 | 28,351 | 32,320 |
Mobility revenue | 1,340 | 1,533 | 1,780 | 2,030 | 2,274 |
Deliveries revenue | 2,182 | 2,642 | 3,171 | 3,715 | 4,277 |
Financial Services revenue, including Atome and Stash | 607 | 1,205 | 2,562 | 3,085 | 3,621 |
Group revenue | 4,134 | 5,384 | 7,517 | 8,836 | 10,178 |
Mobility adjusted EBITDA | 788 | 929 | 1,085 | 1,244 | 1,402 |
Deliveries adjusted EBITDA | 400 | 546 | 718 | 902 | 1,100 |
Financial Services adjusted EBITDA | (29) | 120 | 502 | 691 | 875 |
Regional corporate costs | 425 | 460 | 510 | 550 | 588 |
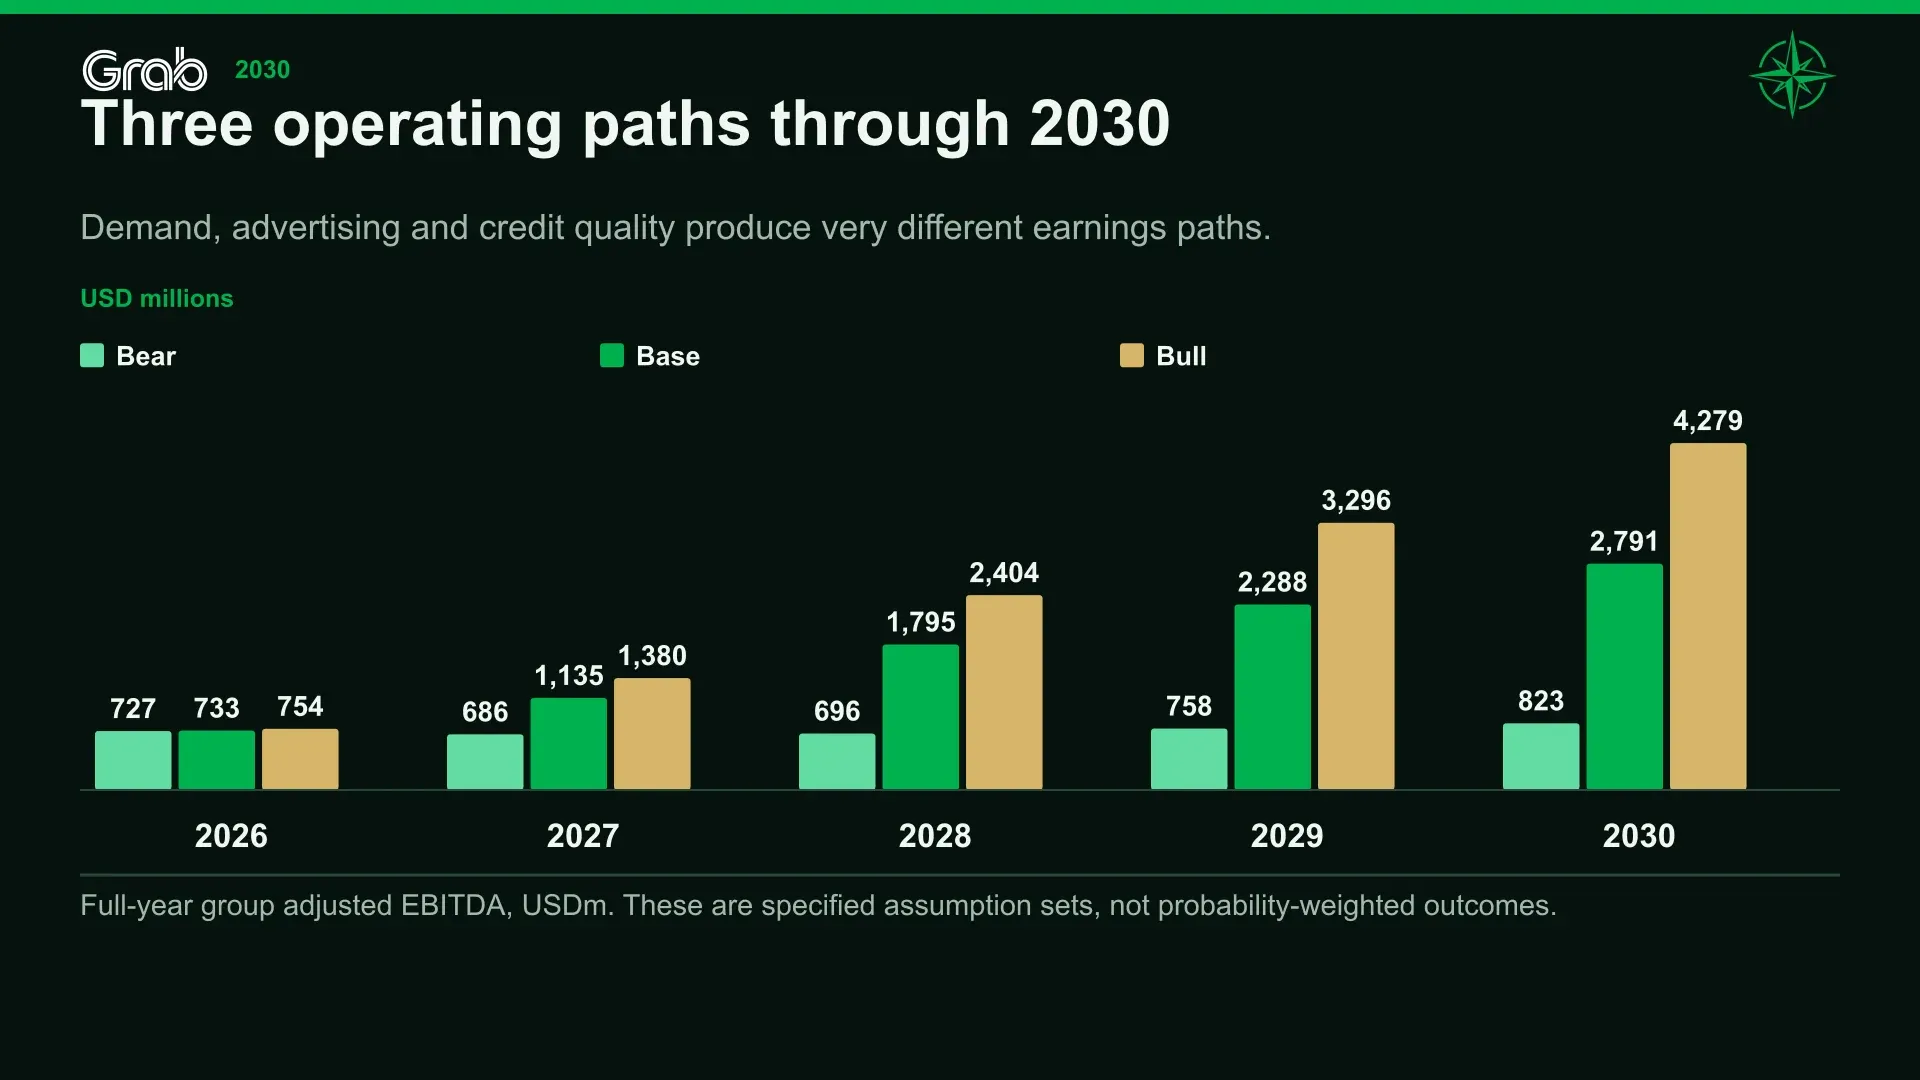
Group adjusted EBITDA | 733 | 1,135 | 1,795 | 2,288 | 2,791 |
Adjusted EBITDA margin | 17.7% | 21.1% | 23.9% | 25.9% | 27.4% |
Stock-based compensation | 256 | 286 | 353 | 392 | 426 |
Depreciation and amortization | 230 | 262 | 297 | 314 | 338 |
Normalized income attributable to owners | 291 | 507 | 827 | 1,140 | 1,552 |
Owner cash before capital actions | 480 | 960 | 1,367 | 1,667 | 1,836 |
Net corporate liquidity after debt and reserves | 2,642 | 1,447 | 2,487 | 2,930 | 4,451 |
Owned gross loan receivables | 3,100 | 5,480 | 6,980 | 8,520 | 10,060 |
Bank deposits, excluding Atome institutional funding | 3,200 | 4,400 | 5,600 | 6,800 | 8,000 |
Year-end shares including award reserve, millions | 4,120 | 4,042 | 4,063 | 4,223 | 4,265 |
Northwise estimates. Totals include the small Others segment and reporting-rounding adjustments. Advertising is included in Deliveries. Atome contributes only for the assumed consolidated periods, and its institutional funding is not included in bank deposits.
The consolidated margin increases more than the Mobility margin because the earnings mix changes. Advertising supplies a larger share of Deliveries profit, Financial Services moves from losses to a positive contribution, and corporate expenditure grows more slowly than revenue.
By 2030, Mobility and Deliveries together produce approximately $2.50 billion of segment adjusted EBITDA. Financial Services contributes approximately $875 million, before $588 million of regional corporate costs and the small Others segment are included. The on-demand businesses remain the largest source of operating earnings even after the financial expansion.
The consolidated 2030 margin is lower than in the earlier forecast without the acquired lender, despite higher dollar earnings. A larger lending business brings substantial revenue, funding and credit expense. Growth in consolidated revenue and expansion in consolidated margins need not occur at the same rate.
Bear: continued relevance, disappointing economics
The Bear forecast does not require customers to abandon Grab. It assumes slower growth, weaker monetization and a financial business that remains expensive to run.
By 2030, constant-currency Mobility growth has slowed to 7% and Deliveries to 8%, with adverse currency translation reducing reported growth further. Advertising penetration reaches only 2.2%, its contribution margin settles at 58%, and non-advertising delivery earns less from its activity. Higher credit costs keep existing core lending loss-making. The acquired business provides some segment earnings, but the associated purchase and funding claims still have to be met.
USD millions unless stated | 2026 | 2027 | 2028 | 2029 | 2030 |
|---|---|---|---|---|---|
Mobility GMV | 9,206 | 9,924 | 10,709 | 11,450 | 12,129 |
Deliveries GMV | 17,260 | 18,945 | 20,631 | 22,263 | 23,803 |
Mobility revenue | 1,338 | 1,373 | 1,450 | 1,542 | 1,634 |
Deliveries revenue | 2,181 | 2,364 | 2,554 | 2,754 | 2,945 |
Financial Services revenue, including Atome and Stash | 603 | 1,060 | 1,998 | 2,199 | 2,387 |
Group revenue | 4,127 | 4,801 | 6,005 | 6,499 | 6,969 |
Mobility adjusted EBITDA | 785 | 798 | 829 | 867 | 906 |
Deliveries adjusted EBITDA | 398 | 424 | 433 | 469 | 490 |
Financial Services adjusted EBITDA | (28) | (58) | (31) | (10) | 26 |
Regional corporate costs | 427 | 478 | 535 | 568 | 600 |
Group adjusted EBITDA | 727 | 686 | 696 | 758 | 823 |
Adjusted EBITDA margin | 17.6% | 14.3% | 11.6% | 11.7% | 11.8% |
Stock-based compensation | 257 | 281 | 328 | 343 | 350 |
Depreciation and amortization | 230 | 259 | 284 | 287 | 293 |
Normalized income attributable to owners | 272 | 163 | 72 | 97 | 151 |
Owner cash before capital actions | 462 | 453 | 387 | 424 | 480 |
Net corporate liquidity after debt and reserves | 2,278 | 471 | 716 | 600 | 892 |
Owned gross loan receivables | 3,000 | 4,620 | 5,220 | 5,820 | 6,420 |
Bank deposits, excluding Atome institutional funding | 3,200 | 3,600 | 3,950 | 4,300 | 4,700 |
Year-end shares including award reserve, millions | 4,125 | 3,996 | 4,033 | 4,200 | 4,233 |
Northwise Bear estimates, conditional on the modeled closings. Stock compensation, depreciation, minority ownership and funding needs are retained.
A large amount of spending still passes through Grab in this scenario. It produces limited improvement in group earnings because more of the benefit is consumed by competition, credit costs and the expense of operating the platform.
That is the risk in relying on continued relevance as the entire business thesis. A service can remain useful and widely used without producing the shareholder income anticipated today.
Bull: more frequent use and stronger monetization
The Bull forecast requires sustained demand and better execution across several businesses. Constant-currency Mobility growth remains at 16% in 2030 and Deliveries at 19%. Advertising penetration reaches 3.8%, compared with 3.0% in Base.
The larger financial portfolio generates more earnings potential and more capital needs. The existing convertible notes are settled in shares, preserving liquidity while increasing the denominator. Faster expansion is not treated as a reason to remove funding or compensation costs.
USD millions unless stated | 2026 | 2027 | 2028 | 2029 | 2030 |
|---|---|---|---|---|---|
Mobility GMV | 9,261 | 11,355 | 13,694 | 16,159 | 18,744 |
Deliveries GMV | 17,326 | 21,766 | 26,906 | 32,556 | 38,742 |
Mobility revenue | 1,347 | 1,643 | 2,018 | 2,419 | 2,831 |
Deliveries revenue | 2,194 | 2,856 | 3,650 | 4,532 | 5,497 |
Financial Services revenue, including Atome and Stash | 617 | 1,345 | 3,066 | 3,939 | 4,887 |
Group revenue | 4,162 | 5,849 | 8,742 | 10,902 | 13,233 |
Mobility adjusted EBITDA | 798 | 1,007 | 1,265 | 1,530 | 1,819 |
Deliveries adjusted EBITDA | 406 | 655 | 958 | 1,320 | 1,739 |
Financial Services adjusted EBITDA | (23) | 197 | 729 | 1,051 | 1,390 |
Regional corporate costs | 425 | 480 | 550 | 610 | 675 |
Group adjusted EBITDA | 754 | 1,380 | 2,404 | 3,296 | 4,279 |
Adjusted EBITDA margin | 18.1% | 23.6% | 27.5% | 30.2% | 32.3% |
Stock-based compensation | 257 | 299 | 370 | 425 | 473 |
Depreciation and amortization | 230 | 268 | 313 | 346 | 391 |
Normalized income attributable to owners | 306 | 686 | 1,255 | 1,864 | 2,673 |
Owner cash before capital actions | 497 | 1,207 | 1,859 | 2,069 | 2,608 |
Net corporate liquidity after debt and reserves | 2,654 | 1,686 | 3,098 | 3,774 | 7,346 |
Owned gross loan receivables | 3,200 | 6,320 | 8,920 | 11,900 | 15,300 |
Bank deposits, excluding Atome institutional funding | 3,300 | 5,000 | 7,100 | 9,500 | 12,200 |
Year-end shares including award reserve, millions | 4,123 | 4,063 | 4,080 | 4,196 | 4,458 |
Northwise Bull estimates, conditional on the modeled closings. A larger loan portfolio carries more credit exposure as well as more earnings.
All three cases use the same reported first-half results. Their differences emerge from subsequent growth, monetization, credit performance, expenses and capital decisions.
Taiwan remains a separate alternative
The proposed acquisition of Foodpanda’s Taiwan business is outside the principal forecast. Its agreement specifies $600 million of cash consideration for a business with approximately $1.8 billion of 2025 GMV. Management expects at least $60 million of incremental adjusted EBITDA in 2028, subject to completion.[5]
The alternative operating schedule assumes an end-2026 closing, with cash paid that year and operating contributions beginning in 2027. By 2030, it adds $540 million of revenue and $90 million of adjusted EBITDA, alongside integration costs, capital expenditure, working capital and employee dilution. That closing date is a forecast convention, not evidence that the transaction has completed.
No GoTo acquisition is included. An undefined purchase price and financing structure are not a sound basis for forecasting the principal business.
16. When the risks arrive together
The same household can be a passenger, a delivery customer and a borrower. The same restaurant can pay commissions, purchase advertising and draw working capital. That makes Grab’s customer relationships useful, but it also connects its risks.
If household income weakens, the response may appear across several parts of the business. Customers can book fewer rides, use more promotions and struggle with repayments. Restaurants facing slower sales can reduce advertising just as they become more dependent on discounted orders. Drivers may need greater earnings support when the platform has less room to provide it.
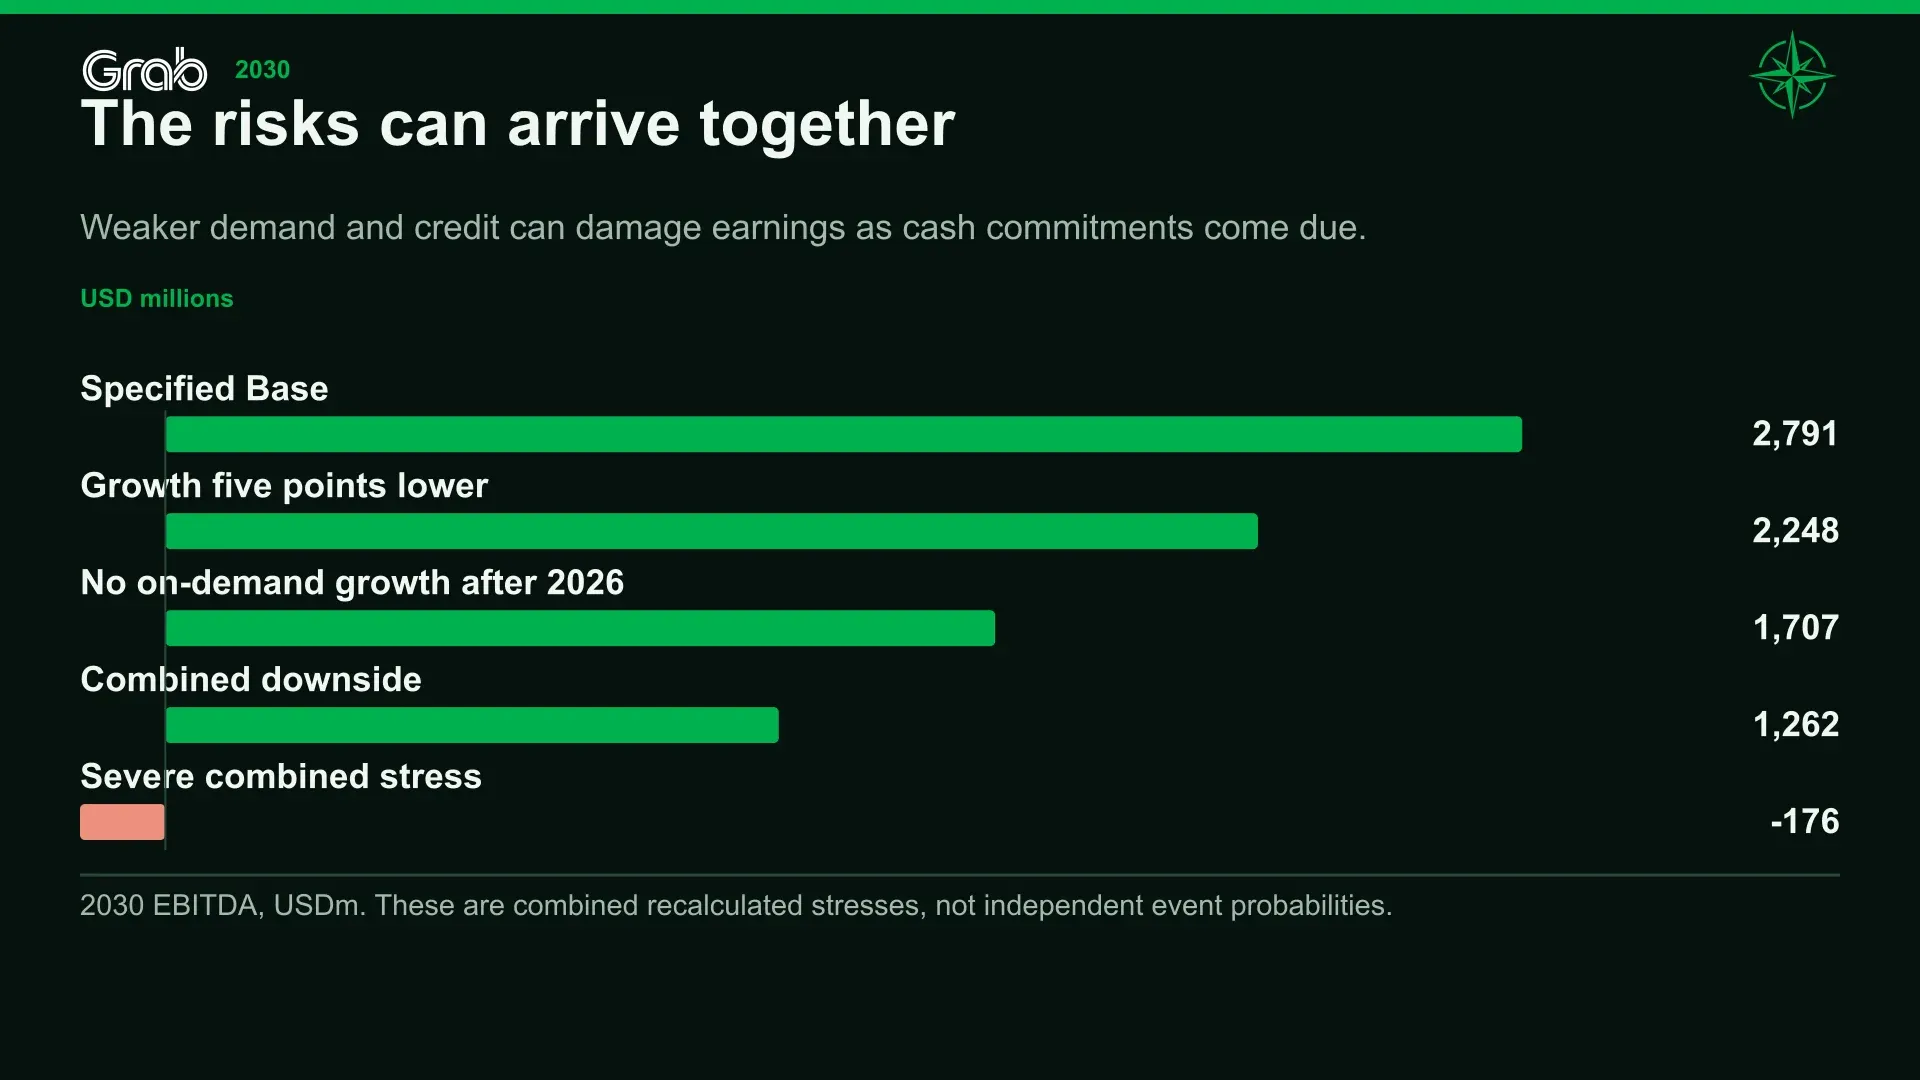
We therefore test combined pressure as well as individual changes. The selected results below show operating outcomes before assigning any share value.
Operating stress | 2030 EBITDA | Normalized owner income | Net corporate liquidity | Peak funding gap |
|---|---|---|---|---|
Base forecast | 2,791 | 1,552 | 4,451 | — |
Annual growth five percentage points lower | 2,248 | 1,175 | 3,565 | — |
No on-demand GMV growth after 2026 | 1,707 | 811 | 1,985 | — |
Annual currency translation 5% weaker | 2,161 | 1,116 | 3,442 | — |
Advertising penetration capped at 2.05% | 2,596 | 1,408 | 4,053 | — |
Advertising contribution margin reduced to 50% | 2,646 | 1,434 | 4,103 | — |
Credit provisions three percentage points higher | 2,517 | 1,389 | 3,971 | — |
Regional corporate costs 25% higher | 2,644 | 1,431 | 4,023 | — |
Combined downside | 1,262 | 402 | (97) | — |
Severe combined stress | (176) | (664) | (2,350) | 1,866 |
Combined downside with all-cash second purchase | 1,262 | 392 | (715) | 271 |
Northwise recalculated stresses, USD millions. Common growth, currency, credit and expense shocks include the relevant acquired-business exposure. Negative net corporate liquidity is not by itself insolvency; the separate funding-gap calculation tests available cash against requirements.
The combined downside includes slower growth, weaker Mobility and Deliveries economics, limited advertising penetration, higher credit costs, more expensive funding, larger capital requirements, higher overhead and higher taxes.
The severe scenario goes further, including no additional on-demand growth after 2026, persistent adverse currency translation, much heavier credit costs and no future repurchases. It still describes a sizable business, but produces negative adjusted EBITDA, a normalized shareholder loss and approximately $1.87 billion of unfinanced liquidity need.
An all-cash second-stage payment under the combined downside also produces a funding gap. Those outcomes would require changes to repurchases, financing, capital deployment or transaction terms. We do not insert an unexplained rescue financing to make the forecast appear funded.
Our central view remains constructive because Grab is expanding activity while improving adjusted operating earnings, with additional contributions developing in advertising and finance. The evidence that sustains that view must become more specific as the business matures.
We want to see Mobility’s extra trips support both driver economics and revenue yield. Advertising growth should remain worthwhile for merchants. The loan book needs to demonstrate collections and losses as its newer cohorts age. Corporate spending must rise substantially more slowly than revenue, and repurchases must be assessed against the shares issued elsewhere.
The additional capital commitments make funding terms, portfolio definitions and acquisition accounts important items to verify. They do not replace the broader tests of demand, merchant economics and operating efficiency that determine whether the platform is working.
Those are the conditions behind the forecast. They also give readers a practical basis for deciding where our assumptions are too generous or too restrained.
Northwise Premium
Choose how to continue with Northwise
Join Northwise Premium
Unlock the rest of this report, its complete valuation, the downloadable model, portfolios, and action framework.
Join Northwise PremiumCreate a Free Account
Continue across Free Northwise research, follow companies, save reports, and receive updates.
Create a Free Account
Grab Advertising
Grab advertising is lifting delivery margins through intent-based monetization that avoids labor costs, increased regulation, and pricing scrutiny.

Grab’s Fintech Business
Grab’s fintech business is infrastructure, not upside. Lending, payments, and ads stabilize drivers and merchants and narrow valuation errors.

Grab Stock Forecast 2030
A Grab Stock Forecast 2030 scenario modeling revenue, margins, cash, and valuation through across bear, base, bull, and a possible GoTo Merger.
Northwise Portfolios
See how the research becomes real decisions
Reader discussion
Discuss the research
Premium access is required to join this report's discussion.
Join Northwise Premium
No comments yet. Start a thoughtful discussion.