
ELF Stock Forecast 2030

ELF stock forecast through 2030, revenue and EPS scenarios, rhode and Naturium growth, valuation targets, present value, risks, and action zones.
In this article
E.L.F. Beauty built one of the strongest share-gain engines in consumer products. Its next phase depends on whether that same engine can carry a portfolio of brands across price tiers, channels, and geographies while preserving affordability, cultural relevance, margins, and per-share earnings growth.
1. The Core Elf Stock Forecast Investment Question
1.1 What e.l.f. Beauty Is Becoming
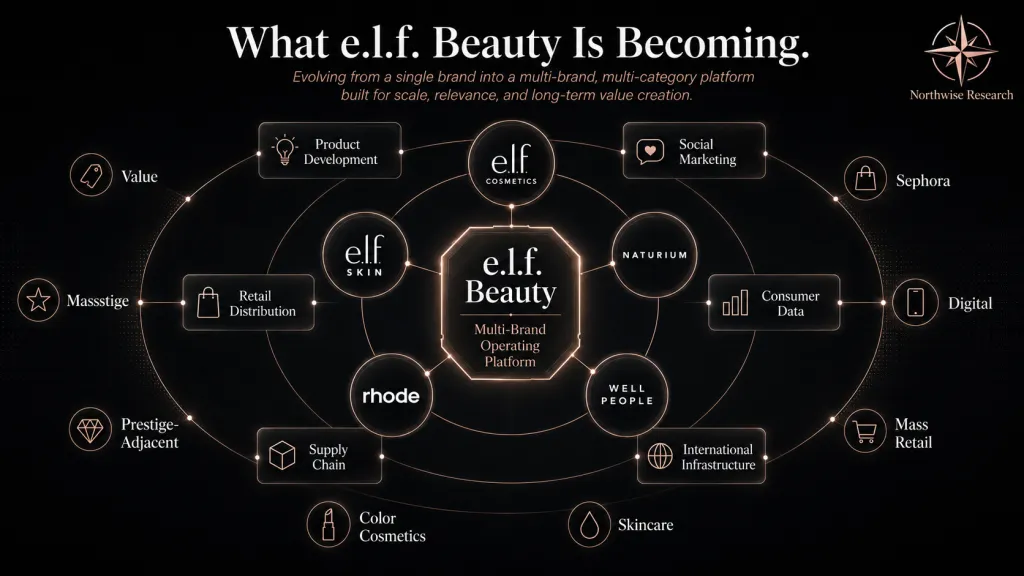
e.l.f. Beauty is moving into a different category of business than the one most investors still associate with the name. The familiar version is a single affordable cosmetics brand that took share from global incumbents by offering prestige-inspired products at mass prices. The current version is a company trying to turn the capabilities behind that brand into a multi-brand platform spanning color cosmetics, skincare, and prestige-adjacent beauty, sold through mass retail, digital marketplaces, and international Sephora distribution.
That shift shapes the entire report. The company already owns something the market values: a proven system for developing products quickly, marketing them through social channels, and converting that demand into highly productive retail shelf space. The open question is whether that system transfers cleanly to brands it did not build from the ground up, at price points and in channels that differ from the namesake brand.
e.l.f. is best understood today as an operating system in search of confirmation. It has demonstrated the system on one brand across more than a decade. It is now asking the market to underwrite the same system applied to Naturium and rhode, two acquisitions at very different stages of maturity, while the core engine that funds the experiment has slowed from an extraordinary pace.
1.2 What the Market Is Debating
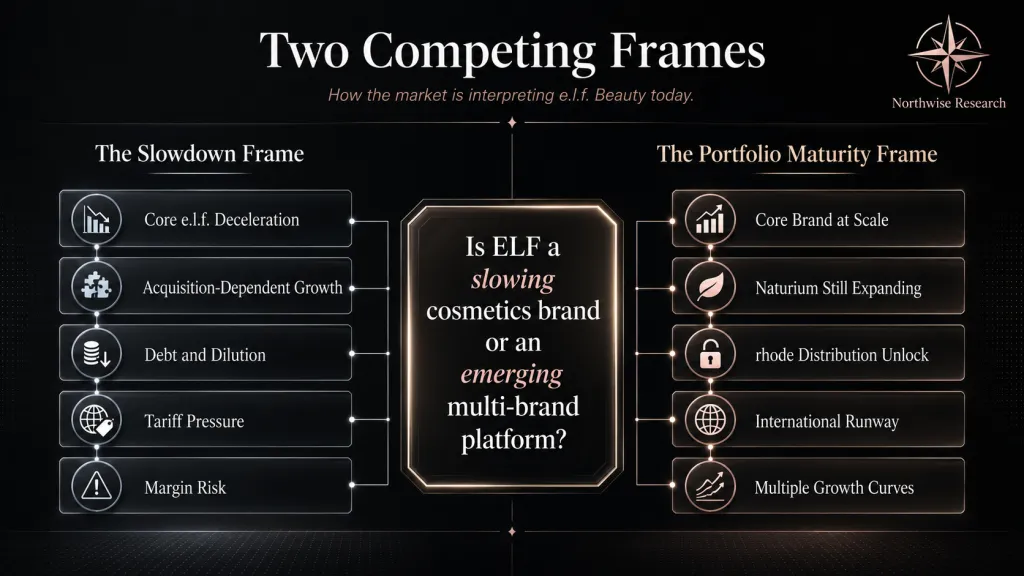
The debate around e.l.f. is sharper than a simple bull-and-bear split. Both sides can see the same facts. The company gained market share for years, the core brand has decelerated recently, and reported growth now leans heavily on acquired revenue. The argument begins once that shared starting point ends.
One reading treats the slowdown at the namesake brand as the central signal. In that view, the company is paying high prices for celebrity-linked growth, carrying new debt and dilution, absorbing tariff pressure on a China-weighted supply chain, and cutting prices in a way that suggests consumer strain. The reported revenue line still grows, though the quality of that growth has weakened.
The other reading treats the portfolio as a set of brands at different points in their lives. Core e.l.f. is the mature engine. Naturium is mid-scale and still expanding distribution. rhode is early, with international awareness far ahead of physical availability. In that view, applying the core brand's growth rate to the whole company understates the parts that have not yet ramped, and the stock may be pricing a permanent slowdown before the acquired brands reach scale.
1.3 Where the Market May Be Using the Wrong Frame
The differentiated argument in this report is narrow and specific. The market is extrapolating a core-brand slowdown across a portfolio whose largest acquired growth brand has not yet completed its distribution expansion. Core e.l.f. Cosmetics, Naturium, and rhode do not share a single growth profile, so a single consolidated growth rate applied to the whole company is the wrong tool.
That framing does not resolve the investment in either direction. A portfolio at different stages of maturity can still disappoint if launch demand fails to convert into repeat purchasing, if wholesale expansion compresses margins faster than scale lifts them, or if per-share earnings fail to keep pace with dilution. The frame simply tells us where to look. The remainder of this report builds the business from first principles, establishes the evidence, tests whether the platform thesis holds, and then quantifies the range of outcomes through fiscal 2030. The scenario model, valuation, and action framework follow in the premium section, after the operating drivers have been established.
Table of Contents
- The Core Investment Question
- What e.l.f. Beauty Is
- The Historical Crucible
- The Core e.l.f. Cosmetics Engine
- Distribution Economics
- Category Structure and Market Share
- Pricing, Value, and Elasticity
- From One Brand to a Portfolio
- The Extension and Acquired Brands
- International Expansion
- The Marketing Engine
- Product Development and Innovation
- Competitive Position
- Sourcing, Manufacturing, and Tariffs
- The Financial Foundation Today
- The Principal Risks
- Building the Revenue Model
- Brand-Level Revenue Forecasts
- Consolidated Revenue Scenarios
- The Earnings Model
- The Three Scenarios
- Valuation Framework
- Price Targets and Probability Weighting
- Present Value and Expected Return
- Action Zones
- Risk Assessment
- Sensitivity Analysis
- What Would Break or Strengthen the Thesis
- The Quarterly Monitoring Dashboard
- Final Assessment
2. What E.L.F. Beauty Is
2.1 The Company in Plain Terms
e.l.f. Beauty is a publicly traded beauty company headquartered in Oakland, California, trading under the ticker ELF. It designs and markets cosmetics and skincare products and sells them through large retailers, online marketplaces, brand-owned websites, and a growing set of international retail partners. The company controls product design, branding, and marketing, and outsources most physical manufacturing to third parties.
The portfolio includes five brands: e.l.f. Cosmetics, e.l.f. SKIN, Naturium, rhode, and Well People. The name e.l.f. originally stood for eyes, lips, face, and e.l.f. Cosmetics remains the namesake operating brand and the company's largest source of revenue. ELF is the corporate ticker, and the distinction between the company and its namesake brand matters throughout this report, since the two do not grow at the same rate.
2.2 How the Business Makes Money
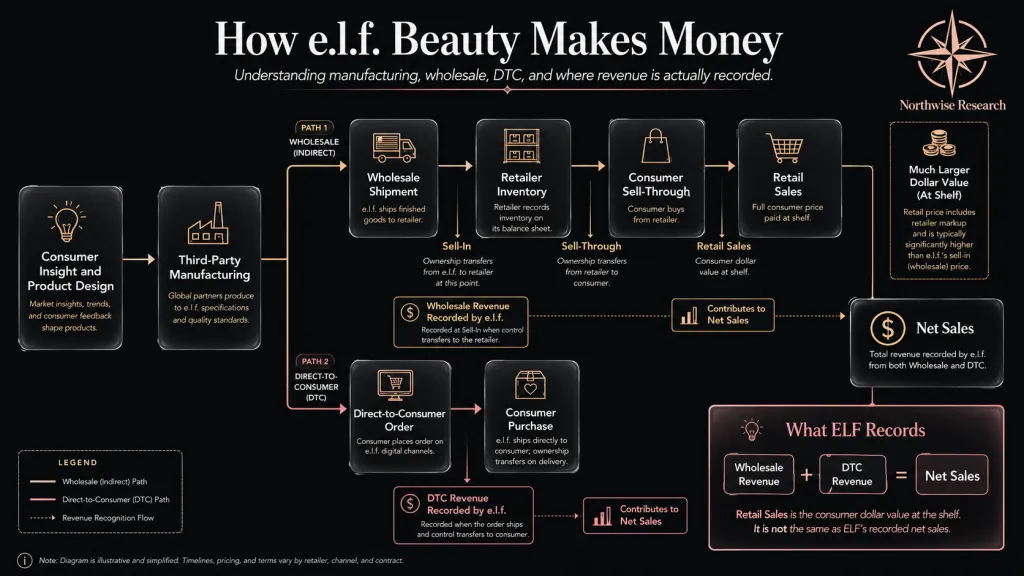
The economics are straightforward to describe and important to keep precise. e.l.f. develops a product and controls its branding. Third-party manufacturers produce most of the physical goods. The company then sells those goods either to retailers at wholesale prices or directly to consumers through its own websites and marketplaces. Retailers in turn sell the products to end shoppers.
Revenue recorded by e.l.f. is net sales, meaning gross sales less allowances, returns, discounts, and similar deductions. Gross profit is what remains after product cost, freight, tariffs, and related expenses. Marketing and corporate overhead then determine operating profitability. The structure is capital-light at the manufacturing level and marketing-heavy at the operating level, which is the reverse of many consumer businesses and central to how the company competes.
Several revenue concepts must stay separate, since conflating them produces misleading conclusions. Net sales is what e.l.f. records. Wholesale revenue is the portion sold to retailers; direct-to-consumer revenue is sold through owned channels. Sell-in is product shipped into a retailer; sell-through is product the retailer's customers actually buy. Retail sales is the dollar value of goods sold at the shelf, which for a wholesale brand is larger than the revenue e.l.f. books. This last distinction becomes decisive when discussing rhode, where global retail-sales figures are far larger than the revenue e.l.f. consolidates.
2.3 The Brand Portfolio
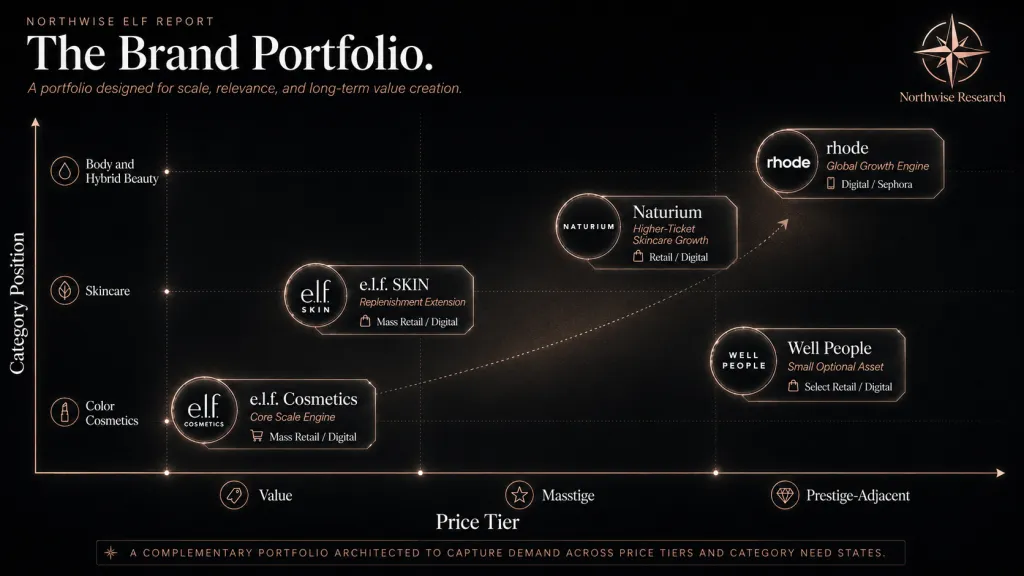
The five brands occupy different price tiers, categories, and channels, and each plays a distinct strategic role.
Brand | Category | Price tier | Primary channel | Strategic role |
|---|---|---|---|---|
e.l.f. Cosmetics | Color cosmetics | Mass and value | Mass retail and digital | Core scale and cash engine |
e.l.f. SKIN | Skincare | Mass and value | Mass retail and digital | Replenishment-led extension |
Naturium | Skincare and body care | Masstige | Target, digital, other retail | Higher-ticket skincare growth |
rhode | Skincare and hybrid makeup | Prestige-adjacent | Sephora and direct-to-consumer | Global growth engine |
Well People | Clean beauty | Masstige | Selected retail and digital | Small, optional asset |
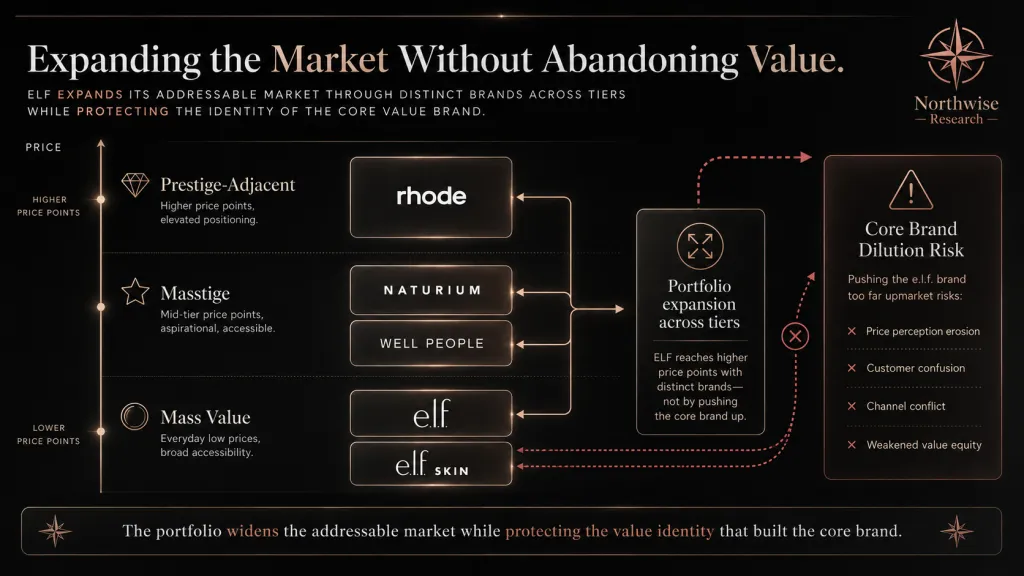
The portfolio is deliberately spread across price points. e.l.f. Cosmetics and e.l.f. SKIN anchor the value end, Naturium and Well People sit in the masstige middle, and rhode reaches toward prestige. That spread is the source of both the opportunity, since it widens the addressable market, and the risk, since it asks one organization to serve very different customers and retail partners at once.
2.4 The Distinctions That Matter
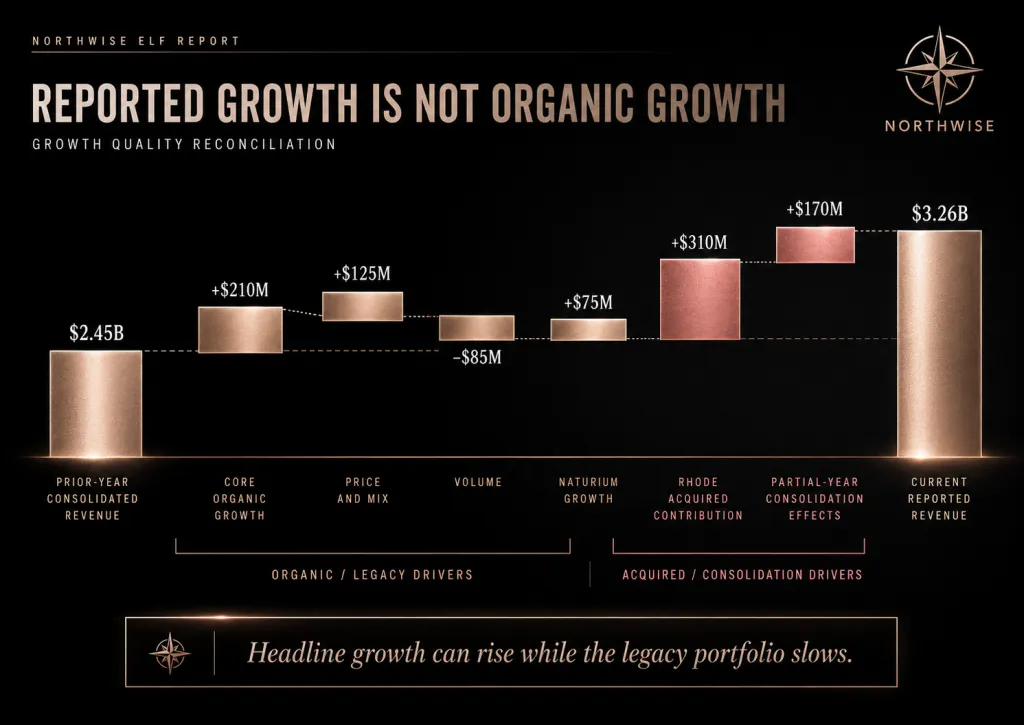
A reader evaluating e.l.f. needs to hold a few distinctions firmly. Organic growth is growth from brands the company already owned in the prior period. Acquired growth comes from brands added through acquisition, such as rhode in fiscal 2026. Reported consolidated growth blends the two, and in recent periods the acquired portion has been large enough that the headline number overstates the underlying organic trend.
The same care applies to rhode specifically. Reported rhode contribution is the revenue consolidated into e.l.f. results for the portion of the year e.l.f. owned the brand. Pro forma rhode revenue estimates a full year as if e.l.f. had owned it throughout. Global retail sales is the value of rhode product sold at retail worldwide, a larger figure than either, since it includes the retailer's markup and channels e.l.f. does not record as its own revenue. These three numbers describe the same brand and are not interchangeable.
2.5 The Metrics That Matter
Performance at e.l.f. is best read through a consistent set of measures. On the top line, net sales growth, organic versus acquired growth, and the split between United States and international sales describe where revenue comes from. Market-share change, unit growth, and price and mix describe how that revenue is being created, since growth driven by units behaves differently from growth driven by price.
On the operating side, points of distribution and sales per door measure shelf productivity. Gross margin, marketing as a percentage of sales, and adjusted EBITDA margin describe profitability and the cost of growth. Below the operating line, adjusted EPS, free cash flow, net leverage, and diluted share count determine what reaches shareholders. The recurring theme across this report is that company growth and per-share growth can diverge, and the second is what an owner actually receives.
3. The Historical Crucible
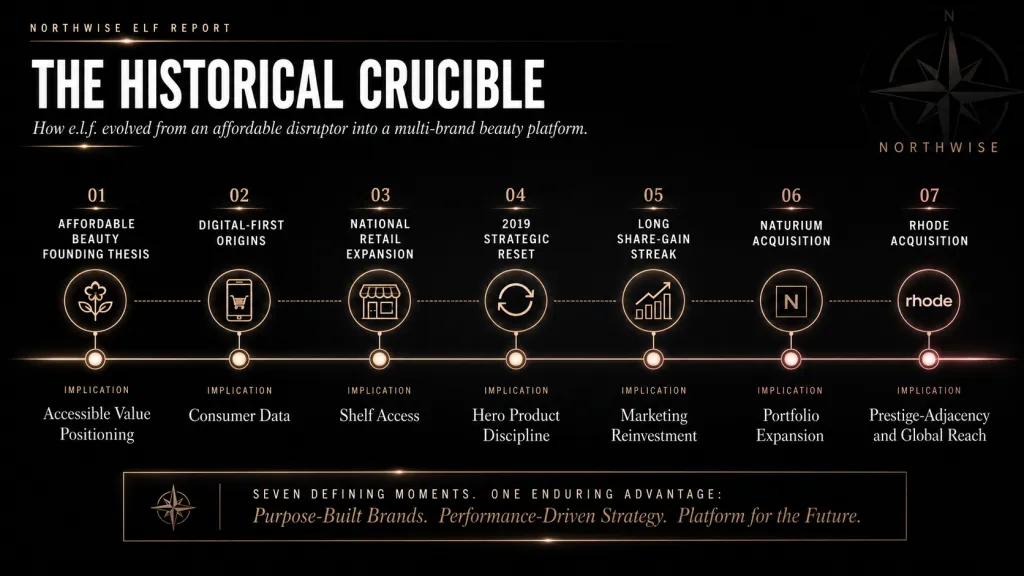
3.1 The Founding Value Proposition
e.l.f. began with a simple proposition: offer products inspired by prestige beauty at prices accessible to mass-market shoppers. The original idea was not discounting for its own sake. It attacked an industry where branding and distribution often supported large premiums over the underlying cost of a product, and it offered consumers a way to capture much of the experience at a fraction of the price.
That proposition did two things at once. It lowered the risk of trying a new product, since the cost of a miss was small, and it positioned the brand to gain relative strength whenever consumers came under financial pressure. Affordability, in this model, is not a marketing footnote. It is the structural reason the brand can keep acquiring customers across economic cycles.
3.2 From Digital Challenger to National Retail
e.l.f. used online distribution before digital beauty commerce became standard. Selling directly gave the company rapid consumer feedback, low-cost product testing, first-party data, and a culture of experimentation, all without depending on traditional department-store gatekeepers. That early digital fluency later became one of the company's durable advantages.
The move into national mass retail changed the scale of the business. Retail placement provided trial, shelf credibility, and far higher order volumes, which in turn made marketing more efficient. It also introduced new constraints: retailer bargaining power, inventory commitments, fixture costs, and heavier working-capital demands. The company's later success came from managing those constraints well enough to keep expanding shelf space profitably.
3.3 The 2019 Reset
Around 2019, e.l.f. shifted from broad, somewhat unfocused expansion toward a more disciplined growth model. The reset concentrated effort on hero products, faster innovation cycles, heavier and more targeted marketing, deeper digital engagement, stronger retail execution, and better consumer insight. The change was less a single decision than a coordinated tightening of how the company developed, marketed, and placed products.
The reset is the hinge of the company's history. The growth that followed was not the product of a favorable category, since the broader mass cosmetics market was often flat or shrinking. It came from a repeatable operating method that turned consumer signals into products and products into shelf space at a faster cadence than larger competitors could match.
3.4 The Share-Gain Streak and What It Proves
e.l.f. entered 2026 having compounded net-sales growth and mass-market color-cosmetics share gains for roughly twenty-eight consecutive quarters. The streak is impressive, and it is more useful to understand its mechanics than to admire its length. The growth came from a combination of stronger products, a widening price advantage, expanding shelf space, higher sales velocity per location, social engagement that lowered customer-acquisition cost, and the early stages of international expansion.
The record proves several things. e.l.f. can revive a slowing brand, marketing investment can produce durable rather than fleeting growth, the company can gain share even in a weak category, affordable products can support premium gross margins, and management has executed across several different operating environments.
The record does not prove that rhode will remain culturally relevant, that every acquisition will succeed, that the core brand can grow at double-digit rates indefinitely, or that tariff costs can always be passed through. The forward thesis depends on the second list as much as the first.
4. The Core E.L.F. Cosmetics Engine
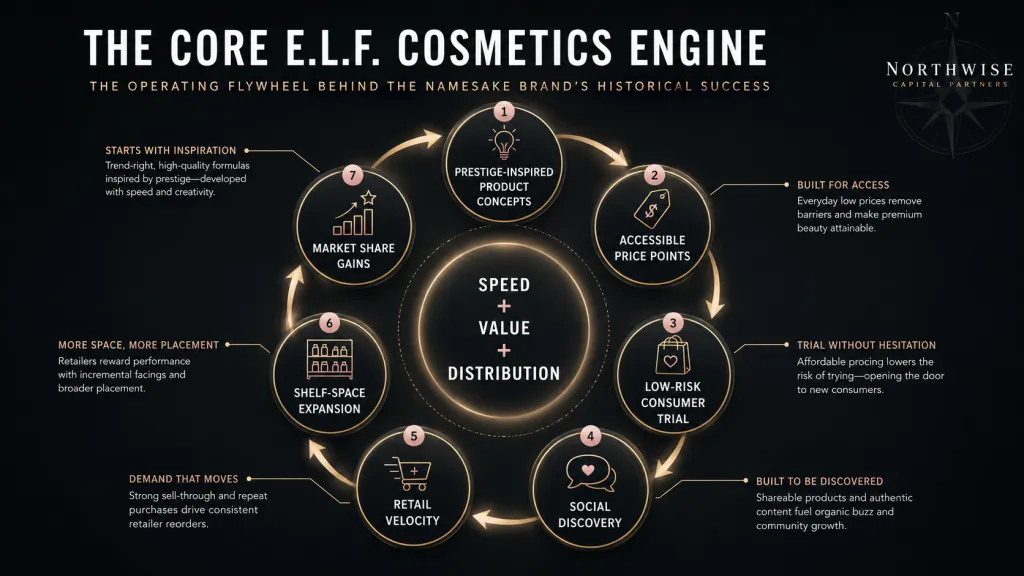
4.1 Prestige-Inspired Products at Mass Prices
The core brand works by identifying demand around prestige formats, ingredients, finishes, or routines and developing accessible alternatives at a fraction of the price. The result spans recognizable hero categories such as primers, complexion products, lip products, mascaras, brow products, and setting sprays and powders. The aim is to compress the time and price barrier between an emerging beauty preference and its mass-market availability.
The skill is less about any single product and more about the cadence. e.l.f. has built an organization that can read a trend, develop a credible version, and place it on shelf faster than most competitors can move a comparable product through their own development cycles. Speed at low price is the engine.
4.2 The Price Gap as an Acquisition Tool
The price difference between e.l.f. and prestige or masstige peers does more than appeal to budget-conscious shoppers. It lowers the risk of trial, encourages larger multi-item baskets, and widens the pool of customers who can afford to participate. A shopper willing to spend $6 on a primer will experiment in ways a $36 alternative discourages.
The same gap carries a constraint. As e.l.f. raises prices toward masstige competitors, the reason to choose the brand weakens. The value advantage is an asset that erodes if priced away, which is why pricing decisions at e.l.f. carry more strategic weight than they would at a premium house. This tension reappears directly in the pricing section.
4.3 Speed and Social Discovery
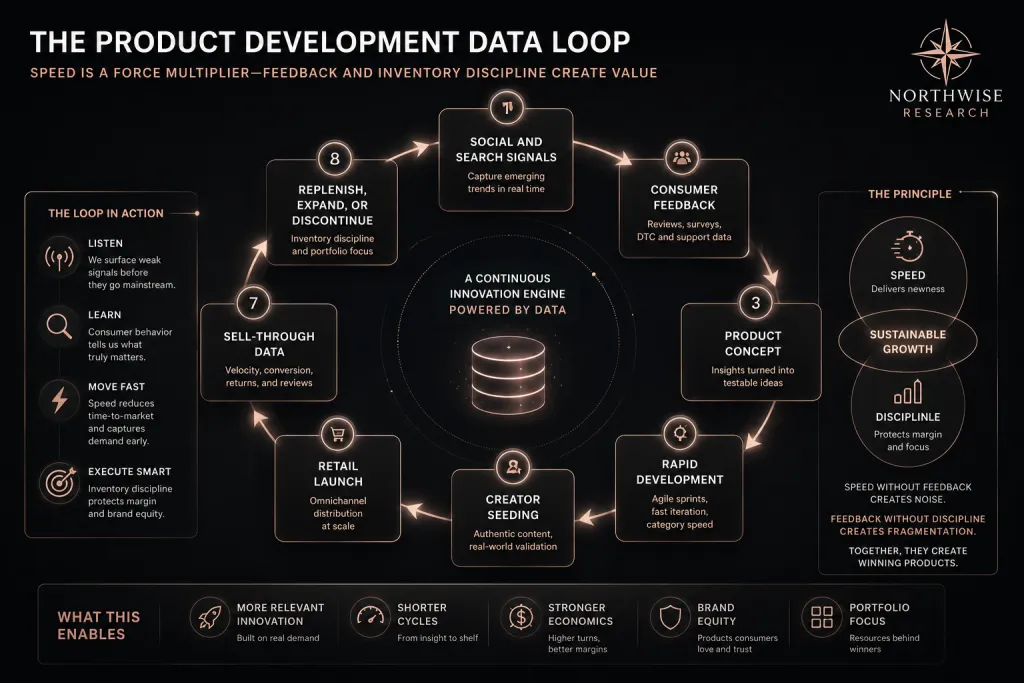
Social media functions at e.l.f. as a feedback and distribution system rather than a billboard. The company uses social channels to identify demand, seed products, monitor reactions, build cultural relevance, and direct shoppers toward retail, generating earned media that lowers the effective cost of marketing. The loop between social signal and product decision is tight enough that the brand can adjust quickly when a category heats up or cools.
The advantage compounds with the development cycle. A fast social-listening capability is only valuable if the company can act on it quickly, and a fast development cycle is only valuable if it is pointed at real demand. e.l.f. has built both, and the combination is harder to copy than either piece alone.
4.4 Retail Shelf Productivity
Retailers do not expand shelf space because a brand has followers. They expand it because the brand produces attractive sales per linear foot, drives store traffic, and turns inventory efficiently. e.l.f. has earned shelf space and endcaps over time by demonstrating that its products sell through quickly, which is the only durable basis for distribution growth.
This is the bridge between the brand's cultural relevance and its financial results. Social demand that does not convert into shelf velocity eventually loses its space. The fact that e.l.f. has kept gaining shelf space over many years is evidence that its demand has been real at the register, not only online.
4.5 The Slowdown Question
Reported consolidated growth remains strong, though the namesake brand has slowed relative to its prior pace. The honest reading is that several factors are likely at work at once: difficult comparisons against years of rapid growth, retail inventory timing, the lingering effect of earlier price increases, consumer pressure, category softness, the natural maturation of shelf-space gains, and intensifying competition.
The appropriate modeling stance is to assume neither collapse nor automatic return to prior growth. A brand of this scale and relevance can slow without becoming structurally impaired, and the relevant question for the forecast is whether the core can stabilize at a healthy, lower growth rate while the acquired brands carry the incremental expansion. That assumption is tested directly in the revenue model.
5. Distribution Economics
5.1 How Beauty Distribution Works
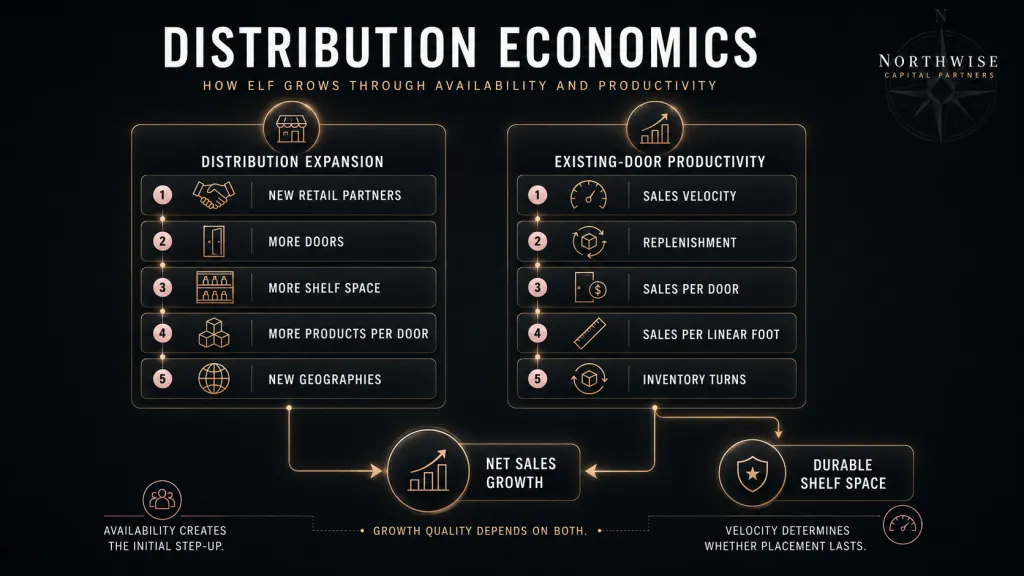
Revenue in mass beauty grows through a handful of distinct levers: more retail partners, more doors within a partner, more shelf space per door, more products per shelf, higher sales velocity at each location, higher prices, and improved mix. Each lever behaves differently. Adding doors and shelf space creates a visible step-up in revenue as product fills new space. Velocity, meaning how much each location actually sells, determines whether that space survives the next reset.
The vocabulary is worth fixing. A door is a single store carrying the brand. Points of distribution count the number of distinct product placements across stores. Sell-in is what ships to the retailer; sell-through is what the retailer's customers buy; replenishment is the reordering that follows healthy sell-through. Sales per door and sales per linear foot measure productivity, and inventory turns measure how efficiently the shelf converts stock into sales.
5.2 The Retail Partners
e.l.f. reaches consumers through several overlapping systems. In United States mass retail, Target, Walmart, and Ulta Beauty are central partners, supplemented by drugstores, grocery, and dollar channels. Digital distribution runs through Amazon, TikTok Shop, and the company's own websites. International retail, still smaller, runs through a mix of mass partners for the core brand and Sephora for rhode.
e.l.f. does not disclose revenue by individual retailer, so any retailer-specific revenue figure would be an estimate rather than a reported fact. What the company does make clear is that a small number of large retailers account for a substantial share of sales, which is a strength when those relationships are expanding and a concentration risk when they are not.
5.3 Distribution Growth Versus Velocity
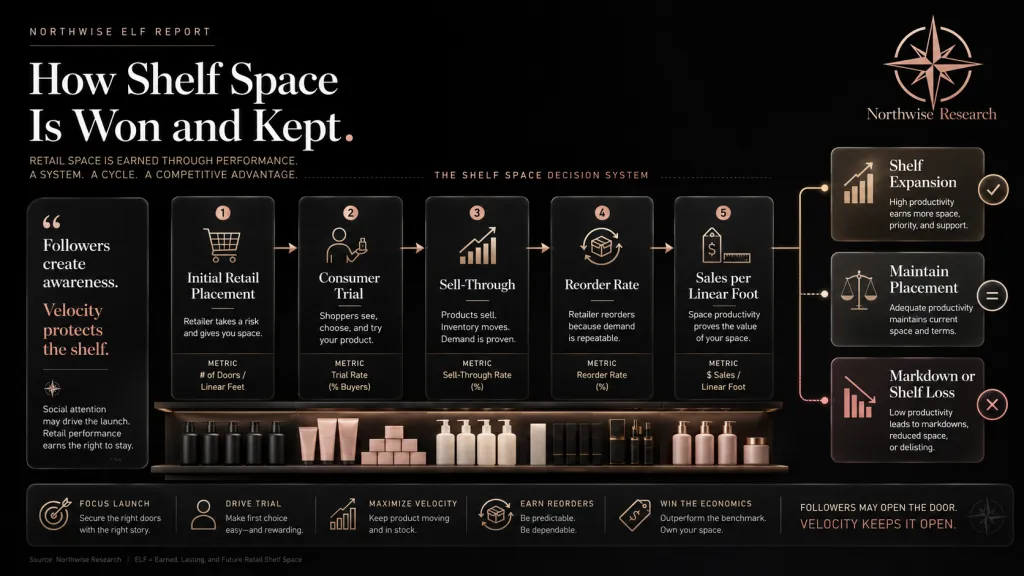
The model separates two sources of revenue that are easy to blur. Distribution growth is revenue created because more product is available in more places. Velocity growth is revenue created because each existing location sells more. The first can be engineered relatively quickly through retailer commitments; the second reflects genuine consumer pull and is the more durable of the two.
This distinction governs how to read a strong quarter. Growth led by new shelf space is encouraging but provisional, since the space must earn its keep through sell-through or it will be reallocated. Growth led by rising velocity in existing doors is higher quality, since it signals that demand is deepening where the brand already competes. The healthiest expansion combines both, with new doors backed by strong sell-through.
5.4 Retailer Concentration
A meaningful share of e.l.f.'s sales flows through a few large retail customers. That concentration creates several specific exposures. A large retailer can reduce shelf space at a reset, delay implementation of a price update, shift order timing in ways that distort a single quarter, demand promotional support, or favor a competing brand. None of these is hypothetical for a wholesale-led model, and each maps to a line in the financial results.
The mitigant is sell-through. A brand that consistently sells well at the shelf has leverage in those negotiations, since the retailer's own economics depend on the space being productive. e.l.f.'s long record of share gains suggests it has held that leverage, though the recent core slowdown is worth monitoring precisely because it is the kind of trend that, if sustained, would weaken it.
6. Category Structure and Market Share
6.1 The U.S. Mass Color-Cosmetics Market
The core brand competes primarily in United States mass color cosmetics, a category distinct from prestige beauty sold at department stores and Sephora, from masstige brands priced in between, and from skincare. Mass color cosmetics is a mature category whose overall growth is modest and often cyclical, which makes the source of any individual company's growth especially important to identify.
In a mature category, a company can grow only by taking share, by benefiting from category growth, or through distribution and mix effects. For most of its recent history, e.l.f. has grown by taking share, frequently while the category itself was flat or contracting.
6.2 Category Growth Versus Share Gains
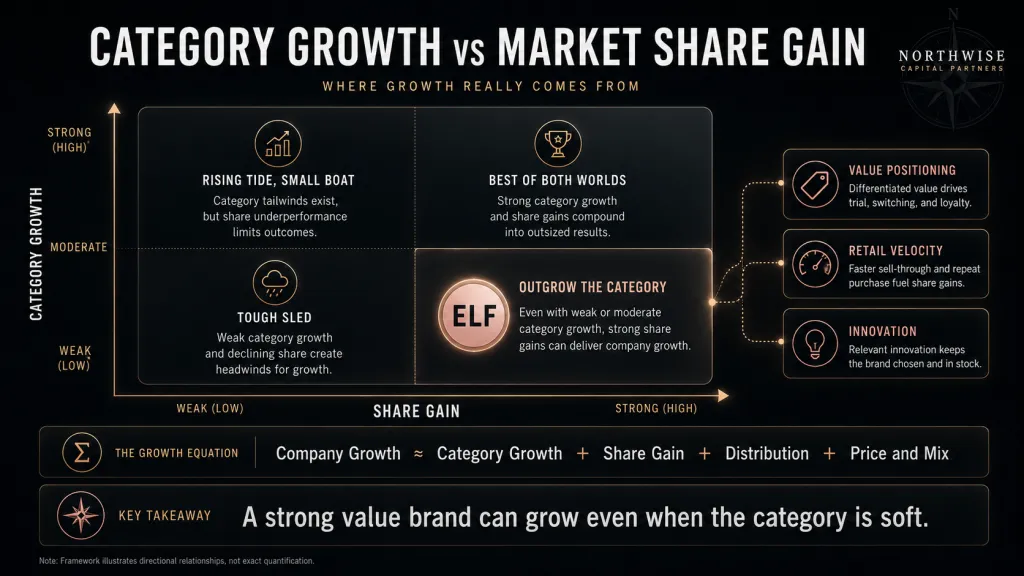
A simple identity organizes the analysis: company growth approximately equals category growth plus share gain plus distribution and mix effects. If a category contracts 3 percent but a company gains enough relative share, it can still grow at a healthy rate. e.l.f.'s record is largely a share-gain story layered on a soft category, which is both impressive and, eventually, self-limiting.
The implication for the forecast is that core e.l.f. growth cannot be modeled as a fixed percentage in perpetuity. As share rises, the base from which further gains must come grows larger, competitors respond, and category dynamics matter more. The model treats core growth as a decelerating series rather than a constant.
6.3 Where e.l.f. Is Strong and Where It Is Underpenetrated
e.l.f. has reached leading or near-leading positions in several mass color-cosmetics segments and among younger consumers, where its social fluency and price position resonate most. Those strengths are real and durable, though they also mean the easiest share has already been captured in the brand's strongest categories.
The underpenetrated opportunities sit elsewhere: skincare, where e.l.f. SKIN and the acquired brands extend the proposition; international markets, where awareness exceeds availability; and adjacent categories and lower-density domestic markets where the brand is still building presence. The forward growth case relies more on these underpenetrated areas than on the categories e.l.f. already leads.
6.4 The Limits of Share-Gain Mathematics
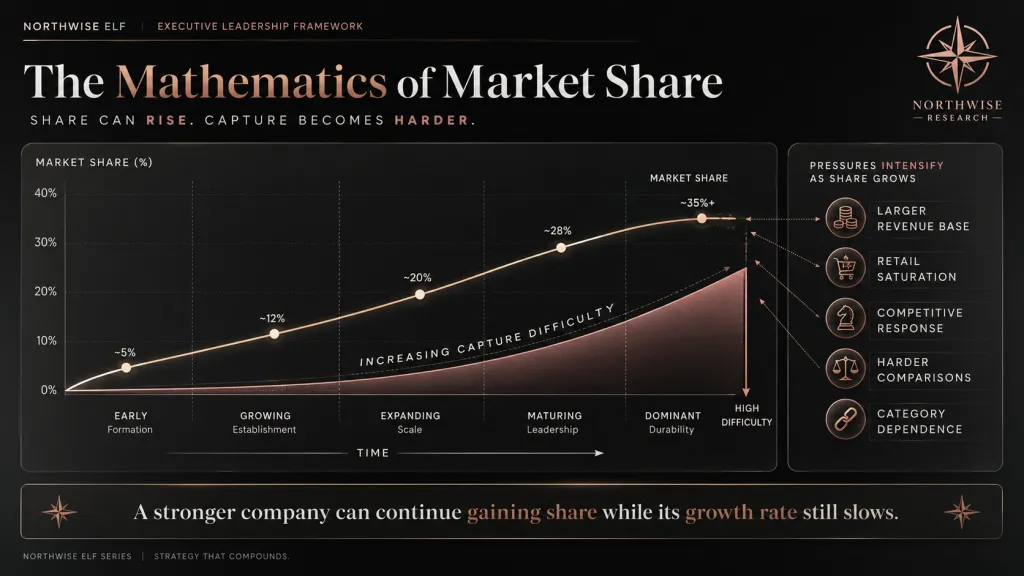
No company gains share indefinitely at the same rate. As e.l.f.'s share rises, the arithmetic works against continued gains at the prior pace, competitors adjust their products and pricing, and retail shelf gains become harder to win. A weak category can actually help a strong value brand for a time, since retailers and consumers concentrate on affordability, though prolonged category weakness eventually constrains everyone, including the share gainer.
This is the structural reason the core-brand slowdown deserves a measured interpretation rather than alarm. Some deceleration was mathematically inevitable. The investment question is whether the core settles at a healthy growth rate or deteriorates further, and that question is answered by units and sell-through, not by the headline share number alone.
7. Pricing, Value, and Elasticity
7.1 Affordability as a Moat
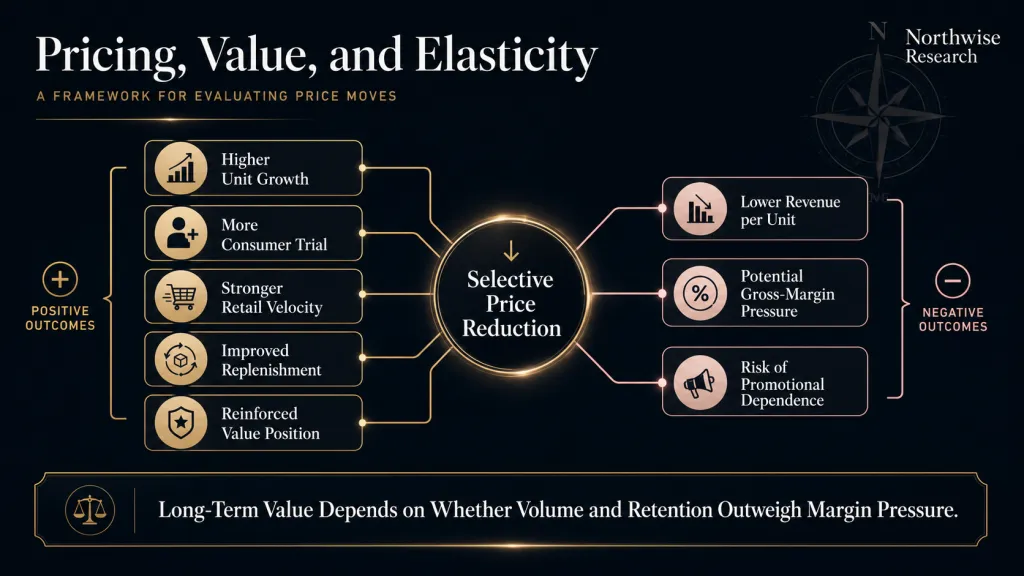
Affordability is part of e.l.f.'s competitive moat, not a discount tactic layered on top of it. The brand's permission to react quickly, its ability to acquire customers cheaply, and its appeal during periods of consumer pressure all rest on staying meaningfully cheaper than masstige and prestige alternatives. Pricing decisions therefore affect more than gross margin per unit; they affect the brand's core reason to exist.
The strategic implication is that maximizing average selling price does not maximize long-term value. A price increase that lifts revenue per unit while suppressing trial and replenishment can weaken the very advantage that drives customer acquisition. The company has to manage price as a lever inside a system rather than as a simple revenue dial.
7.2 The 2025 Price Increase and the 2026 Partial Reversal
In August 2025, e.l.f. raised prices across much of its assortment, a move tied closely to higher tariff costs on its China-weighted supply chain. The increase was implemented through retail partners over the following months and introduced near-term disruption as price points adjusted and consumers absorbed the change.
By spring 2026, the company moved to walk back part of those increases, citing consumer strain and elevated everyday costs such as fuel. The sequence is informative. It shows that the tariff-driven price increase was not free, that management is willing to reverse a pricing decision when the volume cost becomes clear, and that affordability remains a managed strategic constraint rather than a fixed margin target. The episode also frames the elasticity question directly.
7.3 The Halo Glow Test and What Elasticity Reveals
The clearest single data point on elasticity came from the Halo Glow Liquid Filter, where reducing the price from roughly $18 to $14 produced a substantial early sales lift across Amazon and broader retail. A lower price drove materially more units, which is exactly what a strong value brand would expect when it widens its price advantage.
The lift in units is not the same as a lift in profit, and the report does not treat it as such. What the response reveals is that demand for the product remains present, that the higher price had been constraining trial or replenishment, that brand awareness is intact, and that value can be actively managed to restore volume. It also confirms that price increases carry a real volume cost, which is the other side of the same coin.
7.4 The Tradeoff Between Price and Volume
The forward model treats price and volume as a tradeoff rather than independent levers. A lower price sacrifices gross profit per unit while potentially expanding units, retail productivity, and customer acquisition. Whether that trade creates value depends on the volume response and on whether sourcing and mix can offset part of the margin cost. The scenario assumptions, developed in the premium section, differ mainly in how favorable that tradeoff turns out to be: modest unit recovery and margin absorption in the weak case, a balanced offset in the central case, and strong volume-led productivity gains in the strong case.
8. From One Brand to a Portfolio
8.1 Why e.l.f. Expanded
e.l.f. expanded beyond its namesake brand for a structural reason. The core operating capabilities, consumer insight, fast product development, social marketing, retail relationships, digital infrastructure, supply-chain scale, and international reach, are largely brand-agnostic. If those capabilities are the true source of advantage, then applying them to additional brands could extend the company's growth runway well beyond a single, maturing category.
Skincare was the natural first direction. It is a larger and higher-replenishment category than color cosmetics, it suits the same retail partners, and it lets the company reach higher price points without forcing the value-priced namesake brand upmarket and eroding its moat. e.l.f. SKIN, Naturium, and rhode each represent a different path into that broader opportunity.
8.2 The Shared Capabilities
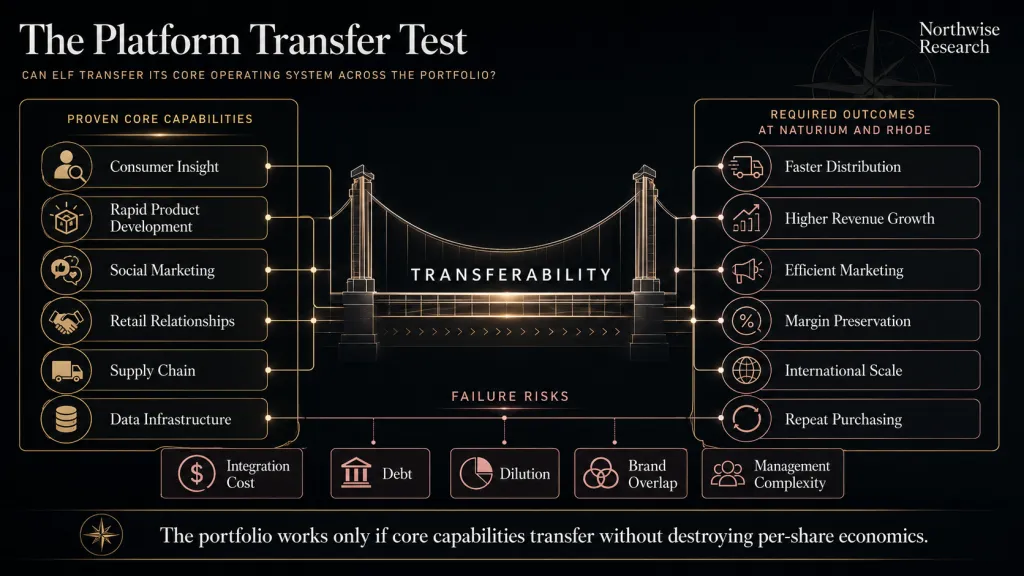
The platform thesis rests on whether seven capabilities transfer across brands: retailer relationships that can place new brands on shelf, first-party consumer data that informs development, a social-marketing engine that lowers acquisition cost, a fast product-development cycle, supply-chain scale that improves sourcing, distribution infrastructure that reaches new geographies, and international reach. When these are genuinely shared, a new brand inherits advantages it could never build alone at the same speed.
The test is empirical, not theoretical. Naturium provides the cleaner evidence so far, since it sits closer to e.l.f.'s existing mass and masstige channels. rhode is the harder test, since it operates at a higher price point, through Sephora rather than mass retail, and with a brand identity tied to a founder. The report evaluates each separately rather than assuming the capabilities transfer uniformly.
8.3 When Portfolio Scale Helps and When It Hurts
A portfolio creates value only when shared capabilities outweigh the costs of complexity. The costs are concrete: acquisition premiums paid for growth, integration expense, debt service, dilution from stock used as consideration, management attention divided across brands, and the risk that brands overlap and cannibalize one another. Many consumer companies have destroyed value by acquiring growth they could not integrate.
The favorable case is that e.l.f.'s distribution and marketing infrastructure lets each acquired brand reach scale faster and at lower incremental cost than it could independently, while the brands remain distinct enough to avoid overlap. The unfavorable case is that complexity slows the organization, dilutes its focus, and pressures margins faster than scale lifts them. The financial model is built to expose which case the numbers actually support, rather than to assume leverage appears automatically.
9. The Extension and Acquired Brands
9.1 e.l.f. SKIN
e.l.f. SKIN extends the core value proposition into skincare, a category with higher replenishment than color cosmetics. The company does not disclose separate revenue for the brand, so its trajectory must be estimated from shelf expansion, new product launches, category performance, search interest, retailer rankings, and management commentary. Any specific revenue figure for e.l.f. SKIN in this report is a Northwise estimate rather than a reported number.
Strategically, e.l.f. SKIN matters as a relatively low-risk extension. It uses the same brand equity, the same retail partners, and the same marketing engine as the core brand, while reaching into a category where customers buy more frequently. Its main risk is overlap with the company's other skincare brands, which the company manages through positioning and price, with e.l.f. SKIN anchoring the value end of the skincare shelf.
9.2 Naturium
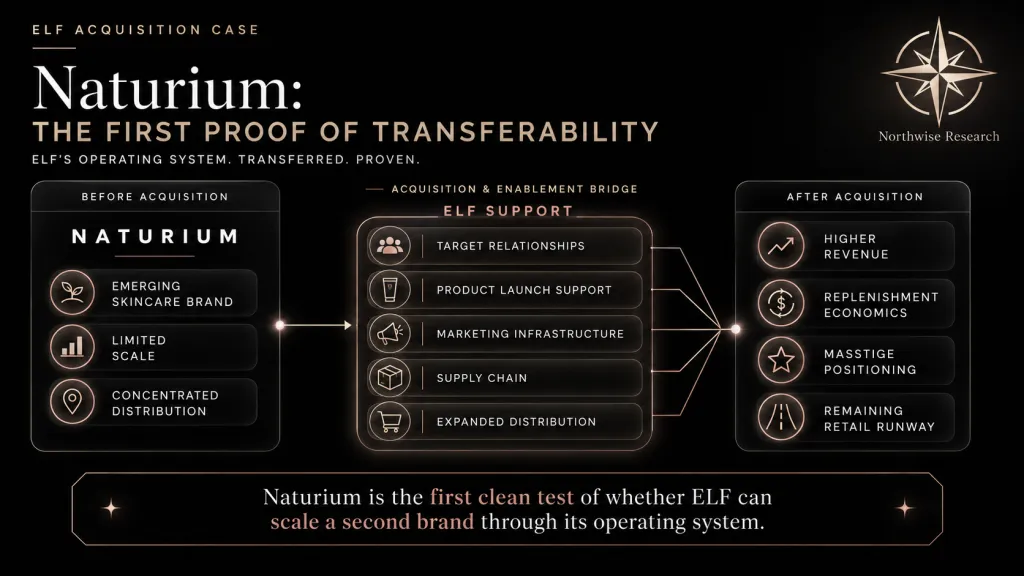
Naturium is the cleaner of the two major acquisitions to evaluate. e.l.f. acquired the masstige skincare brand in 2023 for consideration around $355 million, comprising cash and stock, at a point when Naturium was generating roughly $90 million to $100 million in annual revenue. The strategic logic was direct: Naturium gave e.l.f. a credible, higher-ticket skincare brand that could access the company's retailer relationships, most visibly Target, without forcing the namesake brand upmarket.
The brand sits above core e.l.f. on price and benefits from skincare's replenishment economics, where effective products generate repeat purchases. Since acquisition, Naturium has grown well under e.l.f. ownership through expanded distribution and new products, which is the single best piece of evidence that the platform's capabilities transfer to a brand e.l.f. did not build.
The remaining questions are how much distribution runway is left before growth normalizes, what margin the brand contributes as it scales, and whether it overlaps with e.l.f. SKIN. This report uses a working estimate of approximately $225 million of fiscal 2026 Naturium revenue, identified explicitly as a Northwise estimate, since the company does not disclose precise brand-level revenue.
9.3 Rhode
rhode is the most consequential and the most uncertain brand in the portfolio, and it deserves the most attention. The brand launched in 2022, built around founder Hailey Bieber, with an initial focus on a tightly curated skincare line that later expanded into lip and color products. It grew rapidly through direct-to-consumer channels and a strong social presence before e.l.f. acquired it in 2025.
The founder relationship is both the advantage and the risk. Hailey Bieber provides global awareness, earned media, product visibility, and launch amplification that a new brand could not buy at any reasonable cost. The same concentration creates key-person and reputational risk, and it raises the question of whether the brand can eventually stand on its own beyond its founder's immediate cultural reach. A curated assortment reinforces a clear identity and concentrates launch demand, while also concentrating the brand's fortunes in a small number of products.
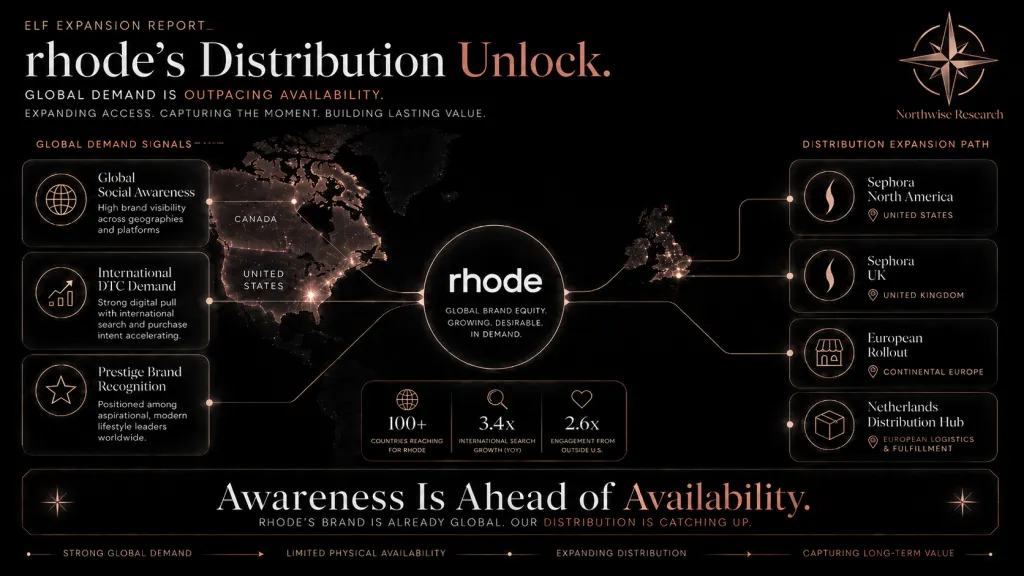
The central rhode argument is about timing. The brand is not yet in a normalized growth phase, since international awareness runs well ahead of physical availability. Roughly three-quarters of rhode's social following sits outside the United States, and a meaningful share of direct-to-consumer demand already comes from international shoppers, while physical retail distribution is only beginning to expand.
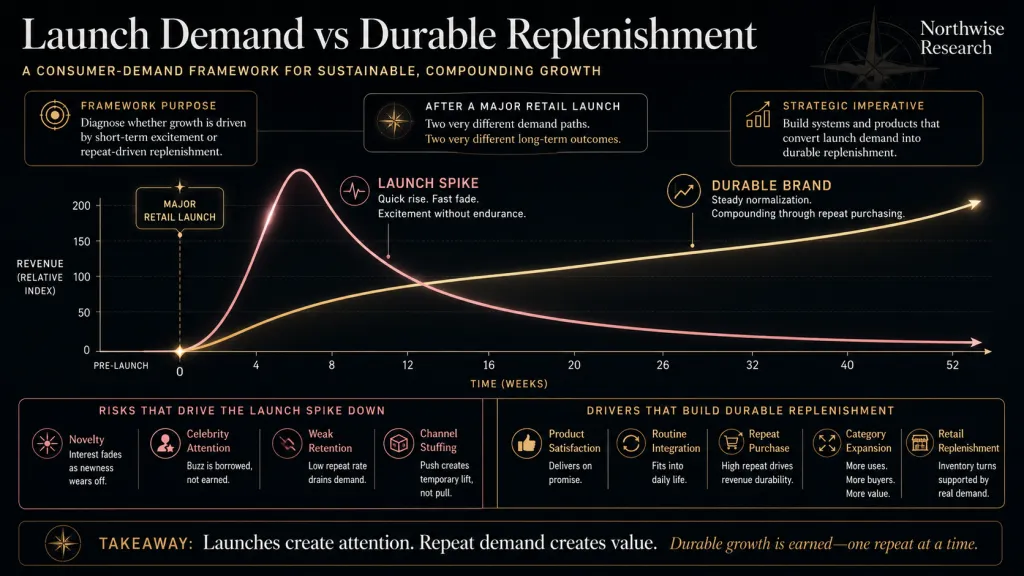
Rhode launched into Sephora in North America, has begun rolling out through Sephora in the United Kingdom and across additional European markets, and e.l.f. has moved European distribution into its Netherlands facility to shorten delivery times. The long-term question is whether that distribution-led surge in availability converts into durable repeat purchasing rather than a one-time launch spike.
Two financial distinctions are essential here. First, rhode's revenue to e.l.f. is not the same as rhode's global retail sales; a brand approaching $1 billion in global retail sales does not produce $1 billion of e.l.f. revenue, since retail sales include the retailer's markup and channels e.l.f. does not book. Second, the acquisition included contingent consideration tied to performance, which can produce additional cash or stock payments and therefore future dilution.
The detailed revenue path and the treatment of the earnout sit in the premium model; this report uses a working estimate of approximately $390 million of pro forma fiscal 2026 rhode revenue as the brand's economic starting point, again identified as a Northwise estimate.
9.4 Well People and Portfolio Cleanup
Well People is a small clean-beauty brand that should not materially influence the valuation and is modeled conservatively unless evidence supports acceleration. Its presence is mostly relevant as a signal of how management treats subscale assets.
That signal is clearer in the case of Keys Soulcare, the brand built with Alicia Keys, which e.l.f. returned to the artist rather than continuing to support indefinitely. The willingness to divest a brand that was not scaling is a useful piece of evidence about capital discipline. It suggests management will prune the portfolio, redirect capital, and avoid preserving failed experiments for appearance, which is exactly the behavior a portfolio strategy requires to avoid accumulating complexity without return.
10. International Expansion
10.1 The Current Footprint
International remains a minority of e.l.f.'s revenue and one of its larger opportunities. The core brand has expanded through mass retail partners in markets such as the United Kingdom and Canada, with continental Europe, Australia, and other markets at earlier stages. International growth has been one of the faster-growing parts of the business, though off a smaller base, and it is not a single engine; different brands use different channels and progress at different speeds.
The practical implication is that international cannot be modeled as one additive line. The core brand's international growth runs through mass retail, Naturium through selected retail, and rhode through Sephora and direct-to-consumer. Each carries its own economics, and the brand-level model already incorporates international demand, so layering a separate international forecast on top would double-count.
10.2 rhode as an International Accelerator
rhode is the clearest accelerator of international mix, since its awareness is already global while its availability is not. The expansion through Sephora across the United Kingdom and additional European markets, supported by the Netherlands distribution hub and shorter delivery times, is the mechanism by which latent international demand can convert into recorded revenue over the next several years.
The accelerator framing carries an explicit caution. International expansion is not automatically margin-accretive. Wholesale launches through Sephora involve retailer margin sharing, fixtures, launch marketing, local logistics, and foreign-exchange exposure, all of which can pressure consolidated margins during the expansion phase even when the brand's underlying economics are attractive. The model treats international rhode growth as a near-term revenue accelerant and a near-term margin headwind at the same time.
10.3 Channel and Margin Differences
The economics differ sharply by channel. Direct-to-consumer sales carry higher gross margins and richer first-party data but require the brand to fund its own customer acquisition. Wholesale sales through mass retail or Sephora trade some gross margin for scale, trial, and lower per-unit acquisition cost. As rhode shifts from a direct-to-consumer origin toward wholesale distribution, its reported gross margin mix changes even as its total revenue grows, which is one more reason the consolidated margin path depends heavily on brand and channel mix rather than on any single operating decision.
11. The Marketing Engine
11.1 Marketing as an Operating Capability
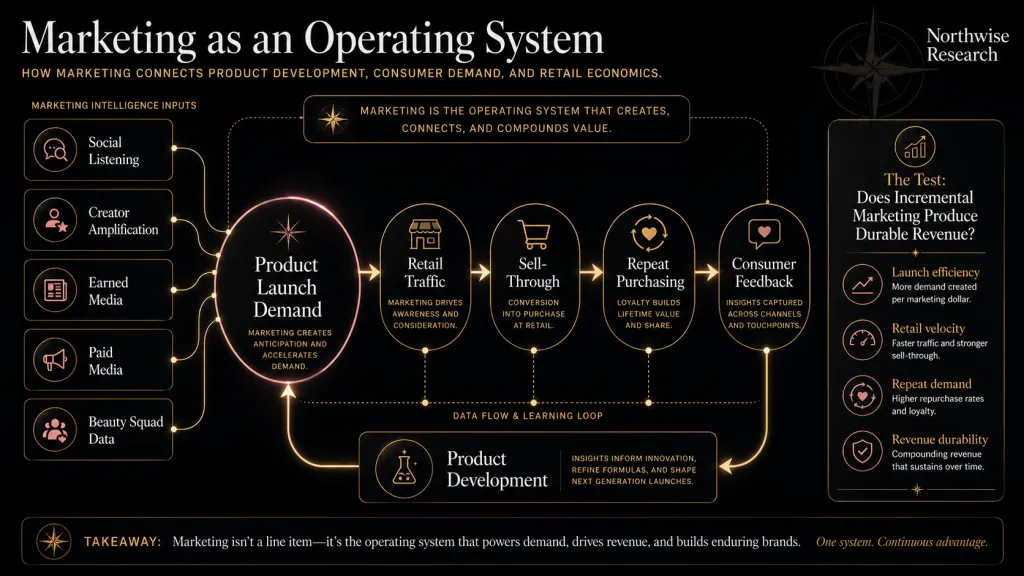
Marketing at e.l.f. is an operating capability rather than a discretionary line item, and it should be analyzed as part of product-market fit. The company spends a high percentage of sales on marketing relative to traditional consumer peers, and that spending is the mechanism through which it identifies demand, seeds products, and builds the cultural relevance that drives retail velocity. Comparing e.l.f.'s marketing ratio to a lower-spending peer and concluding the peer is more efficient misses the point, since the peer may also grow more slowly and lose share.
The useful questions are whether incremental marketing creates customers, whether those customers repeat, whether awareness translates into shelf velocity, and whether marketing efficiency improves as the company scales. These are the tests the model applies, rather than treating the marketing ratio as a cost to minimize.
11.2 Earned Media, First-Party Data, and the Beauty Squad
A large share of e.l.f.'s marketing impact comes from earned media rather than paid placement. Products that gain organic traction on social platforms generate attention the company does not pay for directly, which lowers the effective cost of each acquired customer. The company's loyalty program and first-party data deepen this advantage by giving e.l.f. direct insight into purchasing behavior and a lower-cost channel to its most engaged customers.
Cultural partnerships across sports, entertainment, and major launches extend the same engine, turning product launches into media events. The effect is a marketing model that behaves more like a flywheel than a budget, where engaged customers and earned attention reduce the cost of the next launch.
11.3 Whether the Model Scales Across Brands
The open question for a multi-brand company is whether one marketing engine can serve several brands without losing efficiency. A portfolio can share infrastructure, data, and institutional knowledge, which argues for leverage. It can also dilute focus, since attention and creative capacity are finite and each brand competes for them.
The evidence so far is mixed and incomplete. Naturium has grown under e.l.f.'s marketing without obvious loss of efficiency, which is encouraging. rhode largely arrived with its own marketing strength tied to its founder, so it tests the engine less directly. The model assumes marketing scales reasonably but not perfectly across brands, with efficiency improving modestly over time rather than stepping down sharply, and it flags deteriorating marketing returns, rising spend without corresponding growth, as a key signal to watch.
12. Product Development and Innovation
12.1 The Launch Lifecycle
The product engine follows a recognizable lifecycle: a consumer signal surfaces, often on social platforms, the company develops a concept and a product, seeds it socially, places it in retail, launches, gathers feedback, and then either replenishes the winners or discontinues the laggards. The speed of that loop is the company's signature advantage, and it works only if quality and inventory discipline survive the pace.
Speed without discipline would produce a flood of products, inventory risk, and shelf clutter. The company's record suggests it has maintained reasonable discipline, concentrating support behind hero products rather than proliferating endlessly, though the risk grows as the portfolio expands and more brands compete for development and shelf attention.
12.2 Hero Products and Assortment Discipline
e.l.f.'s economics depend heavily on hero products, a relatively small set of items that drive a disproportionate share of sales and shelf productivity. Concentrating behind heroes improves inventory economics, marketing efficiency, and retailer confidence. It also creates concentration risk, since the loss of a hero's relevance matters more than the failure of a minor product.
Assortment discipline is the counterweight. The company has to introduce enough new products to stay culturally current while retiring underperformers fast enough to keep the assortment productive and avoid cannibalizing its own heroes. The forward model assumes continued innovation productivity in line with the historical record, while treating a decline in new-product productivity as an early warning that the engine is weakening.
13. Competitive Position
13.1 The Competitive Map
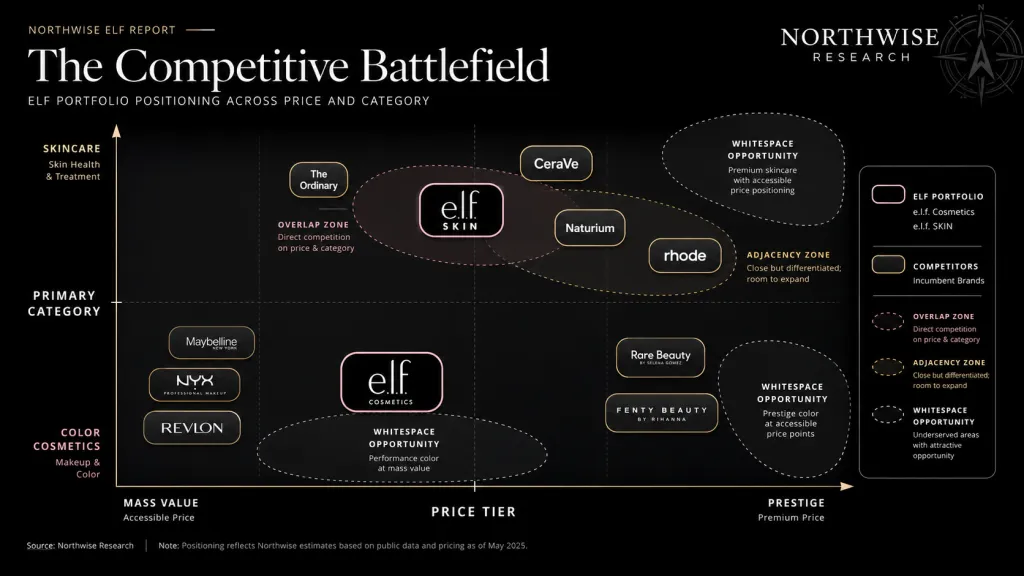
e.l.f. competes across price tiers rather than against a single rival. In mass color cosmetics, the relevant competitors include Maybelline and the broader L'Oreal portfolio, NYX, Revlon, CoverGirl, and Milani. In mass and masstige skincare, The Ordinary and CeraVe are the most relevant references for value-led, ingredient-forward positioning. In prestige-adjacent and celebrity beauty, Rare Beauty, Fenty Beauty, and other founder-led brands are the closest comparisons for rhode. Retailer private label sits underneath the entire structure as a persistent low-price alternative.
The map matters because e.l.f.'s competitive advantage is not uniform across it. The brand is strongest where its combination of value pricing, speed, and social relevance is hardest to match, and it faces tougher competition as it moves up-tier into categories where brand prestige and clinical credibility carry more weight.
13.2 What Competitors Can and Cannot Easily Replicate
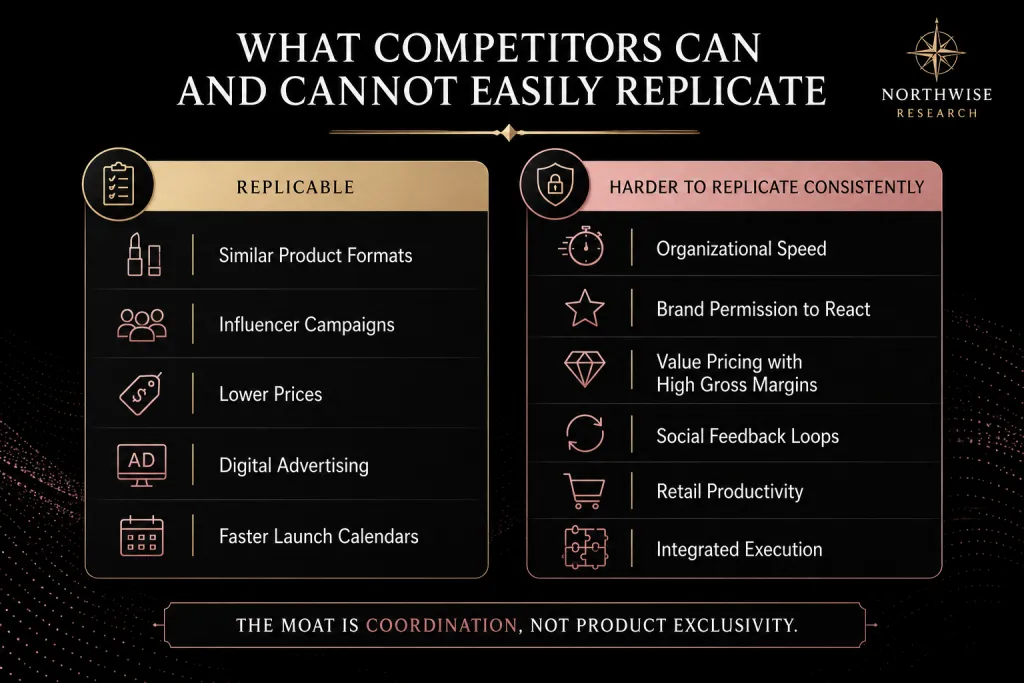
Several of e.l.f.'s tactics are replicable. Larger competitors can copy product formats, run influencer campaigns, lower prices, advertise digitally, and accelerate their launch calendars. None of these is a durable moat on its own, and incumbents have the resources to attempt all of them.
Harder to replicate is the integrated execution. Organizational speed, the cultural permission to react quickly, value positioning that still supports strong gross margins, tight social feedback loops, retail productivity, and the coordination of product, price, marketing, and distribution as a single system are difficult for a large incumbent to assemble at once. A competitor can copy any single element; matching the whole operating cadence consistently is the harder task, and it is where e.l.f.'s advantage actually lives.
13.3 The Durability of the Moat
The moat is real but not permanent. It narrows if incumbents become faster and more culturally fluent, or if e.l.f. becomes slower and less disciplined as it grows and absorbs acquisitions. The clearest threat is not that a competitor builds a better single product, but that the value-and-speed advantage erodes gradually as the organization scales and as larger players invest in closing the gap.
The report's stance is that the moat is durable enough to underwrite a healthy base case but not so secure that it can be assumed away. Competitive response is treated as a live risk in the model, not a footnote, and the core brand's unit and share trends are the primary evidence on whether the moat is holding.
14. Sourcing, Manufacturing, and Tariffs
14.1 The Asset-Light Model and China Exposure
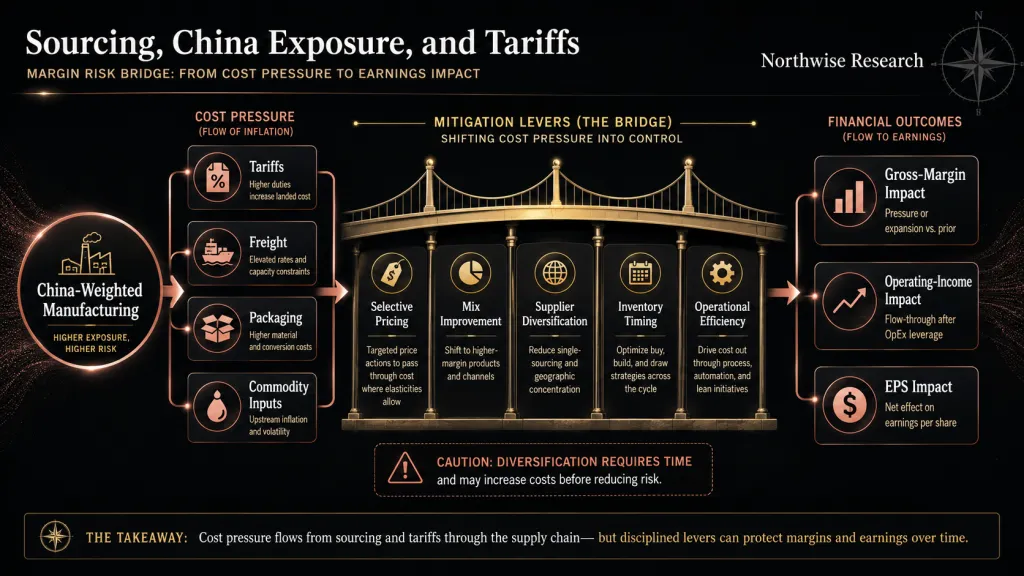
e.l.f. operates an asset-light manufacturing model, outsourcing most production to third-party suppliers, with a meaningful concentration in China. That structure has historically supported low product costs and strong gross margins, and it is also the source of the company's tariff exposure. The same arrangement that keeps the business capital-light at the factory level makes it sensitive to trade policy and freight costs.
The exposure is manageable rather than existential, though it directly affects gross margin and therefore earnings. The relevant variables are the tariff rate on imported goods, the company's ability to pass cost through in price, its ability to offset cost through mix and sourcing, and the pace and expense of diversifying production away from any single country.
14.2 The Tariff Episode
The recent tariff episode is instructive precisely because it played out in full view. Higher tariffs raised product costs, the company responded with the August 2025 price increase, the increase carried a volume cost as consumers absorbed higher prices, and by spring 2026 e.l.f. walked back part of the increase amid consumer strain. The sequence demonstrates both the pass-through mechanism and its limits.
Several distinctions keep the analysis honest. Tariffs already reflected in inventory affect margin as that inventory sells through, separately from future tariff assumptions. Any tariff refunds the company receives are one-time items and are not recurring operating profit. Temporary freight spikes are different from permanent sourcing changes. The model separates these effects rather than blending them into a single margin number.
14.3 Diversification and What Is Temporary Versus Structural
The structural response to tariff risk is supply-chain diversification, moving production toward additional countries over time. Diversification reduces concentration risk but is neither free nor instant; it requires qualifying new suppliers, absorbing transition costs, and accepting that some cost relief arrives only after a multi-year effort.
The forecast treats tariffs as a persistent but partially manageable headwind rather than a one-time shock. The weak case assumes elevated costs persist and compress margin; the central case assumes pricing, mix, and gradual diversification offset much of the pressure; the strong case assumes diversification and scale restore margin toward historical levels. The quantified sensitivity of margin and earnings to incremental cost changes is developed in the premium section.
15. The Financial Foundation Today
15.1 The FY2026 Results
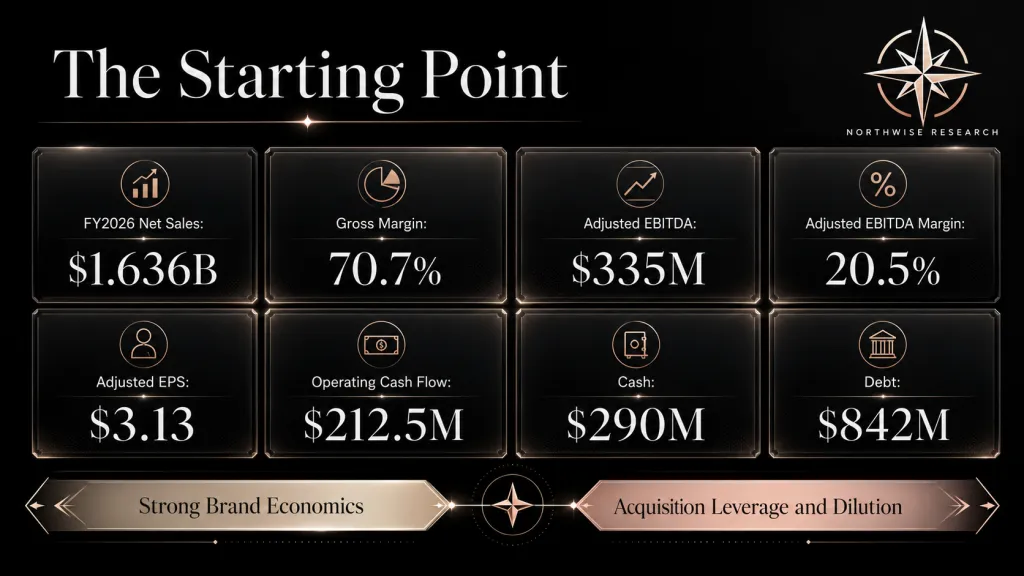
The starting point for any forecast is a clear picture of the current business. The table below summarizes reported fiscal 2026 results, using adjusted figures where the company reports them, since adjusted measures strip out acquisition-related and other one-time items that distort the underlying operating picture.
Metric | FY2026 |
|---|---|
Net sales | $1.636B |
Net-sales growth | 25% |
Gross margin | 70.7% |
Adjusted EBITDA | $335M |
Adjusted EBITDA margin | 20.5% |
Adjusted net income | $186M |
Adjusted diluted EPS | $3.13 |
Operating cash flow | $212.5M |
Capital expenditures | $22.4M |
Cash | $290M |
Total debt | $842M |
Two features stand out. Reported net-sales growth of 25 percent was strong, though a large portion came from the acquisition of rhode rather than from organic growth, so the headline overstates the underlying trend. And the gap between adjusted and reported profitability was wide in fiscal 2026, since acquisition accounting, amortization, and one-time costs pushed reported net income well below adjusted net income. The model is built on adjusted figures and reconciles to reported results rather than the reverse.
15.2 Gross Margin and Operating Leverage
Gross margin near 71 percent is high for a value-priced beauty company and reflects the asset-light model, favorable mix, and the structural gap between e.l.f.'s prices and its product costs. The forward path for gross margin depends on the interplay of price and volume, tariff pressure, the shift toward wholesale as rhode scales, Naturium's margin contribution, and international mix. None of these moves margin dramatically on its own; together they determine whether margin holds, compresses, or expands through 2030.
Operating leverage is the second question. With marketing running near a quarter of sales and other overhead layered on top, the company's EBITDA margin sits in the low 20s. Whether that margin expands depends on whether revenue grows faster than marketing and overhead, which in turn depends on marketing efficiency improving as the portfolio scales. The model does not assume unexplained leverage; every point of margin change is tied to a stated assumption about gross margin, marketing, or other overhead.
15.3 Cash Flow and the Balance Sheet
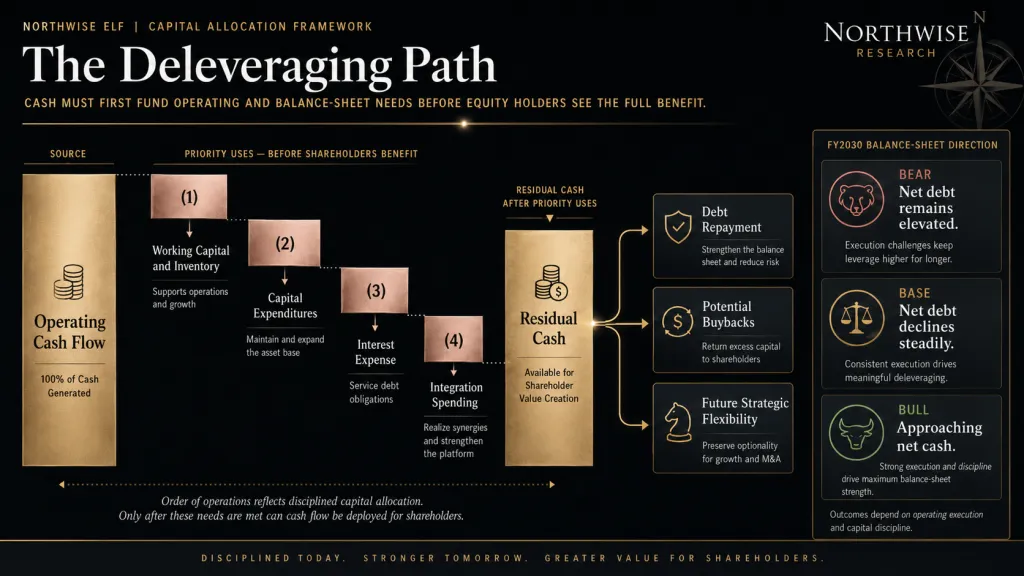
e.l.f. generates healthy operating cash flow, with fiscal 2026 operating cash flow of roughly $213 million against modest capital expenditures of about $22 million, reflecting the asset-light model. The main calls on cash beyond operations are inventory investment, which rises as the company expands distribution, and debt service following the rhode acquisition.
The balance sheet carries the imprint of that acquisition. Against roughly $290 million of cash sits approximately $842 million of total debt, for net debt near $552 million, with fiscal 2026 interest expense of roughly $35 million. The debt was used primarily to fund the cash portion of the rhode consideration. The trajectory of that net-debt figure, whether it falls steadily as cash flow is directed toward repayment or remains elevated, is one of the more important determinants of per-share outcomes through 2030, and it is built explicitly in the premium model.
15.4 Share Count and Per-Share Economics
Company growth and per-share growth diverge when share count rises, and e.l.f. has several sources of dilution. Diluted shares stood at roughly 59.35 million in fiscal 2026 and are guided to approximately 60.5 million in fiscal 2027. The drivers include ongoing stock-based compensation, employee equity issuance, shares issued as part of the rhode consideration, and potential earnout shares tied to rhode's performance.
The discipline the report maintains throughout is to distinguish revenue growth from per-share earnings growth. A company can grow revenue handsomely and still disappoint shareholders if dilution and interest expense absorb the gains, which is why the share-count and balance-sheet assumptions carry as much weight in the model as the revenue assumptions.
15.5 Capital Allocation
The core model excludes future acquisitions, and the reasoning is a matter of analytical honesty rather than a prediction that e.l.f. will stop acquiring. Future deals cannot be modeled responsibly without knowing their price, financing, dilution, and integration cost, and assuming acquisitions without those inputs would inflate the valuation with growth the company has not paid for. Future acquisition activity is treated as optionality discussed in the text, not as revenue in the model.
That leaves three credible uses of capital over the forecast period: organic investment in the existing brands, deleveraging the balance sheet, and, eventually, share repurchases once debt is reduced. The mix among these is itself a scenario variable, since a company that prioritizes deleveraging will look different at the per-share level from one that pursues buybacks or another large deal.
15.6 Management
Management is assessed on evidence rather than reputation. The record includes the 2019 strategic reset that produced years of share gains, a generally credible history of guidance, the acquisitions of Naturium and rhode, the willingness to divest Keys Soulcare, the pricing response to tariffs and its partial reversal, and the decision to fund rhode partly with debt. Taken together, this is a management team that has executed the core operating model well, allocated capital actively, and shown a willingness to reverse course when evidence warrants.
The open questions concern the scale of recent ambition. The rhode acquisition was expensive and partly debt-funded, and the integration of a higher-priced, founder-led, internationally oriented brand is a harder task than anything in the company's prior record. The report neither dismisses management's track record nor assumes it guarantees the outcome of a materially more complex undertaking.
15.7 FY2027 Guidance and Why FY2026 Is a Distorted Base
The company's fiscal 2027 guidance frames the near term. The midpoint implies net sales of roughly $1.85 billion, growth near 13 percent, adjusted EBITDA of approximately $382 million, adjusted EPS of about $3.30, and diluted shares of roughly 60.5 million.
Fiscal 2026 is a distorted base year, and understanding why is essential to reading the forecast. The 25 percent reported growth in fiscal 2026 included only a partial year of rhode, since the brand was acquired partway through the year. Fiscal 2027 will be the first full year of rhode ownership, so part of the reported fiscal 2027 growth is the full-year consolidation of an already-owned brand rather than new organic growth. The model accounts for this by separating organic growth, acquired growth, and the full-year consolidation effect, and by treating fiscal 2027 guidance as the cleaner full-ownership anchor against which the scenarios are calibrated.
16. The Principal Risks
Before turning to the model, it is worth stating plainly the risks that the forecast has to hold in mind, since they shape both the scenario probabilities and the discount rate applied later.
The first cluster concerns the core brand. If e.l.f. Cosmetics loses share for several consecutive quarters, or if units stay weak even after price reductions, the foundation that funds the platform weakens, and the entire structure becomes harder to underwrite.
The second cluster concerns rhode. The brand carries key-person risk tied to its founder, the durability of celebrity-led beauty is unproven over long horizons, and international launch demand may not convert into repeat purchasing. If rhode's European sell-through materially trails North America, or if repeat purchasing fails to develop after the initial launch surge, the largest source of forecast growth disappoints.
The third cluster is financial and structural. Tariffs and China sourcing pressure margins, retailer concentration creates quarter-to-quarter volatility and negotiating exposure, wholesale expansion can compress margins faster than scale lifts them, and debt and dilution can absorb operating gains before they reach shareholders. The fourth cluster is competitive and cyclical. Larger competitors can respond, private label sits underneath the category, beauty trends can reverse, and consumer weakness can pressure the whole sector.
None of these risks is disqualifying on its own, and the company has navigated several of them before. Collectively, they are the reason the report applies a demanding required return and keeps its central case grounded rather than optimistic. The structured risk matrix, mapping each risk to a probability, a financial impact, a model variable, and an early warning indicator, follows in the premium section alongside the quantified scenarios.
17. Building the Revenue Model
17.1 Why a Single Consolidated Growth Rate Misleads
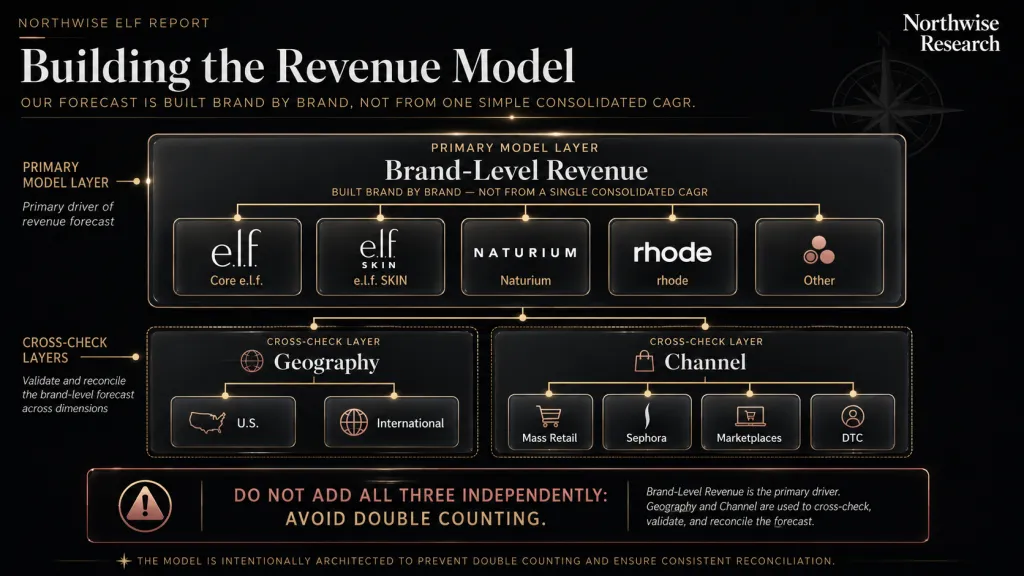
The most common error in modeling e.l.f. is to take a consolidated growth rate, observe that it is slowing, and project the deceleration across the whole company. That approach fails for a structural reason established earlier: the portfolio's brands sit at different points in their lives. Core e.l.f. Cosmetics is mature and decelerating, e.l.f. SKIN is a smaller extension, Naturium is mid-scale and still expanding distribution, and rhode is early, with availability lagging awareness. A single blended rate buries those differences and produces a forecast that is wrong in both directions, too pessimistic on the young brands and too optimistic on the mature one.
The model therefore builds revenue from the bottom up, brand by brand, and uses geography and channel as cross-checks rather than as separate additive forecasts. Adding a brand-level model, a geography-level model, and a channel-level model together would triple-count the same sales. The brand build is primary; geography and channel discipline the result.
17.2 The Brand-Level Architecture
The architecture treats four revenue blocks: core e.l.f. Cosmetics together with e.l.f. SKIN and Well People, which form the established base; Naturium; and rhode. The company does not disclose precise brand-level revenue, so the fiscal 2026 starting points below are Northwise estimates derived from disclosed totals, acquisition figures, and management commentary, and they are labeled as such.
Brand block | FY2026 starting revenue | Basis |
|---|---|---|
Core e.l.f. Cosmetics, e.l.f. SKIN, Well People | Approximately $1.2B | Northwise estimate, residual of disclosed total |
Naturium | Approximately $225M | Northwise estimate |
rhode (pro forma full year) | Approximately $390M | Northwise estimate |
A reconciliation note matters here. Reported fiscal 2026 net sales of $1.636 billion included only a partial year of rhode, so the pro forma rhode figure of roughly $390 million is larger than the amount actually consolidated in fiscal 2026. The brand build below grows each block forward from its economic base, and the consolidated path is then reconciled to fiscal 2027 guidance, which reflects the first full year of rhode ownership.
Treating the partial-year rhode contribution as if it were a full year, or summing pro forma brand figures directly against reported fiscal 2026 totals, would overstate organic growth. The model keeps the partial-to-full-year consolidation effect separate from genuine organic growth throughout.
18. Brand-Level Revenue Forecasts
18.1 Core e.l.f. Cosmetics and e.l.f. SKIN
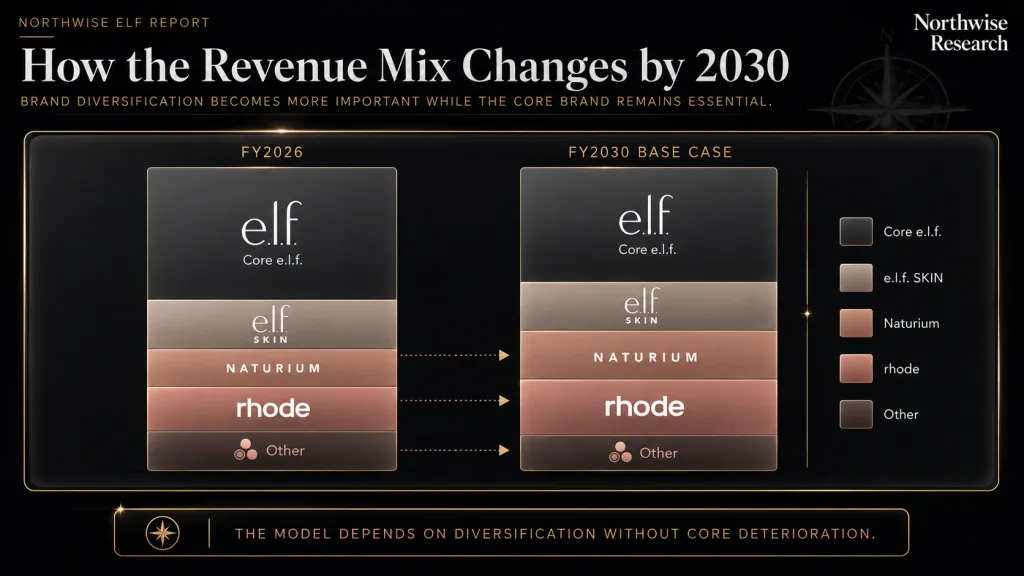
The established base, roughly $1.2 billion in fiscal 2026, is modeled as a decelerating series rather than a fixed rate, consistent with the share-gain mathematics discussed earlier. The core brand has already captured the easiest share in its strongest categories, so its growth rate compresses over time, while e.l.f. SKIN grows faster off a smaller base and partially offsets the core's deceleration. Well People is held roughly flat and is immaterial to the outcome.
The scenarios differ mainly in how the price-and-volume tradeoff resolves. In the weak case, the base block grows at a low-single-digit rate as price reductions produce only modest unit recovery. In the central case, selective price reductions restore volume and the block grows at a mid-single-digit rate. In the strong case, lower prices materially improve units and shelf productivity, the core reaccelerates, and the block grows at a high-single to low-double-digit rate. These translate into fiscal 2030 revenue for the combined base block of roughly $1.36 billion in the weak case, $1.57 billion in the central case, and $2.00 billion in the strong case.
18.2 Naturium
Naturium is modeled from its approximately $225 million fiscal 2026 base using a growth path that normalizes as distribution fills out. Early growth is supported by additional doors and shelf space at existing and new retail partners, while later growth depends more on velocity and product expansion as the easy distribution gains are exhausted.
Naturium annual growth | Bear | Base | Bull |
|---|---|---|---|
FY2027 | 8% | 15% | 22% |
FY2028 | 7% | 14% | 20% |
FY2029 | 6% | 12% | 17% |
FY2030 | 5% | 10% | 15% |
The resulting fiscal 2030 Naturium revenue is approximately $289 million in the bear case, $363 million in the base case, and $443 million in the bull case. The deceleration is deliberate. A brand that grows largely by adding distribution cannot sustain its early rate once the shelf is substantially filled, and the model would be too optimistic if it held the initial pace flat.
18.3 Rhode
Rhode is modeled from a pro forma fiscal 2026 base of approximately $390 million, reflecting the brand's economic run-rate as if owned for a full year. The growth path is the steepest in the portfolio in the early years, driven by the conversion of international awareness into physical availability through Sephora, then decelerates as the distribution unlock matures and growth must come increasingly from velocity and repeat purchasing rather than new shelf.
Rhode annual growth | Bear | Base | Bull |
|---|---|---|---|
FY2027 | 20% | 30% | 40% |
FY2028 | 12% | 24% | 34% |
FY2029 | 8% | 18% | 27% |
FY2030 | 5% | 14% | 22% |
The resulting fiscal 2030 rhode revenue is approximately $594 million in the bear case, $846 million in the base case, and $1.13 billion in the bull case. The spread across scenarios is wide on purpose. rhode's outcome depends on whether the launch-driven surge in availability converts into durable repeat demand, and that question genuinely admits a wide range. The bear path assumes the international launch succeeds initially but normalizes quickly; the bull path assumes the brand sustains strong growth as availability catches up to its already-global awareness.
18.4 Well People and Other
Well People and any residual items are modeled conservatively and folded into the base block. They do not move the consolidated outcome materially, and treating them more generously would add precision the disclosure does not support.
19. Consolidated Revenue Scenarios
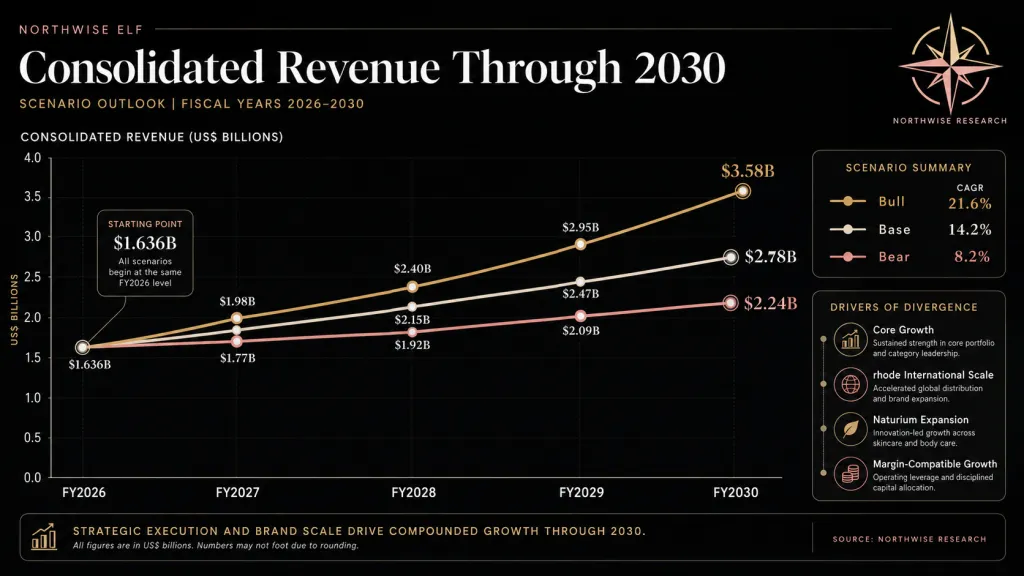
Summing the brand blocks and reconciling to guidance produces the consolidated revenue path below. Fiscal 2026 is the reported figure, with its partial year of rhode; the later years reflect full ownership.
Fiscal year | Bear | Base | Bull |
|---|---|---|---|
FY2026 | $1.64B | $1.64B | $1.64B |
FY2027 | $1.84B | $1.91B | $2.00B |
FY2028 | $1.99B | $2.20B | $2.47B |
FY2029 | $2.12B | $2.49B | $2.98B |
FY2030 | $2.24B | $2.78B | $3.58B |
The fiscal 2027 figures reconcile to company guidance. The midpoint guidance of roughly $1.85 billion sits just above the bear path and just below the base path, which is the appropriate relationship: the bear case treats guidance as roughly the ceiling, the base case as modestly conservative, and the bull case as beatable. The implied fiscal 2026 to fiscal 2030 revenue compound growth rates are 8.2 percent in the bear case, 14.2 percent in the base case, and 21.6 percent in the bull case.
The terminal-year growth profile differs across scenarios in a way that matters for valuation. In the bear case, growth has largely faded by fiscal 2030 as both the core and rhode normalize. In the base case, the company is still growing at a healthy mid-teens rate entering fiscal 2030. In the bull case, growth remains strong, supported by a reaccelerating core and a billion-dollar rhode. These terminal-growth differences are the justification for assigning each scenario a different exit multiple later in the report.
20. The Earnings Model
20.1 Gross Margin
Gross margin is modeled from the fiscal 2026 level near 71 percent, adjusted for the competing forces identified earlier: price and mix, tariff pressure, the shift toward wholesale as rhode scales, Naturium's contribution, and international mix. The scenarios resolve these forces differently.
Scenario | FY2030 gross margin |
|---|---|
Bear | Approximately 69% |
Base | Approximately 72% |
Bull | Approximately 74% |
In the bear case, persistent tariff cost and wholesale mix pull margin below the current level. In the base case, pricing, mix, and gradual sourcing diversification hold margin slightly above current levels. In the bull case, scale, mix improvement, and easing cost pressure lift margin into the mid-70s. These gross-margin assumptions feed directly into the EBITDA build, with no unexplained margin between the two.
20.2 Operating Expense and EBITDA
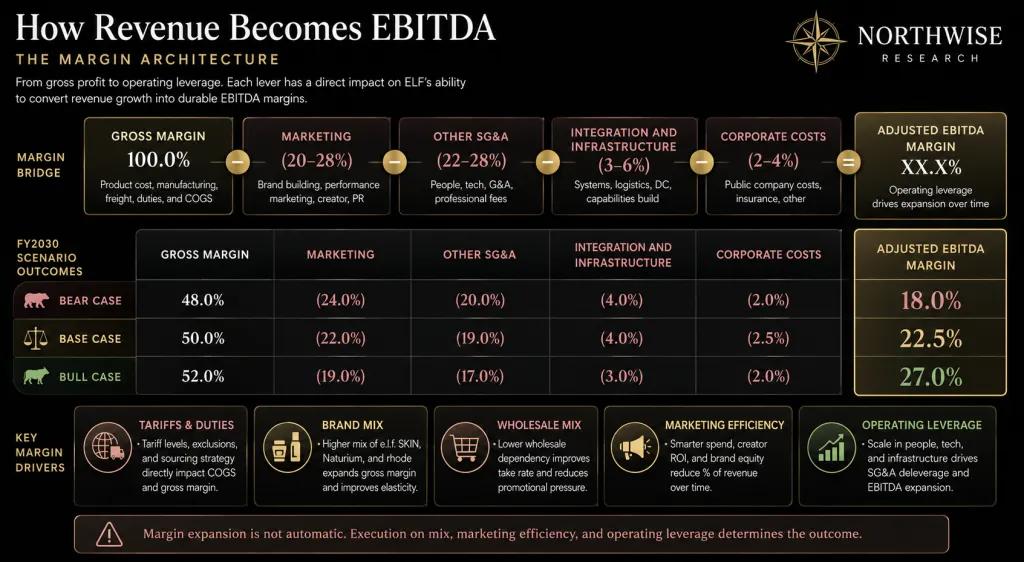
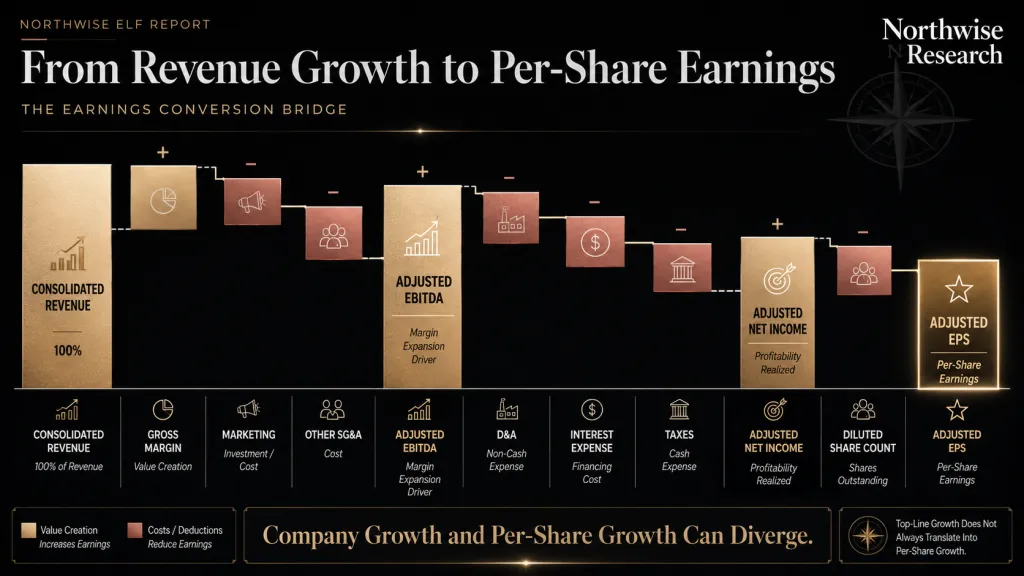
The path from gross margin to EBITDA runs through marketing and other overhead. Marketing is the largest controllable expense and the one most central to growth, so it is modeled explicitly, with other adjusted overhead layered on top.
Metric | Bear | Base | Bull |
|---|---|---|---|
Marketing as percent of sales | 25.5% | 24.0% | 23.0% |
Other adjusted overhead, percent of sales | 25.5% | 25.5% | 24.0% |
Adjusted EBITDA margin | 18.0% | 22.5% | 27.0% |
The reconciliation is direct. In the base case, gross margin near 72 percent less marketing near 24 percent less other overhead near 25.5 percent leaves an adjusted EBITDA margin near 22.5 percent. In the bull case, higher gross margin, more efficient marketing, and overhead leverage combine to lift the EBITDA margin to 27 percent. In the bear case, lower gross margin and elevated marketing without corresponding growth hold the margin near 18 percent. The leverage in the bull case comes from revenue growing faster than marketing and overhead, not from an unexplained step in profitability.
20.3 Below the Line to EPS
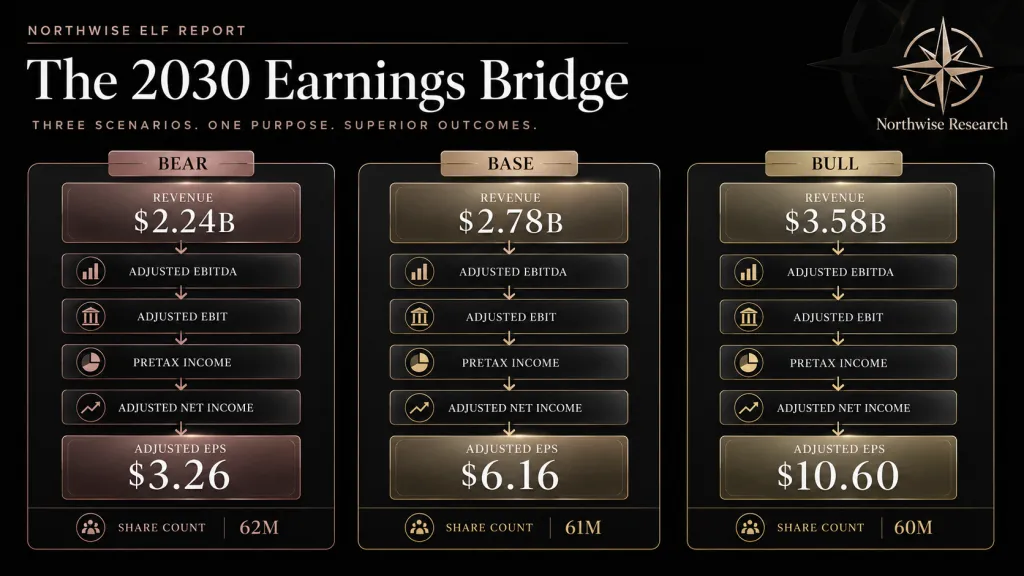
From adjusted EBITDA, the model subtracts depreciation and amortization, accounts for net interest, applies tax, and divides by diluted shares. The balance-sheet path drives the interest line: in the base and bull cases, debt is largely repaid and net interest falls toward zero or turns into net interest income, while in the bear case slower deleveraging keeps interest expense elevated. Diluted shares rise modestly in the bear case as dilution continues, hold roughly flat in the base case, and stabilize in the bull case where strong cash generation reduces the need for equity.
20.4 The Full FY2030 Framework
The complete fiscal 2030 framework is below. Every line follows from the assumptions established above, and the arithmetic ties from revenue to EPS.
Metric | Bear | Base | Bull |
|---|---|---|---|
Revenue | $2.24B | $2.78B | $3.58B |
FY2026 to FY2030 revenue CAGR | 8.2% | 14.2% | 21.6% |
Adjusted EBITDA margin | 18.0% | 22.5% | 27.0% |
Adjusted EBITDA | $403M | $626M | $967M |
Depreciation and amortization | $105M | $120M | $145M |
Adjusted EBIT | $298M | $506M | $822M |
Net interest expense | $25M | $5M | Negative $15M |
Pretax income | $273M | $501M | $837M |
Tax rate | 26% | 25% | 24% |
Adjusted net income | $202M | $376M | $636M |
Diluted shares | 62M | 61M | 60M |
Adjusted EPS | $3.26 | $6.16 | $10.60 |
FY2026 to FY2030 EPS CAGR | 1.0% | 18.4% | 35.6% |
The EPS growth rates tell the central story of the model more clearly than the revenue rates do. Revenue grows in every scenario, including the bear case.
Per-share earnings, however, barely grow in the bear case despite 8 percent annual revenue growth, since weak margins, slow deleveraging, and continued dilution absorb the gains.
The base case converts 14 percent revenue growth into 18 percent EPS growth through margin expansion and deleveraging, and the bull case converts 22 percent revenue growth into 36 percent EPS growth as margin, interest, and share count all move favorably at once.
The divergence between revenue growth and per-share growth is the quantified version of the report's recurring theme.
The premium section that follows develops bear, base, and bull scenarios through fiscal 2030, and translates them into valuation, price targets, present value, action zones, and a monitoring framework.
Readers who want the operating narrative now have it. Readers who want to know what the business is worth, and at what price the risk and reward become attractive, will find that work below.
If the analysis to this point has been useful, the work below is where the orientation becomes a position.
Northwise Premium
Choose how to continue with Northwise
Join Northwise Premium
Unlock the rest of this report, its complete valuation, the downloadable model, portfolios, and action framework.
Join Northwise PremiumCreate a Free Account
Continue across Free Northwise research, follow companies, save reports, and receive updates.
Create a Free Account
Celsius Stock Analysis: The Shelf Reset and the Second Growth Curve
Celsius stock analysis of the shelf reset, Alani growth, Pepsi economics and cash flow, with a 2030 model and a Premium valuation and entry-price framework.

Meta AI Spending: The Customer Is Already Here
Can Meta turn AI spending into shareholder returns? We model advertising, Muse, hardware, capital costs and cash flow through 2030, with a full valuation.

IREN Stock Dilution: Can the Build Reach Shareholders?
IREN stock analysis of AI growth, funding and dilution through 2030. Read our full valuation, 27 scenarios and price zones free. Excel model is Premium.
Northwise Portfolios
See how the research becomes real decisions
Reader discussion
Discuss the research
Premium access is required to join this report's discussion.
Join Northwise Premium
No comments yet. Start a thoughtful discussion.