CRM Stock Forecast 2030

CRM Stock Forecast 2030: We model Salesforce through FY2031 using buybacks, AI upside, valuation ranges, and key risks.
In this article
Our CRM Stock Forecast 2030 examines whether Salesforce’s selloff has created a long-term opportunity through buybacks, AI monetization, and durable enterprise cash flows.
1. Executive Summary
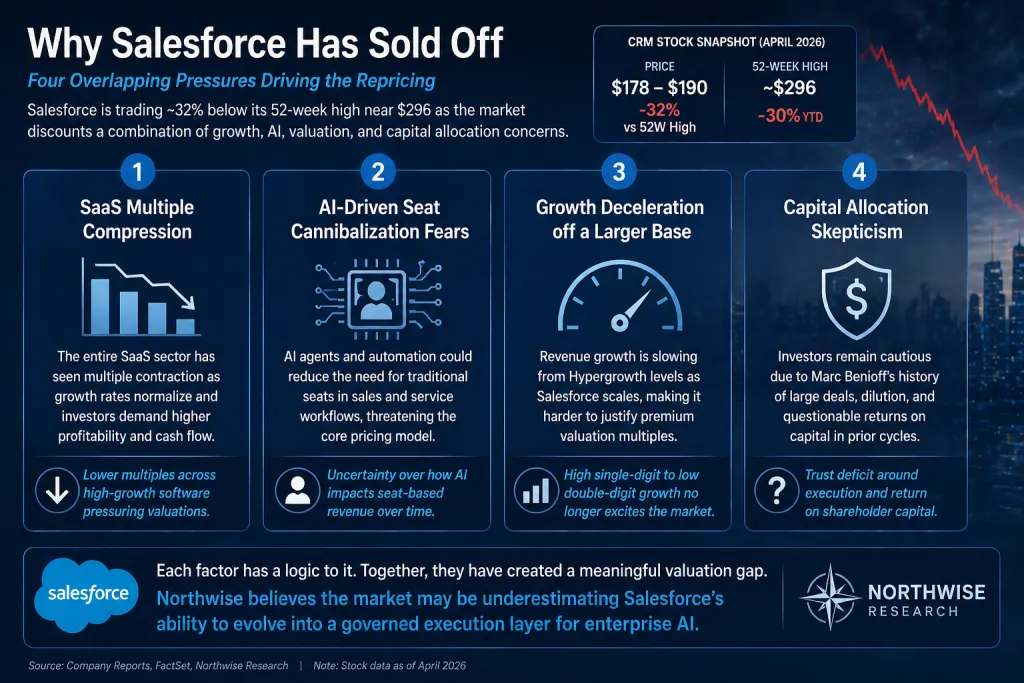
Salesforce is being repriced as a tired SaaS incumbent at the exact moment its strategic identity is changing. Shares are down roughly 30% year to date and over 32% across the past twelve months, with the stock trading in the high $170s to low $190s through April 2026 against a 52-week high near $296.
The market is discounting four overlapping concerns: SaaS multiple compression, AI-driven seat cannibalization, growth deceleration off a much larger revenue base, and lingering skepticism toward Marc Benioff's capital allocation history.
That skepticism is not unreasonable. Salesforce no longer compounds revenue at the rates that defined its first two decades. AI may genuinely pressure seat-based pricing in sales and service workflows. Agentforce is showing rapid early adoption, but the company has not yet proven that AI monetization can offset whatever seat erosion arrives over the next several years. The sell-off has a logic to it.
The Northwise interpretation is more measured. The market may be treating AI as a clean disruptor of enterprise SaaS while underweighting the possibility that Salesforce becomes a governed execution layer for enterprise AI rather than a casualty of it. Agents need data, permissions, audit trails, workflow access, and integration into systems of record. Salesforce sits inside many of those processes already.
The financial baseline is strong enough to support a patient thesis. Salesforce produced $41.5B of revenue in FY2026 with non-GAAP operating margin of 34.1% and roughly $14.4B of free cash flow. FY2027 guidance points to $45.8B to $46.2B of revenue and $13.11 to $13.19 of non-GAAP EPS.
Management introduced a FY2030 target of $60B+ in revenue excluding Informatica, alongside a "50 by FY30" framework where subscription growth plus operating margin sum to fifty.
Capital return is now central to the equity story. The board authorized a $50B repurchase program in February 2026 and launched a $25B accelerated share repurchase in March, with initial delivery of roughly 103M shares funded in part by $25B of senior notes.
S&P moved the outlook to negative in response, which is a reminder that the buyback is powerful but not free. If revenue compounds at high single to low double digits while margins hold and share count falls materially, EPS can grow faster than the headline revenue profile implies.
The thesis is deliberately not framed as a sure thing. Salesforce has to prove that Agentforce ARR is durable and incremental, that Data 360 strengthens AI monetization rather than rebranding existing data products, that Informatica integrates cleanly, and that buybacks reduce share count meaningfully net of stock-based compensation. Until that proof accumulates, the stock should trade at a discount.
What follows works through the business architecture, the AI debate, the competitive landscape, the leadership picture, and the model structure that supports the Northwise view. The valuation conclusions, present value math, action zones, and final positioning sit in the premium section.
Table of Contents
1. Executive Summary
1.1 Core Investment Debate
1.2 What the Market Is Pricing
1.3 What Northwise Thinks the Market May Be Missing
2. Salesforce in Plain English
2.1 What Salesforce Does
2.2 How Salesforce Makes Money
2.3 Why Salesforce Is More Than CRM
2.4 Why Switching Costs Matter
3. Why Salesforce Has Sold Off
3.1 SaaS Sector Compression
3.2 AI Cannibalization Fear
3.3 Growth Deceleration
3.4 Competitive Pressure
3.5 Benioff and Capital Allocation Skepticism
3.6 Why the Selloff Is Not Irrational
4. The Core Northwise Thesis
4.1 Old SaaS vs AI Workflow Infrastructure
4.2 Seat Risk vs Workflow Value
4.3 Why AI May Help the Incumbent
4.4 What Salesforce Must Prove
5. Company History and Strategic Evolution
5.1 SaaS Pioneer Phase
5.2 Platform Expansion Phase
5.3 Slack, Tableau, MuleSoft, and Integration Complexity
5.4 Margin Discipline and Activist Era
5.5 Informatica and the Data Layer
6. Business Model and Revenue Architecture
6.1 Sales Cloud
6.2 Service Cloud
6.3 Marketing and Commerce
6.4 Platform, Integration, and MuleSoft
6.5 Data Cloud / Data 360
6.6 Slack and Collaboration Layer
6.7 Agentforce and AI Monetization
7. Financial Foundation
7.1 FY2026 Actual Results
7.2 FY2027 Guidance
7.3 FY2030 Management Target
7.4 Free Cash Flow Quality
7.5 RPO / cRPO Signals
7.6 Shareholder Return Profile
8. The Buyback as a Central Part of the Model
8.1 $50B Authorization
8.2 $25B Accelerated Share Repurchase
8.3 103M Initial Share Delivery
8.4 SBC Leakage and Net Share Reduction
8.5 Why Buybacks Change the EPS Math
8.6 Why Buybacks Are Not a Substitute for Growth
9. Agentforce, Data 360, and AI Monetization
9.1 Current Disclosed AI Metrics
9.2 Agentforce ARR
9.3 Data 360 Growth
9.4 Work Units, Tokens, and Usage Evidence
9.5 What Is Real vs Still Unproven
9.6 The AI Upside Case
9.7 The AI Cannibalization Case
10. Competitive Landscape
10.1 Microsoft Dynamics and Copilot
10.2 ServiceNow
10.3 HubSpot
10.4 Oracle, Adobe, Workday, and Enterprise Suites
10.5 AI-Native Startups
10.6 Internal Enterprise AI Builds
10.7 Why Replacement Risk Is Slower Than Demo Risk
11. Leadership and Management Review
11.1 Marc Benioff
11.2 Robin Washington
11.3 Brian Millham and Operating Execution
11.4 Management as Tailwind or Risk
11.5 Capital Allocation Judgment
12. Key Risks
12.1 Real Risks
12.2 Overstated Risks
12.3 What Would Break the Thesis
12.4 What Would Strengthen the Thesis
13. Full Model Construction
13.1 Why We Model Through FY2031
13.2 Starting Baseline
13.3 Revenue Assumptions
13.4 Margin Assumptions
13.5 Share Count Assumptions
13.6 EPS Calculation Method
13.7 Multiple Selection Logic
13.8 Probability Weighting Logic
14. Scenario Analysis and Price Targets
14.1 Bear Case
14.2 Base Case
14.3 Bull Case
14.4 Ultra Bull Case
14.5 Probability-Weighted FY2031 Value
15. Present Value Framework
15.1 Why Present Value Matters More Than Nominal Targets
15.2 10% Discount Rate
15.3 12% Discount Rate
15.4 15% Discount Rate
15.5 18% Discount Rate
15.6 Interpreting the PV Range
16. Buy / Hold / Trim / Sell Zones
16.1 Strong Buy Zone
16.2 Buy Zone
16.3 Accumulate Zone
16.4 Hold Zone
16.5 Trim Zone
16.6 Aggressive Trim Zone
16.7 Sell / Reassess Zone
17. Northwise Positioning
17.1 Current Position
17.2 Why We Own Shares
17.3 What Would Make Us Add
17.4 What Would Make Us Reduce
17.5 Final Portfolio Fit
18. Final Northwise Synthesis
18.1 What the Model Proves
18.2 What the Market Is Missing
18.3 Final Judgment
18.4 What to Watch Next
2. Salesforce in Plain English
2.1 What Salesforce Does
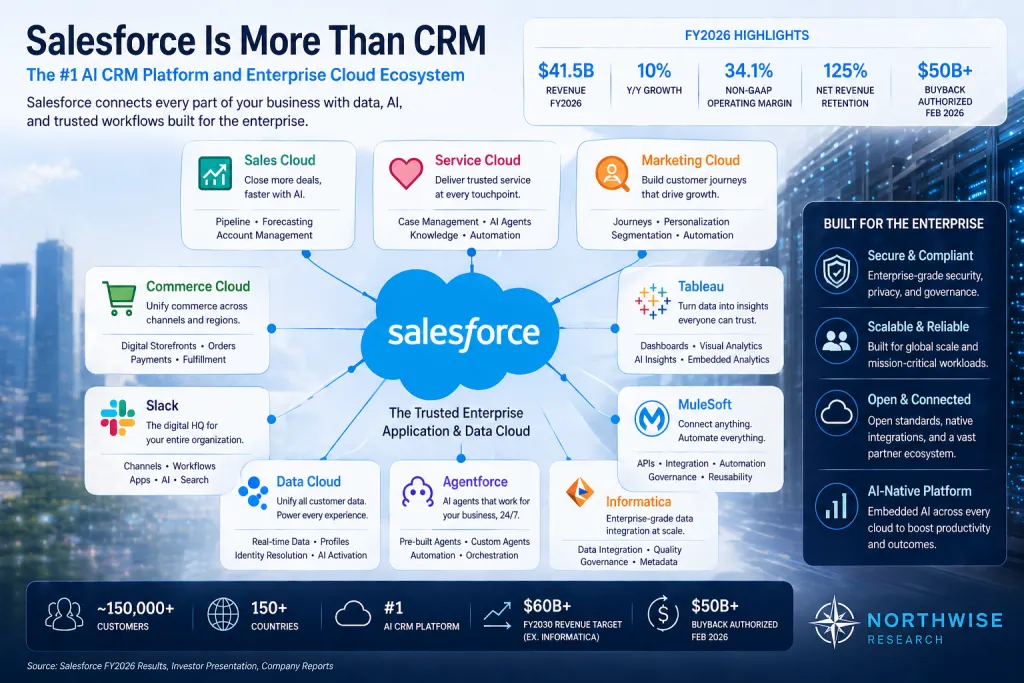
Salesforce sells software that helps large companies run the customer-facing parts of their business. Sales pipelines, customer service operations, marketing campaigns, customer data, e-commerce, employee collaboration, and increasingly autonomous AI agents all run through some part of the Salesforce stack.
The category label most commonly used is CRM, or customer relationship management. That label captures only a slice of what the company actually does. A more accurate description treats Salesforce as an enterprise customer operating system. It sits between customer data, employee workflows, management reporting processes, and the new layer of AI agents that act on behalf of those workflows.
2.2 How Salesforce Makes Money
Recurring subscription revenue from cloud software is the primary engine. Customers pay for seat-based or usage-based access to products including Sales Cloud, Service Cloud, Marketing Cloud, Commerce Cloud, Slack, Tableau, MuleSoft, Data Cloud and Data 360, Informatica, and Agentforce. Professional services contribute a smaller, lower-margin layer of revenue and serve mainly as enablement for larger deployments.
The historical model relied on per-seat licensing. The strategic question now is whether Salesforce can shift more of its monetization toward usage, workflow execution, data volume, automation outcomes, and agentic activity. Pricing structure determines whether AI is a tailwind or a headwind for total revenue, regardless of how many human seats remain.
2.3 Why Salesforce Is More Than CRM
The product surface has expanded materially through both organic development and acquisition.
Sales Cloud manages pipeline, lead qualification, account ownership, and forecasting. Service Cloud runs case management, contact center workflows, and customer support routing. Marketing and Commerce handle campaign automation, customer engagement, and digital storefronts.
MuleSoft provides integration infrastructure that lets Salesforce connect with the rest of an enterprise software estate. Tableau supplies analytics and visualization. Slack functions as a collaboration and workflow surface. Data Cloud and Data 360 unify customer data and prepare it for AI consumption. Informatica adds enterprise-grade data management, governance, and integration. Agentforce delivers the AI agents that now act across all of these layers.
The product map is wider than most non-customers assume. Whether it adds up to a coherent platform or a loose federation of acquired assets is one of the central debates in the stock.
2.4 Why Switching Costs Matter
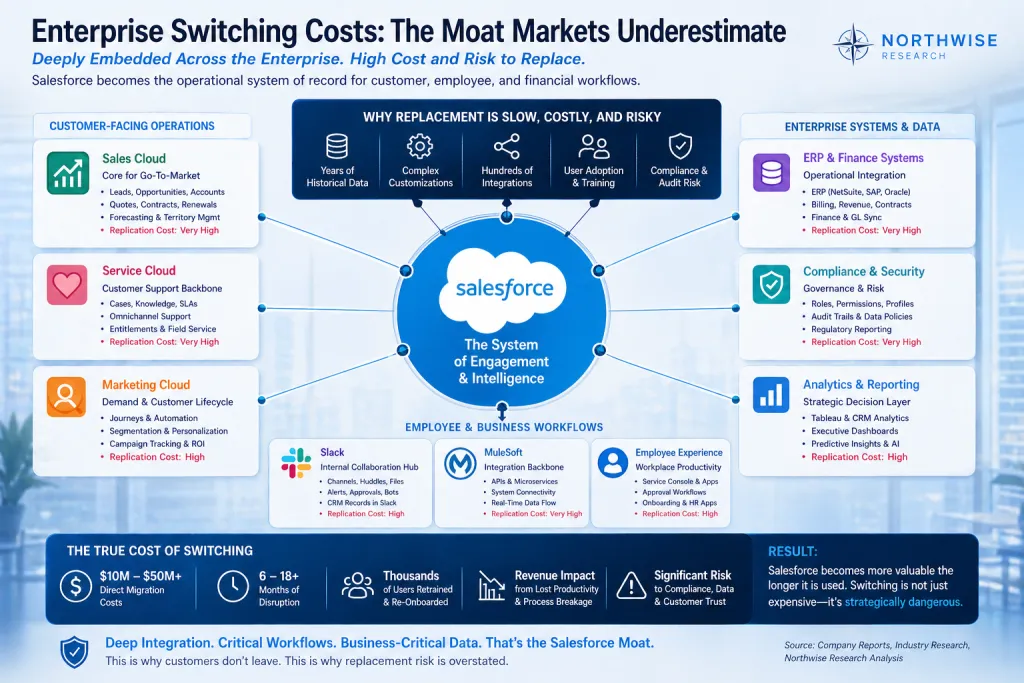
Enterprise software is not consumer software. A Fortune 500 company does not rip out its CRM the way a person uninstalls an app. Salesforce is woven into sales compensation plans, financial reporting cycles, customer support workflows, regulatory compliance routines, integrations with ERP and marketing systems, and the management cadences that hold large organizations together.
Replacement is possible but slow. It requires data migration, retraining, re-implementation of customizations, integration rewrites, and political alignment across multiple departments. Even a clearly superior alternative typically takes years to displace an embedded Salesforce footprint.
Switching cost arguments are sometimes used as lazy defenses of weak businesses. That is not the claim here. Switching cost does not eliminate competitive risk. It shapes the speed at which competitive pressure translates into revenue loss, which has direct implications for how to model the AI transition.
3. Why Salesforce Has Sold Off
3.1 SaaS Sector Compression
The broader software complex has been under pressure for over a year. Higher rates lifted discount rates on long-duration cash flows. Enterprise IT budgets tightened. Investors rotated out of mature SaaS toward clearer AI infrastructure beneficiaries such as compute providers, custom silicon platforms, and hyperscalers. Salesforce sits at the center of that rotation.
3.2 AI Cannibalization Fear
The cleanest bear case is structural. If AI agents perform tasks once handled by humans, then enterprises may need fewer salespeople, fewer support staff, and fewer operations admins. Fewer humans means fewer seats. Salesforce's per-seat pricing model becomes the asset most exposed to that shift.
This concern is not noise. It is the legitimate core of the AI disruption thesis applied to vertical SaaS, and it deserves to be taken seriously rather than waved away.
3.3 Growth Deceleration
Salesforce is now a $40B+ revenue company. Compounding at high teens off that base would require recovering several billion dollars of incremental annual revenue every year. The growth profile has slowed accordingly, and the market is questioning whether high single-digit to low double-digit organic growth is the new ceiling.
Management's FY2030 target argues for sustained 10%+ organic compounding. The market remains unconvinced, partly due to the deceleration of Marketing, Commerce, and Tableau, and partly due to the sense that AI may pull forward the next leg of pressure.
3.4 Competitive Pressure
Microsoft Dynamics paired with Copilot is the most strategically threatening competitor. ServiceNow has expanded into adjacent enterprise workflow and AI automation territory. HubSpot continues to win in mid-market. Oracle, Adobe, and Workday remain credible enterprise alternatives in their respective swim lanes. AI-native startups generate impressive demos and capital. Some large enterprises are exploring internal AI builds on top of frontier models.
Competitive risk is real. The question is whether competitive risk translates into measurable revenue loss inside the modeling horizon, given enterprise switching friction.
3.5 Benioff and Capital Allocation Skepticism
Marc Benioff occupies a complicated place in the investor mind. He helped create modern SaaS, built one of the defining enterprise software companies of the past two decades, and remains one of the most effective enterprise sales leaders in technology. He is also associated with a long string of large acquisitions, public communication that often runs ahead of execution, and an empire-building tendency that has cost shareholders in the past.
Slack, Tableau, MuleSoft, and now Informatica all raise the same question. Is Salesforce assembling a coherent AI-era platform, or stacking adjacent assets that never fully integrate? The current capital return pivot suggests a more disciplined phase, but pattern recognition still works against management until proof accumulates.
3.6 Why the Selloff Is Not Irrational
Northwise does not treat this drawdown as a market mistake. The stock has fallen because the bear case has substance. AI monetization is unproven at scale, the Marketing and Commerce segments have weakened, Informatica integration risk exists, debt-funded buybacks compress balance sheet flexibility, and competitive bundling pressure from Microsoft is real. A discount makes sense.
The Northwise view is that the discount may already overshoot the durable economics of the business. That is a different argument than calling the selloff dumb.
4. The Core Northwise Thesis
4.1 Old SaaS Versus AI Workflow Infrastructure
The market frame treats Salesforce as legacy SaaS at structural risk from AI. The Northwise frame treats it as a mature enterprise workflow and data platform being repriced as obsolete before the AI transition has resolved.
Two questions sit underneath that distinction. Does AI primarily destroy seat-based revenue, or does it shift value toward the layers that govern how agents act? If governed workflow layers gain value, who is positioned to capture it?
4.2 Seat Risk Versus Workflow Value
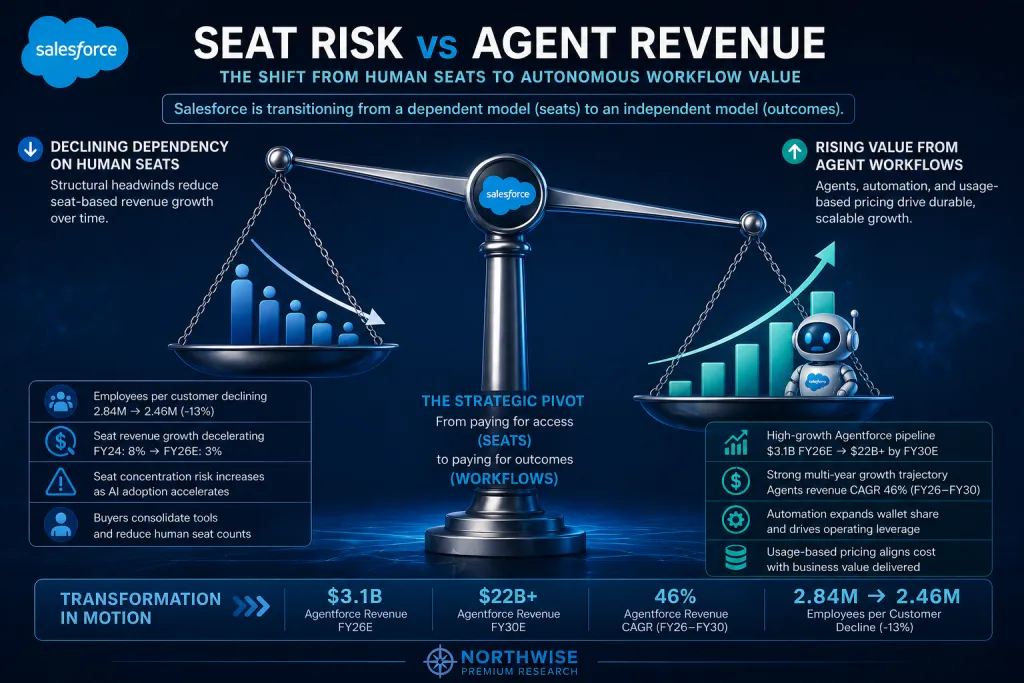
Seat compression is a real risk. AI may reduce the number of human users in sales, support, and operations workflows over the next five to ten years. Per-seat pricing structures are exposed to that compression directly.
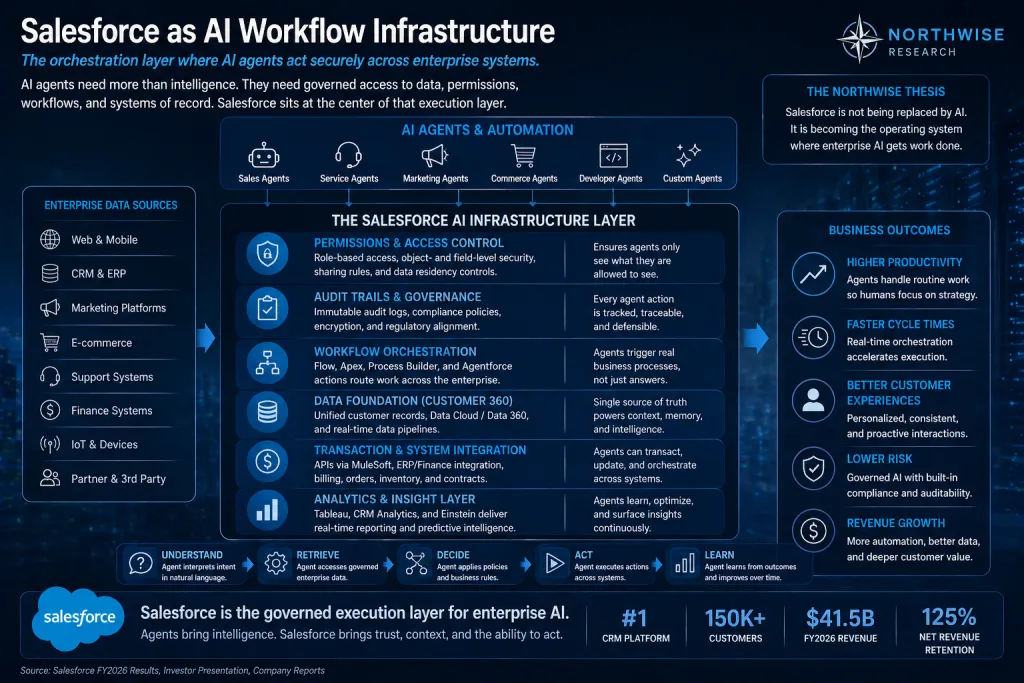
At the same time, autonomous agents acting on customer data require infrastructure that human users took for granted. Agents need permissioned access to customer records, memory across interactions, audit trails for compliance, escalation pathways back to humans, integration with billing and inventory systems, and management reporting on what they did and why. Salesforce already supplies most of those layers.
The investment question is whether Salesforce can monetize agent workflows, data activation, and orchestration faster than AI compresses seat demand. That is the central tension of the thesis.
4.3 Why AI May Help the Incumbent
The default assumption among AI bulls is that disruption favors startups. In enterprise software, that pattern often inverts. Enterprises are reluctant to let ungoverned agents act freely across customer data. They need controlled deployment environments with permissioning, observability, compliance, and integration into existing systems.
Salesforce already controls many of those layers. If Agentforce and Data 360 execute, the company can plausibly serve as a deployment platform for governed enterprise AI rather than a casualty of it. Microsoft is the most credible alternative here, and the competitive comparison ultimately determines which incumbent captures more of that opportunity.
4.4 What Salesforce Must Prove
The thesis is conditional. For the stock to work, Salesforce must demonstrate several things over the next eight to twelve quarters.
Agentforce ARR has to compound off a larger base, with paid deal counts expanding rather than relying on bundled or promotional seats. Data 360 has to function as a real AI data layer rather than a renamed Customer Data Platform. AI agents have to add revenue rather than simply replacing seats one for one. Informatica integration has to strengthen the data platform without consuming management attention. Buybacks have to reduce share count meaningfully net of stock-based compensation. Margins have to hold despite higher AI infrastructure costs.
None of those proof points are guaranteed. Each one moves the model.
5. Company History and Strategic Evolution
5.1 SaaS Pioneer Phase
Salesforce launched in 1999 with a thesis that on-premise enterprise software was overpriced, slow to implement, and unfriendly to end users. Cloud delivery, subscription pricing, and rapid deployment changed how enterprises bought CRM and eventually how they bought most software. The "no software" branding became one of the most successful category creation campaigns in enterprise technology history.
5.2 Platform Expansion Phase
The product surface expanded steadily after the core CRM offering matured. Service Cloud, Marketing Cloud, Commerce Cloud, and the Force.com platform extended Salesforce well beyond pipeline management. AppExchange built a developer ecosystem on top of the core platform. Each layer increased total addressable market, customer lock-in, and product complexity at roughly the same time.
5.3 Slack, Tableau, MuleSoft, and Integration Complexity
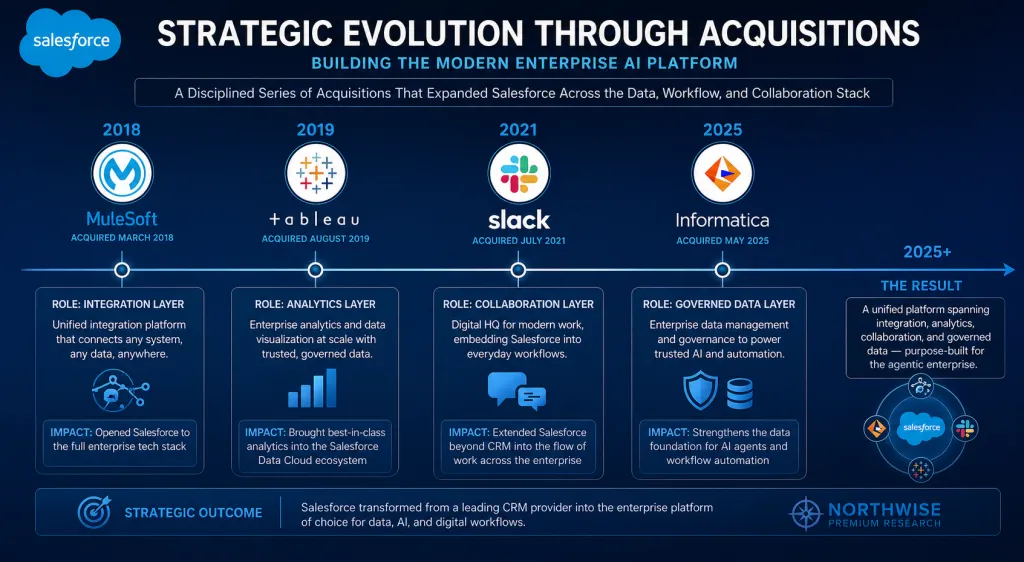
Three large acquisitions defined the platform expansion era. MuleSoft, acquired in 2018, added the integration infrastructure that connects Salesforce to the rest of an enterprise software estate. Tableau, acquired in 2019, brought analytics and visualization. Slack, acquired in 2021, added a collaboration and workflow surface that fit awkwardly with the legacy CRM motion at first.
Integration quality across these assets has been uneven. MuleSoft remains strategically important but has not always shown clean revenue acceleration. Tableau growth has slowed materially. Slack has yet to fully justify its purchase price by the original thesis, though the rise of agentic enterprise workflows may finally give it a defensible role. The unanswered question across all three is whether they become a unified AI-era platform or stay loosely federated.
5.4 Margin Discipline and Activist Era
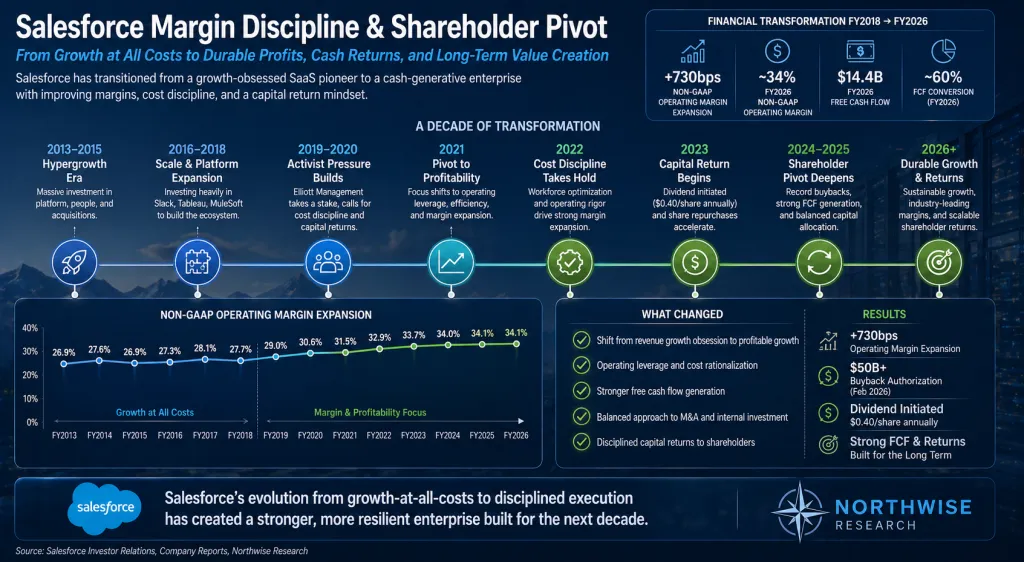
Activist pressure in 2023 accelerated a pivot that had already begun. Salesforce shifted from growth-at-any-cost toward operating leverage, free cash flow, headcount discipline, and shareholder return. Non-GAAP operating margin moved from the high 20s into the mid-30s within roughly two years. The company added a dividend, expanded buybacks, and started speaking the language of capital efficiency.
This pivot matters for the model. Salesforce does not need to recover hypergrowth for the equity to compound, provided margins hold and capital return continues at scale.
5.5 Informatica and the Data Layer
The Informatica acquisition closed in 2025 and adds enterprise data integration, master data management, and governance to the Salesforce stack. The strategic logic ties directly to the AI thesis. Agents are only as useful as the data they can access, and enterprise data is rarely clean, governed, or unified by default.
The risk is straightforward. Large acquisitions have a track record of consuming management attention, creating integration drag, and generating less synergy than promised. The opportunity is that a stronger data layer turns Data 360 from a marketing concept into a genuine AI execution platform. The market has not given Salesforce credit for either outcome yet.
6. Business Model and Revenue Architecture
6.1 Sales Cloud
Sales Cloud remains the historical anchor. It runs pipeline tracking, lead management, account ownership, forecasting, and the operational scaffolding that sales organizations depend on. The risk profile is direct. If AI reduces sales headcount, seat-based Sales Cloud revenue is the most exposed line. The opportunity is also direct. AI agents that draft outreach, qualify leads, and orchestrate deals across multiple stakeholders may be monetized as agent activity rather than as additional human seats.
6.2 Service Cloud
Service Cloud may be the cleanest AI battleground anywhere in the Salesforce portfolio. Customer service is one of the highest-volume, most labor-intensive, and most automatable enterprise workflows. AI agents resolving routine customer issues can plausibly displace large fractions of contact center labor.
That same dynamic creates the clearest monetization opportunity. Salesforce can charge for agent-handled cases, automated resolutions, and workflow execution rather than only for human seats. Service Cloud could end up as a higher-revenue product even with fewer human users, provided pricing structure adapts.
6.3 Marketing and Commerce
Marketing Cloud and Commerce Cloud have shown weaker growth and weaker investor sentiment than the rest of the portfolio. These segments carry incremental competitive pressure from Adobe, Shopify, and AI-native marketing tools. Treat them as supporting acts in the bull case rather than as drivers, unless evidence improves.
6.4 Platform, Integration, and MuleSoft
Platform and MuleSoft revenue benefits directly from agent deployment. Agents that act across multiple enterprise systems generate integration volume. MuleSoft sits at the orchestration layer between Salesforce and the rest of the enterprise software estate, which gains strategic value as workflows become more automated and cross-system.
6.5 Data Cloud and Data 360
Data 360 is the foundation of the AI thesis. Agents need context, and context comes from data that has been unified, permissioned, governed, and made AI-consumable. Salesforce has disclosed material early traction. Data and AI revenue reached $1.2B in Q2 FY2026 and grew 120% year over year. Data 360 ingested 32T records in Q3 FY2026, up 119% year over year, including 15T via Zero Copy.
These numbers indicate the data layer is being adopted at scale. They do not yet prove the long-term economics, the gross margin profile, or the renewal behavior of the offering.
6.6 Slack and the Collaboration Layer
Slack has not yet become the transformational asset originally pitched at acquisition. In an agentic enterprise, however, it may finally find its strategic home. Agents that interact with humans inside Slack channels, deliver updates inside threads, and route approvals through familiar collaboration surfaces may give Slack a role that traditional dashboard-first SaaS did not require.
This is upside optionality rather than a load-bearing piece of the thesis. The base case does not require Slack to inflect.
6.7 Agentforce and AI Monetization
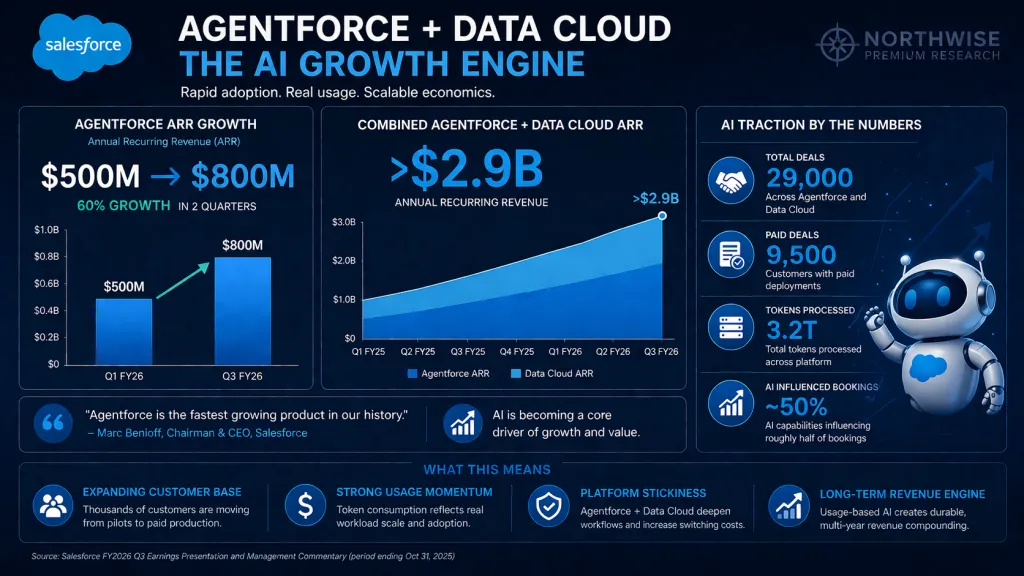
Agentforce is the centerpiece of the new product narrative. Q3 FY2026 disclosures put combined Agentforce and Data 360 ARR at nearly $1.4B, up 114% year over year. Agentforce ARR alone surpassed $500M, up 330% year over year. Agentforce accounts in production rose 70% sequentially. The company has closed over 18,500 Agentforce deals since launch, including more than 9,500 paid deals, with Agentforce processing more than 3.2T tokens through its LLM gateway.
Q4 FY2026 results extended that traction. Agentforce ARR climbed to roughly $800M, up 169% year over year, while combined Agentforce and Data Cloud ARR moved above $2.9B, growing more than 200% annually. Total Agentforce deals reached approximately 29,000, with production deployments up nearly 50% sequentially.
These figures support the case that Agentforce is more than a marketing layer. They do not yet establish whether the revenue is durable, whether margins are accretive, or whether seat replacement dynamics will offset Agentforce growth in coming years.
7. Financial Foundation
7.1 FY2026 Actual Results
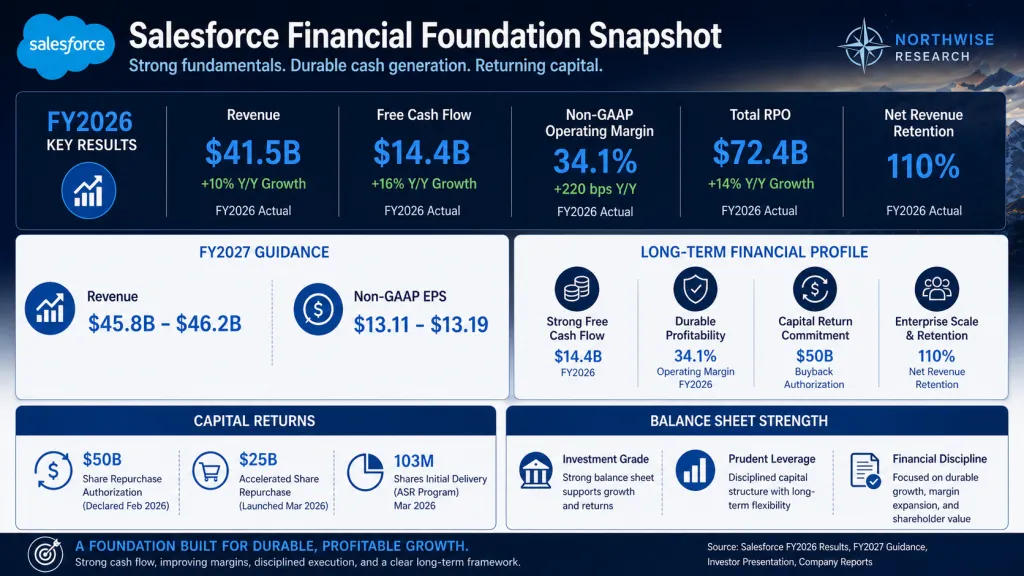
FY2026 closed with $41.5B in revenue, non-GAAP operating margin of 34.1%, operating cash flow of $15.0B, free cash flow of $14.4B, and capital returned to shareholders of $14.3B. Q4 FY2026 revenue reached $11.2B, growing 12% year over year. Current remaining performance obligations climbed 16%, and net new annual order value growth outpaced total AOV expansion through the back half of the fiscal year, suggesting forward bookings momentum.
The headline takeaway is that Salesforce already produces large, durable cash flow at scale. The equity does not depend on rediscovering hypergrowth.
7.2 FY2027 Guidance
Management guided FY2027 revenue to $45.8B to $46.2B, non-GAAP EPS to $13.11 to $13.19, and non-GAAP operating margin to 34.3%. The midpoint implies roughly 10% revenue growth and continued margin discipline. The EPS guide reflects both operating performance and the ongoing impact of share repurchase activity.
7.3 FY2030 Management Target
Management set a FY2030 target of $60B+ in revenue excluding Informatica, implying organic CAGR above 10% from FY2026. The "50 by FY30" framework requires subscription and support constant-currency growth plus non-GAAP operating margin to total fifty by fiscal year 2030.
A fiscal calendar note matters here. Salesforce's fiscal year 2030 ends January 31, 2030, which means it primarily reflects calendar 2029 operating reality. To represent a true 2030 operating year, the model later in this report runs through FY2031.
7.4 Free Cash Flow Quality
Free cash flow is the cleanest financial signal in the Salesforce equity story. The company converts a large fraction of revenue into cash, supports buybacks, services debt, funds AI infrastructure investment, and pays a dividend out of that cash flow. GAAP earnings are noisier, partly due to stock-based compensation and amortization of acquired intangibles. Non-GAAP earnings remove some of that noise but introduce their own distortions. Free cash flow is the most honest backstop to the model.
7.5 RPO and cRPO
Q3 FY2026 current remaining performance obligations reached $29.4B, up 11% year over year. cRPO is one of the better leading indicators of future revenue durability for an enterprise software company. The Q4 FY2026 cRPO reading of 16% growth strengthens that signal further.
7.6 Shareholder Return Profile
Capital return is now structurally important to the equity story. The company pays a quarterly dividend, recently raised to $0.44 per share, and operates a buyback program of unprecedented scale relative to its prior history. The shift from acquisition-heavy to return-heavy capital allocation is the single largest change in the financial profile over the past two years.
8. The Buyback as a Central Part of the Model
8.1 The $50B Authorization
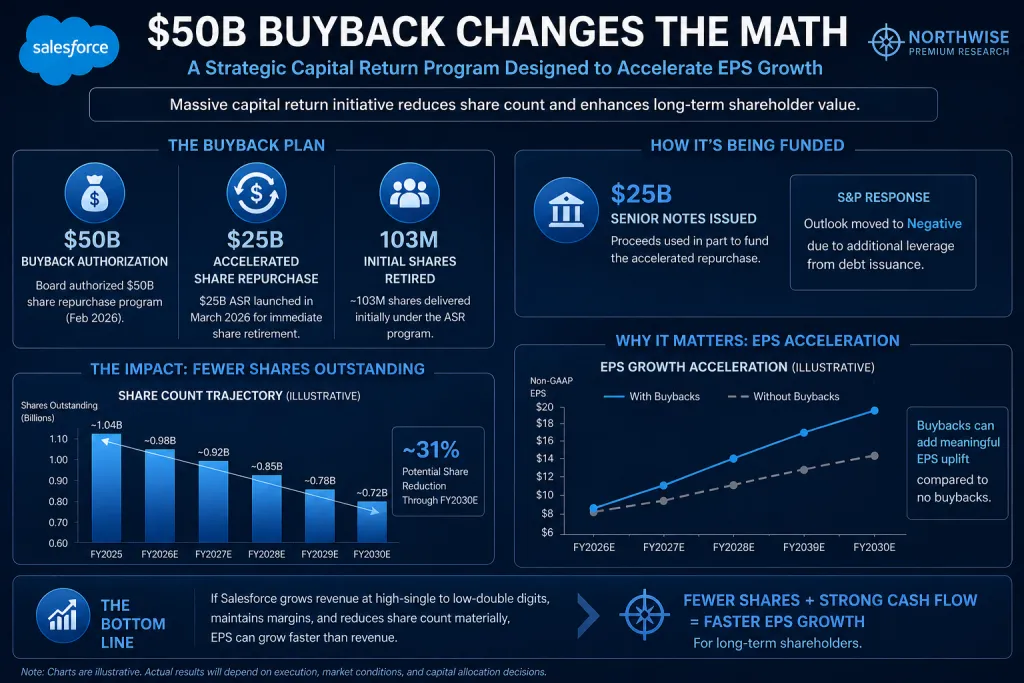
In February 2026, the board authorized a $50B aggregate share repurchase program, replacing unused prior authorization. Relative to a market capitalization in the $160B to $180B range across the spring of 2026, the program represents roughly 28% to 31% of equity value. That ratio puts it among the largest repurchase commitments in software history.
8.2 The $25B Accelerated Share Repurchase
On March 16, 2026, Salesforce launched a $25B accelerated share repurchase, executing half of the $50B program in a single transaction. ASR structures retire shares quickly through investment bank counterparties, with final settlement determined later based on the volume-weighted average price during the execution period.
8.3 The 103M Initial Share Delivery
Initial delivery under the ASR was approximately 103M shares, representing roughly 80% of the total expected to be retired under the transaction at the March 11, 2026 reference price. Final settlement is expected during Q3 or Q4 of FY2027. The pace and final share count depend on Salesforce's price action through the execution period.
8.4 Debt Funding and Credit Implications
The buyback was funded in part through a $25B senior notes issuance. S&P Global Ratings shifted its outlook on Salesforce to negative in response, citing elevated leverage and uncertainty around enterprise AI adoption. The downgrade in outlook is not a crisis signal, but it is a meaningful reminder that the buyback is not free.
If revenue growth disappoints over the next several years, the debt-funded portion of the repurchase program will look more like financial engineering than disciplined capital allocation. If revenue compounds and free cash flow scales as expected, the leverage decision will look opportunistic.
8.5 SBC Leakage and Net Share Reduction
Gross share repurchases are not the same as net share reduction. Stock-based compensation continues to issue new shares, which partially offsets buyback activity. Over the past several years, Salesforce's SBC has run in the high single-digit billions annually, which represents meaningful dilution before any net reduction occurs.
The model has to account for this. A $50B gross repurchase paired with $7B to $10B of annual SBC over four years still produces material net share count reduction, but the math depends on SBC trajectory, share price during repurchases, and any incremental authorization beyond the current $50B.
8.6 Why Buybacks Change the EPS Math
EPS is net income divided by share count. Even moderate revenue growth and margin durability translate into stronger EPS growth when share count falls materially. A company growing revenue at 9% with stable margins and a 4% annual net share reduction can compound EPS at roughly 13%. Compounded across four years, that produces meaningfully higher earnings power than the headline revenue trajectory alone suggests.
This is the quiet compounder logic underneath the equity. The buyback does not need to be heroic to do real work, provided the rest of the business holds together.
8.7 Why Buybacks Are Not a Substitute for Growth
The buyback only works if the business behind it remains healthy. If revenue stagnates, AI cannibalization accelerates, and competition compresses pricing, share count reduction delays the problem rather than solving it. Buybacks executed into deteriorating fundamentals destroy capital. Buybacks executed into a healthy business at a reasonable price compound it.
The Northwise view treats the buyback as a force multiplier on a moderate base case, not as the thesis itself.
9. Agentforce, Data 360, and AI Monetization
9.1 Current Disclosed Metrics
The disclosed Agentforce and Data 360 numbers across FY2026 quarters establish a clear adoption pattern. Q2 brought combined Agentforce and agentic AI ARR of roughly $440M and Data and AI revenue reaching $1.2B with 120% year-over-year growth.
Q3 lifted combined Agentforce and Data 360 ARR to nearly $1.4B, with Agentforce ARR alone above $500M and 70% sequential growth in production accounts. Q4 carried Agentforce ARR to approximately $800M and combined Agentforce plus Data Cloud ARR above $2.9B.
These are early-stage metrics measured against a $40B-plus revenue base, but the slope is steep enough to be strategically meaningful.
9.2 Work Units, Tokens, and Usage Evidence
Salesforce has begun disclosing usage-level data alongside revenue figures. Agentforce processed more than 3.2T tokens through its LLM gateway as of Q3 FY2026. Data 360 ingested 32T records in Q3 alone, including 15T via Zero Copy connections to external data sources. These disclosures move the conversation away from vanity metrics toward operational footprint, which is healthier evidence than logo counts.
9.3 What Is Real Versus Still Unproven
What the data establishes is adoption breadth. Agentforce is being deployed at scale across thousands of customers, including a meaningful number of paid deployments. Data 360 is moving real volumes of enterprise data through its infrastructure.
What the data does not yet establish is durability and economic quality. Renewal behavior, pricing structure, gross margin profile, expansion within existing accounts, the share of ARR that is genuinely incremental versus bundled, and the long-term competitive position of agent-based pricing all remain open questions. Adoption traction without economic durability would be a marketing story rather than an investment thesis.
9.4 The AI Upside Case
If Salesforce monetizes agents on a per-action, per-resolution, or per-workflow basis, AI becomes additive to revenue rather than corrosive to it. Customers who previously paid for human seats may pay more for agent activity that handles higher volumes at higher speeds. Data 360 could become a usage-based revenue layer scaling with enterprise data volume.
This is the path that turns Salesforce from a mature compounder into an AI growth platform. Probability remains moderate at best, and the proof requires several more quarters of clean disclosure.
9.5 The AI Cannibalization Case
If pricing structure remains primarily seat-based, AI becomes a slow drain. Enterprises automate sales development, customer service, and operational workflows, then renegotiate seat counts at renewal. Agentforce ARR grows but does not offset the seat compression in legacy products. Total revenue growth slows toward mid-single digits. Margins hold, buybacks support EPS, but the equity reverts to a slow-growth utility profile.
This is the bear path. It does not destroy the business. It compresses the multiple and limits upside.
9.6 Balanced Framing
The honest answer is that the AI transition is unresolved. The Northwise model assumes neither full cannibalization nor full reacceleration, and instead frames the central tension as a race between agent monetization and seat compression. That framing drives the scenario structure later in this report.
10. Competitive Landscape
10.1 Microsoft Dynamics and Copilot
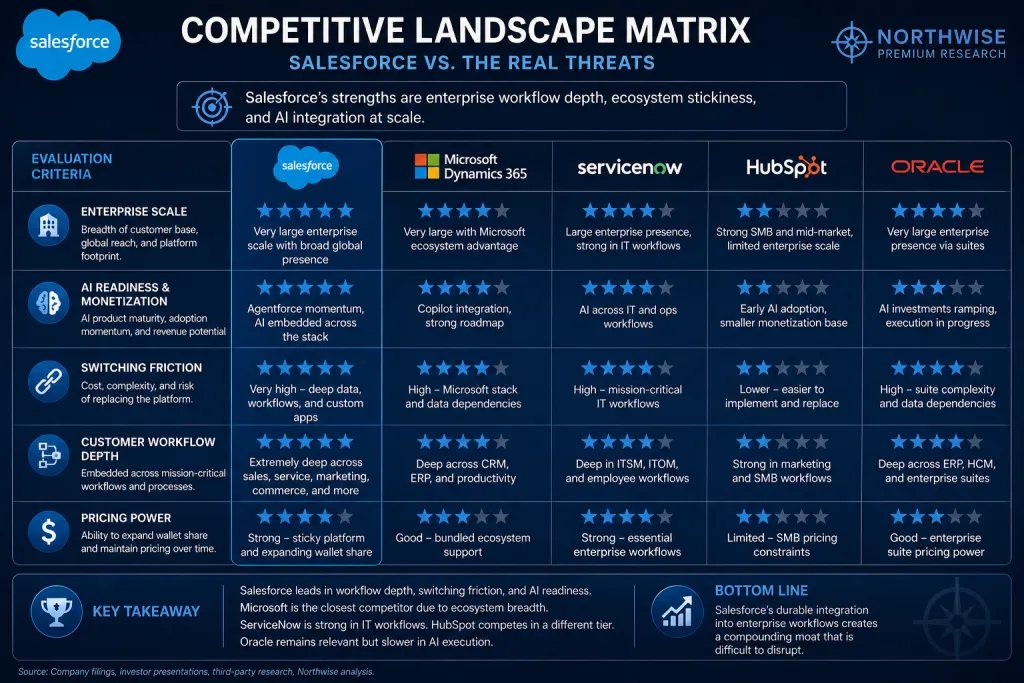
Microsoft is the most strategically threatening competitor. The company combines Dynamics CRM, Copilot AI, Teams collaboration, Azure cloud, and bundled enterprise agreements that give it pricing power Salesforce cannot match. A large enterprise already paying Microsoft for productivity, identity, and cloud services faces a low marginal cost of adding Dynamics into the same agreement.
The counterpoint is that Salesforce remains the more specialized customer workflow platform in many enterprises, particularly in sales-heavy industries. Switching from Salesforce to Dynamics is a major undertaking, even when bundled economics make it attractive. The competitive question is whether Microsoft can erode Salesforce share at the margins over the next five years rather than displace it outright.
10.2 ServiceNow
ServiceNow has expanded from IT service management into enterprise workflow automation, employee experience, and AI-driven process orchestration. The company has strong enterprise credibility, a clean architecture, and AI products that compete directly with several Salesforce workflow categories. It may own more workflow surface area outside customer-facing processes than Salesforce does.
The competitive overlap is real but partial. ServiceNow is strongest in IT, HR, and back-office workflows. Salesforce remains the dominant customer-facing system of record. Both companies will likely grow without one displacing the other, though margin pressure can travel in both directions.
10.3 HubSpot
HubSpot wins predominantly in small and mid-market accounts, where ease of use, faster implementation, and friendlier pricing matter more than enterprise depth. It does not pose a serious threat to Salesforce's enterprise customer base, but it caps the speed at which Salesforce can move down-market.
10.4 Oracle, Adobe, and Workday
Oracle competes credibly in enterprise applications and customer experience suites, particularly inside accounts already running Oracle ERP. Adobe overlaps with Marketing Cloud and Commerce Cloud through its Experience Cloud portfolio. Workday is less directly competitive but increasingly relevant as enterprise AI strategies span HR, finance, and customer-facing workflows. None of the three is a primary threat, but each constrains pricing power in specific product areas.
10.5 AI-Native Startups
Several well-funded AI-native startups have launched CRM, sales engagement, and customer service products that look impressive in demos. The gap between demo and enterprise deployment is wide. Enterprise sales cycles, security reviews, integration requirements, regulatory compliance, and procurement processes slow down even compelling new products considerably. Most AI-native CRM startups face a multi-year path before they meaningfully threaten Salesforce's installed base.
10.6 Internal Enterprise AI Builds
Some large enterprises are exploring internal AI applications built on top of frontier models from OpenAI, Anthropic, Google, and Microsoft, often running on Azure or AWS. These initiatives can reduce dependency on Salesforce for specific workflows.
The constraint is that internal builds still need to interact with systems of record. If Salesforce remains the system of record for customer data, sales processes, and service workflows, internal AI agents end up calling into Salesforce APIs rather than replacing the platform. Salesforce's relevance in that scenario depends on whether enterprises also rip out the underlying systems of record, which is rare.
10.7 Why Replacement Risk Is Slower Than Demo Risk
Demo risk is high. Replacement risk is lower. The two are routinely conflated in market commentary. A new AI-native product can produce a dramatic demo within months. Displacing an embedded Salesforce footprint takes years. The model should reflect that asymmetry, which is why the bear case allows for meaningful competitive pressure without assuming an outright loss of the installed base.
11. Leadership and Management Review
11.1 Marc Benioff
Benioff remains the strongest commercial mind in enterprise software and one of the most effective brand-builders in technology. He created the SaaS category, scaled Salesforce through three platform transitions, and continues to operate as a cultural and strategic force. He is also a promotional communicator whose narrative often runs ahead of execution, and his history of large acquisitions has cost shareholders before.
The right framing is mixed and improving. The pivot toward margin discipline, transparent capital return, and AI focus suggests a more shareholder-aligned phase. Pattern recognition still requires several more quarters before the discipline becomes the new baseline assumption.
11.2 Robin Washington
Robin Washington's appointment as CFO has been one of the most consequential leadership moves at Salesforce in years. Her track record at Gilead and Honeywell points toward the kind of capital allocation rigor that the equity story has needed. The decision to launch the $25B ASR, fund part of it with debt, and continue raising the dividend reflects a CFO willing to make consequential commitments on behalf of shareholders rather than maintaining maximum optionality.
Her statements around free cash flow durability and growth confidence carry weight precisely because the company is taking on real leverage to repurchase stock. If the buyback works, much of the credit will sit with her.
11.3 Brian Millham and Operating Execution
Brian Millham's role across go-to-market and operations has been central to the margin expansion of the past two years. The shift from growth-at-any-cost selling toward more disciplined account economics took operational execution, not just narrative. Continued progress on retention, account expansion, and seller productivity feeds directly into both organic growth and margin durability.
11.4 Management as Tailwind or Risk
Management is a tailwind when buybacks are well-timed, margins remain disciplined, AI metrics are transparent, Informatica integrates cleanly, and SBC stays contained. Management becomes a risk when capital allocation tilts toward promotional moves, AI metrics get marketed beyond what the underlying economics support, debt-funded repurchases continue while growth deteriorates, or M&A complexity returns.
The current configuration leans tailwind. The track record demands continued vigilance.
12. Key Risks
12.1 Real Risks
Ten risks deserve real weight in the model.
- AI cannibalizes seats faster than Salesforce monetizes agent workflows.
- Agentforce adoption stays broad but ARR proves heavily bundled or discounted.
- Data 360 growth fails to translate into durable margin-accretive revenue.
- Informatica integration distracts management or fails to lift data and AI economics.
- Microsoft bundles aggressively and compresses Salesforce pricing across enterprise accounts.
- ServiceNow captures incremental enterprise workflow budgets.
- SBC offsets too much of the gross buyback.
- Debt-funded repurchases reduce balance sheet flexibility through a future downturn.
- Multiple compression persists even if EPS grows.
- Macro IT budgets weaken and elongate enterprise sales cycles.
Each of these is real. None of them on its own breaks the thesis. Two or three of them together would.
12.2 Overstated Risks
Several common bear arguments deserve less weight than they receive in commentary.
"AI kills Salesforce" oversimplifies a genuinely contested transition. "Old SaaS cannot win AI" ignores enterprise data and workflow incumbency, which historically advantages incumbents during platform shifts in B2B software.
"CRM is ex-growth forever" disregards management's $60B+ FY2030 organic target and the cRPO trajectory. "Buybacks are fake" ignores the actual scale of free cash flow and the $25B ASR already in execution. "Startups will replace Salesforce quickly" underestimates enterprise switching friction by an order of magnitude.
The Northwise view does not dismiss bear arguments. It distinguishes the strong ones from the rhetorical ones.
12.3 What Would Break the Thesis
Several specific outcomes would force a thesis revision rather than a positioning adjustment.
- Organic growth falling below management's trajectory for multiple consecutive quarters.
- Agentforce ARR growth stalling or proving mostly bundled.
- Share count failing to decline meaningfully net of SBC.
- Margins compressing materially due to AI infrastructure costs.
- Debt service constraining future capital allocation flexibility.
- Customer defections accelerating in marquee accounts. Informatica integration creating drag without lifting the data layer.
If two or more of these arrive together, the thesis weakens enough to warrant material reduction.
12.4 What Would Strengthen the Thesis
The mirror image set of indicators would strengthen conviction.
- Agentforce ARR continuing triple-digit growth off a larger base.
- Paid Agentforce deal counts rising as a share of total deals.
- Data 360 records, Zero Copy usage, and unstructured data processing continuing to expand.
- Management providing cleaner AI monetization disclosure.
- Share count falling faster than expected.
- The FY2030 revenue target remaining credible through earnings cycles.
- Margins moving toward the "50 by FY30" framework on schedule.
Several of these indicators are already trending favorably. The remaining proof is what determines whether the equity reaches the upper end of plausible outcomes.
13. Full Model Construction
13.1 Why We Model Through FY2031
Salesforce's fiscal year 2030 ends January 31, 2030, which means it primarily reflects calendar year 2029 operating reality. A model that stops at FY2030 captures only nine to ten months of true 2029 performance and excludes calendar 2030 entirely. To represent a full 2030 operating year, the Northwise model runs through FY2031, which spans approximately February 2030 through January 2031.
This avoids stopping the forecast one year too early and aligns the modeled endpoint with the calendar year readers actually associate with "2030."
13.2 Starting Baseline
FY2026 actuals and FY2027 guidance form the modeled starting point. Revenue of $41.5B, non-GAAP operating margin of 34.1%, and free cash flow of $14.4B in FY2026 anchor the trailing baseline. FY2027 guidance midpoints of approximately $46.0B in revenue, 34.3% non-GAAP operating margin, and $13.15 in non-GAAP EPS anchor the forward baseline. The model treats both as known inputs and builds outward from there.
13.3 Management Trajectory as Base Anchor
The FY2030 management target of $60B+ in revenue excluding Informatica, paired with the "50 by FY30" framework, supplies the base case waypoint. The model uses this trajectory as a reference point rather than as the endpoint, then extends through FY2031 with assumptions consistent with each scenario's underlying logic.
13.4 Revenue Assumption Logic
Revenue assumptions across scenarios reflect different views on whether Salesforce hits, beats, or misses management's organic trajectory, plus how much Informatica contributes, and how AI monetization scales relative to seat compression.
The bear case assumes Salesforce misses the management trajectory due to AI cannibalization and competitive pressure.
The base case broadly tracks the management trajectory and extends it modestly into FY2031.
The bull case assumes Agentforce, Data 360, and Informatica drive faster growth than management's plan implies.
The ultra bull case assumes AI becomes a major standalone growth engine that reaccelerates the company.
The actual revenue ranges, scenario probabilities, and mathematical outputs sit in the gated section that follows.
13.5 Margin Assumption Logic
Margin assumptions follow a similar scenario logic.
The bear case allows for some compression as AI infrastructure costs and competitive pricing pressure constrain operating leverage.
The base case assumes continued discipline broadly consistent with the "50 by FY30" framework.
The bull case assumes AI and data layers prove margin-accretive over time.
The ultra bull case assumes Salesforce earns the margin profile of a high-quality AI workflow platform.
13.6 Share Count Assumption Logic
Share count assumptions reflect the interplay of buyback execution, SBC issuance, and stock price during repurchase periods.
The bear case assumes meaningful net reduction below current levels but limited by softer FCF and a higher share price during execution that retires fewer shares per dollar deployed.
The base case assumes the full $50B authorization executes against the FY2030 horizon and produces material net share count reduction.
The bull case assumes additional repurchase activity beyond the current authorization.
The ultra bull case assumes continued aggressive repurchase activity as free cash flow scales further.
13.7 EPS Calculation Method
EPS in each scenario is calculated as revenue multiplied by net margin, divided by share count. Net margin in this model approximates non-GAAP net margin to align with how management guides EPS and how the equity is typically valued. The same methodology is applied consistently across all four scenarios, which preserves comparability.
13.8 Multiple Selection Logic
Terminal multiples are selected based on each scenario's implied EPS growth profile, durability, and qualitative business characteristics. Faster compounding earns a higher multiple. A scenario where Salesforce becomes a structurally faster-growing AI platform earns a premium relative to a scenario where it remains a mature SaaS utility. The multiple selections deliberately stop short of hypergrowth-style valuations even in the most favorable scenario, which keeps the framework conservative.
13.9 Probability Weighting Logic
Each scenario carries an explicit probability that reflects how likely the outcome appears given the current evidence base and the unresolved nature of the AI transition. Probabilities sum to 100%, and the weighted FY2031 value is the probability-weighted price target across all four scenarios. That weighted value then gets discounted back to present value at multiple discount rates to produce action zones grounded in current price rather than nominal future targets.
13.10 What Comes Next
The free portion of this report covers the business, the AI transition, the competitive set, the financial baseline, the leadership picture, and the model's structural logic. It is the orientation layer that makes the rest of the analysis legible.
The premium section that follows assigns the actual numbers.
It contains the full bear, base, bull, and ultra bull scenario outputs, the specific revenue and margin and share count assumptions, the calculated FY2031 EPS for each case, the terminal multiples applied, the resulting price targets, the probability-weighted FY2031 value, the present value table at four discount rates, the buy through sell action zones derived from that present value framework, the current Northwise positioning, and the final synthesis of what the model proves and what it leaves unresolved.
Premium members can read the rest below.
Northwise Premium
Choose how to continue with Northwise
Join Northwise Premium
Unlock the rest of this report, its complete valuation, the downloadable model, portfolios, and action framework.
Join Northwise PremiumCreate a Free Account
Continue across Free Northwise research, follow companies, save reports, and receive updates.
Create a Free Account
Celsius Stock Analysis: The Shelf Reset and the Second Growth Curve
Celsius stock analysis of the shelf reset, Alani growth, Pepsi economics and cash flow, with a 2030 model and a Premium valuation and entry-price framework.

Meta AI Spending: The Customer Is Already Here
Can Meta turn AI spending into shareholder returns? We model advertising, Muse, hardware, capital costs and cash flow through 2030, with a full valuation.

IREN Stock Dilution: Can the Build Reach Shareholders?
IREN stock analysis of AI growth, funding and dilution through 2030. Read our full valuation, 27 scenarios and price zones free. Excel model is Premium.
Northwise Portfolios
See how the research becomes real decisions
Reader discussion
Discuss the research
Premium access is required to join this report's discussion.
Join Northwise Premium
No comments yet. Start a thoughtful discussion.