Oracle Stock Forecast 2030

Oracle’s backlog has settled the demand question. The valuation now turns on how much value the AI build creates—and how much reaches existing shareholders.
In this article
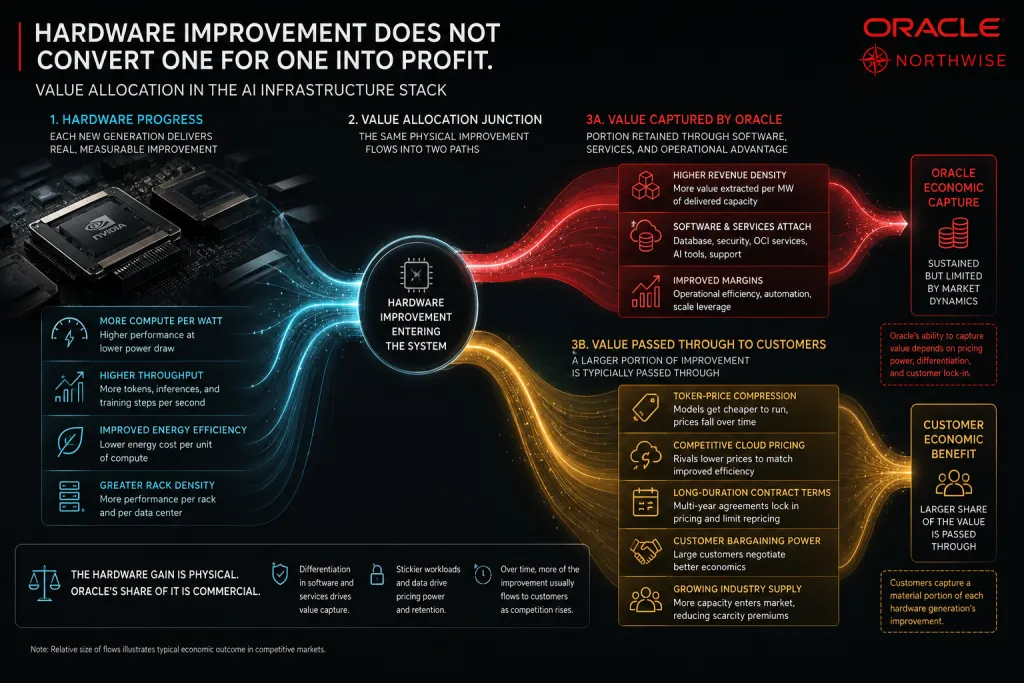
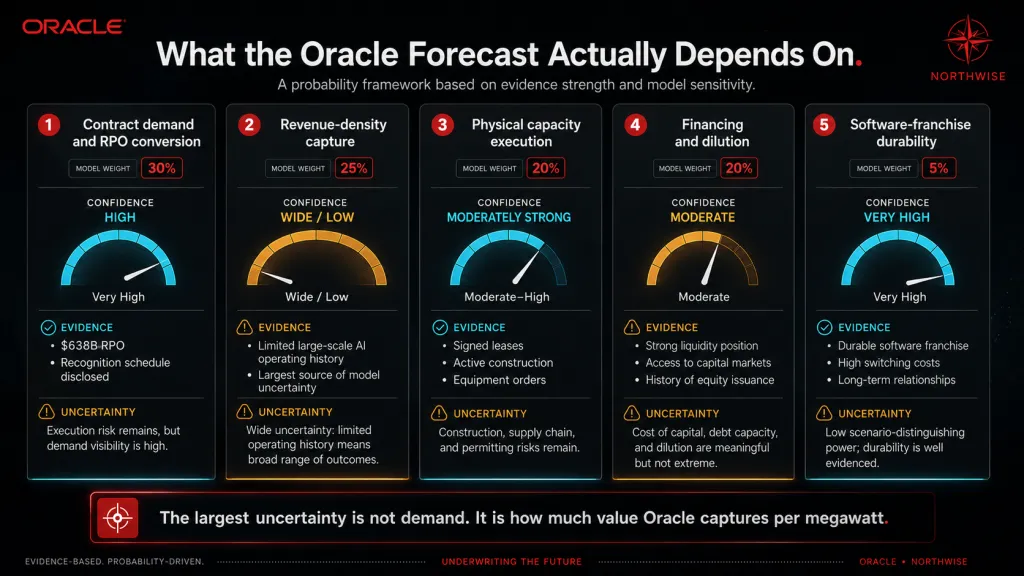
In our Oracle Stock Forecast 2030, a $638 billion backlog has already settled the demand question. What remains open is how much of the value created by the build reaches the shareholders who owned Oracle before it began.
Executive Summary
Oracle spent decades assembling one of the most durable software franchises in enterprise technology. It is now using that franchise to underwrite one of the largest AI infrastructure programs any public company has attempted. The market has priced the visible costs of that decision: rising capital expenditure, negative free cash flow, an expanding debt load, and dilution still to come.
Those concerns are legitimate. They also rest on a second assumption that receives far less scrutiny, which is that Oracle will keep spending at the current rate regardless of what the infrastructure earns. Our model does not grant that assumption.
Oracle can slow optional campuses, favor customer-funded deployments, stop equipping uncommitted power, and lean on its database, applications, and support businesses to protect liquidity. Even our Stress Case produces a cloud several times the size of the one Oracle operates today, substantial operating income, and positive free cash flow by 2030. Oracle arriving in 2030 as a major AI infrastructure provider is close to settled by contracts already signed and capital already committed.
What remains open is how much of the value created by that infrastructure reaches the people who owned Oracle before the build began. The realistic distribution runs between an enormous cloud with weak value capture and an enormous cloud with strong value capture. Corporate failure sits outside the plausible range. Shareholder disappointment does not.
Four outcomes carry the entire forecast, and every section that follows is an argument about which one Oracle lands in.
Outcome | 2030 revenue | Non-GAAP EPS | Funded debt | Diluted shares | The short version |
|---|---|---|---|---|---|
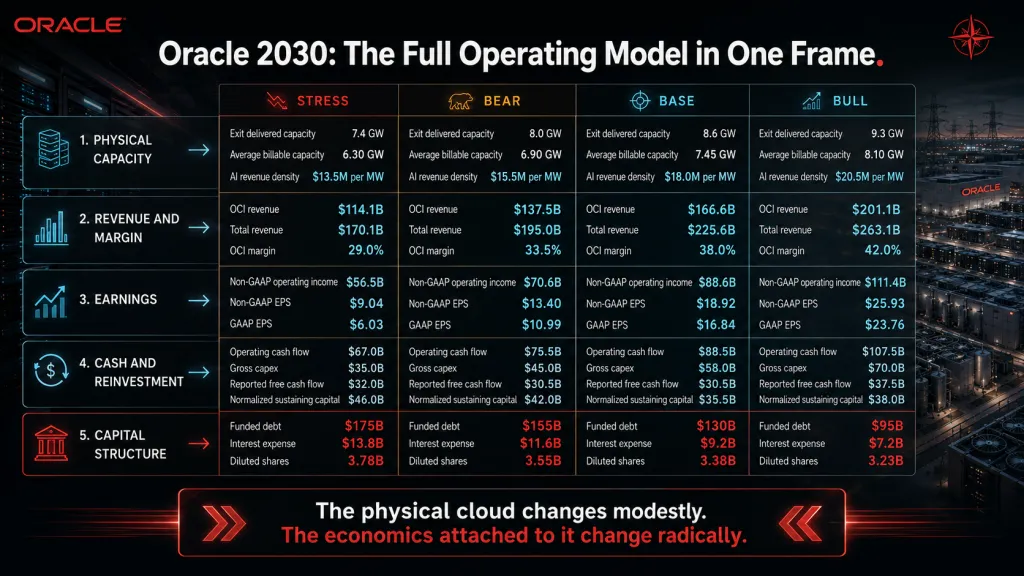
Stress | $170.1B | $9.04 | $175B | 3.78B | Management brakes the spend and the balance sheet keeps the proceeds |
Bear | $195.0B | $13.40 | $155B | 3.55B | The cloud works and pricing and financing absorb the upside |
Base | $225.6B | $18.92 | $130B | 3.38B | Revenue density carries the model and dilution caps the earnings |
Bull | $263.1B | $25.93 | $95B | 3.23B | Enterprise attach turns capacity into a premium platform |
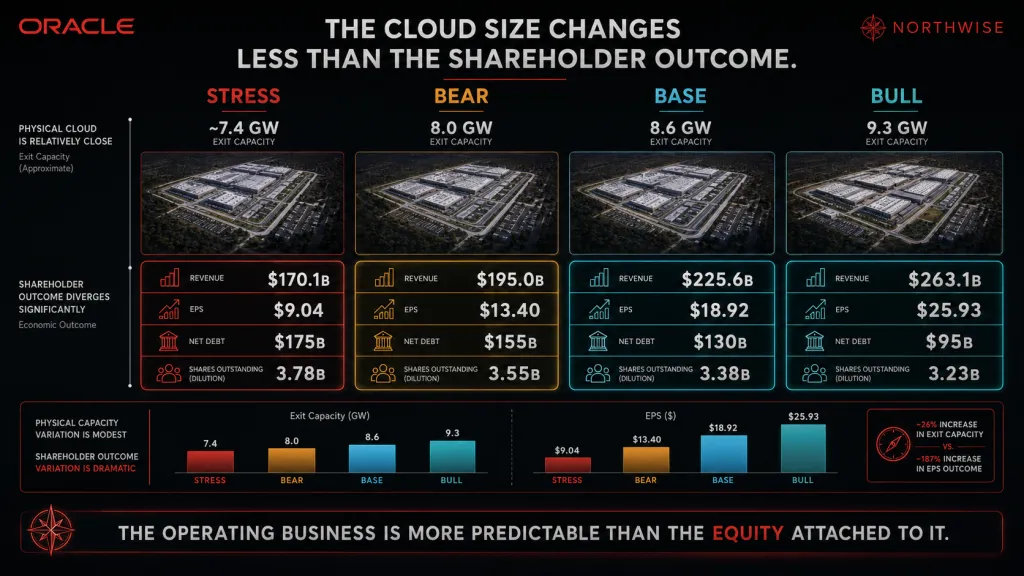
Revenue varies by roughly 55% across those rows. Earnings per share varies by nearly 3 times, and funded debt by close to $80 billion. The operating business is considerably more predictable than the shareholder outcome attached to it.
This forecast begins with the business Oracle owned before the build and the backlog that changed its strategic identity. It then reconstructs how contracted gigawatts become billable capacity, how billable capacity becomes revenue, and how different customer-funding structures alter the capital burden. The middle sections follow that revenue through depreciation, leases, interest, dilution, and free cash flow. The free portion closes with the complete operating model across all 4 scenarios and a full accounting of what Oracle reported against what we reconstructed.
The premium sections then assign a value to each outcome, weight the distribution, and convert the result into a Northwise entry framework.
Part I: The Company Before the Build
1. The Business That Existed Before the Cloud
Oracle sells the software large organizations use to run themselves. Its database has served as the default record-keeping system for banks, governments, airlines, hospitals, and manufacturers for close to 4 decades. Around that database sit applications for finance, human resources, supply chain, and healthcare, along with the support contracts that keep all of it operating.
That business has an unusual economic shape. Customers pay in advance, renew at high rates, and face substantial cost and risk if they switch, which produces recurring revenue at high margins with very little capital required to sustain it. Oracle generated $67.4 billion of revenue in fiscal 2026, and roughly $49 billion of it came from these software and services lines.
Oracle Cloud Infrastructure, referred to throughout this report as OCI, is the company's cloud computing business. It began as a way to run Oracle's own database software for customers who no longer wanted to operate their own data centers. It has since become something considerably larger, and the transformation is the subject of this forecast.
One clarification governs everything that follows. The software franchise insulates Oracle from existential failure. It does not insulate existing shareholders from debt, dilution, or poor capital allocation, and the distance between those 2 forms of safety runs through every section of this report.
2. How Oracle Became an Infrastructure Company
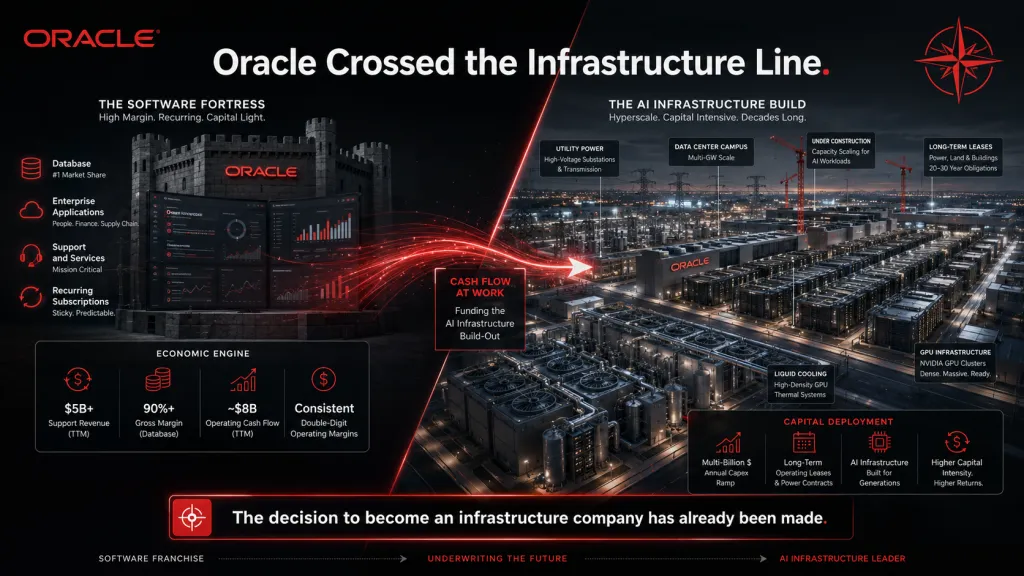
The 3-year historical record shows the crossing point without requiring much interpretation.
Historical result | FY2024A | FY2025A | FY2026A |
|---|---|---|---|
Revenue | $53.0B | $57.4B | $67.4B |
OCI revenue | $6.8B | $10.2B | $18.1B |
GAAP operating income | $15.4B | $17.7B | $20.6B |
Operating cash flow | $18.7B | $20.8B | $32.0B |
Capex | $6.9B | $21.2B | $55.7B |
Free cash flow | $11.8B | $(0.4)B | $(23.7)B |
Capital expenditure rose 8 times in 2 years while operating cash flow rose 71%. Free cash flow, the cash left after a company funds its operations and its investment, moved from $11.8 billion positive to $23.7 billion negative across the same window. Oracle entered fiscal 2026 as a high-margin software company and exited it as a software company financing a hyperscaler-scale infrastructure build.
The change is structural rather than merely large. Oracle now commits capital against power, buildings, leasehold improvements, networking, accelerators, cooling, and multi-decade data-center leases. Accelerators are the specialized processors that run AI workloads, and they represent the single largest line of that spending.
Those obligations behave nothing like software costs. They arrive years before the revenue they support, they depreciate on schedules set by accounting policy and physics, and they resist reversal once construction begins.
3. Stargate Made the Change Permanent
Stargate is the infrastructure program OpenAI announced to build the data centers its models require, and Oracle serves as the primary builder and operator for a substantial share of it. The original Abilene capacity established that Oracle could deliver frontier-class infrastructure at gigawatt scale. A subsequent OpenAI framework and a 4.5 GW partnership extended the commitment across a portfolio of sites at varying stages of development.
The build does not need to reach every announced megawatt for the strategic change to hold. Oracle has already committed enough capital, signed enough leases, and energized enough infrastructure that OCI represents a much larger share of the company in every scenario we model, including the weakest one.
The decision on whether to become an infrastructure company has passed. Oracle is one, and the only open variable is how well the infrastructure pays.
Part II: The Backlog
4. What $638 Billion Does and Does Not Establish
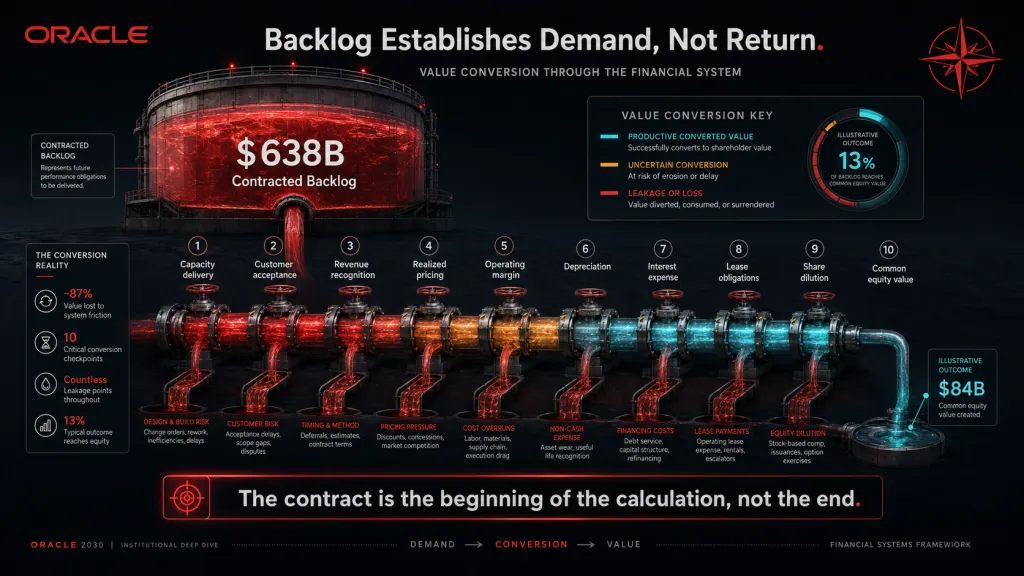
Remaining performance obligations, reported as RPO, is the accounting term for contracted revenue a company has signed but not yet delivered. It is the closest thing to a backlog figure that cloud and enterprise software companies disclose, and Oracle's stands at $638 billion.
That number answers one question with unusual clarity. Large, sophisticated customers want the capacity, they have signed for it, and the commitments extend years into the future. At Oracle's fiscal 2026 revenue run rate, the backlog represents roughly 9.5 years of company-wide sales.
Several other questions go untouched. The figure does not establish when the capacity becomes available, how much Oracle must spend to deliver it, what margins the contracts earn, how much cash arrived as prepayment, or how much of the resulting revenue survives to reach common shareholders.
Backlog establishes demand. Return on capital has to be established somewhere else, and most of this report is spent establishing it.
5. How the Backlog Grew by $500 Billion
The expansion happened inside a single fiscal year, and its shape carries more information than its endpoint.
Period | RPO |
|---|---|
FY2025 | $138B |
FY2026 Q1 | $455B |
FY2026 Q2 | $523B |
FY2026 Q3 | $553B |
FY2026 Q4 | $638B |
The first quarter of fiscal 2026 added more than $300 billion on its own. Growth from that point moderated into large but comparatively ordinary increments. The additions came primarily from large AI infrastructure contracts and not from ordinary application renewals, which is what turned the backlog into a capital plan instead of simply improved revenue visibility.
We avoid stating gross bookings with precision. Oracle does not disclose every modification, cancellation, or currency adjustment inside the roll-forward, so the sequential change understates gross additions by an amount public filings do not allow us to size.
6. When the Backlog Converts
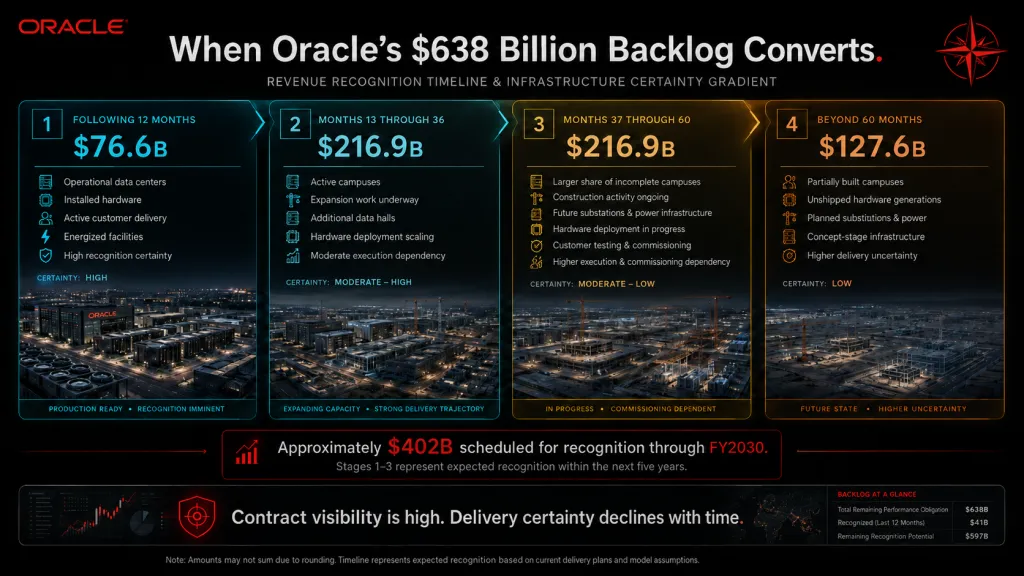
Oracle discloses when the backlog turns into revenue, and the schedule is the single most useful piece of forward visibility the company provides.
Recognition window | Amount |
|---|---|
Following 12 months | $76.6B |
Months 13 through 36 | $216.9B |
Months 37 through 60 | $216.9B |
Beyond 60 months | $127.6B |
Applied to our forecast period, the opening backlog supports approximately $402 billion of revenue recognition through fiscal 2030. The near-term portion is close to certain. That first $76.6 billion recognizes within 12 months against a company that generated $67.4 billion of total revenue in all of fiscal 2026.
Confidence declines steadily as the schedule extends. Contracts recognizing in months 37 through 60 depend on capacity that does not yet exist, at sites still under construction, running hardware generations that have not shipped. The disclosure tells us what Oracle has promised, and delivery is a separate question the rest of this report takes up.
7. Diversified in Revenue, Concentrated in Growth
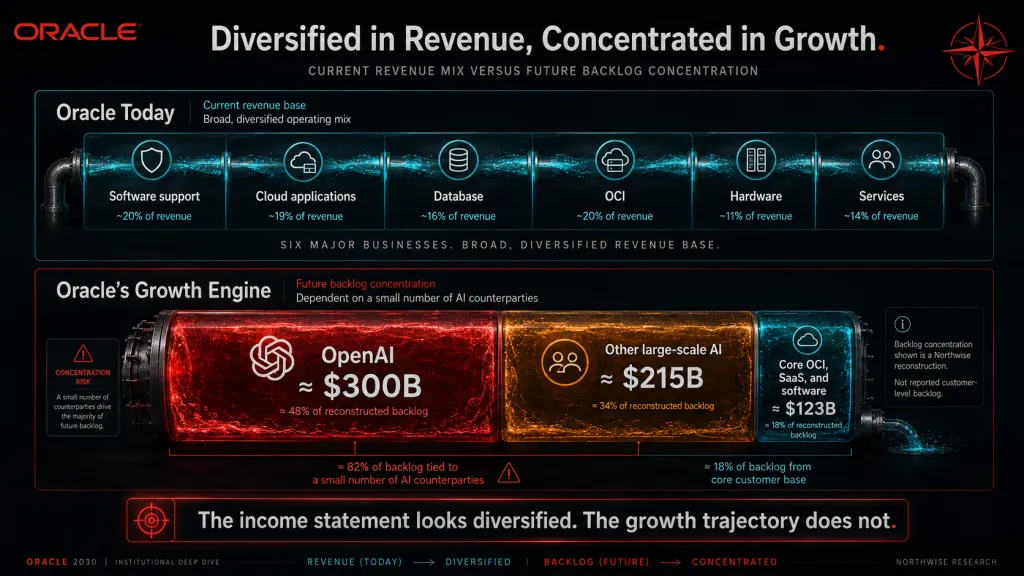
Four kinds of concentration operate here simultaneously, and conflating them produces bad conclusions in both directions. Current revenue concentration is low. Customer concentration in the GPU business, in the backlog, and across the physical campus portfolio is all high.
RPO pool | Central estimate |
|---|---|
OpenAI | $300B |
Other large-scale AI | $215B |
Core OCI, SaaS, and software | $123B |
The OpenAI figure is an external estimate and a model assumption. Oracle has not disclosed customer-level backlog, and readers should treat this split as our reconstruction and not as reported data.
Taken together, OpenAI may represent close to half of Oracle's future backlog without representing anything close to half of current company revenue. Oracle's income statement today looks diversified. Its growth does not, and the gap between those 2 statements is among the more underdiscussed risks in the story.
A contract signed years before delivery still requires grid capacity, construction, networking, hardware, commissioning, customer testing, and formal acceptance. Each step carries its own schedule and its own failure modes, and none of them appear in the backlog disclosure.
Part III: The Physical Cloud
8. Why This Business Is Measured in Megawatts
AI infrastructure is measured in megawatts of electrical capacity for a practical reason. Accelerators consume enormous power and reject enormous heat, and the binding constraint on how many can be installed in one place is how much electricity the site can draw and how much heat the cooling system can remove. Land is widely available. Grid interconnection, transformers, substations, and cooling capacity are not.
A megawatt of data center capacity therefore functions as a unit of production. Fill it with accelerators, connect it to a customer, and it generates revenue at a rate set by what that customer pays. Multiply capacity by that rate and the result is the revenue of the business.
Every model in this sector reduces to that multiplication. What separates a useful model from a misleading one is precision about which megawatts are being counted and what rate is realistically attached to them.
9. One Oracle Megawatt Is Several Different Numbers
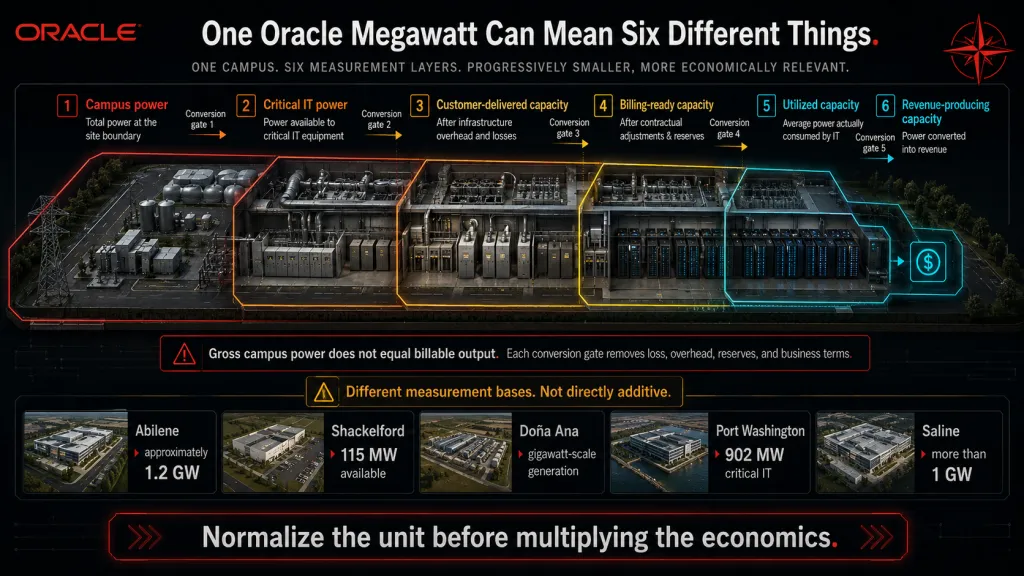
The word megawatt does at least 6 different jobs in this sector, and our model keeps them separate throughout. Campus power describes total site capacity. Critical IT power describes what reaches the servers. Customer-delivered capacity describes what has been handed over, while billing-ready capacity, utilized capacity, and recognized revenue each sit further down the chain.
Public disclosure moves between these definitions without always labeling which one is in use. A site described as gigawatt-scale may refer to gross campus power, on-site generation, or critical IT load, and those figures differ materially for the same facility. Applying revenue calculated on one capacity basis to cost calculated on another can move project economics by billions of dollars.
Our model uses customer-delivered megawatts as the primary physical unit. That measure sits closest to what a customer can actually be billed for, and it degrades more gracefully than the alternatives when a disclosure turns out to be ambiguous.
10. Reconstructing the Campus Portfolio
The named portfolio establishes that the capacity exists in physical form. It also demonstrates why the individual figures resist addition.
Campus | Public capacity marker | Modeled role |
|---|---|---|
Abilene | Approximately 1.2 GW | Initial Stargate anchor |
Shackelford | 115 MW available | Near-term expansion |
Doña Ana | Gigawatt-scale generation | Later Stargate capacity |
Port Washington | 902 MW critical IT | Major FY2028 contribution |
Saline | More than 1 GW | Expanded OpenAI estate |
Doña Ana is described in generation terms. Port Washington is described in critical IT terms. Abilene mixes both across phases, and several sites carry contract overlap with commitments already counted elsewhere. Summing that middle column produces a figure with no consistent physical meaning.
We reconstruct the schedule site by site and convert each marker to a customer-delivered basis before it enters the model. The individual adjustments are small and the cumulative effect is not.
11. The Capacity Funnel
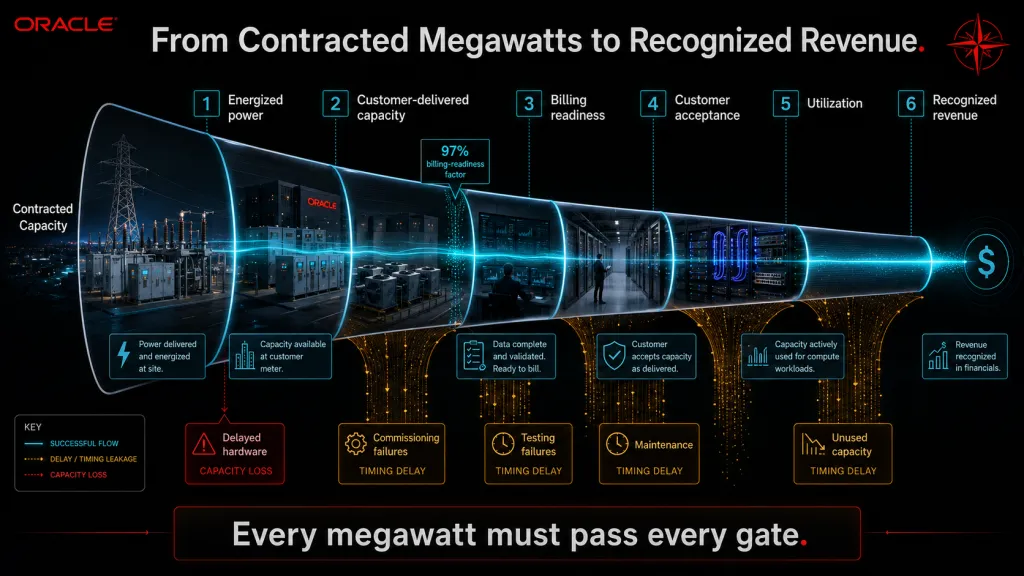
Every megawatt in this forecast travels the same path from contract to cash. Contracted capacity moves to energized power, then to customer delivery, then to billing readiness, then to utilization, and finally to recognized revenue.
Each stage introduces loss, delay, or both. Our model applies a 97% billing-readiness factor to customer-delivered capacity, which reserves a small share of the fleet for commissioning, scheduled maintenance, failed acceptance testing, and hardware in transition at any given moment.
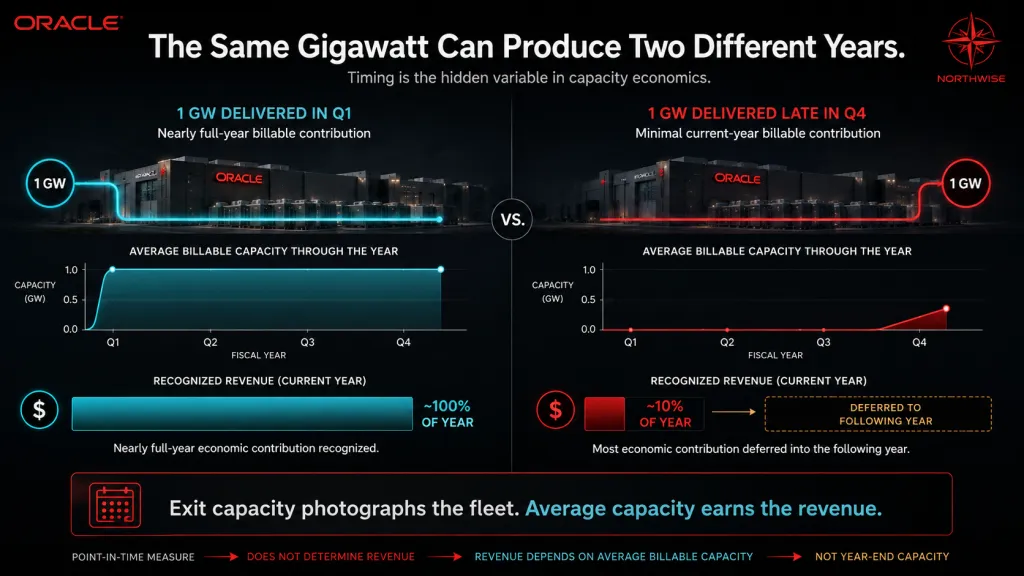
Timing does more damage than leakage. Capacity delivered in the fourth quarter of a fiscal year contributes almost nothing to that year's revenue and almost everything to the next. Revenue therefore attaches to average billable capacity across the year and never to the December exit figure, a discipline that separates our model from most published capacity math in this sector.
12. From 1.5 Gigawatts to Nearly 9
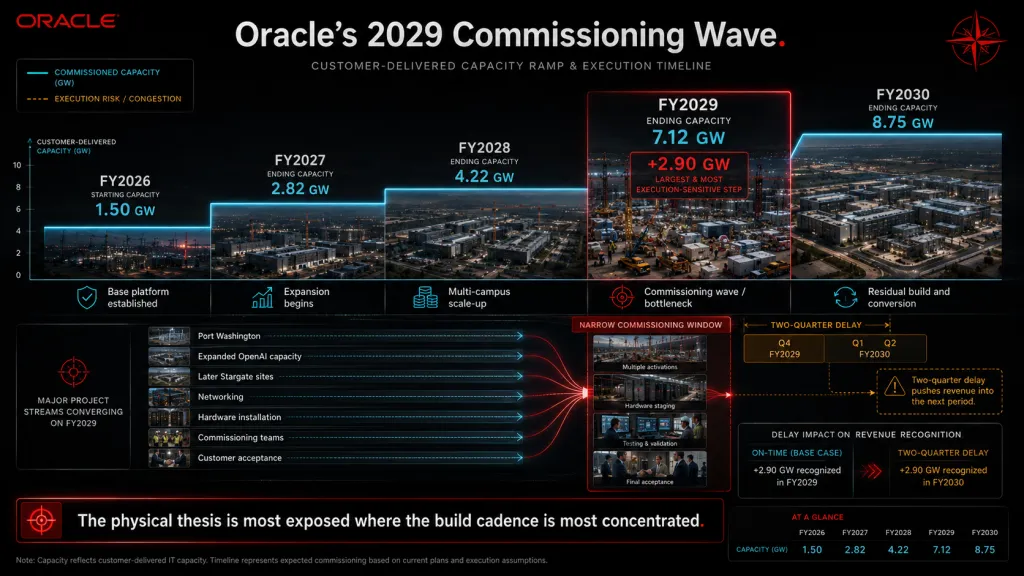
Oracle finished fiscal 2026 with approximately 1.50 GW of customer-delivered capacity. The Management Execution path, which tests Oracle's own announced trajectory, carries that base through the forecast period.
Fiscal year | New delivered capacity | Ending delivered capacity | Average billable capacity |
|---|---|---|---|
FY2027 | 1.32 GW | 2.82 GW | 2.36 GW |
FY2028 | 1.40 GW | 4.22 GW | 3.42 GW |
FY2029 | 2.90 GW | 7.12 GW | 5.45 GW |
FY2030 | 1.64 GW | 8.75 GW | 7.67 GW |
Ending capacity grows by a factor of 5.8 across 4 years. Fiscal 2029 carries the largest single-year addition at 2.90 GW, reflecting Port Washington, the expanded OpenAI estate, and the later Stargate sites arriving inside the same 12 months. That concentration is the primary physical execution risk in the forecast, and a 2-quarter slip there moves more revenue than a similar slip anywhere else in the schedule.
The first 2 years carry the least uncertainty in the entire model. Construction is already underway at those sites, the leases are signed, and the equipment orders have been placed. Delivery can slip by a quarter or 2 without breaking the schedule, and it cannot plausibly be halved.
That constraint shapes the whole forecast. Even our Stress Case reaches approximately 7.4 GW of year-end delivered capacity, within 15% of Bull, since contracts already exist, sites are already progressing, customers are funding part of the hardware, and much of the capital is committed well before weaker economics become visible. Scenario dispersion has to come from revenue density, margins, financing, and dilution, and that placement is the single most consequential methodological decision in this report.
Our independent Base Case runs slightly below the Management Execution path on physical capacity, at 8.6 GW of exit delivered capacity and 7.45 GW of average billable capacity. It runs slightly above on monetization, at $18.0 million of revenue per billable megawatt against $17.5 million. The 2 paths reach similar total OCI revenue through different routes, which serves as a useful internal cross-check.
Part IV: Turning Power Into Revenue
13. The Revenue-Density Equation
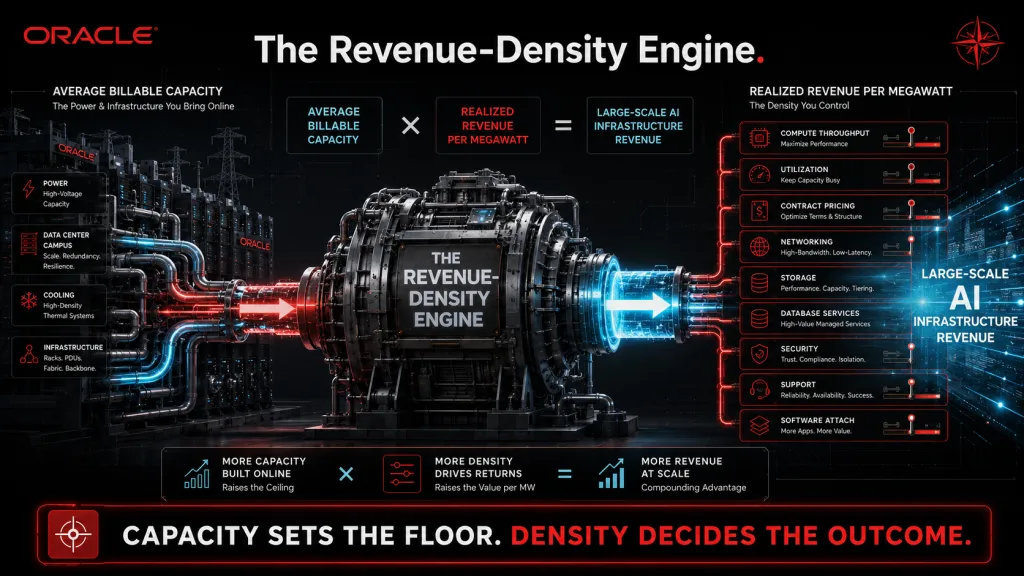
The AI infrastructure business reduces to one line of arithmetic. Average billable capacity multiplied by realized AI revenue per megawatt produces large-scale AI infrastructure revenue.
Capacity is the part that gets announced, photographed, and debated. Density is the part that decides the outcome.
Realized revenue per megawatt is a composite figure absorbing compute throughput, utilization, contract pricing, networking, storage, database services, security, support, and software attach. Two operators with identical megawatts and identical accelerators can produce very different densities, and the gap between them is commercial instead of physical.
14. The Starting Point
Fiscal 2027 is the first year in which the AI business grows large enough to measure honestly. The Management Execution model produces approximately $20.6 billion of large-scale AI revenue on 2.36 GW of average billable capacity, giving $8.7 million of realized revenue per billable megawatt.
That figure sits at roughly half the fiscal 2030 level, for mechanical reasons. Facilities ramp gradually across the year, customer acceptance occurs on a rolling schedule, first-year contracts do not immediately reach mature billing rates, and the newer high-value hardware cohorts represent a small share of a young fleet.
Fiscal year | AI revenue density |
|---|---|
FY2027 | $8.7M per MW |
FY2028 | $15.8M per MW |
FY2029 | $18.7M per MW |
FY2030 | $17.5M per MW |
Density peaks in fiscal 2029 and eases in fiscal 2030. The 2029 fleet is small enough that mature, high-value contracts dominate the average, and 2030 absorbs the 2.90 GW delivered during 2029 into a full-year average at first-full-year rates. We treat the dip as an artifact of cohort mix and not as a pricing forecast, since the scenario table handles pricing directly.
15. Why a 2030 Megawatt Should Earn More
Four drivers support higher density over the forecast period. Compute per watt improves with each hardware generation. Workload mix shifts toward higher-value inference and reasoning. Networking, storage, database, and software attach at rates that grow as the platform matures. And the enterprise selling motion improves as Oracle accumulates reference customers.
Vera Rubin and AMD Helios class systems raise productive compute per megawatt substantially against hardware installed in 2026. More useful work per watt is a physical fact and a defensible basis for expecting higher revenue per megawatt over time.
Technical throughput does not convert one for one into revenue, and the next section explains where the conversion leaks.
16. Efficiency Is Not the Same as Economic Capture
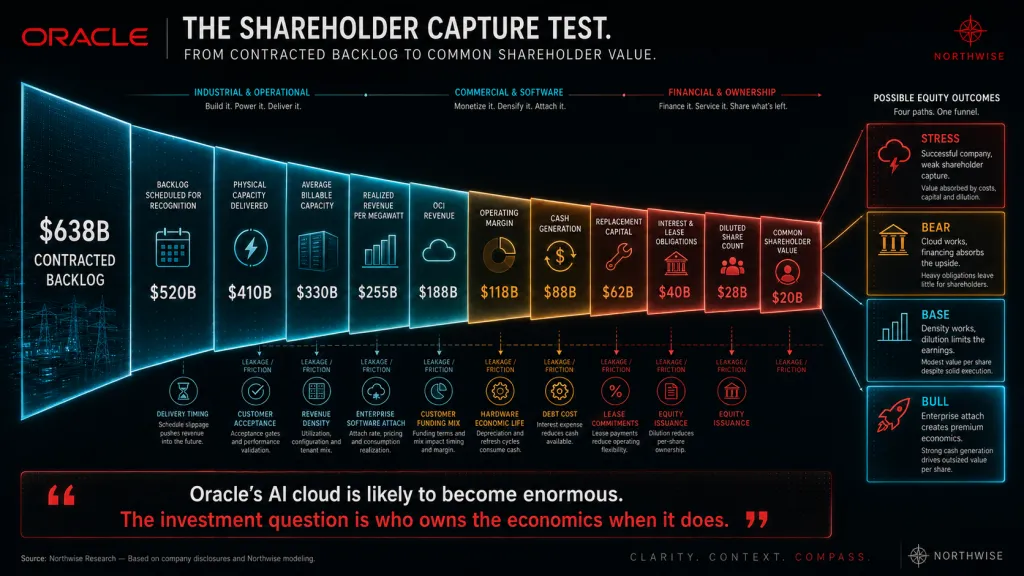
Oracle may pass a substantial share of the hardware improvement through to customers. Several pressures push in that direction at once: token-price compression, competitive cloud pricing, growing customer bargaining power, long-duration contracts priced before the improvement arrived, and supply becoming less scarce as the industry's construction wave lands.
Hardware improvement is close to certain over the forecast period. Oracle's share of that improvement is the variable the scenarios actually test, and the spread between Stress and Bull density is largely a statement about bargaining power.
The customers signing these contracts rank among the most sophisticated buyers of compute in the world. They understand the cost curve as well as Oracle does, and several of them hold credible alternatives.
17. Oracle's Data Advantage
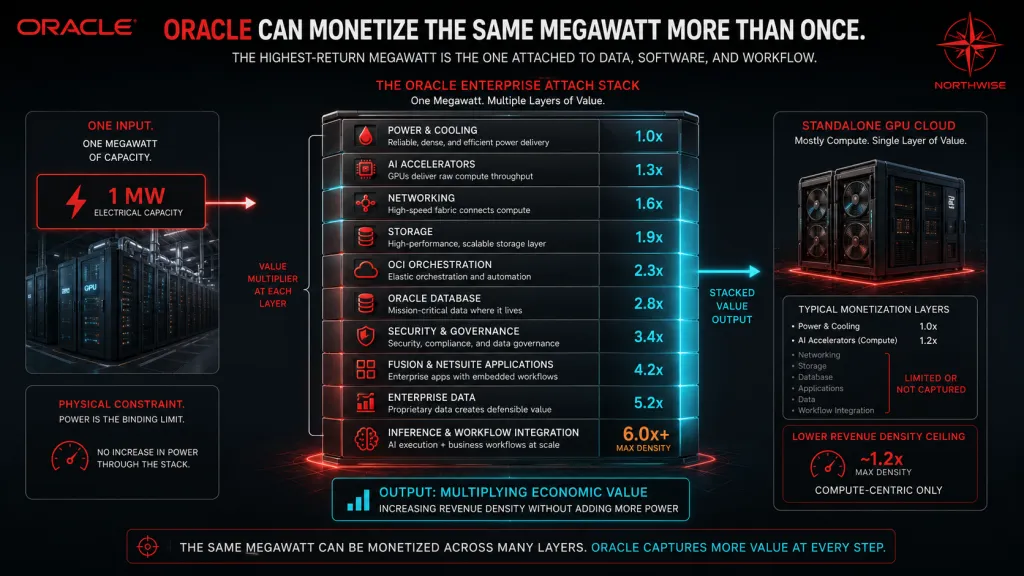
Oracle can attach databases, enterprise data, security, storage, applications, networking, multicloud access, and workflow integration to the same capacity a standalone provider sells bare. Each attachment raises revenue per megawatt without requiring an additional megawatt, which makes attach the highest-return lever available to the company.
The strongest opportunity sits in AI execution running beside the enterprise data and applications customers already use. Moving data is expensive, slow, and risky, and inference that runs where the data already lives carries a structural advantage over inference that requires a migration first.
Training capacity sold in isolation is the most competitive and least defensible version of this business. It is also the only version most of Oracle's independent competitors can offer.
18. The Complete Revenue-Density Model
The scenario table converts the argument of the previous 5 sections into arithmetic.
Scenario | Average billable AI capacity | Revenue per MW | AI revenue |
|---|---|---|---|
Stress | 6.30 GW | $13.5M | $85.1B |
Bear | 6.90 GW | $15.5M | $107.0B |
Base | 7.45 GW | $18.0M | $134.1B |
Bull | 8.10 GW | $20.5M | $166.1B |
Stress and Bull differ by 1.80 GW of average billable capacity and by $81.0 billion of annual AI revenue. Capacity varies by 29% across the distribution and revenue varies by 95%.
That relationship is the central operating divergence in the forecast. It explains why this report spends more time on pricing, attach, and contract structure than on construction schedules, and why the megawatt counts dominating sector commentary carry less information than they appear to.
Part V: Who Pays for the Hardware
19. Three Contracts, Same Revenue, Different Equity
Two Oracle contracts can generate identical revenue, identical reported margin, and radically different returns to shareholders. The variable separating them is who bought the accelerators.
Our model tracks 3 funding classes separately throughout: Oracle-funded and Oracle-owned capacity, customer-prepaid but Oracle-owned capacity, and customer-supplied hardware. Each produces different capital requirements, different depreciation, different financing needs, and different returns on invested capital.
In the Oracle-funded case, the company pays for accelerators, networking, facility integration, and supporting infrastructure. Oracle receives the full revenue and carries the depreciation, the financing burden, the replacement obligation, and the hardware obsolescence risk. That structure produces the highest revenue per megawatt and the lowest return on capital whenever pricing disappoints.
20. Prepaid Cash and Customer-Supplied Hardware
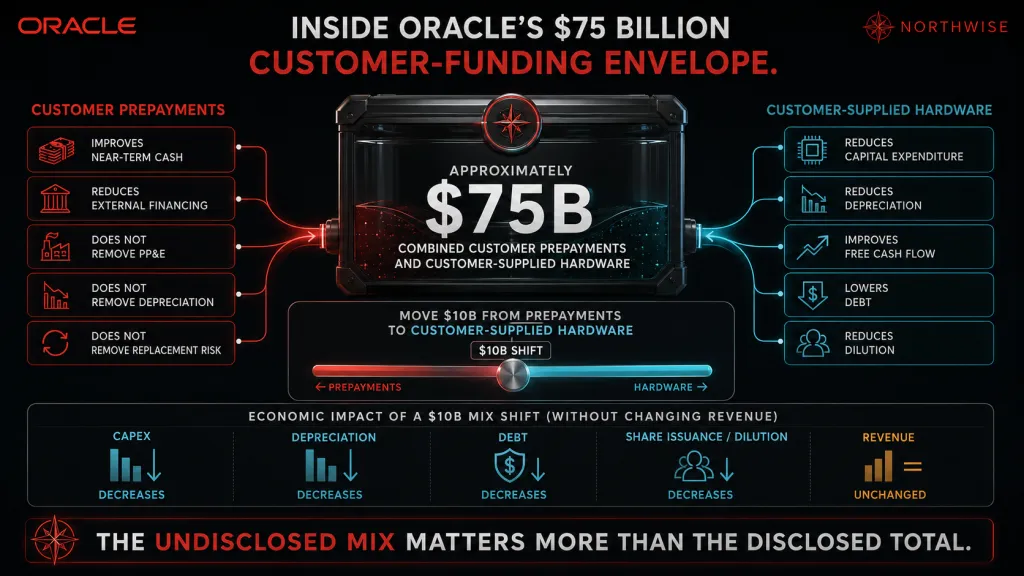
A prepayment is exactly what it sounds like. The customer pays Oracle in advance for capacity that has not yet been delivered, which improves Oracle's immediate cash position and reduces the external capital required to fund a deployment.
The equipment still sits on Oracle's balance sheet. Prepayment removes none of the property, plant, and equipment, none of the depreciation, and none of the eventual unwind of deferred revenue as the service is delivered. Cash arrives early and the accounting and replacement burden remain with Oracle for the full life of the asset, which is why readers who treat prepaid capacity as capital-light will overstate the return on it.
Customer-supplied hardware changes the economics far more decisively. The customer buys and owns the accelerators outright, and Oracle provides power, facility integration, networking, orchestration, support, and software. Oracle receives less revenue per megawatt and avoids most of the accelerator depreciation, improving the financing requirement and the capital intensity at the same time.
21. The $75 Billion Envelope
Oracle has disclosed a combined figure for customer prepayments and customer-supplied hardware of approximately $75 billion. The company has not disclosed the split between the 2, and our model treats the mix as an assumption.
That undisclosed split carries more weight than almost any other unknown in this forecast. Moving $10 billion from the prepaid column to the customer-supplied column reduces Oracle's capital expenditure, reduces its depreciation, improves free cash flow, lowers debt, and reduces dilution, all without changing revenue by a single dollar.
Gross margin cannot explain the shareholder outcome here for exactly that reason. Two contracts reporting the same operating margin can produce cash-on-cash returns differing by several multiples, and the difference sits entirely below the line most investors watch. Prepaid capacity improves financing, customer-supplied capacity improves financing and capital intensity together, and the second effect is the one that reaches equity.
Part VI: The Cost of Building the Cloud
22. Ninety Billion Dollars a Year
Oracle's capital expenditure peaks well before the revenue it funds, and the schedule makes the sequencing visible.
Gross capex | FY2027 | FY2028 | FY2029 | FY2030 |
|---|---|---|---|---|
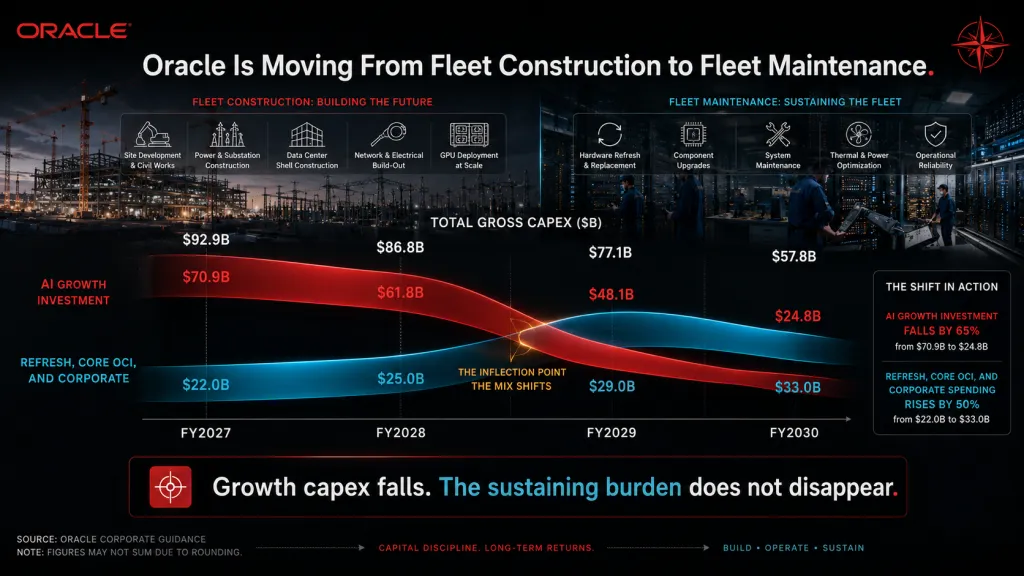
AI growth investment | $70.9B | $61.8B | $48.1B | $24.8B |
Refresh, Core OCI, and corporate | $22.0B | $25.0B | $29.0B | $33.0B |
Total gross capex | $92.9B | $86.8B | $77.1B | $57.8B |
Growth investment falls by 65% across the period while refresh and corporate spending rises by 50%. The composition shift is the more informative half of that table. Oracle transitions from building a fleet to maintaining one, and the maintenance line becomes the dominant capital requirement well before 2030 ends.
Construction in progress traces the same wave from a different angle. The balance runs $40 billion at the end of fiscal 2026, $70 billion in 2027, $90 billion in 2028, then falls to $55 billion and $35 billion across the final 2 years. Capital accumulates on the balance sheet ahead of the largest commissioning wave and releases into productive assets afterward, which is why 2028 and 2029 look so different on a cash basis than on an operating basis.
23. Gross Capex Is Not Oracle Cash
The headline capital expenditure figure overstates what Oracle actually funds.
Capital schedule | FY2027 | FY2028 | FY2029 | FY2030 |
|---|---|---|---|---|
Gross capex | $92.9B | $86.8B | $77.1B | $57.8B |
Customer and manufacturer offsets | $(22.5)B | $(16.0)B | $(13.0)B | $(10.0)B |
Net cash capital outlay | $70.4B | $70.8B | $64.1B | $47.8B |
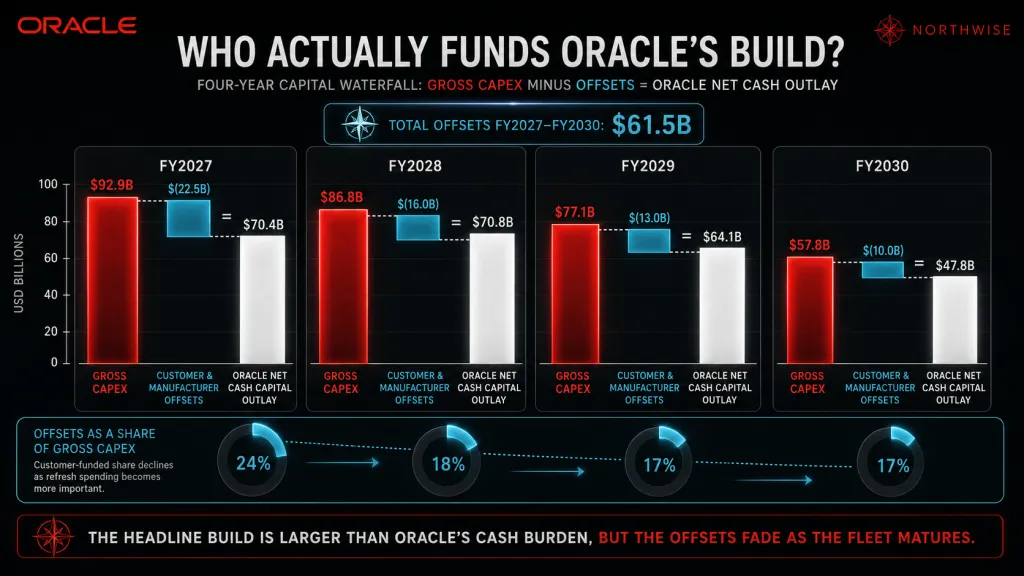
Offsets total $61.5 billion across the 4 years, or roughly 20% of gross capital expenditure. That funding arrives through customer prepayments, customer-supplied equipment, and manufacturer financing arrangements, and it separates a capital plan Oracle can carry from one requiring substantially more external issuance.
The offsets decline steadily as a share of spending. Oracle funds 76% of its own capital expenditure in fiscal 2027 and 83% in fiscal 2030, reflecting a maturing fleet where refresh spending has no customer counterparty to share it.
Set the whole program against the revenue it produces and the scale becomes legible. Oracle spends $314.6 billion of gross capital across the 4 forecast years against $630 billion of cumulative revenue, or $0.50 of capital per revenue dollar. Net of offsets, the figure falls to $0.40. Our CoreWeave forecast produced $1.18 for the same measure, and the gap traces directly to the software business funding a meaningful share of Oracle's build.
24. Accounting Life Is Not Economic Life
Assets begin depreciating when placed into service and not when purchased. That timing difference is why construction in progress, assets commissioned, and annual capital expenditure have to remain separate schedules in any model intending to reconcile.
Depreciation and asset base | FY2027 | FY2028 | FY2029 | FY2030 |
|---|---|---|---|---|
PP&E depreciation | $12.2B | $17.4B | $24.7B | $31.5B |
Ending net PP&E | $180.7B | $250.1B | $302.5B | $328.8B |
Oracle depreciates server and network equipment primarily over 6 years. Our model tests shorter economic lives, since frontier hardware can lose most of its pricing power well before the accounting life ends. Complete obsolescence is the wrong picture of how that happens.
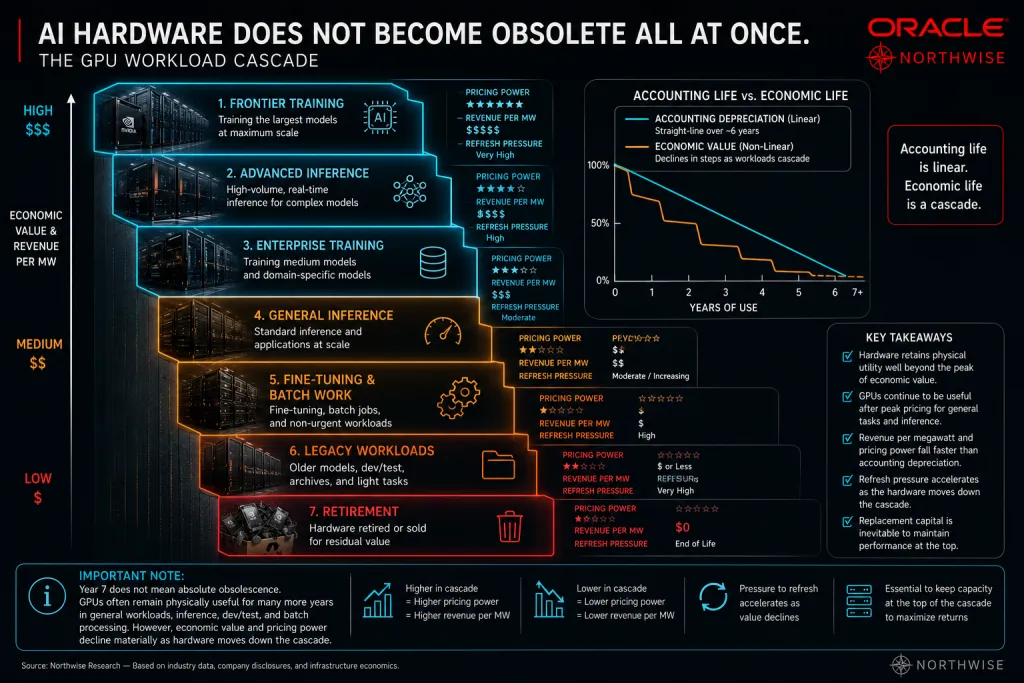
The realistic path is a workload cascade. Hardware moves from frontier training to advanced inference, then to enterprise training, general inference, fine-tuning and batch work, and finally retirement. Each step down the ladder earns less per megawatt, and a fleet that cascades efficiently requires materially less replacement capital than one that does not.
25. The Replacement Reserve and Why Free Cash Flow Misleads
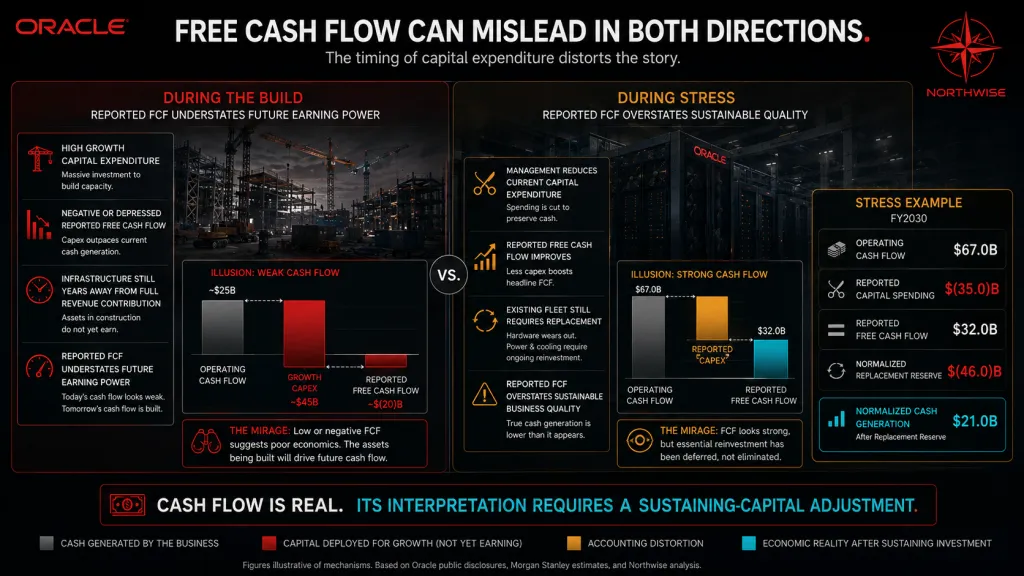
Reported free cash flow tells the truth about cash and misleads about business quality in both directions. The correction is a normalized replacement reserve, which charges what the fleet costs to sustain instead of what management chose to spend in a given year.
Scenario | Normalized sustaining capital |
|---|---|
Stress | $46.0B |
Bear | $42.0B |
Base | $35.5B |
Bull | $38.0B |
The ordering is deliberate and repays a moment of attention. Stress and Bear carry the heaviest replacement burden despite operating smaller fleets, since weaker monetization shortens the economic life of older hardware and forces earlier refresh. Bull sits above Base in absolute dollars while operating the largest fleet of the 4, making it the lowest reserve per megawatt in the distribution.
Apply that reserve against the cash flows and both distortions appear. Stress produces $67.0 billion of operating cash flow, spends $35.0 billion of capital, and reports $32.0 billion of free cash flow. Charge the $46.0 billion reserve and the same year produces $21.0 billion. Base runs the opposite direction, reporting $30.5 billion against $53.0 billion after its $35.5 billion reserve.
During the build, reported free cash flow understates future earning power, since growth capital arrives years ahead of the revenue it funds. In Stress, reported free cash flow overstates business quality, since management has stopped spending on a fleet that still needs replacing. Both errors are large and they point in opposite directions.
Part VII: The Software Fortress
26. The $58.5 Billion That Does Not Depend on Stargate
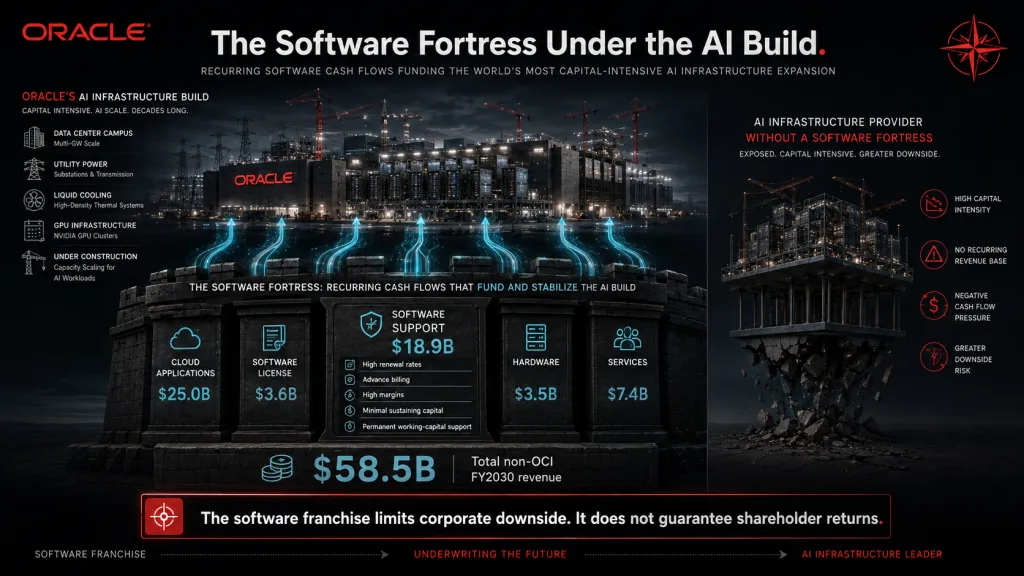
Strip every AI megawatt out of the 2030 forecast and Oracle still operates a large, profitable, capital-light software company.
Segment | FY2030 revenue |
|---|---|
Cloud Applications | $25.0B |
Software license | $3.6B |
Software support | $18.9B |
Hardware | $3.5B |
Services | $7.4B |
Total non-OCI | $58.5B |
Applications remain the second growth engine across Fusion, NetSuite, Oracle Health, and enterprise AI attachment. That growth runs well below OCI and consumes a small fraction of the capital, making Applications the highest-quality revenue in the company on a return basis even as it becomes a smaller share of the total.
License revenue declines from $4.7 billion to $3.6 billion as customers migrate toward subscription deployment. Franchise collapse would look very different from that. Support renewals, database demand, enterprise integration, and Applications growth all continue through the license decline, matching the pattern every large enterprise software transition has produced.
27. Support Is the Funding Base
Software support generated $19.8 billion in fiscal 2026 and settles near $18.9 billion by 2030. The revenue arrives with advance billing, high renewal rates, and operating margins requiring almost no incremental capital to sustain.
That combination is what allows Oracle to fund an infrastructure build of this size without a financing structure resembling its independent competitors. Support cash arrives before the expense it covers, functioning as a permanent working capital float across the build years.
The line runs nearly flat and is easy to overlook for that reason. A steady $19 billion of high-margin, prepaid, recurring revenue sitting alongside a $90 billion annual capital program is the most important stabilizing feature on Oracle's income statement.
28. Why Oracle's Downside Differs
Compare the downside structurally against a dedicated AI infrastructure provider and the difference reduces to a set of options.
Oracle can slow optional capital expenditure, draw on software cash flow, shift the contract mix toward customer-supplied hardware, cross-sell database and applications into the installed base, and monetize the same infrastructure through several layers at once. An independent provider carrying comparable leverage against comparable leases has one lever, which is filling capacity at whatever price clears.
The result stays severe at the share level without becoming existential at the corporate level. Our Stress Case produces $170.1 billion of revenue, $56.5 billion of non-GAAP operating income, and $32.0 billion of reported free cash flow. It also produces $175 billion of funded debt, 3.78 billion diluted shares, and a poor outcome for anyone who owned the stock beforehand.
Part VIII: From Revenue to Earnings
29. The OCI Margin Ramp
Oracle's cloud segment margin expands by 13.5 points across the forecast, and the shape of that expansion explains most of the near-term earnings pressure.
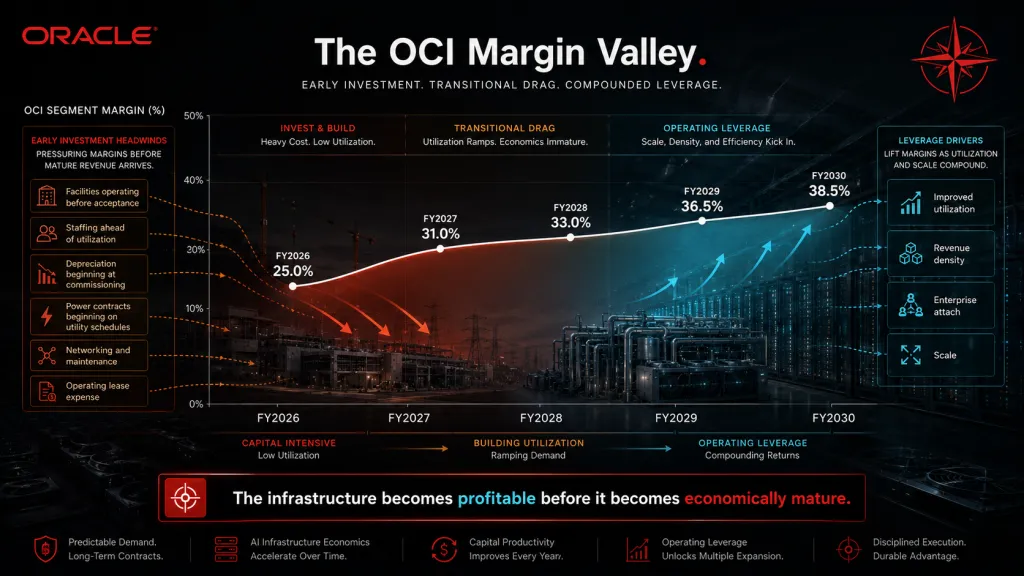
OCI segment margin | FY2026 | FY2027 | FY2028 | FY2029 | FY2030 |
|---|---|---|---|---|---|
Margin | 25.0% | 31.0% | 33.0% | 36.5% | 38.5% |
The early years carry costs arriving ahead of revenue. Facilities incur expense before customer acceptance, staffing precedes utilization, depreciation begins at commissioning, and power contracts start on the utility's schedule and not the customer's. Every one of those items lands in the segment before the contract it supports reaches mature billing.
These margins already include power, data-center expense, networking, operations, hardware maintenance, ordinary depreciation, and operating lease expense. Depreciation is therefore not deducted a second time below operating income, and any comparison against a peer reporting on a different basis needs that adjustment made first.
30. The Operating-Income Bridge
The Management Execution schedule carries the full income statement. GAAP figures follow standard accounting rules, and non-GAAP figures exclude acquired-intangible amortization, stock-based compensation, and restructuring.
Operating result | FY2027 | FY2028 | FY2029 | FY2030 |
|---|---|---|---|---|
Revenue | $90.0B | $130.0B | $185.0B | $225.0B |
Total segment profit | $46.8B | $61.4B | $84.8B | $103.3B |
Non-GAAP operating income | $36.9B | $50.2B | $72.0B | $88.8B |
Non-GAAP operating margin | 41.0% | 38.6% | 38.9% | 39.5% |
GAAP operating income | $30.1B | $43.1B | $64.3B | $80.4B |
GAAP EPS | $6.13 | $8.59 | $13.26 | $17.03 |
Non-GAAP EPS | $7.93 | $10.39 | $15.12 | $19.02 |
Non-GAAP operating margin compresses from 42.9% in fiscal 2026 to 38.6% in 2028 before recovering to 39.5%, while revenue grows 2.5 times. Mix produces that shape. A growing share of company revenue now comes from infrastructure carrying software-like pricing on some layers and utility-like economics on others.
Ordinary infrastructure depreciation stays inside operating costs in both the GAAP and non-GAAP measures. That treatment keeps this model comparable to the framework we applied to CoreWeave and prevents the most consequential cost in the business from being added back twice.
31. The Revenue Target Is More Credible Than the EPS Target
Our locked model broadly supports management's fiscal 2030 revenue target of $225 billion. It does not reach the associated $21 of non-GAAP earnings per share, arriving instead at $19.02 on the Management Execution schedule and $18.92 in the independent Base Case.
The gap sits almost entirely in the capital structure. Hold the diluted share count at the fiscal 2026 level of 2.91 billion and the same $64.1 billion of non-GAAP net income produces $22.03 per share, so dilution alone accounts for roughly $3.00 of the difference.
Interest does the rest. Fiscal 2030 interest expense of $9.1 billion costs approximately $2.13 per share after tax across 3.37 billion shares. Neither item requires an operating disappointment, and neither is visible in a revenue target.
Part IX: The Financing Stack
32. The Forty-Billion-Dollar Funding Year
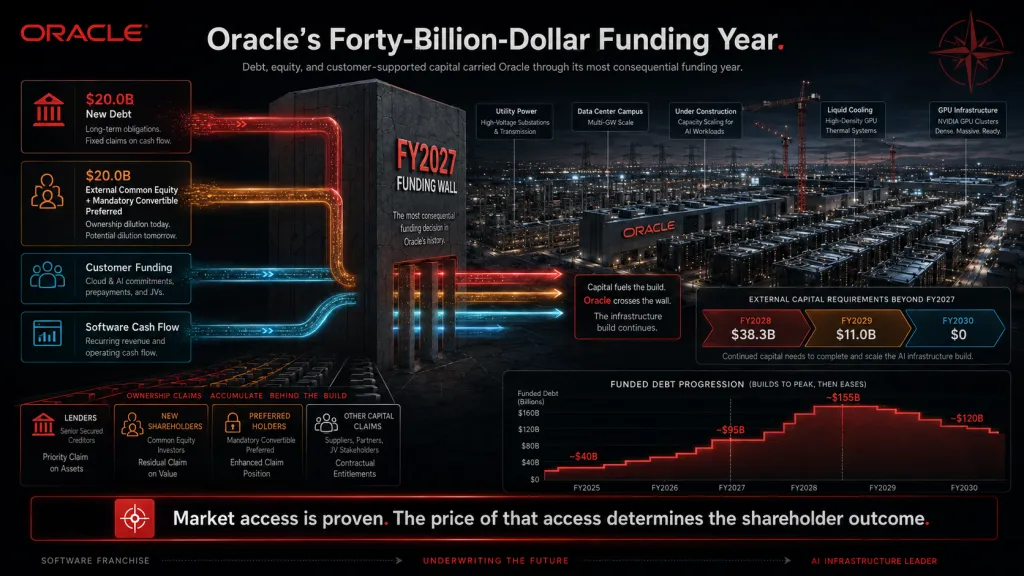
Fiscal 2027 is the year the capital structure changes most.
Financing | FY2027 | FY2028 | FY2029 | FY2030 |
|---|---|---|---|---|
New debt | $20.0B | $21.3B | $7.0B | $0 |
External common equity | $20.0B | $17.0B | $4.0B | $0 |
Ending funded debt | $142.3B | $153.5B | $155.0B | $127.7B |
Ending cash | $22.2B | $19.9B | $19.6B | $24.4B |
Interest expense | $6.7B | $8.6B | $9.6B | $9.1B |
Oracle raises $40.0 billion of external capital in fiscal 2027 across debt, equity, and mandatory convertible preferred, followed by $38.3 billion in 2028 and $11.0 billion in 2029. Market access is proven at this point, since Oracle has already executed large debt and equity transactions into a market that understands the story.
The price of that access remains the open question. Debt peaks near $155 billion in fiscal 2029 and falls to $127.7 billion by 2030 as free cash flow inflects, and the terms attached to the 2027 and 2028 raises determine how much of the eventual recovery reaches common shareholders.
33. The Lease Commitment Is Larger Than the Debt
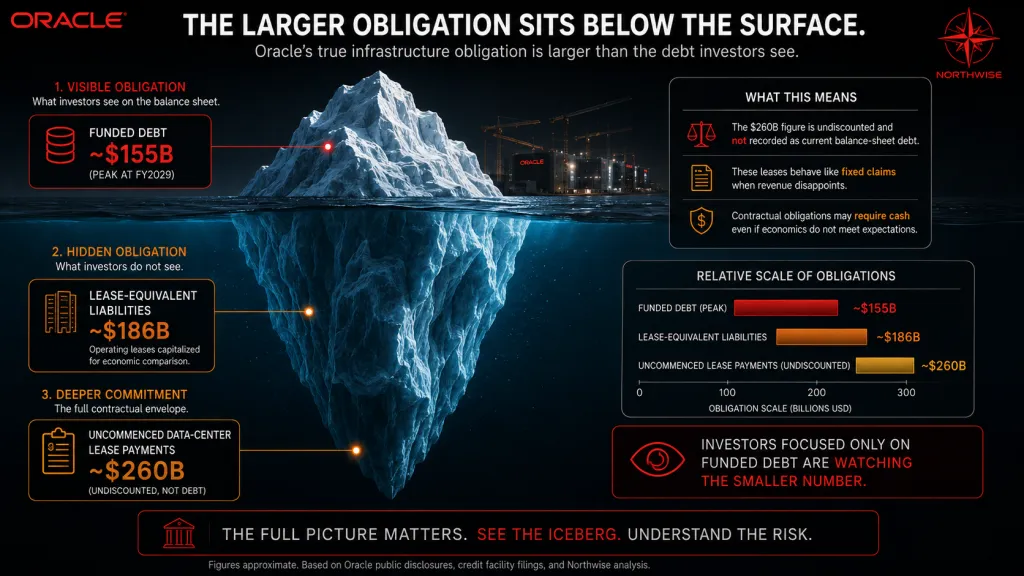
Oracle carries approximately $260 billion of uncommenced data-center lease payments alongside its funded debt. The figure is undiscounted, it is not current debt, and it does not appear on the balance sheet in that form.
It behaves much like debt in every scenario where revenue disappoints. Lease-equivalent liabilities in our model reach $186 billion by fiscal 2029 against $155 billion of funded debt in the same year, making leases the larger of the 2 obligations for most of the forecast.
Investors focused on the debt figure alone are watching the smaller number.
34. Prepayments Are Financing, Not Earnings
Customer cash follows a predictable cycle in this business. Cash arrives, deferred revenue rises, Oracle builds the capacity, revenue is recognized, and deferred revenue unwinds.
Treating the initial inflow as permanent free cash flow and the later unwind as an unexpected working capital loss misreads both periods. The inflow was financing, and the unwind is the accounting catching up to a transaction that was always going to end this way.
Our model classifies prepayments as a funding source throughout and never as earnings. That treatment makes fiscal 2027 and 2028 look worse on a cash basis than a simpler model would show, and it makes 2030 look considerably more honest.
35. The Interest Feedback Loop and the Denominator Problem
The mechanism separating Bear from Base runs in a circle, and the circularity is the point. Lower revenue density produces lower operating cash flow, which requires more external financing, which arrives on worse terms, which lowers earnings per share, which raises the cost of the next round of financing.
Nothing in that loop requires a mistake. It requires ordinary competitive pressure arriving on an ordinary timetable, which is what makes Bear the scenario most worth studying in this sector.
The share count carries the visible half of the damage.
Share count | FY2026 | FY2027 | FY2028 | FY2029 | FY2030 |
|---|---|---|---|---|---|
Ending basic shares | 2.88B | 3.072B | 3.222B | 3.308B | 3.342B |
Diluted weighted-average shares | 2.91B | 3.026B | 3.195B | 3.308B | 3.370B |
Diluted shares rise 15.8% across the forecast on the Management Execution path and 30% in Stress. The sources are external equity issuance of 290 million shares, employee awards of 143 million, and a 29 million share preferred conversion in fiscal 2029. Our model assumes no meaningful discretionary buybacks during the heavy investment phase, a departure from more than a decade of Oracle capital allocation behavior.
36. The Business Can Win and the Share Can Lose
Oracle can deliver the contracts, grow revenue by a factor of 3, expand cloud margins by 13 points, generate positive free cash flow, and remain one of the most strategically important infrastructure providers in enterprise technology. Existing shareholders can still receive disappointing returns from all of it.
The mechanism is straightforward. Lenders, lessors, equipment financiers, preferred holders, and new common shareholders all funded the build, and all of them are paid before the residual claimant, which is the common shareholder who owns whatever is left.
Bear demonstrates the arithmetic directly: $195.0 billion of revenue, $70.6 billion of non-GAAP operating income, $30.5 billion of free cash flow, and $13.40 of earnings per share against $155 billion of debt and 3.55 billion shares. That outcome describes a company succeeding while the capital structure takes most of the proceeds, and it is the same residual-claim problem our CoreWeave forecast examined in a business carrying far less downside protection.
Part X: The Three Clocks
37. Delivery, Hardware, and Financing
Three clocks run simultaneously through this forecast, and the equity outcome depends on the order in which they finish.
The delivery clock asks whether physical capacity arrives before contractual recognition is delayed. Its indicators are energization, customer delivery, billing readiness, acceptance, and annual average billable capacity. This clock is the easiest to monitor and the furthest along.
The hardware clock asks whether each generation retains useful economics long enough to recover its capital. Its indicators are performance per megawatt, second-contract pricing, workload migration down the cascade, and actual replacement requirements against the accounting schedule. Nothing in Oracle's reported results will answer that question before 2028.
The financing clock asks whether operating cash matures before external capital becomes punitive. Its indicators are net cash capital outlay, interest expense, funded debt, equity issuance, and the diluted share count. This clock runs fastest and depends most on conditions Oracle does not control.
Value is created when capacity arrives, revenue reaches mature density, cash generation inflects, and debt begins falling. Value is destroyed when the fixed obligations mature before the operating economics do. Everything between those 2 sentences is the distribution this report is built to describe.
Part XI: What Moves the Model
38. The Four Levers
Revenue density leads by a wide margin. Every additional $1 million of realized revenue per megawatt across 7.45 GW of Base billable capacity represents approximately $7.45 billion of annual AI revenue, and the $2.5 million gap between Base and Bear density is worth more to the outcome than any construction assumption in the model.
Margin capture ranks second and depends on hardware funding, power cost, software attach, customer pricing, utilization, and depreciation together. Every percentage point of fiscal 2030 OCI margin changes Base segment profit by approximately $1.7 billion.
Financing terms rank third and compound over time. Every $1 billion of additional pre-tax interest reduces after-tax common earnings by approximately $800 million, and equity issued at weak prices requires more shares per dollar raised, which turns a temporary valuation problem into a permanent ownership problem.
Replacement capital ranks fourth and is the least visible. Every $5 billion increase in normalized sustaining capital reduces normalized free cash flow by the same $5 billion. Fiscal 2030 accounting depreciation of $31.5 billion sits below our $35.5 billion Base reserve, which means the income statement understates the economic replacement burden even at the end of the forecast.
39. The Metrics We Will Track
Each variable in the model has an observable proxy that will appear in Oracle's reported results before the outcome is settled.
Metric | What it tests |
|---|---|
Customer-delivered MW | Physical execution |
Average billable MW | Commercial timing |
AI revenue per MW | Economic capture |
OCI segment margin | Contract profitability |
Customer-funded hardware | Capital efficiency |
Construction in progress | Build timing |
Net cash capital outlay | Funding need |
Interest expense | Credit burden |
Diluted shares | Shareholder retention |
Replacement capital | Sustainable free cash flow |
The first 2 rows resolve by fiscal 2028 and the middle rows by 2029. The last row will not resolve inside the forecast period at all, which is worth remembering when the early results look encouraging.
Part XII: Four Versions of the Same Company
40. Stress: The Spend Brake
Stress assumes slower revenue recognition, weaker density at $13.5 million per megawatt, expensive financing, a higher share of Oracle-owned hardware, and dilution to 3.78 billion shares.
Management responds rationally to that environment. Oracle finishes near-term contracted projects, stops optional phases, favors customer-supplied hardware on new business, reduces new equipment purchases, and protects cash flow. Gross capital expenditure falls to $35.0 billion, well below the $46.0 billion normalized replacement reserve for a fleet of that size.
The company remains independent, profitable, and large, with $170.1 billion of revenue, $56.5 billion of non-GAAP operating income, and $32.0 billion of reported free cash flow. The equity remains weak, since $175 billion of debt, 3.78 billion shares, and $13.8 billion of annual interest had already been committed before the weaker economics became visible.
Stress is not bankruptcy and not an acquisition. It describes a successful company that spent too much on terms that were too expensive.
41. Bear: The Cloud Works and the Shareholder Does Not
Bear delivers 8.0 GW of exit capacity, $195.0 billion of revenue, a 33.5% OCI margin, $13.40 of earnings per share, and $30.5 billion of free cash flow. Judged as a business, that is an excellent result. Judged as an investment from the current price, it is not.
Bear requires no scandal, no downturn, and no execution failure. It requires competitors to arrive with capacity on schedule, customers to negotiate the way sophisticated buyers negotiate, and Oracle to fund a build of this size at ordinary rather than favorable terms.
Every one of those conditions is more likely than not in isolation, which is what earns Bear its weight in the probability ledger.
42. Base: Density Does the Work
Base reaches 8.6 GW of delivered capacity, 7.45 GW of average billable capacity, $18.0 million of AI revenue per billable megawatt, $225.6 billion of total revenue, a 38.0% OCI margin, and $18.92 of earnings per share against $130 billion of funded debt.
The case broadly achieves management's revenue target while falling short of management's earnings target, and the entire shortfall comes from financing and dilution. Base assumes Oracle executes the operating plan and pays a normal price for the capital that funds it.
Density carries the weight. Base runs $2.5 million per megawatt above Bear and $2.5 million below Bull, and that single input moves the outcome more than any other assumption in the model.
43. Bull: Intelligence Density Becomes the Product
Bull requires Oracle to capture more of the hardware improvement through database integration, enterprise inference, security, storage, networking, and software attach. Capacity reaches 9.3 GW, only 8% above Base.
Revenue reaches $263.1 billion, OCI margin reaches 42.0%, earnings per share reaches $25.93, and funded debt falls to $95 billion. A modest capacity difference produces an enormous economic difference, which is the argument of Part IV expressed as an outcome.
Bull is the scenario where Oracle's structural advantage over independent providers becomes visible in the numbers instead of remaining a strategic argument.
44. The Complete ORCL Stock Forecast 2030 Model
The full operating model across all 4 scenarios sits below.
Metric | Stress | Bear | Base | Bull |
|---|---|---|---|---|
Exit delivered capacity | 7.4 GW | 8.0 GW | 8.6 GW | 9.3 GW |
Average billable AI capacity | 6.30 GW | 6.90 GW | 7.45 GW | 8.10 GW |
AI revenue density | $13.5M/MW | $15.5M/MW | $18.0M/MW | $20.5M/MW |
Total OCI revenue | $114.1B | $137.5B | $166.6B | $201.1B |
Total revenue | $170.1B | $195.0B | $225.6B | $263.1B |
OCI margin | 29.0% | 33.5% | 38.0% | 42.0% |
Non-GAAP operating income | $56.5B | $70.6B | $88.6B | $111.4B |
Non-GAAP EPS | $9.04 | $13.40 | $18.92 | $25.93 |
GAAP EPS | $6.03 | $10.99 | $16.84 | $23.76 |
Operating cash flow | $67.0B | $75.5B | $88.5B | $107.5B |
Gross capex | $35.0B | $45.0B | $58.0B | $70.0B |
Reported free cash flow | $32.0B | $30.5B | $30.5B | $37.5B |
Normalized sustaining capital | $46.0B | $42.0B | $35.5B | $38.0B |
Funded debt | $175B | $155B | $130B | $95B |
Interest expense | $13.8B | $11.6B | $9.2B | $7.2B |
Diluted shares | 3.78B | 3.55B | 3.38B | 3.23B |
Read the first row against the eighth. Exit capacity varies by 26% from Stress to Bull, and earnings per share varies by 187% in the same direction. A model concentrating its uncertainty in construction schedules would produce a much narrower and considerably less honest distribution.
45. The Same Model per Megawatt
Dividing the key results by average billable capacity strips out scale and shows the quality of each outcome directly.
Per billable megawatt | Stress | Bear | Base | Bull |
|---|---|---|---|---|
AI revenue | $13.50M | $15.51M | $18.00M | $20.51M |
OCI segment profit | $5.25M | $6.68M | $8.50M | $10.43M |
Funded debt | $27.78M | $22.46M | $17.45M | $11.73M |
Replacement capital | $7.30M | $6.09M | $4.77M | $4.69M |
Normalized free cash flow | $3.33M | $4.86M | $7.11M | $8.58M |
Revenue per megawatt varies by 52% across the distribution. Normalized free cash flow per megawatt varies by 158%, and funded debt per megawatt varies by 137% in the opposite direction. The top rows describe the operating story and the bottom rows decide the shareholder outcome.
The segment profit line includes Core OCI revenue in the numerator, adding roughly $0.5 million per megawatt across the cases. The normalized free cash flow line charges operating cash flow with the sustaining reserve and excludes financing flows, which makes it a comparison of asset quality and not a distributable cash figure.
46. What Has to Be True
Each scenario reduces to conditions that can be checked against reported results.
Base requires 4 things to hold together. Average billable capacity has to reach roughly 7.45 GW, which is a construction and commissioning test more than a demand test. Realized density has to climb to $18.0 million per megawatt, which asks software and service attach to outpace pricing compression. OCI margin has to reach 38%, and diluted shares have to stay near 3.38 billion against $130 billion of funded debt.
Bear requires only the first condition. The physical build works, capacity arrives close to schedule, contracts convert, and density stalls near $15.5 million while the share count runs to 3.55 billion and debt holds at $155 billion.
Bull requires all 4 Base conditions plus 2 more. Density has to reach $20.5 million, which means the enterprise attach argument converts into genuine pricing power. And financing has to stay cheap enough for debt to fall to $95 billion, which requires the free cash flow inflection to arrive on schedule instead of a year late.
47. What Oracle Reported and What We Reconstructed
The model grows softer as it moves further from the filings, and readers deserve to know exactly where that boundary sits.
Input | Source classification |
|---|---|
FY2026 revenue, OCI, RPO, debt, capex | Company reported |
FY2027 revenue guidance | Company guidance |
Capacity delivery schedule | Northwise reconstruction |
Revenue density | Northwise assumption |
Funding mix between prepaid and customer-supplied | Northwise assumption |
Replacement capital | Northwise construct |
Scenario probabilities | Northwise evidence ledger |
Terminal valuation | Northwise model |
Oracle does not disclose the split between customer prepayments and customer-supplied hardware, customer-level backlog, site-level capital expenditure, second-contract pricing, hardware residual values, or the lag between commissioning and billing. Those are precisely the variables determining per-share returns, which forces indirect estimation of the items carrying the most weight.
A reader who wants to attack this model should start with revenue density and the normalized replacement reserve. Those 2 inputs carry more of the outcome than any other pair, and neither has a company-reported figure to check against.
Continue With Northwise Premium
The operating model is now complete, and everything to this point traces back to contracts, megawatts, revenue density, margins, capital requirements, and financing that a careful reader can verify or dispute.
Oracle can reach 2030 as a highly leveraged cloud forced to protect cash, a successful platform whose returns are diluted by the capital structure, a software-backed hyperscaler beginning to deleverage, or one of the most valuable enterprise AI platforms in the market. All 4 outcomes begin from demand that already exists and infrastructure already under construction. They diverge through economic capture, funding terms, depreciation, replacement capital, debt, and dilution.
What follows is judgment, and it answers the only question that reaches a shareholder. What is each outcome worth per share, how likely is each one, and what price today compensates an investor for owning the complete distribution?
Northwise Premium continues with the 4 valuation methods, the scenario-specific multiples, the evidence-based probability ledger, December 2030 price targets for all 4 outcomes, the enterprise-value-to-shareholder waterfall, present-value cross-checks, entry zones, rating thresholds, and the sensitivities that move the target most.
Northwise Premium
Choose how to continue with Northwise
Join Northwise Premium
Unlock the rest of this report, its complete valuation, the downloadable model, portfolios, and action framework.
Join Northwise PremiumCreate a Free Account
Continue across Free Northwise research, follow companies, save reports, and receive updates.
Create a Free Account
HOOD Stock Forecast: Can Robinhood Keep the Wealth?
Our Robinhood (HOOD) stock forecast examines earnings, customer wealth, valuation and growth through 2030. Read the report and explore the complete workbook.
AMD Revenue per Gigawatt: What the Hardware Is Worth
How much revenue can AMD earn per gigawatt? We examine GPU pricing, EPYC, Helios component content, delivery costs and the assumptions in our financial model.

AMZN Stock Forecast 2030: The $1.6 Trillion Test
Our AMZN stock forecast models AWS, advertising, Leo and Zoox through 2030, including Amazon’s $1.6 trillion capital program, financing and valuation.
Northwise Portfolios
See how the research becomes real decisions
Reader discussion
Discuss the research
Premium access is required to join this report's discussion.
Join Northwise Premium
No comments yet. Start a thoughtful discussion.