
Nu stock Forecast 2030

NU stock forecast 2030: Nubank’s updated model weighs Q1 earnings, Mexico break-even, AI underwriting, credit risk, and upside.
In this article
A refreshed NU Stock Forecast 2030 weighing Nubank’s Q1 2026 earnings, Mexico break-even, AI underwriting, credit risk, and valuation pressure.
1. Executive Summary
1.1 The Updated NU Thesis
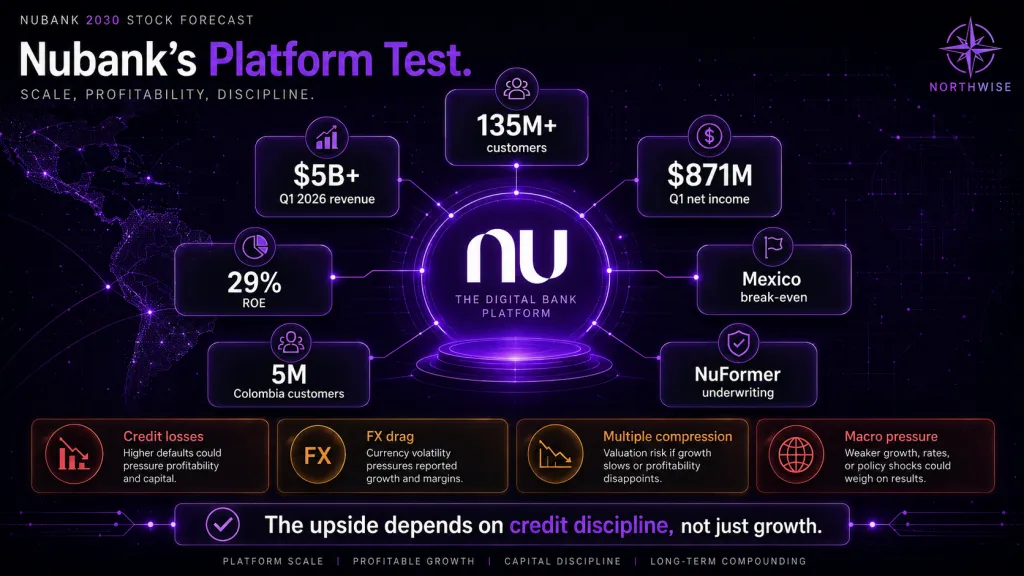
Nubank has outgrown the label that defined it for most of its public life. The company that listed as a Brazilian neobank now operates as a scaled Latin American financial platform spanning credit cards, deposits, personal and secured lending, payroll products, insurance, wealth, SME credit, payments, and AI-enabled financial advice. As of the first quarter of 2026, it served more than 135M customers across Brazil, Mexico, and Colombia.
The old debate centered on whether a digital bank could become profitable at scale. That question has been answered. FY2025 net income reached $2.9B, and Q1 2026 net income reached $871M. The business is no longer forecasting profitability. It is producing it.
The updated debate is harder and more useful. It asks whether a profitable, high-return, AI-enabled banking platform can keep compounding earnings while expanding credit into a less forgiving macro environment, without giving back the underwriting discipline that made the model attractive in the first place.
1.2 What Has Changed Since the Prior Forecast
Our original Nubank 2030 forecast was broadly right on structure. Customers and ARPAC drive revenue, margins convert revenue into earnings, and share count converts earnings into per-share value. The architecture held. Several of the inputs did not.
FY2025 closed with $16.3B in revenue, close to the prior model's starting point. Q1 2026 then printed revenue above $5B for the first time, lifting the forward run-rate above $20B before any further growth. ARPAC reached about $16. Mexico reached break-even far earlier than the prior model assumed. Colombia crossed 5M customers and more than COP 10T in deposits. NuFormer and AI underwriting moved from narrative into production decisioning.
The risk side moved at the same time. The credit portfolio reached $37.2B, the loan-to-deposit ratio rose to 58.3%, the 15 to 90 day non-performing loan ratio increased to 5.0%, and credit-loss allowances rose 33% quarter over quarter. The forecast has earned a higher-quality base. It has also earned a more demanding stress test.
1.3 Why the Market Is Still Applying a Brazil Discount
NU trades near $13.18, toward the low end of its recent range, against a business generating high-twenties to low-thirties return on equity. The gap between operating quality and market price is wide enough to require an explanation rather than a celebration.
Part of that gap is structural. Nubank reports in U.S. dollars while earning almost entirely in Brazilian reais, Mexican pesos, and Colombian pesos. Local-currency compounding can be strong while reported dollar earnings are pressured. Part of it is credit. The loan book is expanding into a softer macro backdrop, and investors are watching whether early delinquency trends normalize or persist. Part of it is simply that the market has been reluctant to pay platform-like multiples for emerging-market financial earnings.
None of those reasons require the business to be broken. They require the model to treat credit, currency, and multiple risk as live variables rather than rounding errors.
1.4 What the Free Section Covers
This report builds the case from the operating side outward before it reaches any judgment on value. The free section covers the business as it exists today, the updated financial base, the three core markets, the role of AI in underwriting, U.S. optionality, competitive positioning, the macro and currency framework, and a full discussion of risk and sensitivity. It is meant to leave a serious reader able to evaluate the business on its merits.
1.5 What the Premium Section Covers
The premium section reverses direction and works back from the shareholder. It contains the full 2030 model, the scenario range, the valuation framework, the present value work, the price zones we act on, and where Northwise stands today. The operating case explains why the business deserves attention. The valuation work determines whether the stock deserves capital.
Table of Contents
1. Executive Summary
1.1 The Updated NU Thesis
1.2 What Has Changed Since the Prior Forecast
1.3 Why the Market Is Still Applying a Brazil Discount
1.4 What the Free Section Covers
1.5 What the Premium Section Covers
2. Nubank Today: From Neobank to Scaled Financial Platform
2.1 The Company Nubank Has Become
2.2 The 2025 to 2026 Inflection
2.3 The Shift From Customer Growth to Relationship Depth
2.4 Why ARPAC Is Now the Core Variable
2.5 The Managerial P&L and the New Disclosure Framework
3. The Updated Financial Base
3.1 FY2025 Results
3.2 Q4 2025 Results
3.3 Q1 2026 Results
3.4 Revenue, NII, Gross Profit, and Net Income
3.5 ROE, Efficiency Ratio, Cost to Serve, and Operating Leverage
3.6 Deposits, Credit Portfolio, and Funding Base
3.7 What the New Base Year Changes in the Model
4. Brazil: The Earnings Engine
4.1 Brazil’s Role in the Nubank Model
4.2 Customer Penetration and Activity
4.3 ARPAC Expansion in a Mature Customer Base
4.4 Credit, Secured Lending, Payroll Products, and Product Density
4.5 Why Brazil Is No Longer Just a Growth Market
4.6 The Brazil Profit Pool and Nubank’s Remaining Share Opportunity
5. Mexico: The Model’s Biggest Positive Revision
5.1 Why the Old Mexico Assumption Was Too Conservative
5.2 15M Customers and Third-Largest Financial Institution Status
5.3 Break-Even in Q1 2026
5.4 ARPAC Nearly Doubling and Efficiency Improving by 78 Percentage Points
5.5 Mexico’s Banking License Path
5.6 Why Mexico Can Become Nubank’s Second Earnings Engine
5.7 The Macro Risk in Mexico
6. Colombia: Earlier, Smaller, but No Longer a Footnote
6.1 5M Customers and 15% Adult Penetration
6.2 COP 10T in Deposits
6.3 Nearly 1M First Credit Card Customers
6.4 Colombia’s 2026 Investment Plan
6.5 Why Colombia Supports the Replicability Argument
6.6 Why Colombia Should Remain a Modest Contributor in the Model
7. NuFormer, AI, and Credit Underwriting
7.1 Why AI Belongs in the Operating Model
7.2 NuFormer in Credit Card Decisioning
7.3 AI Private Banker and 15M Monthly Active Users
7.4 Real-Time Personal Loan Pricing by Predicted NPV
7.5 Engineering Throughput, Testing Cycles, and Internal AI Productivity
7.6 The Difference Between AI Narrative and AI-Driven Credit Expansion
7.7 What Still Needs to Be Proven Through a Credit Cycle
8. U.S. Optionality
8.1 OCC Conditional Approval
8.2 FDIC and Federal Reserve Approvals Still Pending
8.3 Why the U.S. Is Not in Base EPS
8.4 Cost Drag in 2026 and 2027
8.5 Why U.S. Optionality Is a Valuation Overlay, Not the Core Thesis
9. Competitive Positioning
9.1 Nubank Versus Incumbent Banks
9.2 Nubank Versus Mercado Libre
9.3 Nubank Versus Other Digital Banks
9.4 Where Nubank Competes
9.5 Where Nubank Intentionally Does Not Compete
9.6 Why Focus Matters for Operating Leverage
10. Macro and FX Framework
10.1 Brazil Rates and Inflation
10.2 Mexico Growth and Rate Environment
10.3 Colombia Inflation, Rates, and Political Risk
10.4 Why Local-Currency Compounding Can Still Disappoint USD Investors
10.5 How FX Should Be Treated in the Model
11. Risks and Pressure Testing
11.1 The Real Bear Case
11.2 Credit Risk and the Expanding Loan Book
11.3 NPLs, Allowances, and Risk-Adjusted NIM
11.4 Multiple Compression
11.5 EPS Haircut Scenarios
11.6 Credit-Loss Shock Scenario
11.7 FX Drag Scenario
11.8 Mexico Optimism Stress Test
11.9 U.S. Execution Risk
11.10 What Would Break the NU Thesis
11.11 What Would Strengthen the NU Thesis
12. Full 2030 Forecast Model
12.1 Model Architecture
12.2 Base-Year Inputs
12.3 Customer and ARPAC Assumptions
12.4 Revenue Build by Year
12.5 Margin and Net Income Assumptions
12.6 Share Count and EPS Construction
12.7 Bear Case Model
12.8 Base Case Model
12.9 Bull Case Model
12.10 Scenario Probability Weighting
13. Valuation Framework
13.1 Why EPS Is the Bridge Between Operations and Valuation
13.2 Bear Case Multiple
13.3 Base Case Multiple
13.4 Bull Case Multiple
13.5 Probability-Weighted 2030 Value
13.6 U.S. Optionality Overlay
13.7 Present Value Framework
13.8 Why the 2030 Value Is Not Current Fair Value
14. Actionable Zones and Portfolio Discipline
14.1 Strong Buy Zone
14.2 Accumulate Zone
14.3 Buy and Hold Zone
14.4 Hold and Monitor Zone
14.5 Trim Zones
14.6 Sell Discipline and Re-underwriting
14.7 Why Selling Should Not Wait for the 2030 Bull Case
15. Northwise View
15.1 Current Positioning
15.2 Why We Currently Hold Shares
15.3 What We Need to See Next
15.4 What Would Cause Us to Reduce Conviction
15.5 Final Assessment
2. Nubank Today: From Neobank to Scaled Financial Platform
2.1 The Company Nubank Has Become
Nubank began as a no-fee credit card challenger in Brazil. It has since expanded into a multi-product financial platform that touches most parts of a customer's financial life: credit cards, deposit accounts, personal loans, secured and payroll lending, SME credit, insurance, wealth and investment products, payments, marketplace functionality, and AI-enabled advice.
By Q1 2026 the company served more than 135M customers across three countries. It is the largest private financial institution in Brazil by customers, the third-largest financial institution in Mexico by customers, and has reached 5M customers in Colombia. This is a scaled financial institution rather than a fintech application with growth potential.
The practical consequence for analysis is a shift in what to measure. At this size, adoption is no longer the central question. Monetization, asset quality, funding, and cross-market replication are.
2.2 The 2025 to 2026 Inflection
The refresh is driven by reported results, not by narrative drift. FY2025 produced $16.3B in revenue and $2.9B in net income. Q4 2025 produced $4.9B in revenue and $894.8M in net income at a 33% return on equity. Q1 2026 then crossed $5B in quarterly revenue for the first time, with $871M in net income and a 29% return on equity even as credit-loss provisioning rose.
A quarterly revenue run-rate above $20B, combined with Mexico's early profitability, requires a higher forward trajectory than the prior model carried. The base year did not move much. The slope did.
2.3 The Shift From Customer Growth to Relationship Depth
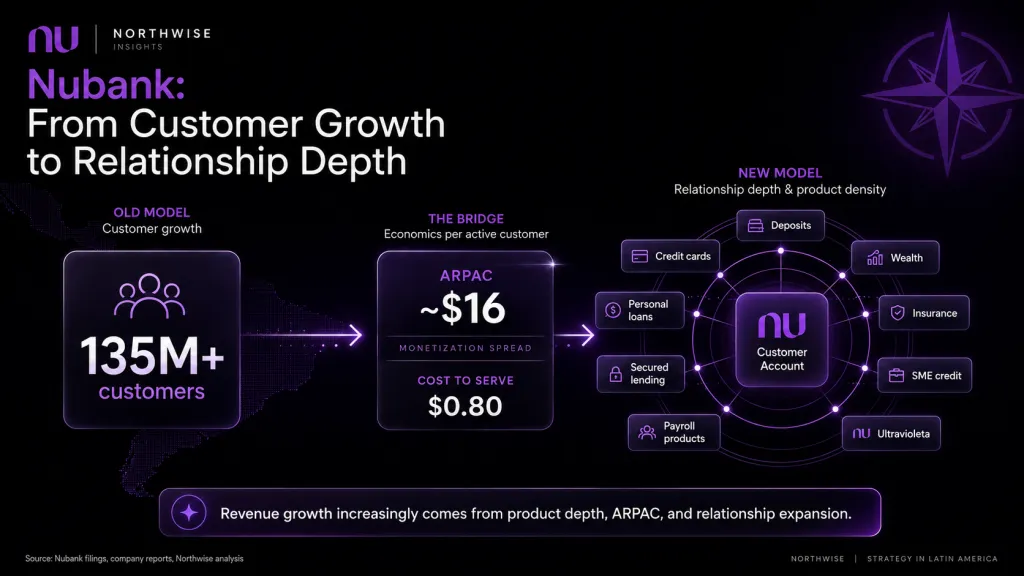
Nubank added 17M customers in FY2025 and roughly 4M more in Q1 2026. Customer count is still rising, but Brazil is now deeply penetrated, with more than 115M customers and close to 100M active. The consolidated monthly activity rate held at 83%.
The center of gravity has moved from how many customers Nubank can add to how much financial life it can consolidate per active customer. ARPAC reached $15 in Q4 2025 and about $16 in Q1 2026, against a cost to serve of $0.80 per active customer. That spread between revenue per customer and cost to serve is the engine of operating leverage.
2.4 Why ARPAC Is Now the Core Variable
ARPAC reflects product density, primacy, credit usage, deposit balances, insurance, wealth, secured and payroll lending, and capture of higher-income customers. The original model already treated it as the center of the framework, and reported consolidated ARPAC is now running ahead of that earlier trajectory.
Brazil ARPAC should continue to rise through deeper credit usage, secured and payroll lending, Ultravioleta, insurance, investments, SME products, and household-level consolidation. Mexico ARPAC has nearly doubled according to management. Colombia ARPAC sits lower today and should rise as deposits, credit cards, personal loans, and CDTs mature. ARPAC is the variable that turns a customer-count story into an earnings-compounding story.
2.5 The Managerial P&L and the New Disclosure Framework
Nubank introduced a Managerial P&L in Q4 2025 to better explain value creation across a multi-product, multi-country platform. Management states that it preserves reported net income, cash flow, and capital, and reconciles to IFRS.
The disclosure change is useful for the same reason the business has become harder to summarize. Earnings now come from several product lines across three countries at different stages of maturity. A model built on a single blended metric loses information. The framework needs to track where earnings are generated and where capital is being consumed.
3. The Updated Financial Base
3.1 FY2025 Results
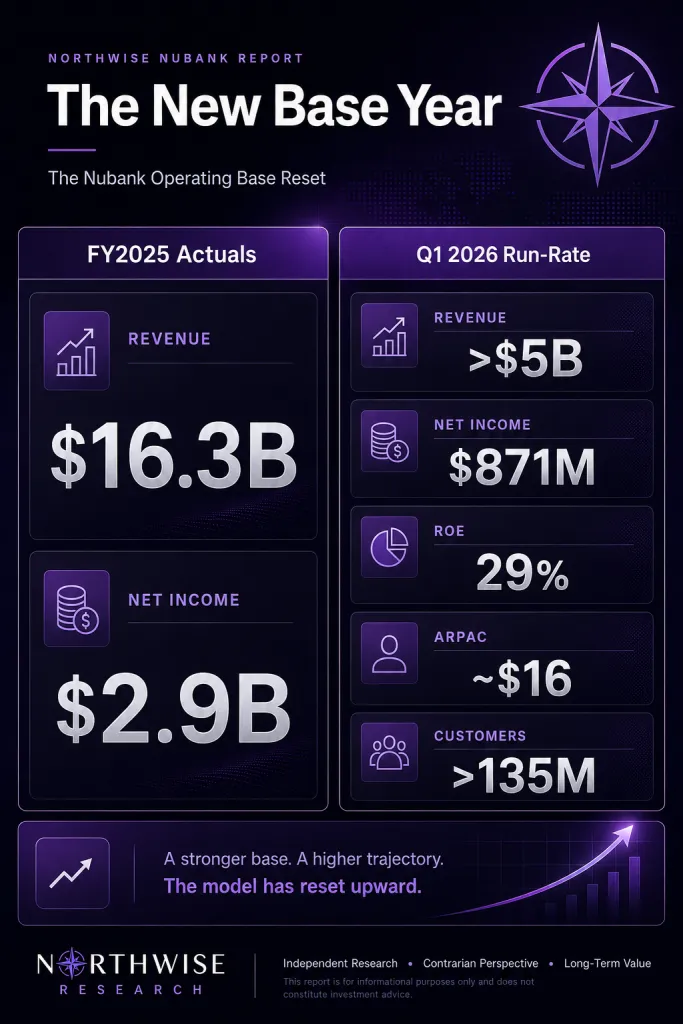
FY2025 set the audited full-year base. Revenue reached $16.3B, net income reached $2.9B, and gross profit reached $6.6B. Customers ended the year at 131M after 17M net additions.
The balance sheet entered 2026 with room. Deposits stood at $41.9B against a $32.7B credit portfolio at year-end. Total capital was $8.9B, with $2.2B of excess capital in operating entities and $3.0B of cash and equivalents at the holding company. Available funding of $38.8B was roughly twice the $19.0B net credit portfolio. FY2025 confirmed a multi-billion-dollar earnings platform with a funded balance sheet, not a company spending its way toward a future profit.
3.2 Q4 2025 Results
Q4 2025 showed the exit-rate strength heading into the forecast period. Revenue was $4.9B and net income was $894.8M, a 33% return on equity. ARPAC was $15, the activity rate was 83%, and cost to serve held at $0.80 per active customer. The efficiency ratio was 19.9%.
Net interest income was $2.8B and risk-adjusted net interest margin was 10.5%. Gross profit was $1.96B. Deposits were $41.9B at a cost of funding of 87% of interbank rates, against a $32.7B credit portfolio. The 15 to 90 day NPL ratio was 4.1% and the 90-plus day NPL ratio was 6.6%.
3.3 Q1 2026 Results
Q1 2026 is the live run-rate anchor, and it showed both sides of the thesis. Revenue crossed $5B for the first time, net income was $871M, and return on equity was 29%. ARPAC was about $16, the activity rate held at 83%, and the efficiency ratio improved to 17.6%.
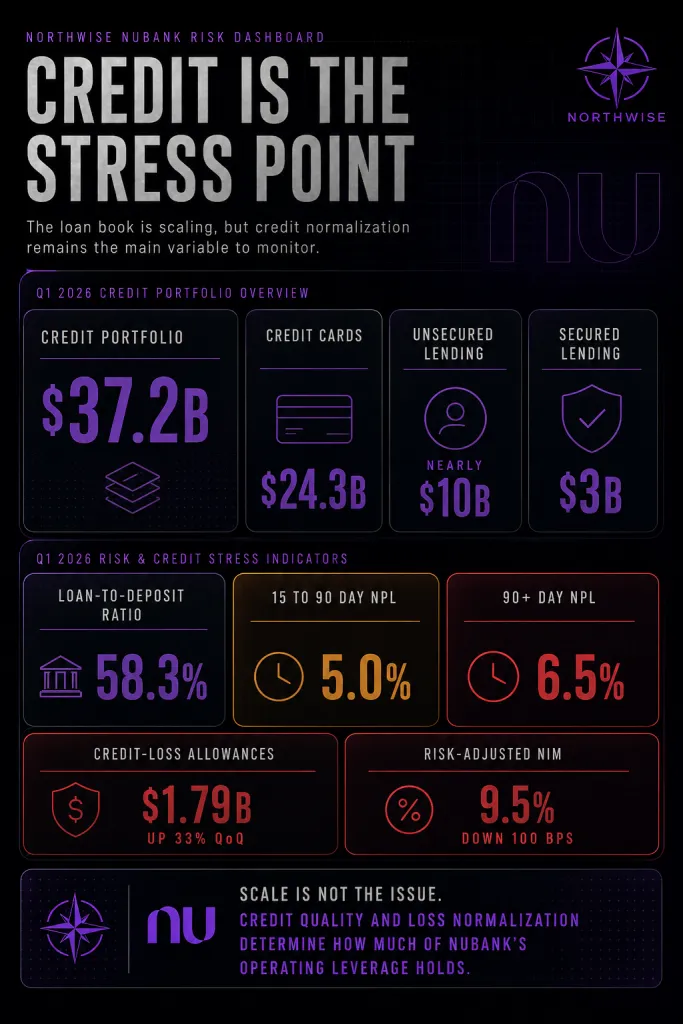
Net interest income was $3.25B at a 21.1% net interest margin. The credit book told the harder part of the story. The total portfolio reached $37.2B, with $24.3B in credit cards, nearly $10B in unsecured lending, and $3B in secured lending. The loan-to-deposit ratio rose to 58.3% from 49.1% in Q4 2025 and 48.5% a year earlier. Credit-loss allowances rose 33% sequentially to $1.79B. The 15 to 90 day NPL ratio increased to 5.0% while the 90-plus day ratio held at 6.5%. Risk-adjusted net interest margin fell 100 basis points to 9.5%, and gross profit eased to $1.88B despite higher revenue.
Growth and profitability stayed strong. The larger loan book and higher provisioning made the risk side more visible.
3.4 Revenue, NII, Gross Profit, and Net Income
Revenue scaled from $16.3B in FY2025 to a Q1 2026 run-rate above $20B. Net interest income remains the central driver at $3.25B in the quarter. Gross profit was $6.6B for FY2025, $1.96B in Q4 2025, and $1.88B in Q1 2026.
The sequential dip in gross profit on higher revenue is the line to understand. It reflects the rise in credit-loss provisioning as the portfolio expanded, not a deterioration in the core business. Net income remained strong at $871M. The company is expanding while producing real earnings, rather than trading growth for losses.
3.5 ROE, Efficiency Ratio, Cost to Serve, and Operating Leverage
Return on equity was 33% in Q4 2025 and 29% in Q1 2026. The efficiency ratio was 19.9% in Q4 and improved to 17.6% in Q1, and management expects the full-year ratio to land roughly in line with the FY2025 ending level due to return-to-office costs, international expansion, and AI infrastructure investment. Cost to serve held at $0.80 per active customer.
These figures are why Nubank warrants a different lens than a legacy bank. The operating leverage lives in the spread between ARPAC near $16 and a cost to serve below $1. The open question is how much of that leverage credit losses absorb as the balance sheet grows.
3.6 Deposits, Credit Portfolio, and Funding Base
Deposits rose to $42.4B in Q1 2026 from $41.9B in Q4, at a cost of deposits of 88% of interbank rates. The credit portfolio grew faster, from $32.7B to $37.2B, lifting the loan-to-deposit ratio to 58.3%.
A loan book expanding faster than deposits is acceptable while underwriting quality holds and the funding base remains deep. It becomes dangerous if loss curves deteriorate at the same time. The funding position is still strong. The trend in the ratio is worth tracking.
3.7 What the New Base Year Changes in the Model
The original 2025 revenue base was close to actual, so the prior model was not structurally wrong. Four things move the outputs higher: the Q1 2026 run-rate raised the forward revenue base, Mexico break-even pulled earnings forward, reported ARPAC is ahead of the prior trajectory, and Colombia carries more scale than previously modeled. AI underwriting lends additional support to the credit-expansion assumptions.
Credit risk increased alongside all of that. Better operating data and a higher risk profile arrived in the same quarter. The model should move up, and it should also carry a higher bear-case probability than the prior version did.
4. Brazil: The Earnings Engine
4.1 Brazil's Role in the Nubank Model
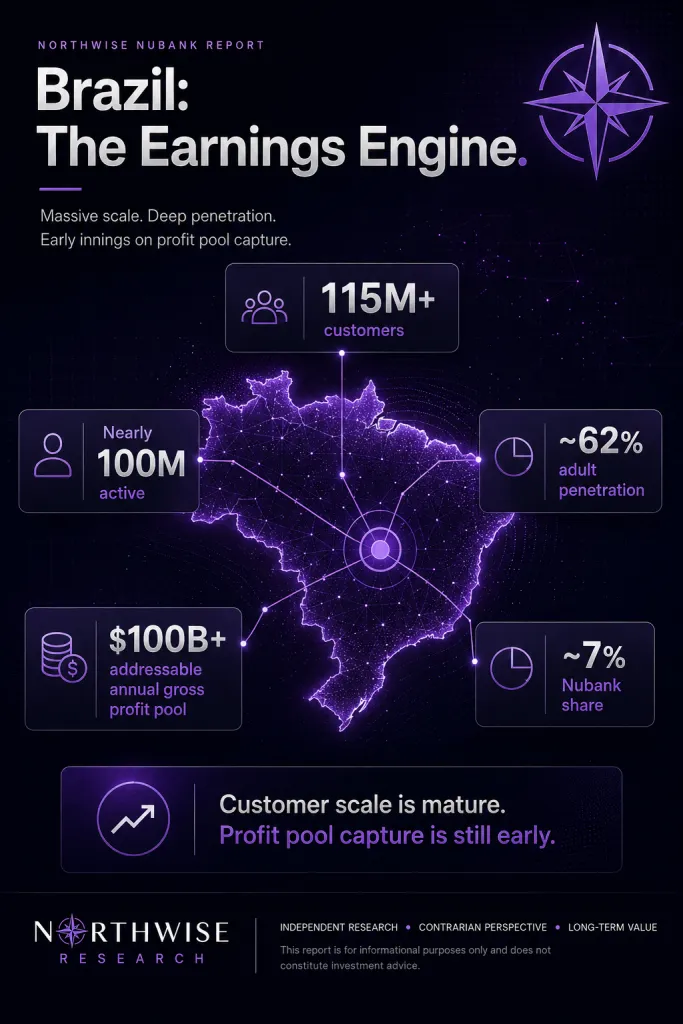
Brazil is the largest and most mature market, with more than 115M customers and close to 100M active. Nubank is the largest private financial institution in the country by customers, serving more than half of the adult population.
Brazil is no longer mainly an acquisition market. It is the monetization engine, the funding base, and the proof of unit economics. A model that treats Brazil only as a source of country risk misreads the structure. Brazil is both the principal risk and the stabilizing profit base.
4.2 Customer Penetration and Activity
Brazil adult penetration was disclosed around 62%, and the Brazil activity rate was 86% in Q4 2025 against an 83% consolidated rate. At that level of penetration, customer growth should slow toward saturation while usage stays high.
The analytical focus follows from the math. With most reachable customers already acquired, the question is how much additional wallet share Nubank can capture from the base it already holds.
4.3 ARPAC Expansion in a Mature Customer Base
Consolidated ARPAC reached $15 in Q4 2025 and about $16 in Q1 2026, with Brazil likely above the international markets. Brazil ARPAC growth should come from deeper credit usage, secured lending, payroll loans, premium products such as Ultravioleta, insurance, investments, SME products, capture of higher-income customers, and household-level consolidation.
The prior model assumed Brazil ARPAC reached $27 monthly by 2030. The refreshed base case assumes roughly $31, the bull case assumes the mid-$30s, and the bear case assumes only the low-to-mid $20s. If ARPAC keeps rising while cost to serve stays low, Nubank can compound earnings even as customer growth slows.
4.4 Credit, Secured Lending, Payroll Products, and Product Density
Credit remains central to Brazil's earnings. Of the $37.2B group portfolio in Q1 2026, credit cards were $24.3B, unsecured lending was nearly $10B, and secured lending was $3B.
Secured and payroll products carry weight beyond their current size. They can support ARPAC growth while improving the risk mix of the book. Nubank launched new payroll loan modalities in Brazil in 2025, and products such as an under-18 credit card and SME credit deepen relationships across the household and the small-business segment. Debt renegotiation efforts, including participation in Novo Desenrola Brasil and in-app renegotiation, support cycle management. The Brazil credit book should be modeled by mix, not as one undifferentiated unsecured pool.
4.5 Why Brazil Is No Longer Just a Growth Market
Brazil funds international expansion, proves the unit economics, and absorbs part of the margin drag from Mexico, Colombia, and U.S. investment. Its deposit base and high activity make the consolidated model more resilient.
The older framing that treated Brazil purely as a risk problem is incomplete. The deeper read holds two facts at once: Brazil is the largest source of macro and currency risk, and it is the profit base that keeps the rest of the platform funded.
4.6 The Brazil Profit Pool and Nubank's Remaining Share Opportunity
Management estimates the Brazil addressable profit pool at more than $100B in annual gross profit, of which Nubank holds roughly 7%. High customer penetration and low profit-pool penetration can coexist.
The implication is that Nubank can grow meaningfully inside Brazil without new country launches. Even in a saturated customer market, profit-pool capture remains early.
5. Mexico: The Model's Biggest Positive Revision
5.1 Why the Old Mexico Assumption Was Too Conservative
The prior model treated Mexico as a later-decade profitability story, with the market moving out of investment mode toward meaningful earnings in the back half of the decade. Q1 2026 made that assumption stale.
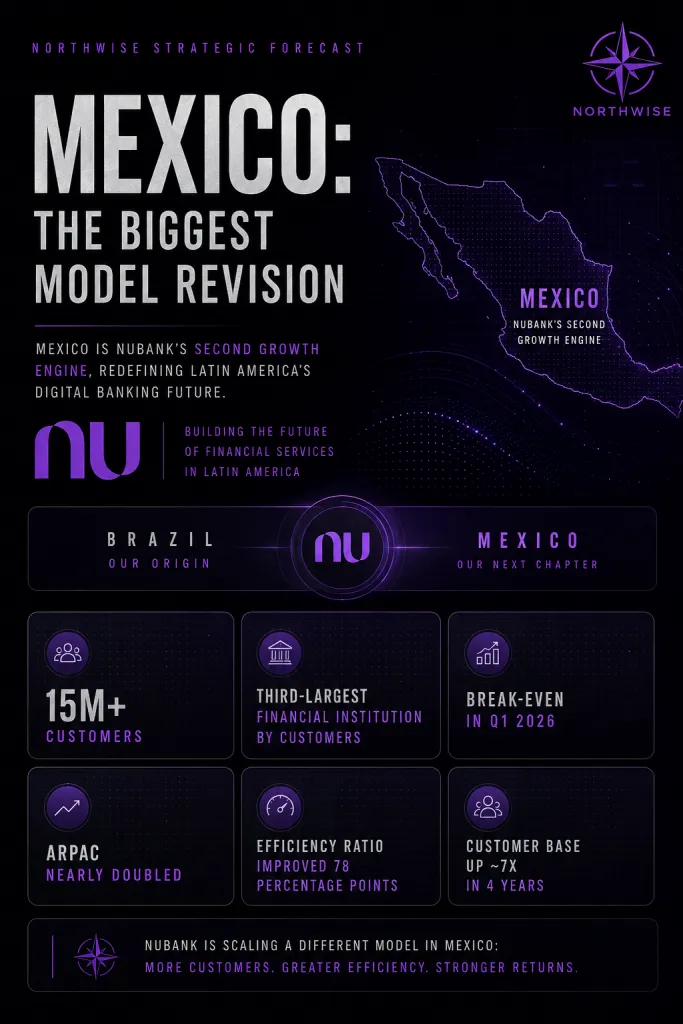
Mexico reached break-even in Q1 2026, crossed 15M customers, and became the third-largest financial institution in the country by customers. The customer base grew roughly 7x in four years, ARPAC nearly doubled, and the efficiency ratio improved by 78 percentage points. Mexico moved from a future earnings possibility to a current operating proof point.
5.2 15M Customers and Third-Largest Financial Institution Status
More than 15M customers and third-largest-institution status place Mexico well past the question of whether Nubank can acquire customers there. It served around 15% of the adult population at Q4 2025 and was the largest issuer of new credit cards in the country.
Mexico is scaling faster than Brazil did at a comparable stage. The relevant variables are now monetization, funding, and credit discipline rather than adoption.
5.3 Break-Even in Q1 2026
Break-even pulls the earnings curve forward, supports a higher 2030 revenue and earnings path, and reduces the international dilution that the prior model carried. It does not remove execution risk.
Break-even is the first sign that the Mexico flywheel is starting to self-fund, not a finish line. One quarter establishes that the unit economics can turn positive at scale. It does not yet establish a durable margin curve.
5.4 ARPAC Nearly Doubling and Efficiency Improving by 78 Percentage Points
ARPAC nearly doubling indicates that product layering works outside Brazil. A 78 percentage point improvement in the efficiency ratio indicates that operating leverage is developing as the market scales.
Together they support modeling Mexico margin expansion earlier than the prior version assumed, with the market moving from a customer-count phase into an ARPAC-expansion phase.
5.5 Mexico's Banking License Path
CNBV approved Nu Mexico's transformation from SOFIPO to bank in April 2025. The entity still requires a regulatory audit and final authorization before beginning banking operations, so it should not yet be described as fully operating as a bank.
Bank status should enable broader products, payroll accounts, higher deposit limits, and much larger deposit insurance coverage, which in turn should improve deposit acquisition, primacy, and product breadth. The license is a major medium-term catalyst, and the model should phase its benefits in gradually rather than all at once.
5.6 Why Mexico Can Become Nubank's Second Earnings Engine
The ingredients are in place: a large population, low banking penetration, inefficient incumbents, strong early customer growth, deposit and credit expansion, break-even reached ahead of schedule, rising ARPAC, improving efficiency, and a bank-license path that should deepen the product set.
Mexico is not yet Brazil. It is the first market that demonstrates Brazil was not a one-country accident.
5.7 The Macro Risk in Mexico
Mexico's macro backdrop has weakened, and growth forecasts have been cut. A soft economy can pressure consumer credit, deposits, and ARPAC at the same time, and Mexico now carries more weight in the thesis than before.
Mexico deserves a model upgrade. It does not deserve a free pass. Until repeated profitable quarters are visible, it should not be allowed to drive the bull case on its own.
6. Colombia: Earlier, Smaller, but No Longer a Footnote
6.1 5M Customers and 15% Adult Penetration
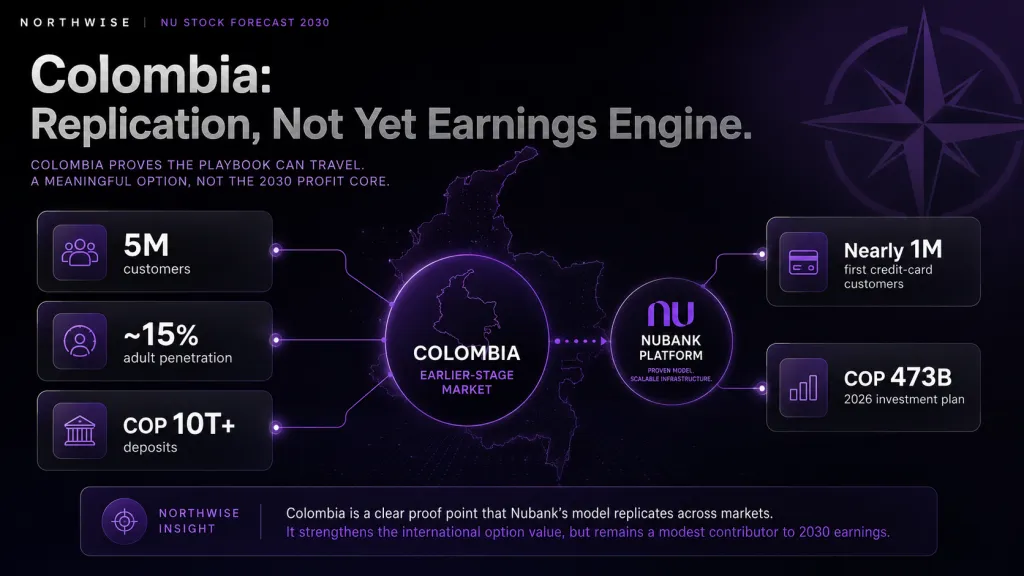
Nu Colombia reached 5M customers and about 15% adult penetration, having approached the milestone during Q1 2026. Colombia is earlier than Mexico but now large enough to warrant its own model line rather than a footnote.
The discipline is to size it correctly. Colombia is meaningful and still early, which argues against over-modeling its profitability.
6.2 COP 10T in Deposits
Deposits across Cuenta Nu and CDTs exceeded COP 10T, supported by a product suite that includes Cuenta Nu with Cajitas and nine CDT options. Deposit traction is the leading indicator in Nubank's model, which tends to expand deposits first, then credit, then higher-margin products.
Colombia's deposit growth supports the replicability of that sequencing in a third country.
6.3 Nearly 1M First Credit Card Customers
Nearly 1M Colombian customers received their first credit card through Nu. The figure cuts in two directions. It reinforces the financial-inclusion angle and the long-term opportunity, and it introduces future underwriting risk as first-time credit customers season.
The stat is best read as both opportunity and risk rather than as unambiguous good news.
6.4 Colombia's 2026 Investment Plan
The 2026 Colombia investment plan is about COP 473B, roughly $130M. Colombia remains in investment mode, so near-term profitability should not be forced into the model.
Colombia contributes more to growth and optionality than to near-term earnings, and the model should treat it that way.
6.5 Why Colombia Supports the Replicability Argument
Five million customers, 15% adult penetration, more than COP 10T in deposits, first-card issuance at scale, and multiple live product categories together suggest that Nubank's playbook is not specific to Brazil. Replication across three markets strengthens the structural case.
Colombia is not yet an earnings engine. It strengthens the argument that the model travels.
6.6 Why Colombia Should Remain a Modest Contributor in the Model
A smaller economy, an earlier lifecycle, ongoing heavy investment, and less seasoned credit cohorts all argue for restraint. Profitability should lag Mexico.
The 2030 base case should treat Colombia as a modest contributor rather than a second Brazil.
7. NuFormer, AI, and Credit Underwriting
7.1 Why AI Belongs in the Operating Model
Nubank's use of AI is tied to underwriting, loan approval, risk monitoring, engineering productivity, customer service, and financial advice. Each of those touches a model input: approval rates, loss rates, ARPAC, the efficiency ratio, and product velocity.
AI belongs in the operating model as a support for assumptions, not as a replacement for credit-cycle evidence. The distinction governs how much credit it should receive in a forecast.
7.2 NuFormer in Credit Card Decisioning
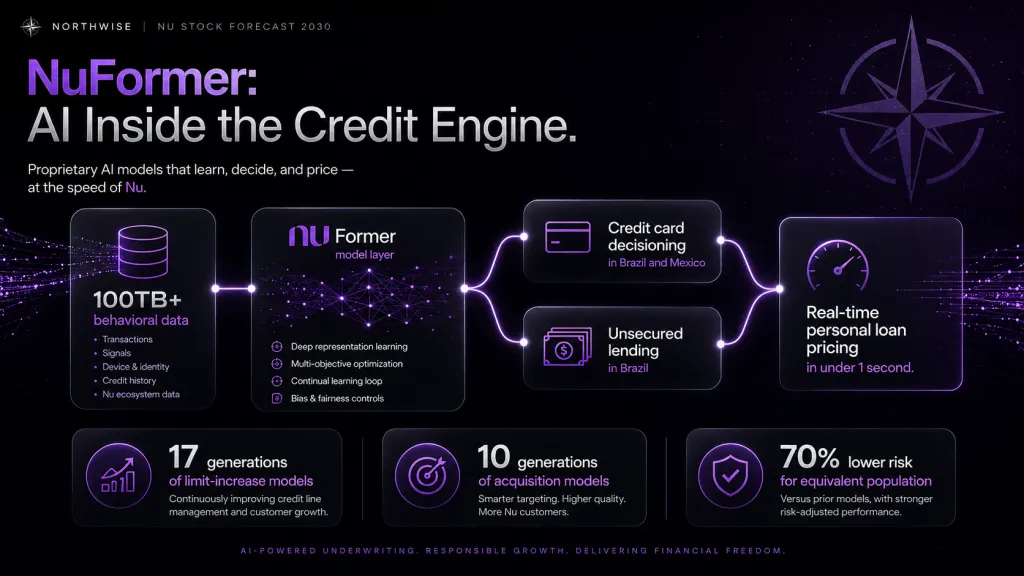
NuFormer is in production for credit card decisioning in Brazil and Mexico and for unsecured lending in Brazil. Management describes it as improving the ability to expand access while maintaining portfolio quality, and reports that it reduced risk by 70% for an equivalent population versus prior model generations.
The supporting depth is real: 17 generations of limit-increase models, 10 generations of acquisition modeling, and more than 100 TB of behavioral data. This is meaningful underwriting evidence and supports faster credit expansion in the model. It still needs to be validated through a full credit cycle.
7.3 AI Private Banker and 15M Monthly Active Users
AI Private Banker functionalities serve more than 15M monthly active users. The feature operates as an engagement and discovery tool that can support product adoption, financial advice, credit routing, and wealth uptake.
It is best treated as a support for ARPAC and retention rather than as a standalone revenue line.
7.4 Real-Time Personal Loan Pricing by Predicted NPV
Nubank uses real-time AI valuation to price and approve every personal loan request individually based on predicted net present value, in under one second. This is one of the stronger AI claims for the model, since it ties model sophistication directly to underwriting and profitability.
It supports risk-adjusted credit growth in principle. Reported NPLs remain the proof.
7.5 Engineering Throughput, Testing Cycles, and Internal AI Productivity
Engineering throughput rose 50% year over year, testing cycles are 90% faster, and weekly token consumption is nearly 10x higher than at the start of the year. Faster testing and deployment support product expansion and help hold cost to serve low as the business scales.
These are internal velocity gains. They matter to the cost structure without being the center of the investment case.
7.6 The Difference Between AI Narrative and AI-Driven Credit Expansion
AI does not eliminate credit risk. It changes the underwriting process. If the models misprice risk, the result still appears in NPLs and allowances, on a delay.
AI becomes a durable advantage only if it survives adverse selection, macro stress, and time. Until then it is a promising input, not a settled moat.
7.7 What Still Needs to Be Proven Through a Credit Cycle
The proof points to monitor are specific: 15 to 90 day NPL normalization after Q1 seasonality, 90-plus day stability, risk-adjusted net interest margin stabilizing above 9%, loss allowances growing slower than revenue, secured lending rising as a share of the book, Mexico credit quality as the market scales, and Colombia first-card cohort seasoning.
Several quarters of this data, not a single strong release, are what would convert the AI underwriting claim into a modeling assumption we would lean on.
8. U.S. Optionality
8.1 OCC Conditional Approval
Nu received OCC conditional approval to establish Nubank, N.A. on January 29, 2026. The approval makes the U.S. initiative more concrete than it was in the original forecast, moving it from idea to early-stage process.
It remains optionality. It should not be modeled as core earnings.
8.2 FDIC and Federal Reserve Approvals Still Pending
FDIC and Federal Reserve approvals remain pending. Nubank, N.A. must be capitalized within 12 months and open within 18 months. Cristina Junqueira leads the U.S. organization, and Roberto Campos Neto chairs the board.
The path is not complete, which argues for treating the option with restraint rather than enthusiasm.
8.3 Why the U.S. Is Not in Base EPS
U.S. banking is highly competitive, with narrower credit spreads, higher compliance costs, and expensive customer acquisition. Product-market fit is unproven. The U.S. should stay outside base earnings until early data demonstrates scalability.
8.4 Cost Drag in 2026 and 2027
Management expects U.S. investment to remain below 100 basis points of the consolidated efficiency ratio in each of 2026 and 2027, with further investment dependent on product-market fit and a path to profitable scalability.
The near-term cost is manageable. The risk is that costs exceed guidance or that management chases growth too quickly, at which point the option becomes a drag.
8.5 Why U.S. Optionality Is a Valuation Overlay, Not the Core Thesis
A successful U.S. launch could raise institutional awareness, improve perception of Nubank as a global digital bank, and support multiple expansion. Latin America still has to carry the model. The U.S. belongs in the framework as a capped, probabilistic overlay rather than as a load-bearing assumption.
9. Competitive Positioning
9.1 Nubank Versus Incumbent Banks
Incumbent banks carry branch networks, legacy systems, slower product cycles, and higher fixed costs. Nubank operates at a cost to serve below $1 per active customer, a 17.6% efficiency ratio in Q1 2026, high activity, and a unified digital platform.
Incumbents retain advantages in corporate banking, legacy relationships, complex wealth, and regulatory depth. Nubank's edge is standardized, scalable retail and small-business finance. It does not need to beat incumbents everywhere. It needs to keep winning the scalable consumer relationships.
9.2 Nubank Versus Mercado Libre
Mercado Libre approaches the consumer wallet from commerce and payments, with point-of-sale and merchant advantages through Mercado Pago. Nubank approaches it from banking and financial primacy, with deposit, credit, and primary-account advantages.
The framing as a winner-take-all contest is the wrong one. Two large platforms can both succeed while specializing. The more likely outcome is specialization around different centers of gravity rather than a single victor.
9.3 Nubank Versus Other Digital Banks
Against other digital banks, Nubank carries scale, profitability, and underwriting depth that many neobanks lack. It has already operated through a rate cycle, holds meaningful deposits and a large credit book, and has shown replicability in Mexico and Colombia.
U.S. fintech peers may trade at stronger multiples while carrying less emerging-market growth runway. The comparison runs in both directions.
9.4 Where Nubank Competes
Nubank competes in consumer banking, credit cards, deposits, personal loans, payroll and secured lending, insurance, wealth products, SME products, payments, and premium digital banking. The common thread is standardization at scale.
9.5 Where Nubank Intentionally Does Not Compete
Nubank stays out of large corporate banking, investment banking, bespoke private banking, complex enterprise credit, and capital-markets businesses. Avoiding those complexity-heavy segments protects the cost structure that produces the operating leverage.
9.6 Why Focus Matters for Operating Leverage
The low cost structure depends on standardization, automation, and scale. Drift into bespoke finance would dilute the core advantage. Focus is a margin decision as much as a strategic one, and it shows up directly in the efficiency ratio.
10. Macro and FX Framework
10.1 Brazil Rates and Inflation
Brazil remains a high-rate market, with the Selic around 14.5% and inflation running above the comfort range. High rates support yield economics and also pressure consumers and credit losses. Brazil is a source of both opportunity and risk.
The modeling consequence is to require risk-adjusted margin and NPL monitoring rather than assuming credit expansion occurs in a frictionless environment.
10.2 Mexico Growth and Rate Environment
Mexico's growth outlook has weakened, with Banxico cutting 2026 GDP expectations to around 1.1%. A soft economy can pressure credit quality and consumer demand at the moment Mexico is becoming a larger part of the thesis.
Mexico earns an operating upgrade for its break-even and customer scale. It also earns a macro-risk discount. Both adjustments belong in the model.
10.3 Colombia Inflation, Rates, and Political Risk
Colombia remains a high-rate, inflation-sensitive market with relevant political and regulatory risk, and it is still in investment mode with less seasoned credit cohorts. The base case should keep the Colombia contribution modest.
10.4 Why Local-Currency Compounding Can Still Disappoint USD Investors
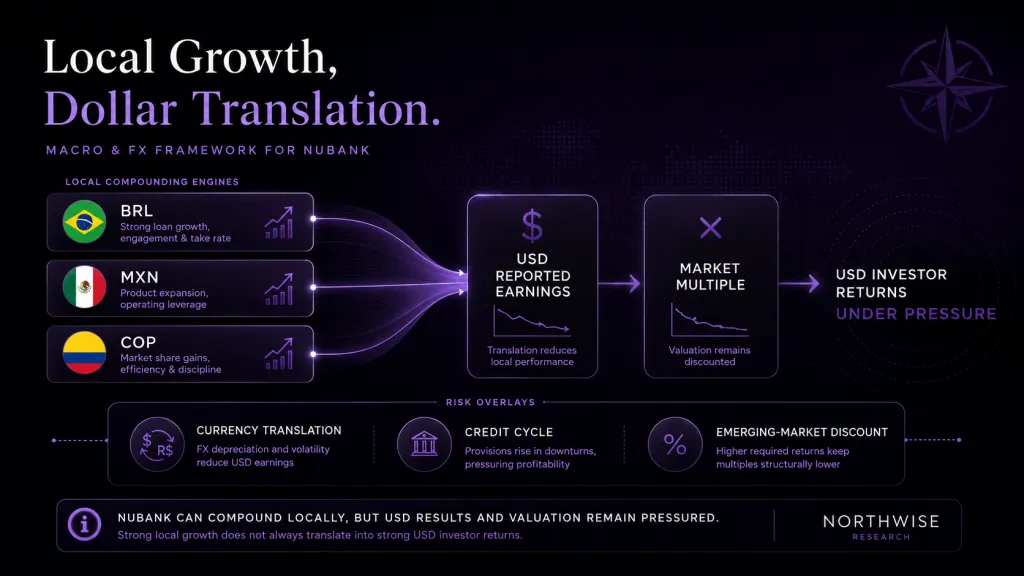
Nubank reports in U.S. dollars while generating revenue and earnings mostly in reais, pesos, and Colombian pesos. Local-currency growth can be strong while reported dollar results are pressured. Currency moves can reduce reported earnings per share, compress the multiple investors are willing to pay, and weigh on confidence.
The implication is concrete. The Brazil discount should remain in the model rather than being assumed away.
10.5 How FX Should Be Treated in the Model
The bear case should carry sustained currency drag, the base case moderate currency friction, and the bull case neutral to mildly favorable conditions. The model should not assume the Brazil discount fully disappears, and the multiples applied should stay below those used for U.S. software or pure-platform businesses.
11. Risks and Pressure Testing
11.1 The Real Bear Case
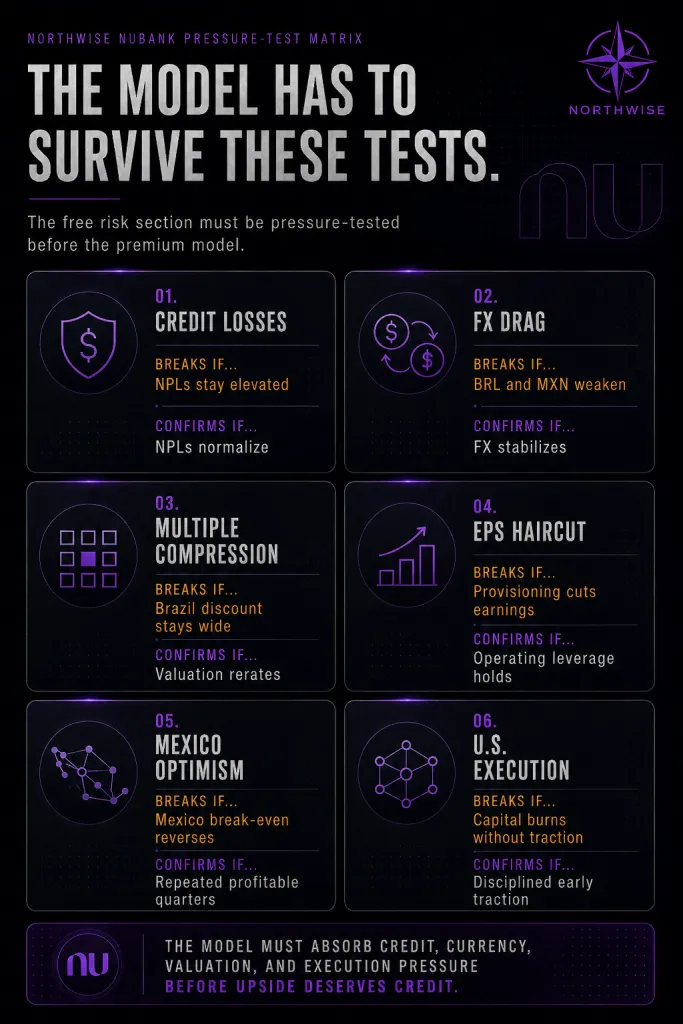
The real bear case is not that Nubank is fake. The business is profitable, funded, and growing. The bear case is that Nubank is a high-quality lender expanding into a less forgiving macro environment while investors decline to pay platform multiples for emerging-market financial earnings.
Stated plainly, Nubank can execute locally and still disappoint dollar investors if credit costs, currency, and valuation multiples move against the company at the same time. A forecast that implies large upside from the current price does not deserve a victory lap. It deserves a hostile review, which is the purpose of this section.
11.2 Credit Risk and the Expanding Loan Book
Credit is the central risk variable. The portfolio reached $37.2B in Q1 2026, with $24.3B in cards, nearly $10B in unsecured lending, and $3B in secured lending. The loan-to-deposit ratio rose to 58.3%, the 15 to 90 day NPL ratio rose to 5.0%, the 90-plus day ratio was 6.5%, allowances rose 33% sequentially to $1.79B, and risk-adjusted net interest margin fell from 10.5% to 9.5%.
The company is becoming more balance-sheet intensive. AI underwriting does not remove the need to watch losses. If early-stage delinquencies do not normalize, the earnings path moves lower, and the model has to follow.
11.3 NPLs, Allowances, and Risk-Adjusted NIM
The Q1 increase in 15 to 90 day NPLs may be seasonal, consistent with company framing, or it may reflect expansion into higher-risk segments. The 90-plus day ratio was stable to slightly improved at 6.5%, and risk-adjusted net interest margin fell 100 basis points sequentially.
The resolution comes from data, not interpretation. The question is whether Q2 and Q3 confirm normalization or extend the trend. Until then, the uncertainty stays open rather than being argued away in either direction.
11.4 Multiple Compression
Even if earnings arrive as modeled, the multiple the market assigns is a separate and live risk. A high-return financial platform can be valued like a platform or like an emerging-market bank, and the distance between those two regimes is large.
If NU continues to trade as an emerging-market bank rather than as a platform bank, the terminal valuation compresses regardless of how the earnings path develops. The specific multiple sensitivities sit in the premium section. The direction is clear: multiple risk alone can move the outcome materially, before any change in fundamentals.
11.5 EPS Haircut Scenarios
Credit, currency, and macro can each take a bite out of the modeled earnings path, and they can do so together. The earnings line that supports a strong valuation is not a floor. It is a central estimate surrounded by real downside.
The combination that matters is a meaningful earnings haircut paired with a compressed multiple, since the two tend to arrive together rather than separately. The quantified haircut scenarios are in the premium section. The point for the free reader is that the downside is structural, not theoretical.
11.6 Credit-Loss Shock Scenario
In a credit-loss shock, the 15 to 90 day NPL ratio stays above 5%, the 90-plus day ratio reaccelerates above 7%, risk-adjusted net interest margin trends toward mid-single digits, and net margin stalls well below the base-case trajectory. Revenue can keep growing while earnings quality erodes.
Credit is the true thesis-breaking variable. It is the one input where a sustained adverse trend would force a re-underwrite of the entire forecast rather than a modest revision.
11.7 FX Drag Scenario
Under sustained currency drag, local-currency revenue compounds while real, peso, and Colombian peso depreciation reduces reported dollar revenue and earnings, and the multiple compresses alongside. The local business stays intact while the dollar return path weakens.
Currency does not break Nubank's underlying franchise. It can break the dollar return an investor actually receives, which is the return that matters for this stock.
11.8 Mexico Optimism Stress Test
The positive facts are real: more than 15M customers, third-largest-institution status, Q1 break-even, ARPAC nearly doubling, and a 78 percentage point efficiency improvement. The risk is that a weaker Mexican economy pressures credit quality and that one break-even quarter is extrapolated into a full margin curve too early.
Two to three more quarters of profitable scaling would settle the question. Mexico deserves an upgrade in the model and not unchecked bull-case treatment.
11.9 U.S. Execution Risk
OCC conditional approval is genuine progress. FDIC and Federal Reserve approvals remain pending, product-market fit is unproven, the market is highly competitive, and compliance and acquisition costs are high. U.S. costs could exceed initial expectations.
The U.S. is an option, not the thesis. It should be allowed to add value without being allowed to carry it.
11.10 What Would Break the NU Thesis
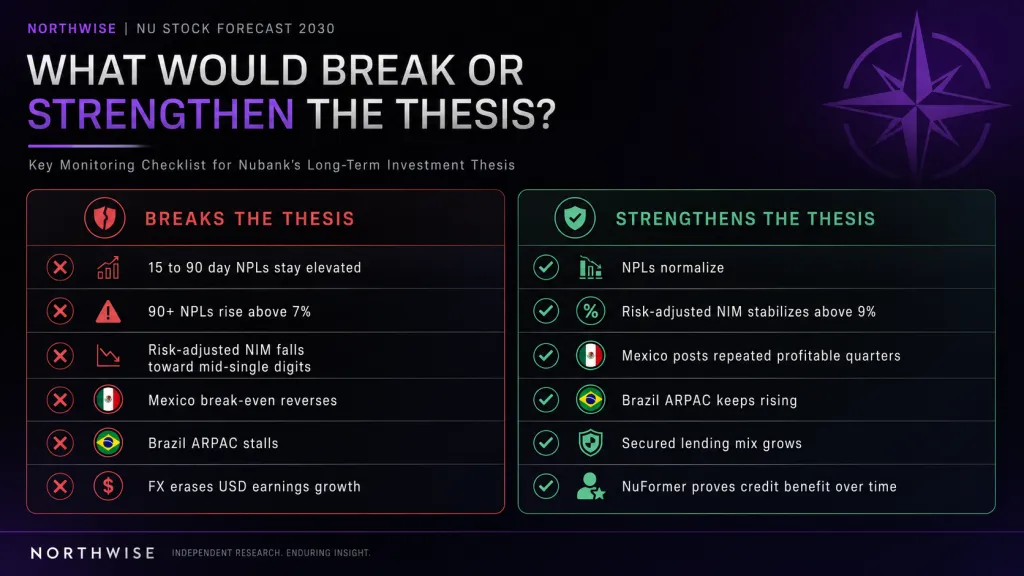
The thesis weakens materially if the 15 to 90 day NPL ratio stays elevated after seasonal normalization should have occurred, if 90-plus day NPLs move back above 7% and keep rising, if risk-adjusted net interest margin falls toward mid-single digits, or if allowances keep growing faster than revenue.
It also weakens if Mexico break-even proves temporary or Mexico ARPAC stalls, if Colombia deposit growth slows materially, if Brazil ARPAC growth slows sharply despite high activity, if the efficiency ratio rises structurally above the low 20s without a visible return, if the U.S. consumes more capital or attention than guided, if currency translation erases too much of the dollar earnings growth, if regulators cap credit pricing, interchange, or fee economics, if management loosens product and credit discipline, or if the stock rerates too quickly before earnings de-risk the model.
11.11 What Would Strengthen the NU Thesis
The thesis strengthens if the 15 to 90 day NPL ratio normalizes after Q1 seasonality, if 90-plus day NPLs stay stable or decline, and if risk-adjusted net interest margin stabilizes above 9%. Repeated profitable quarters in Mexico, with rising deposits and ARPAC, would confirm the second-engine case.
It strengthens further if Brazil ARPAC keeps rising without a reacceleration in customer growth, if Colombia reaches 6M to 7M customers with strong deposit growth, if secured lending becomes a larger share of the book, if NuFormer shows measurable credit-quality benefit over multiple quarters, if U.S. approvals progress without cost overrun, if the efficiency ratio holds near 20% through reinvestment, and if fee, wealth, insurance, SME, and premium products grow as a share of gross profit.
The sections above lay out the business, the operating drivers, the updated data, and the risks as we see them, with enough detail to evaluate Nubank on its own terms. What follows is the part we reserve for members: the full 2030 model, the bear, base, and bull scenarios, the valuation and present value work, the price zones we act on, and where Northwise stands today. If you have read this far for orientation, the premium section is where we turn that orientation into a judgment on value.
Northwise Premium
Choose how to continue with Northwise
Join Northwise Premium
Unlock the rest of this report, its complete valuation, the downloadable model, portfolios, and action framework.
Join Northwise PremiumCreate a Free Account
Continue across Free Northwise research, follow companies, save reports, and receive updates.
Create a Free Account
NU Stock Forecast 2030: The Billion-Dollar Credit Test
Northwise’s NU stock forecast through 2030 tests Nubank’s credit advantage, earnings, capital and four scenarios, with a downloadable bank model.

Nu Stock Forecast
Our Nu stock forecast emphasizes how NuBank is scaling across Latin America with strong margins, low CAC, and real user engagement.

Celsius Stock Analysis: The Shelf Reset and the Second Growth Curve
Celsius stock analysis of the shelf reset, Alani growth, Pepsi economics and cash flow, with a 2030 model and a Premium valuation and entry-price framework.
Northwise Portfolios
See how the research becomes real decisions
Reader discussion
Discuss the research
Premium access is required to join this report's discussion.
Join Northwise Premium
No comments yet. Start a thoughtful discussion.