
NU Stock Forecast 2030: The Billion-Dollar Credit Test

Northwise’s NU stock forecast through 2030 tests Nubank’s credit advantage, earnings, capital and four scenarios, with a downloadable bank model.
In this article
Nubank’s greatest advantage may be the ordinary financial activity passing through its customers’ accounts. Our forecast follows that information into the lending decisions, earnings, and shareholder returns that will determine whether the bank can justify its growing ambitions.
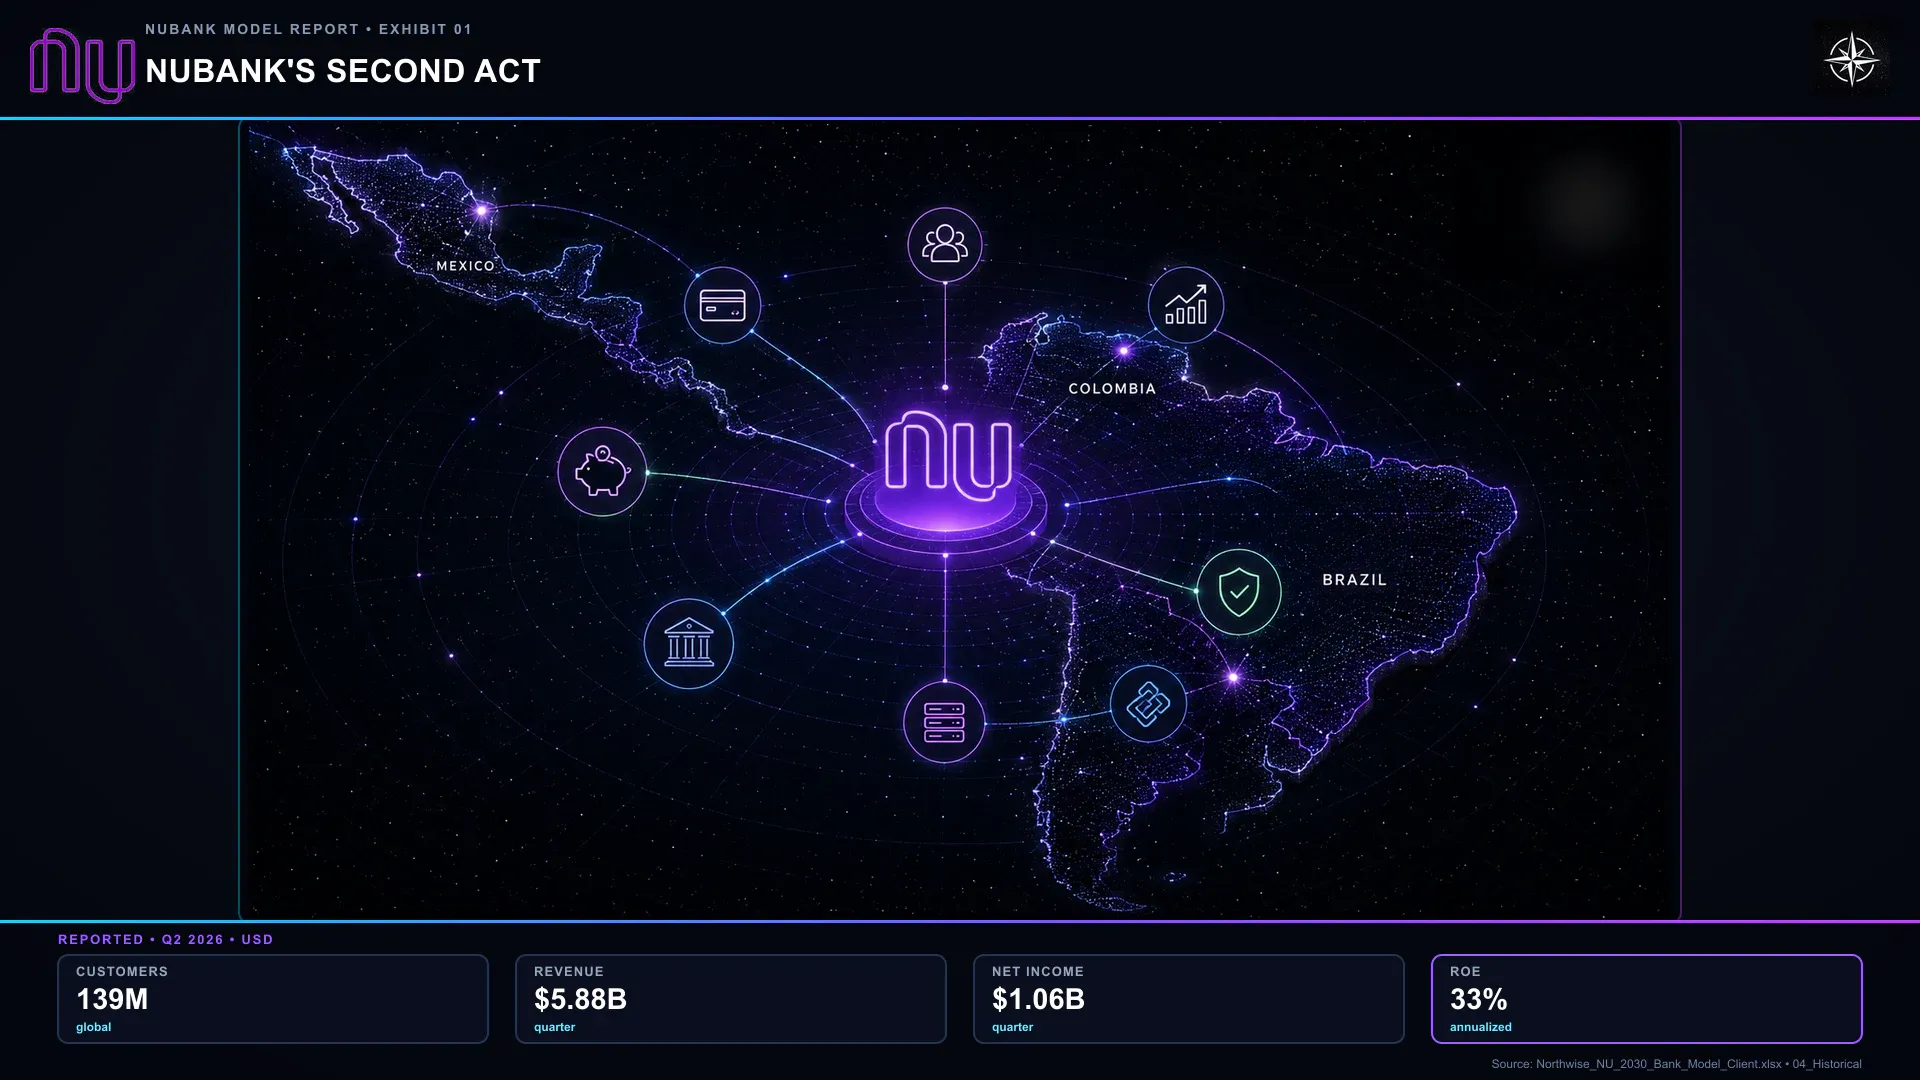
Bank of America analyst Mario Pierry began his questions on Nubank’s August 13 earnings call with congratulations. The quarter had been better than expected, and the company had just reported its first three-month period with more than $1 billion of net income. Then he asked management to explain two slides. One showed Brazilian credit-card customers across different income groups becoming slightly better at paying their bills. The other showed a rising proportion of seriously overdue credit across the broader portfolio. He wanted to know where the deterioration was coming from.
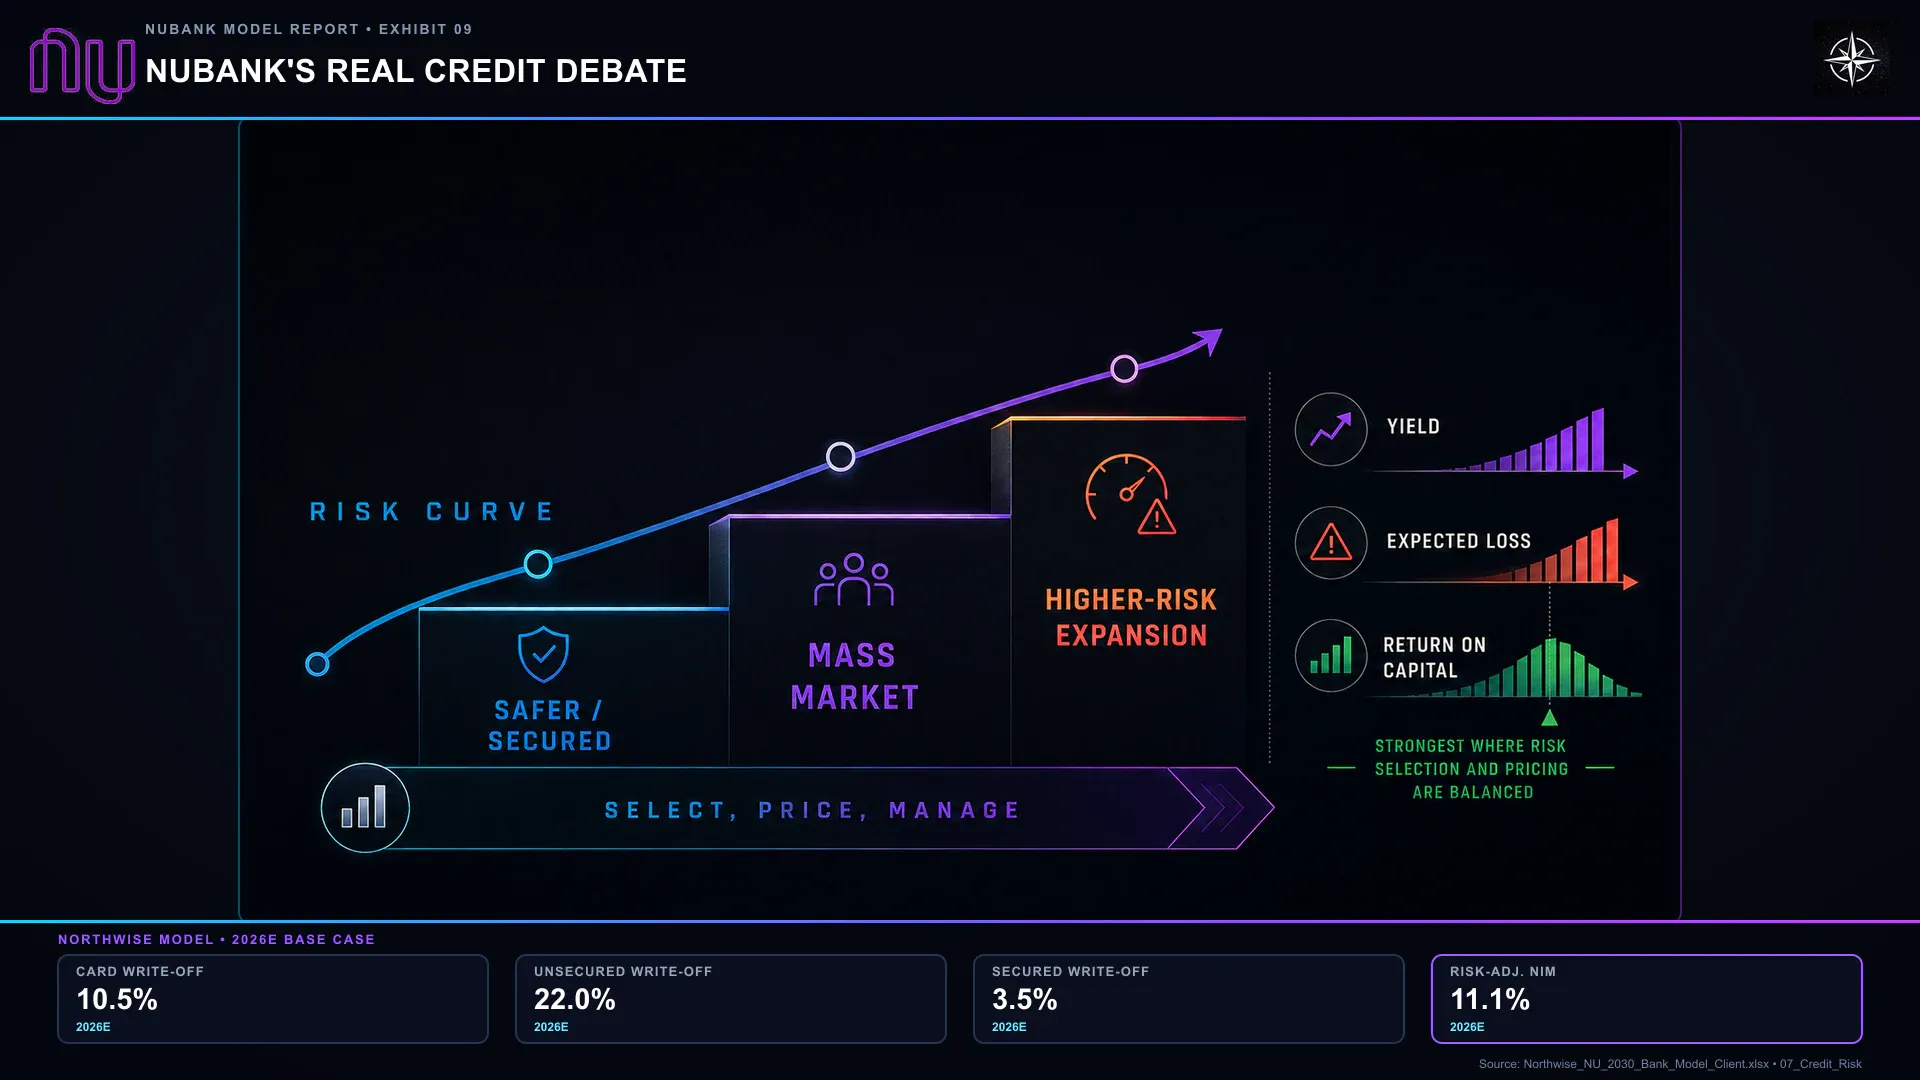
Management attributed much of the difference to a decision it had made deliberately. Nubank was lending more to customers expected to produce higher losses because it believed those loans would also produce higher returns after the losses were paid. Within comparable customer groups, performance remained steady. Across the whole bank, the mix was becoming riskier. The discussion continued through follow-up questions about seasonality, unsecured lending, and whether the two charts could really be reconciled by that explanation.
The exchange captures the investment debate better than the billion-dollar headline. Supporters see a bank using information that competitors lack to reach profitable borrowers they cannot serve as effectively. Skeptics see a familiar temptation: a lender becomes more confident, expands into riskier credit, and enjoys the income before the newest loans have established a repayment history. A strong quarter does not settle that disagreement, because lending decisions take longer to judge than quarterly earnings take to report.
Northwise believes Nubank has a genuine advantage in understanding a large part of its customer base. The evidence is strongest among Brazilian mass-market customers who use it as their main bank, where recurring account activity gives the company more information than a credit application alone could provide. We are less willing to assume the same advantage automatically transfers to wealthier customers, small businesses, or younger international portfolios. Those opportunities are attractive, but Nubank has to establish the economics as it expands.
The scale makes getting this right consequential. By the end of the second quarter, Nubank served 139 million customers and carried $39.4 billion of funded credit, the amount customers had already borrowed and not yet repaid. Our central forecast grows that credit portfolio to $116 billion by 2030 and produces approximately $49.7 billion of annual revenue and $14.7 billion of net income. Those earnings come after more than $12 billion of annual credit cost. We also examine a year in which losses rise sharply enough to push the company into a $4.3 billion annual loss, stop share repurchases, and force management to protect capital.
The opportunity is that Nubank can keep growing profits while investors remain uncomfortable with the business. Brazil will still carry currency and political risk. Consumer lending will still produce unpleasant quarters. The market may never give the shares the multiple their strongest supporters think they deserve. Our case does not depend on that disagreement disappearing; it depends on the company producing enough earnings per share to reward investors despite it.
Reported financial results are through June 30, 2026, with subsequent developments discussed through September 3. Forecasts are Northwise estimates, not company guidance. Financial amounts are in U.S. dollars unless stated otherwise. Tables use B for billions and M for millions. Forecast income statements cover full years; customer and balance-sheet figures are year-end unless labeled otherwise.
Contents
- 1. The customer relationship: From a purple card to the account where income arrives.
- 2. The credit test: What happens between approval and repayment, and what the financial statements reveal.
- 3. The next stage of growth: Brazil’s existing customers, Mexico, Colombia, and artificial intelligence.
- 4. The financial forecast: Lending, funding, capital, earnings, and four outcomes through 2030.
- 5. Premium valuation: Price targets, expected returns, and the Northwise purchase and sale framework.
The Card Was Only the Introduction
Consider a hypothetical customer who originally came to Nubank for the card. She uses it for a few purchases, checks the balance on her phone, and pays the bill from another bank. The relationship is useful but limited. Nubank sees the spending and repayment on its own product, while most of her income, savings, and obligations remain elsewhere.
As she becomes comfortable with the service, more activity moves across. She keeps some money in the account and begins paying household bills through it. Eventually, her salary starts arriving there too. None of this requires her to make a grand decision about which financial institution will dominate the next decade. She is simply moving tasks to the place where they are easiest to manage.
For Nubank, the change is significant. A recurring salary gives it a better understanding of income than an amount written on an application months earlier. It can observe whether savings accumulate, how quickly cash is spent, and whether familiar patterns begin changing. The bank also gets more opportunities to offer useful products to someone it has already acquired, rather than spending again to attract a stranger.
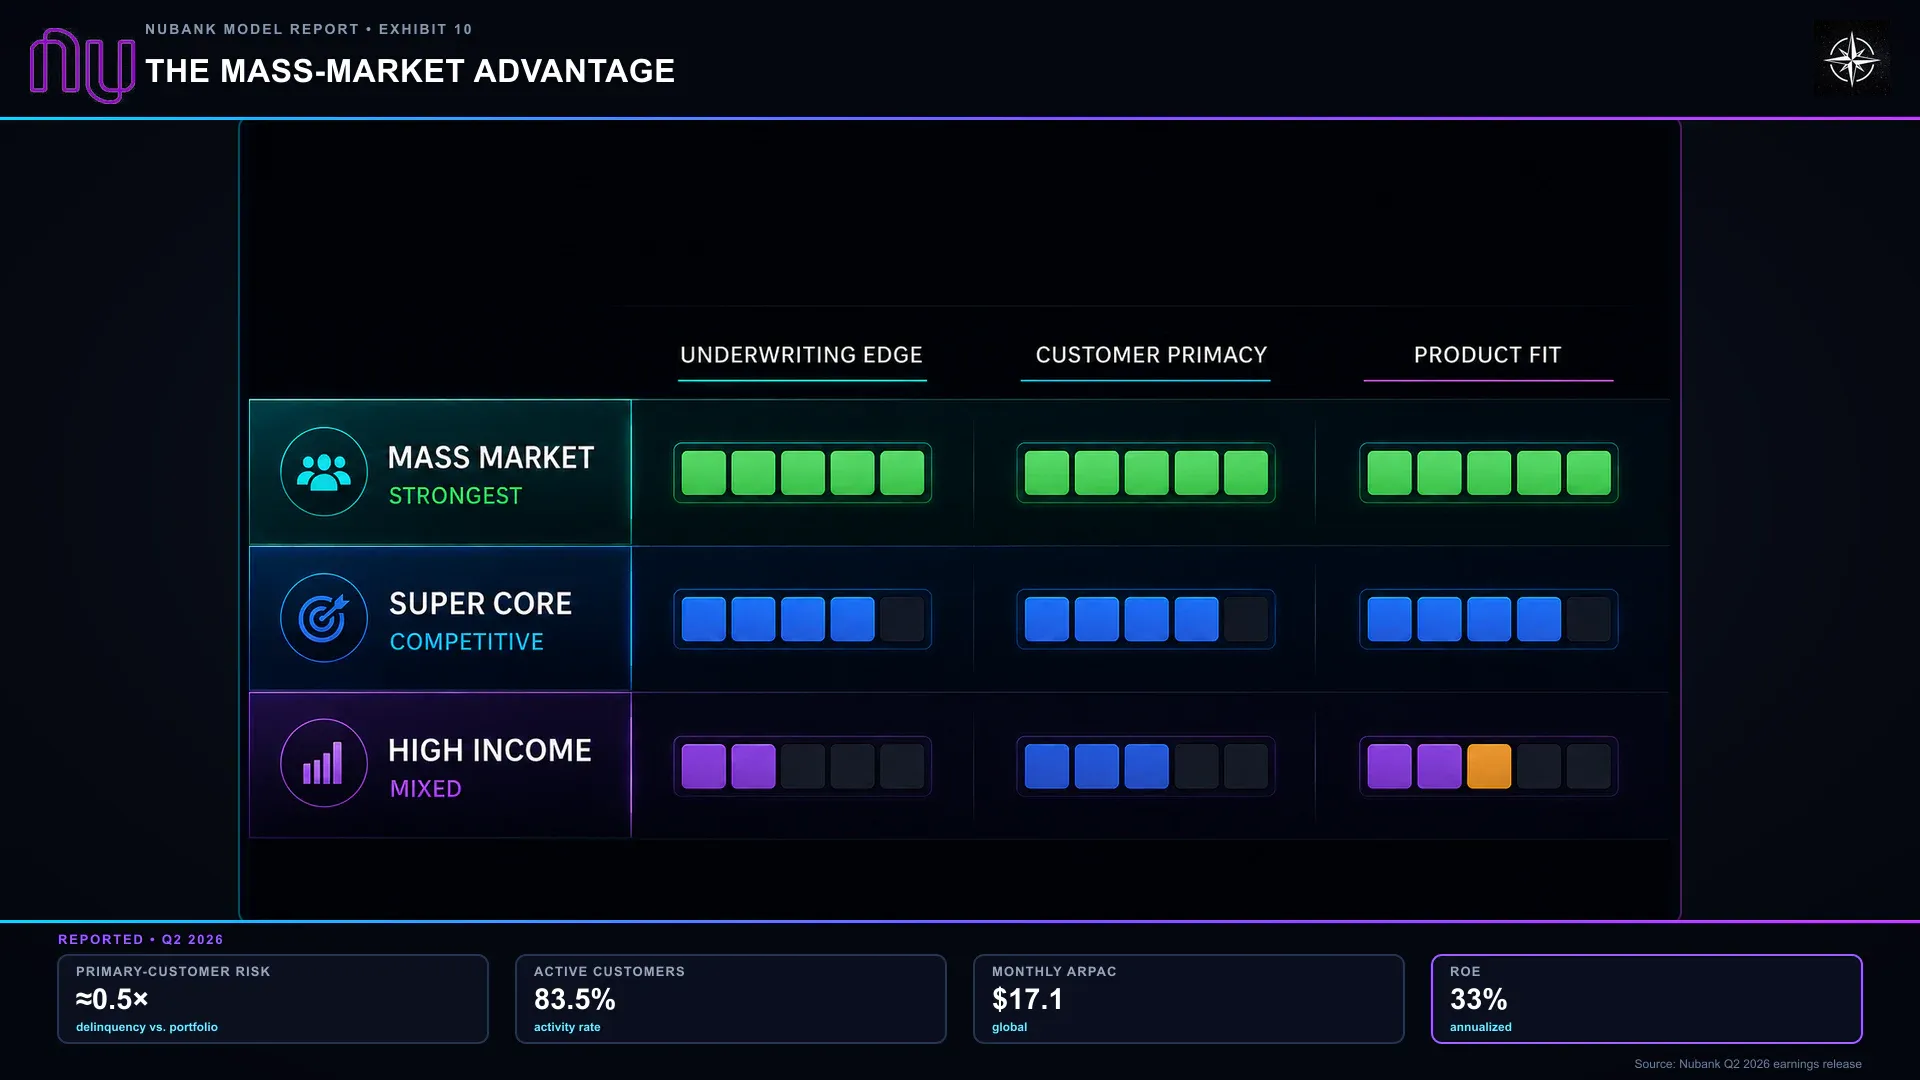
Bankers call this primacy: becoming the customer’s principal financial institution. Nubank says approximately 60% of its mass-market customers use it this way, and management says delinquency among primary customers is roughly half the portfolio average. That association is persuasive, although it does not prove that moving a salary account causes better repayment. Customers who choose Nubank as their main bank may already differ from occasional users. What it does show is that the deeper relationships are associated with better outcomes and provide a credible source of additional information.
This is the economic connection between a good banking experience and underwriting, the process of deciding whom to lend to, how much to offer, and what price compensates for the risk. A lender assessing an application receives a snapshot. A bank processing recurring financial activity can observe how circumstances develop. That does not tell it the future, but it gives it more chances to notice when the original assessment needs to change.
Nubank’s early card business established the contact that made this possible. A no-fee card managed through a mobile application gave customers a manageable reason to try an unfamiliar institution. Accounts and deposits then created reasons to use it more frequently. The company expanded the relationship gradually, acquiring a history of transactions along the way. The original product was valuable partly because of the business it allowed Nubank to offer later.
The Relationship Becomes More Valuable With Time
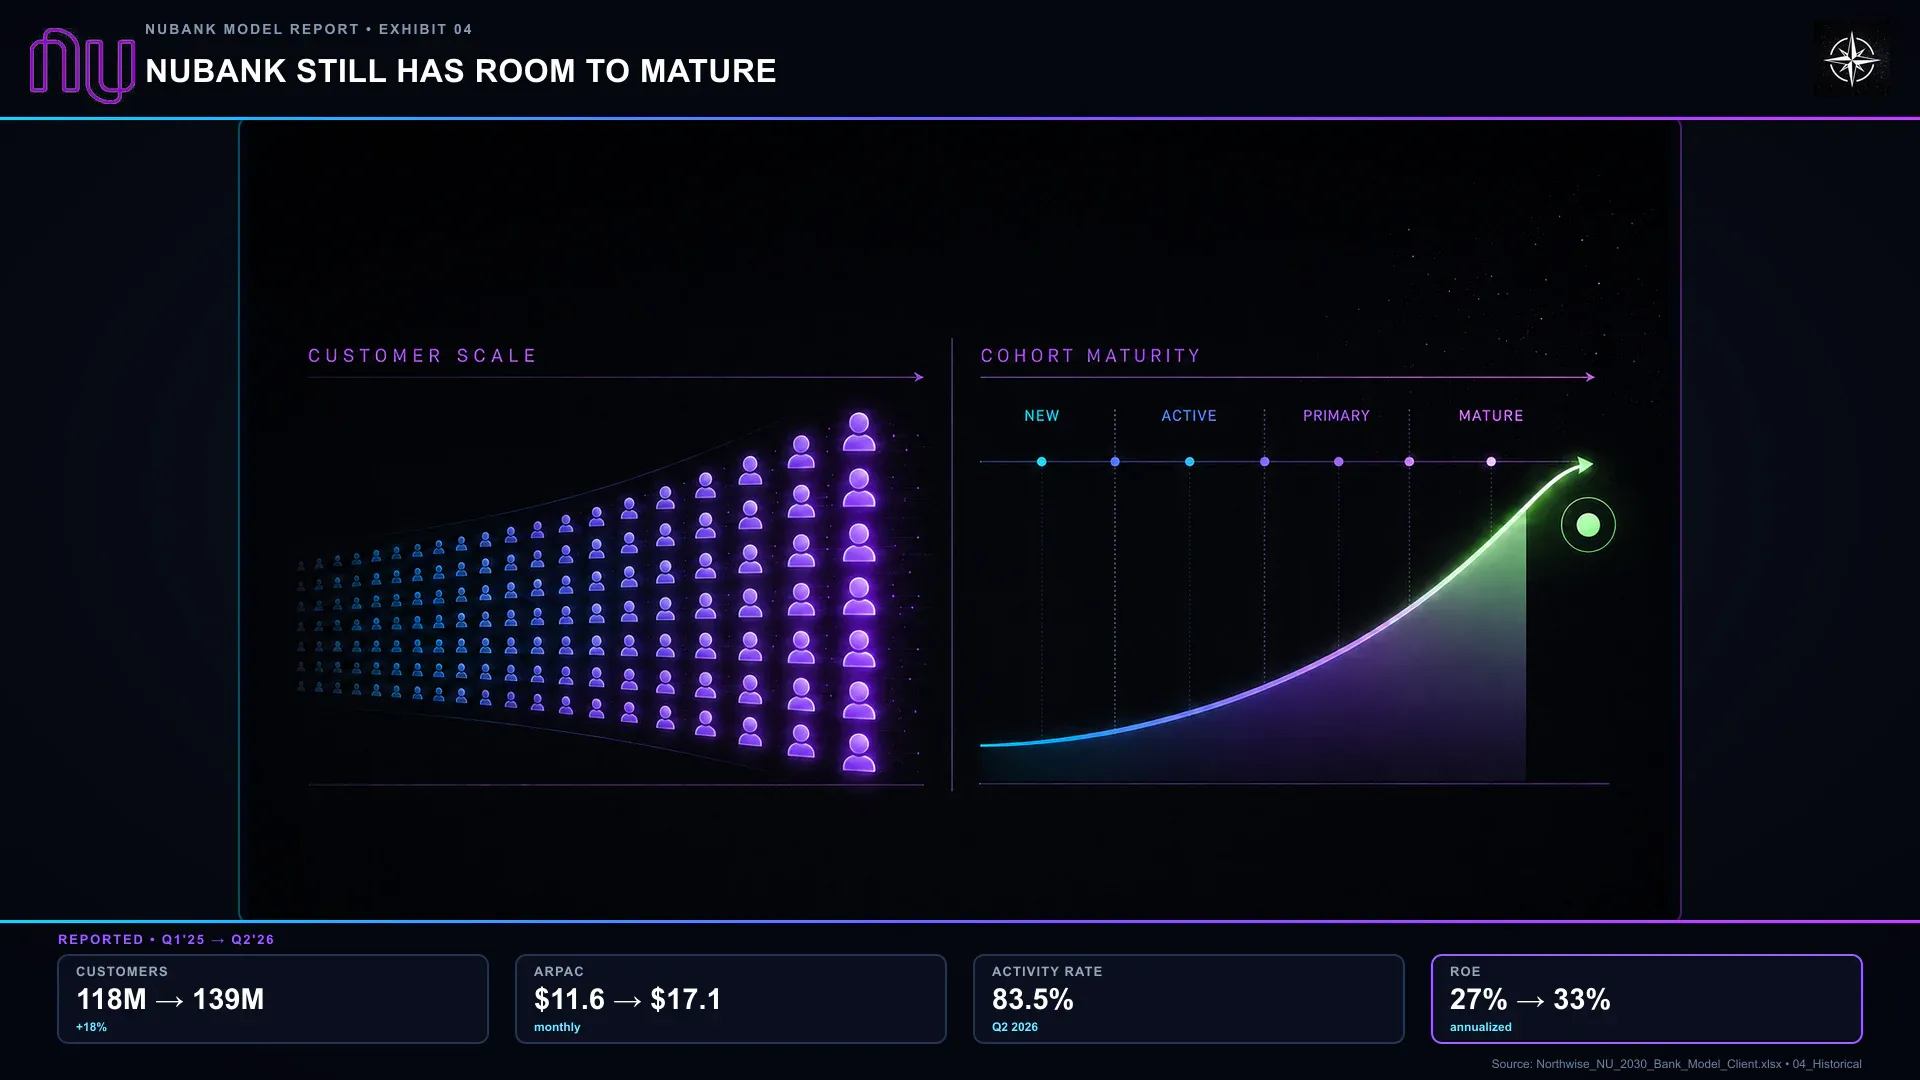
Nubank’s average active customer generated $17.10 of monthly revenue in Q2. The company calls this ARPAC, short for average revenue per active customer. It is not a monthly subscription charge. It averages interest, fees, and other income across customers whose relationships range from occasional payments to substantial deposits and borrowing. Someone using only basic services can generate very little, while a customer with several products can produce far more.
The older relationships offer an indication of what time can do. Nubank’s Q2 presentation showed $30.70 of monthly revenue for customers around 90 months into their relationship with the bank. That is not a guarantee that every newer customer follows the same path, but it helps explain why revenue can grow faster than customer count. The bank has already paid to establish the relationship; later products can make it more valuable without requiring a new acquisition campaign.
The cost of serving the customer does not necessarily increase at the same pace. Nubank reported approximately $1 of monthly cost to serve per active customer, a measure covering specified transaction and support expenses. It excludes funding costs, credit losses, corporate overhead, and taxes, so subtracting $1 from $17.10 does not produce customer profit. The useful point is that our hypothetical customer can move more of her financial life into the account without requiring another branch or a dedicated employee. Revenue growing faster than the expenses of running the organization is operating leverage, and it is an important part of Nubank’s earnings potential.
That advantage becomes more demanding when the next product is a loan. A savings account or another bill payment gives the bank more activity to process. A larger credit limit asks it to commit money against an estimate of what the customer will repay.
The Loan Begins With an Estimate
The customer sees an offer on her phone: an amount she can borrow, an interest rate, and a repayment schedule. Nubank sees a longer calculation. It must estimate the income it will collect, the cost of funding the loan, the expense of servicing it, and the amount that may never be repaid. It also needs enough capital to absorb losses that turn out worse than expected. The decision can be delivered quickly, but its quality will not be established until much later.
This delay is what makes fast-growing lenders difficult to judge. Interest begins accruing while the newest borrowers are still early in their repayment schedules. Accounting requires the bank to recognize expected losses, but that provision is an estimate rather than a completed collection record. The question is whether the eventual shortfall resembles the one used to approve the lending.
Nubank’s funded portfolio had three broad components at June 30: approximately $26 billion of credit-card receivables, $10.3 billion of unsecured loans, and $3.1 billion of secured lending. Cards remained the largest balance, but unsecured lending grew fastest, increasing 45% year over year after removing exchange-rate effects.

The products earn their income differently. Credit-card balances include purchases awaiting payment, installments, and borrowing carried beyond the payment date. Customers who pay in full do not generate the same interest as those who revolve a balance, which is why a quoted consumer borrowing rate cannot be applied to every dollar of card receivables. Our forecast uses an effective accounting yield across the average portfolio rather than the highest rate a borrower might be charged.
Unsecured loans have no specific collateral pledged to cover repayment. Nubank relies more heavily on the borrower’s finances, its pricing, and its ability to collect. Secured and payroll-linked products have additional protections, such as repayments deducted from income or other security arrangements. They generally exchange some yield for stronger collection characteristics, although changes in employment and problems with administration or recovery can still create losses. Nubank discloses several distinct products within the secured category, and the available information does not support treating each as an independently forecastable business.
The unsecured portfolio deserves close attention because its economics can look alarming or exceptionally attractive depending on which number an investor reads first. Our 2030 assumptions use a 60% effective accounting yield and an 18% gross write-off rate. A write-off removes an amount from the accounting balance when collection is no longer expected under the relevant policy. Money collected from such troubled exposure is a recovery. With recoveries equal to 20% of gross write-offs, the implied net charge-off rate is 14.4%.
There is a substantial difference between 60% of income and 14.4% of net charge-offs, but that difference is not profit. Funding, additional provisioning, servicing, taxes, and capital all have to be paid. High losses can therefore coexist with attractive lending economics, provided the bank charges enough and estimates the risk well. The investment becomes much less appealing when the losses arrive above the level on which the original price was based.
Trouble Can Appear Before a Missed Payment
Suppose our hypothetical customer’s income becomes less regular. Her savings decline, and she begins paying smaller portions of the card bill. These changes do not establish that she will default, but they may change the bank’s assessment of what it expects to collect. A lender that waits until the account is deeply overdue has lost the opportunity to respond earlier.
Under IFRS 9, the accounting standard governing expected credit losses, Nubank carries an allowance for estimated future shortfalls. The allowance reduces the accounting value of its credit assets and affects earnings through credit-loss expense; it is not a separate account containing cash. Exposures are classified according to how their risk has developed. Stage 1 generally covers performing accounts without a significant increase in credit risk and recognizes losses associated with defaults that could occur over the next 12 months. Stage 2 applies when risk has increased significantly and requires expected losses over the remaining life of the exposure. Stage 3 covers credit-impaired accounts, where evidence of repayment difficulty is more severe.
Those categories are not simply labels for the number of days a payment is late. An account can move into Stage 2 because its expected risk has worsened before it appears in the familiar late-delinquency figures. That makes the stage disclosures useful for examining a young, expanding portfolio.
Credit-quality measure | December 2025 | June 2026 |
|---|---|---|
Cards in Stage 2 | 10.1% | 11.9% |
Cards in Stage 3 | 9.1% | 9.1% |
Loans, excluding cards, in Stage 2 | 14.0% | 14.5% |
Loans, excluding cards, in Stage 3 | 6.2% | 8.3% |
Combined Stage 2 and Stage 3 exposure | About 19.5% | About 21.6% |
Total expected-loss allowance | $5.02B | $6.64B |
Source: Nubank’s Q2 financial statements. Balance comparisons are in reported U.S. dollars.
The sharper movement was in loans. Credit-impaired loan exposure increased from approximately $680 million to $1.12 billion in six months. This does not prove that management mispriced the portfolio, but it does identify where the scrutiny belongs. The category containing Nubank’s fastest-growing major lending product also experienced the more pronounced deterioration in its impaired share.
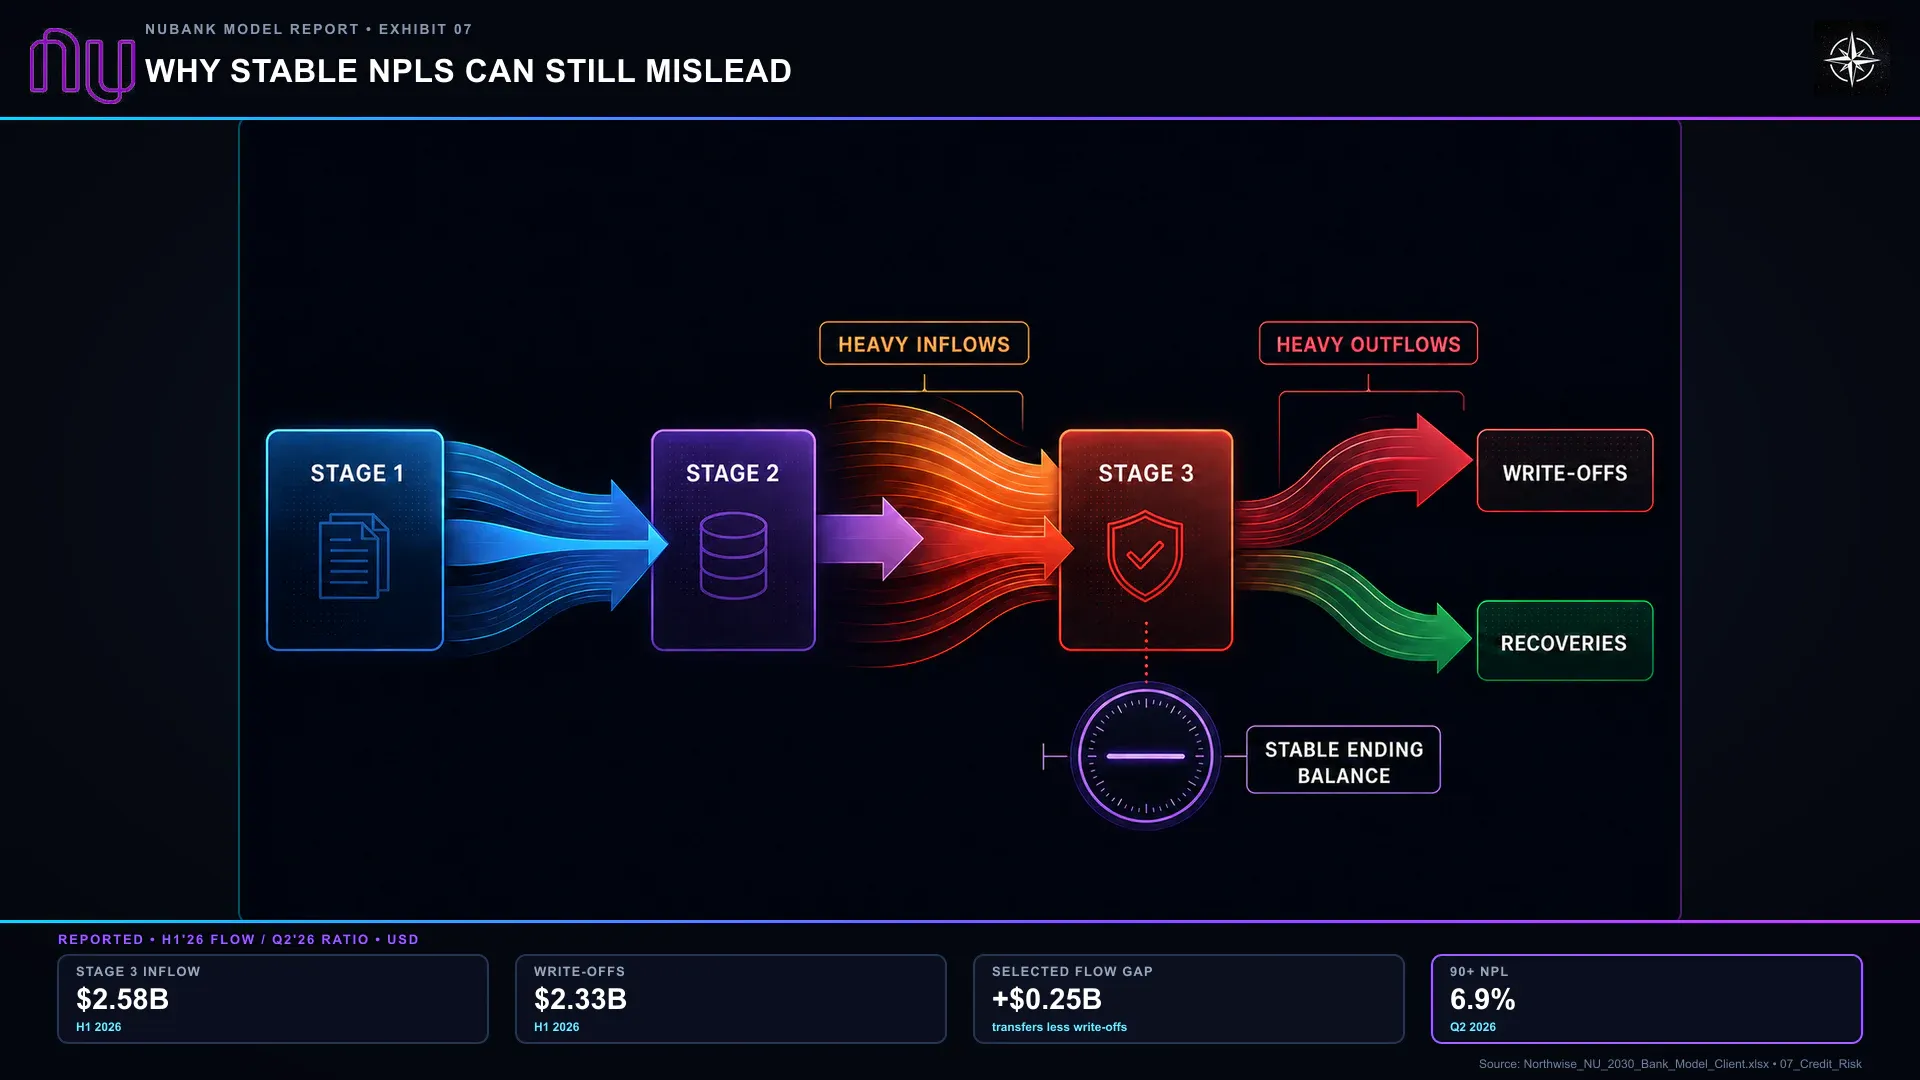
Cards appear more stable because the Stage 3 percentage remained at 9.1%. The movement underneath that percentage was considerable, however. During the first half, approximately $1.48 billion of card balances transferred into Stage 3 while $1.27 billion was written off. Loans experienced approximately $1.11 billion of transfers into Stage 3 and $1.06 billion of write-offs. These are selected movements rather than a complete reconciliation, since repayments, cures, interest, and exchange rates also affect the balances.
A write-off removes a balance from the total used to calculate the ending ratio. New lending enlarges that total before younger loans have had much time to become delinquent. Those effects can leave a stable-looking percentage even when many accounts are moving through difficulty. A cohort is a group of comparable customers; a vintage is a group of loans made during the same period. Following those groups at similar ages is more revealing than comparing two snapshots of a rapidly changing portfolio.
Nubank’s public disclosures let us identify the pressure and some of its causes. They do not allow an outside investor to reconstruct every loan vintage and pricing decision. That limitation is why we continue to examine stage migration, write-offs, recoveries, and income together, rather than accepting one favorable ratio as a complete verdict.

The Credit Customers Have Not Used Yet
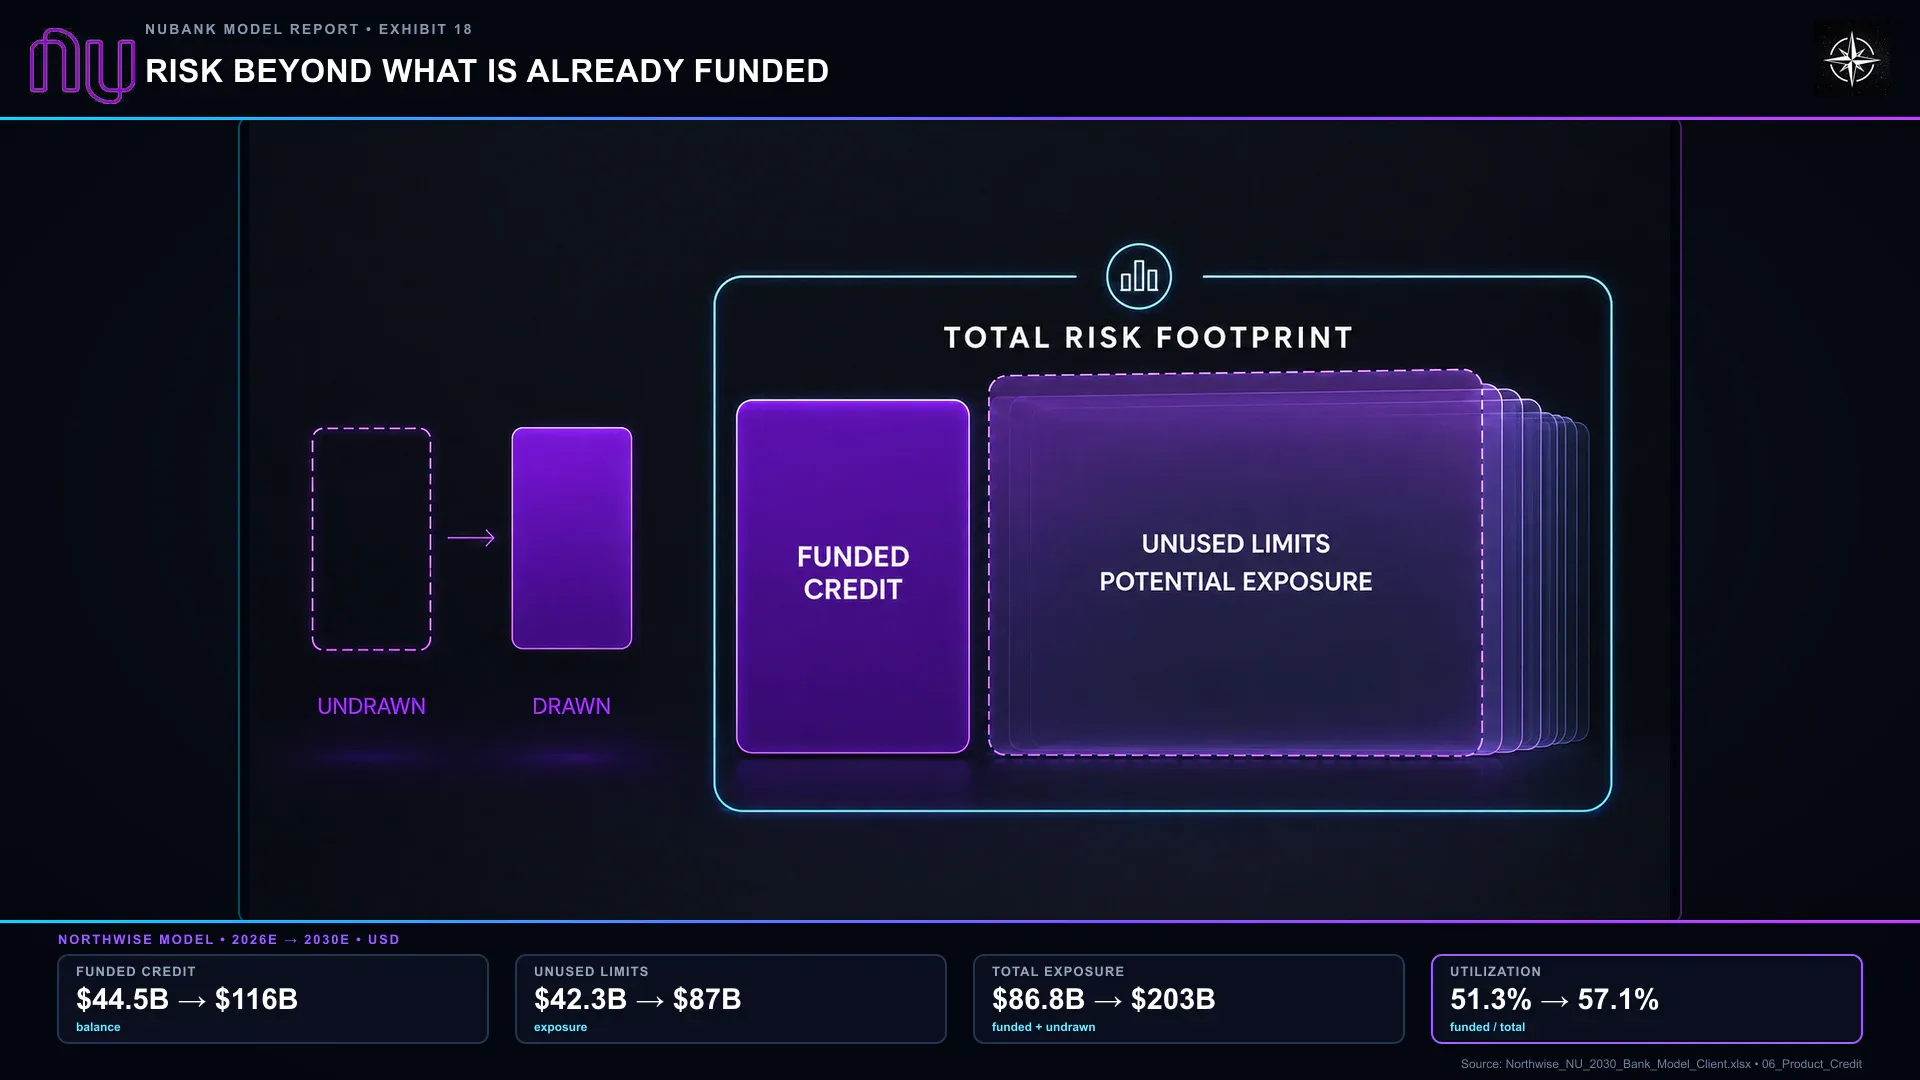
At June 30, Nubank also had approximately $38.2 billion of unused credit limits, almost as much as the funded portfolio itself. Combined funded credit and unused limits reached $77.6 billion. The financial statements explicitly include unused limits when measuring expected losses, because customers can use more of their available credit before the bank changes its assessment or reduces the limit.
For a customer whose income has become unreliable, the unused limit may be a way to cover a bill. For the bank, it can mean increasing exposure just as repayment capacity weakens. Not every limit will be drawn, and the full amount is not an immediate cash obligation, but managing this availability is part of underwriting. The decision made at account opening needs to be reconsidered as the relationship develops.
This is where Nubank’s information advantage should be useful. Seeing a change earlier creates an opportunity to respond earlier. Whether the company consistently uses that opportunity well is what the eventual repayment record must demonstrate.
Back to the Two Slides
The chart that prompted Pierry’s question divided Brazilian credit-card customers by income. It showed the percentage of balances more than 90 days overdue, commonly described as non-performing loans or NPLs. These balances represent serious repayment difficulty, although some money may eventually be collected.
Credit-card balances more than 90 days overdue | Nubank | Larger institutions, excluding Nu | Smaller institutions |
|---|---|---|---|
Mass market | 8.7% | 14.4% | 20.6% |
Super Core | 7.1% | 7.6% | 13.5% |
High income | 5.7% | 3.9% | 8.7% |
The comparison on page 20 of Nubank’s presentation ends in May 2026 and uses two-month rolling averages. It covers Brazilian credit cards, not the full consolidated lending portfolio.
The mass-market result supports the underwriting argument. Nubank’s delinquency ratio was materially below both comparison groups. The other rows show why we resist applying the same conclusion everywhere: Nubank was close to the larger institutions in Super Core and behind them in high income. The company appears especially effective where its primary-account relationships and customer information are most differentiated.
The broader chart included other products and countries, and its trend also changed when the bank increased lending to riskier groups. A simple illustration shows how this can happen without either group performing worse. If 80% of a portfolio has a 4% delinquency rate and the remaining 20% has a 10% rate, the blended ratio is 5.2%. Changing the mix to 60% and 40% raises it to 6.4%, even though both groups continue performing exactly as before.
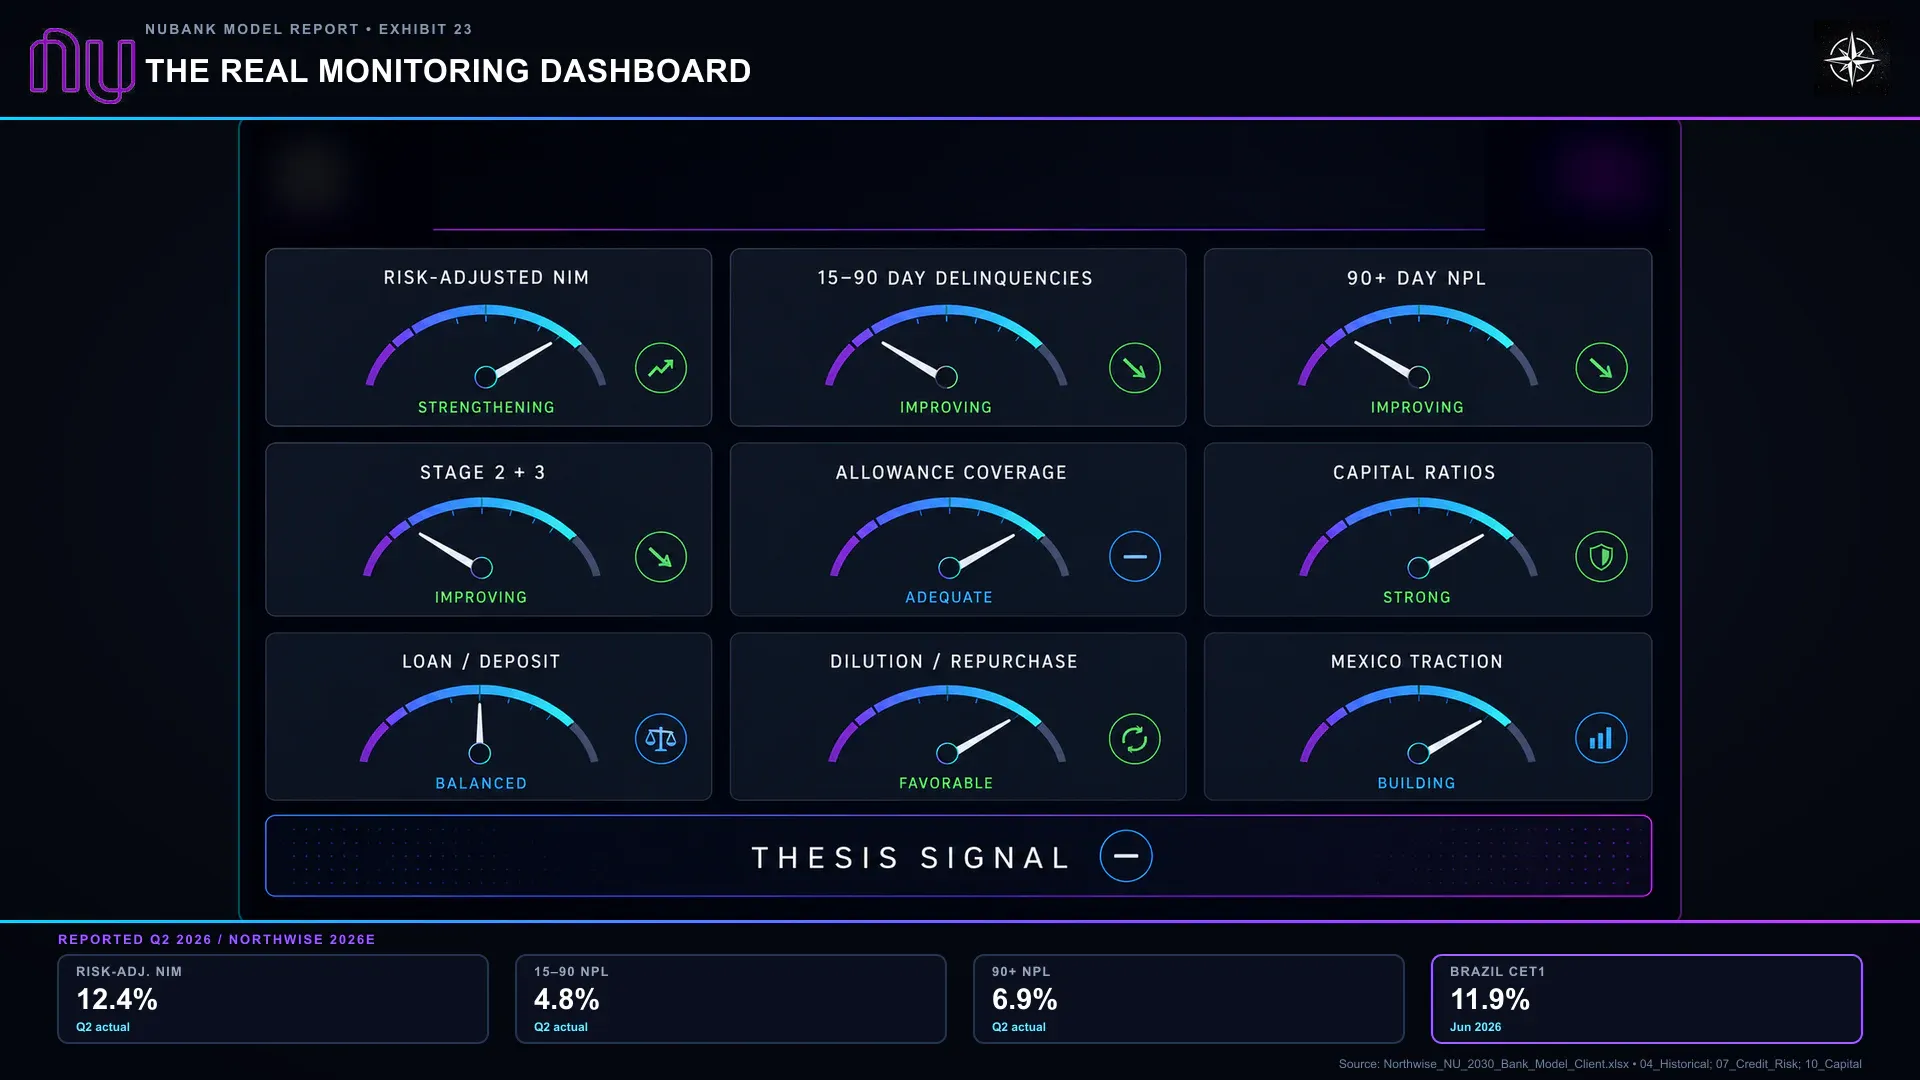
Management said this kind of intentional change was occurring. Its Q2 explanation attributed a 0.37-percentage-point improvement in early delinquencies to seasonality, partly offset by 0.24 percentage points from expansion into higher-risk customers. Early delinquencies ended at 4.8%, while balances more than 90 days late rose to 6.9% as earlier missed payments moved through the portfolio. Management also attributed $342 million of the quarter’s allowance increase to growth and another $170 million to deliberate risk expansion.
That explanation is credible and consistent with a bank recognizing higher expected losses as it takes more risk. It leaves an obligation for management to demonstrate that the additional income arrives as anticipated. We do not read the rising consolidated ratio as sufficient evidence that Nubank’s advantage has failed, but neither does the explanation make the outcome settled. The loans still have to repay well enough.
Why the Profits Rebounded
Q1’s growth also created a timing problem. Expected losses were recognized on new lending before most of the associated interest had been earned. Gross profit fell from $1.96 billion in Q4 to $1.88 billion in Q1, despite rising revenue. By Q2, more of those balances were producing income, credit cost had declined, and gross profit reached $2.44 billion. Net income rose from $871 million to $1.06 billion.
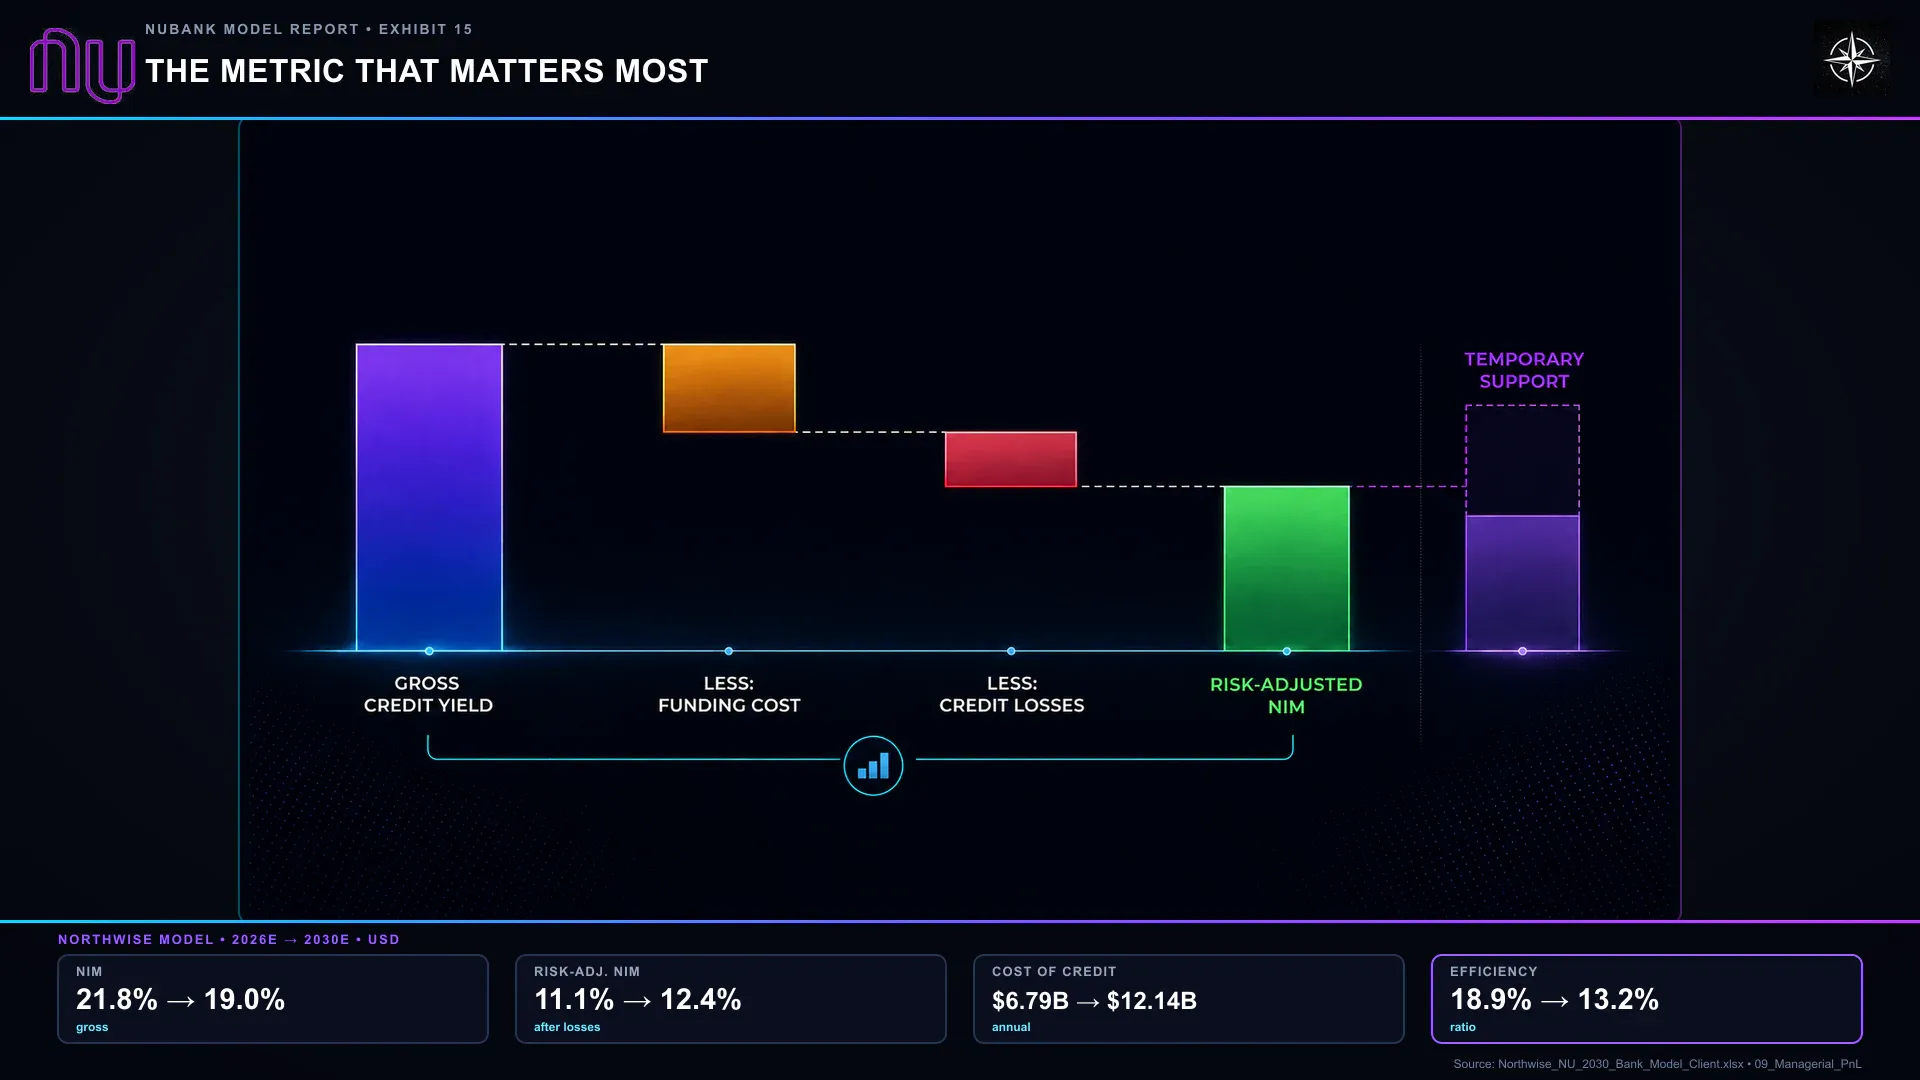
The improvement was most visible in risk-adjusted net interest margin. The bank earns interest on loans and non-credit investments, then subtracts interest paid on deposits and other funding to arrive at net interest income. Risk-adjusted margin subtracts credit cost as well and measures what remains relative to the relevant interest-earning assets. It therefore answers a more useful question than the lending rate alone: how much income survives both the funding bill and the estimated loss bill?
That annualized margin rose from 9.5% in Q1 to 12.4% in Q2. It was not a 12.4% return earned during three months, and operating expenses and taxes still remained to be paid. Nonetheless, the improvement provided evidence that some of the earlier credit expansion was beginning to produce the economics management expected.
Desenrola, a government debt-renegotiation program, also helped. Management said it reduced quarterly credit cost by approximately 5%. About one-third of the upside relative to its earlier margin expectations came from the program, while the remaining two-thirds came from underlying credit performance and earlier lending contributing more income. This was a statement about the surprise relative to expectations, not a claim that Desenrola explained one-third of the entire quarter-to-quarter improvement.
Nubank’s allowance remained substantial at approximately 244% of balances more than 90 days overdue. The allowance covers expected losses across performing, deteriorating, and impaired exposure, so it is not a cash reserve dedicated solely to today’s late balances. When a sufficiently provisioned loan is eventually written off, its entire value does not become a fresh expense again; the additional damage comes when losses exceed what was already recognized. The coverage provides useful evidence of preparation, while its adequacy still depends on the estimates beneath it.
Even management resisted treating the record margin as a guarantee. When Morgan Stanley’s Jorge Kuri asked about gaining confidence in a new floor, chief financial officer Rob Livingston replied, “I didn’t say that it was a floor. I said we’d be in that ballpark.” Our forecast takes that distinction seriously. Maintaining margins near Q2 levels requires recurring improvements to replace temporary support, and it leaves room for quarters that look less comfortable.
When the Customer Outgrows the Original Product
The hypothetical customer who joined for a simple card may want more from her bank several years later. Her income is higher, she has money to invest, and she compares rewards and borrowing terms rather than merely looking for an account that works. Nubank still has the relationship, but a competitor may be offering a better reason to move the more valuable business elsewhere.
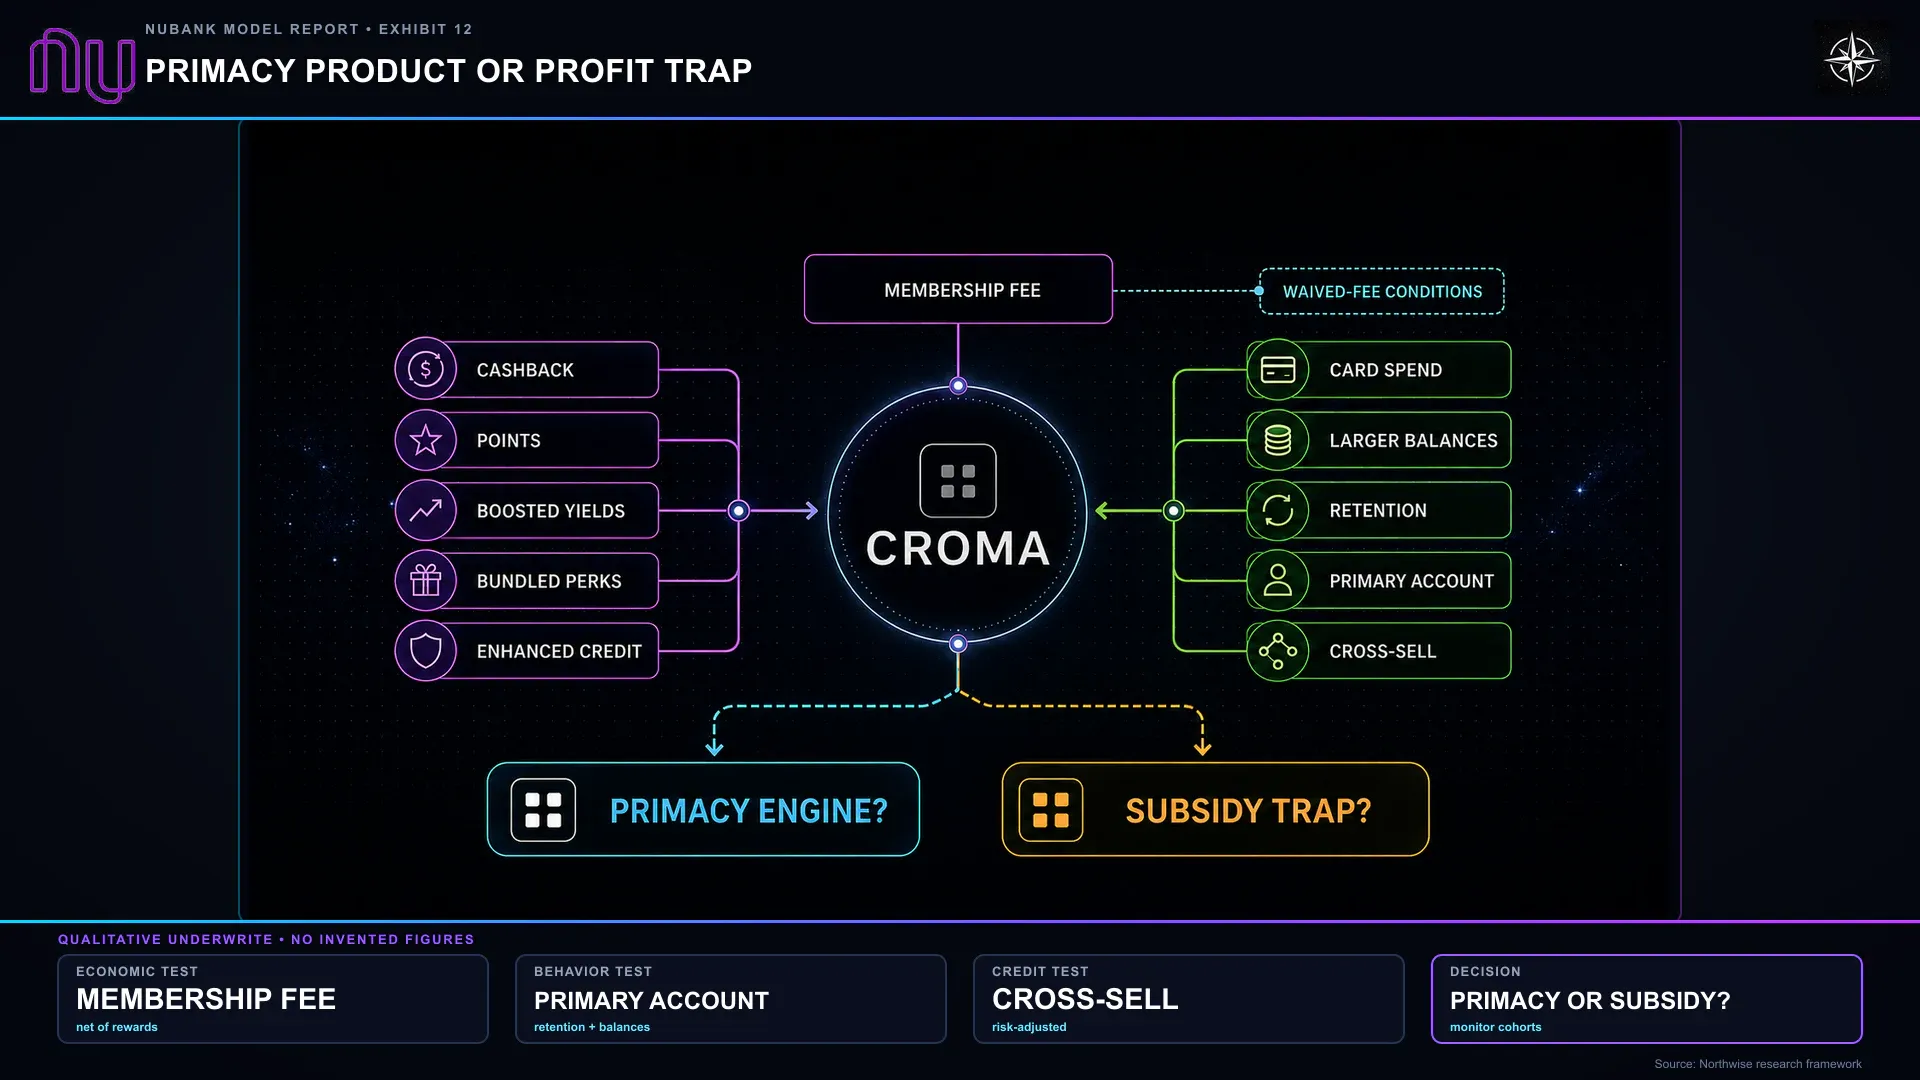
This is an important risk for a company with nearly 118 million Brazilian customers. It can succeed at acquiring people early in their financial lives and still fail to retain enough of the business they generate later. Management acknowledged on the Q2 call that Nubank’s brand had attracted millions of higher-income Brazilians before its products were ready to serve them well. Ultravioleta, its high-income offering, was one response. Croma, introduced in July for the segment between mass market and high income, was another.
Nubank calls that middle segment Super Core and estimates that it represents $23 billion of annual industry gross profit, compared with $21 billion for high income. Management places the wider Brazilian consumer and small-business opportunity at approximately $100 billion. These are estimates of the industry’s profit pool, not revenue Nubank can capture without competition, but they explain why the next stage of Brazilian growth can come largely from customers already using the company.
Croma’s terms make the strategy clear. The monthly fee is R$39, waived when customers spend at least R$4,000 on their credit-card bill or maintain R$30,000 saved or invested with Nubank. The package includes 0.8% cashback, selected subscription benefits, and enhanced savings products. Here, R$ denotes Brazilian reais. The company is prepared to forgo the membership payment when the customer brings enough financial activity. (Nu International)
A customer paying no membership fee can still be attractive if she moves enough spending, deposits, investments, and borrowing across. Someone collecting the rewards while keeping most business elsewhere may be much less valuable. We include Croma’s expected contribution within Brazilian customer revenue, deposits, fees, and expenses rather than treating membership payments as a separate major business. Its success depends on whether additional customer activity covers the cost of the benefits.
Ultravioleta provides an early indication of deeper use. Management reported nearly one million customers, with purchase volume up 41% and assets under custody up 37% year over year. Assets under custody are customer investments held or administered through the platform, not assets owned by Nubank or automatically available to fund loans. Those relationships can improve the business through spending, investments, deposits, and retention even where Nubank does not have the best credit performance against every competitor.
Small businesses offer a related opportunity. Nubank served 6.8 million businesses in Q2, approximately one-third of the market described by management. An owner who already trusts the personal account is a logical prospect for payments, business deposits, cards, and working-capital lending. The credit still needs separate care because business cash flow and collection prospects differ from household finances. Current disclosure supports including the opportunity within broader forecasts, but not claiming a precise standalone small-business earnings estimate.
The Relationship Reaches Checkout
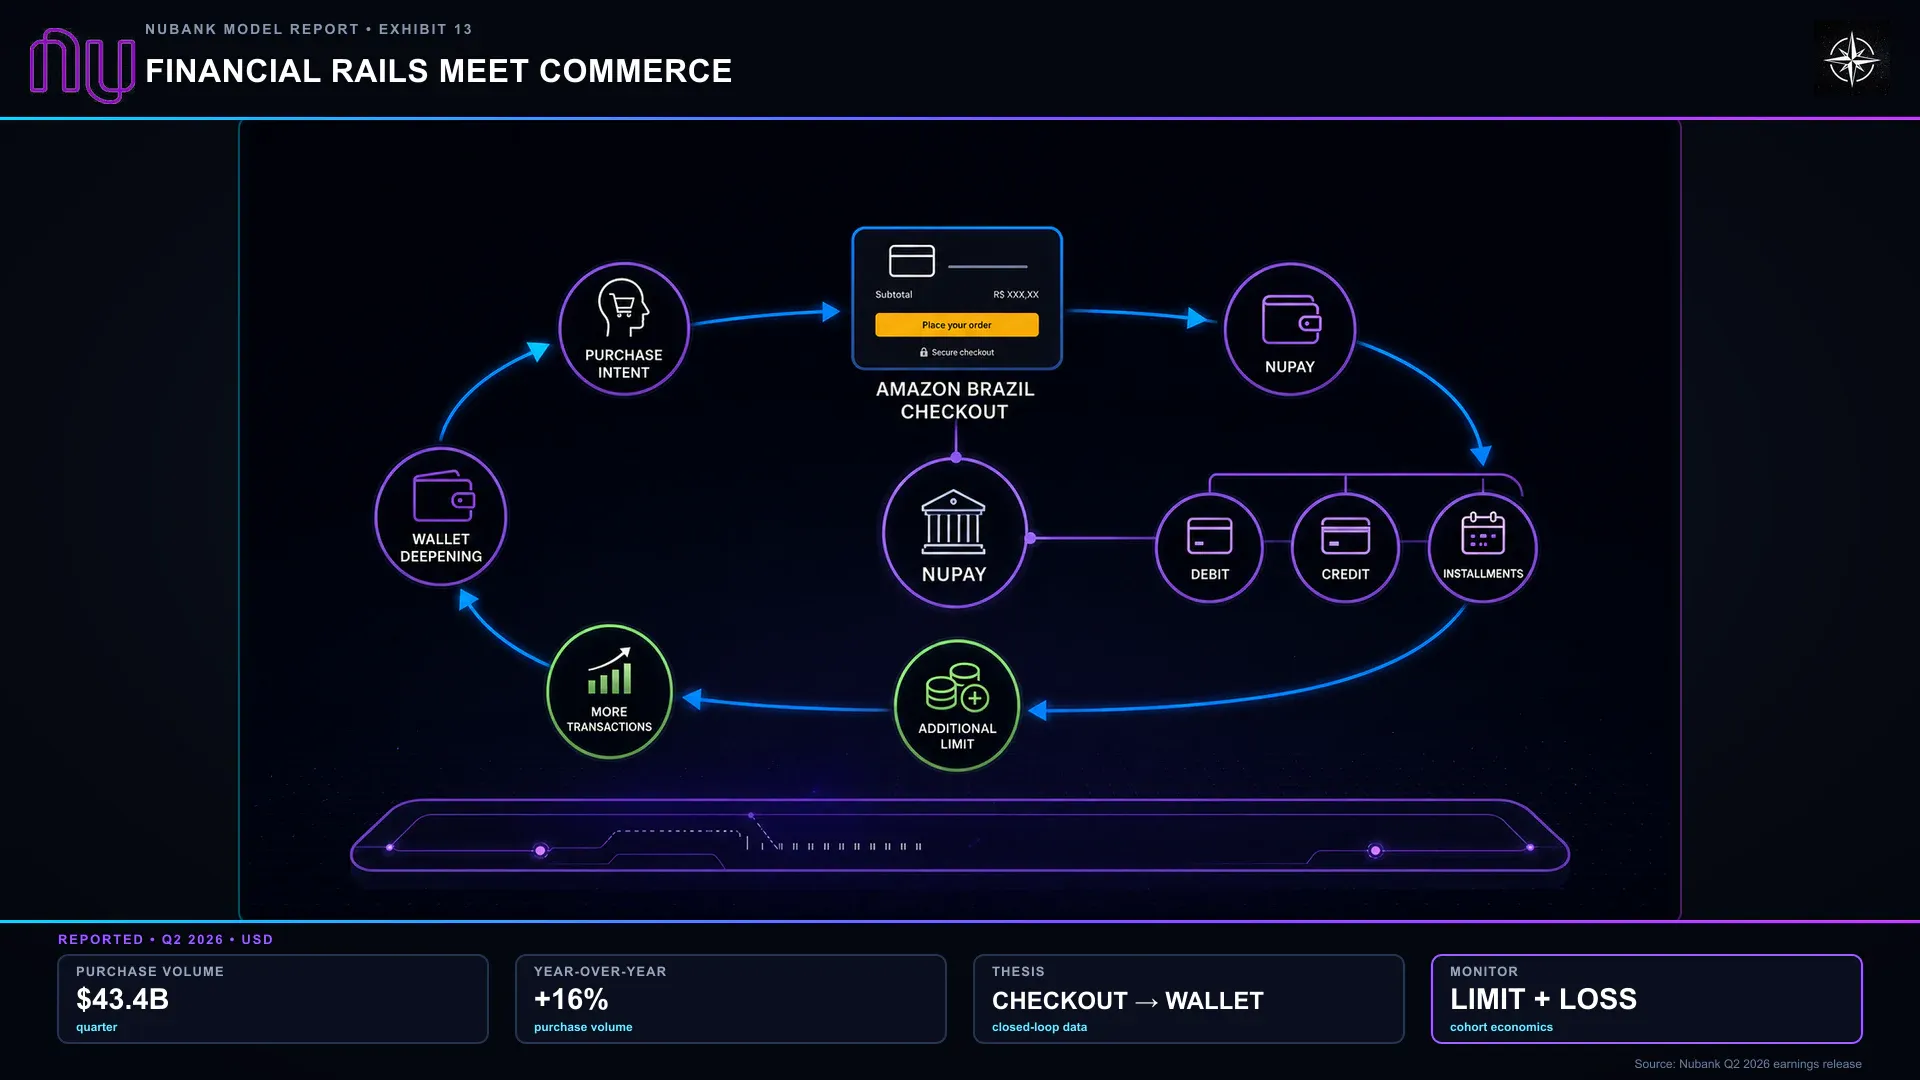
The next offer may appear somewhere the customer is already shopping. Nubank’s expanded NuPay integration at Amazon Brazil, announced June 30, offers debit, one-time credit, interest-free installments up to 12 payments, interest-bearing installments up to 18, and eligible additional-limit purchases up to 24. The customer can choose how to pay without leaving checkout to begin a separate borrowing process. (Nu International)
For Nubank, this places payment and lending services at a moment of existing demand. It also extends the credit question into another setting: extra purchasing capacity may be especially attractive to someone whose ordinary limit is insufficient. The relevant financial result is what remains after transaction costs, funding, and losses, rather than how much purchasing volume the integration generates.
This brings Nubank into closer competition with Mercado Pago, MercadoLibre’s financial-services business. Our view is that the two approach the customer from different starting points: Mercado Pago through commerce and payments, Nubank through an established banking relationship. Both can build substantial businesses, but their overlap means more competition for the spending, deposits, and information each wants to retain.
For the forecast, the new products share one purpose: increasing the business earned from each relationship. Their effects appear in the customer-revenue assumptions and the costs incurred to produce that revenue. We do not add a separate valuation for the same opportunities after including them in earnings.
Mexico Gets Its Turn at Payday
A Mexican customer may be familiar with Nubank’s purple card while still keeping most financial activity outside the institution. Until recently, the business had fewer tools to compete for her entire account. That changed when it began operating as a full bank on August 6, following the license granted in April 2025 and final operating authorization in July 2026. The completed transition supports payroll direct deposits, broader credit, greater deposit-insurance coverage, and additional customer segments.
Payroll is valuable for the same reason it matters in Brazil. Income arriving regularly creates funding, encourages recurring payments, and gives the bank more information before it offers additional credit. Higher deposit-insurance coverage can also help customers become comfortable holding larger balances. The license itself does not generate earnings; the opportunity lies in the behavior those capabilities allow Nubank to develop.
By the end of July, the Mexican business had 16 million customers. According to the company, 35% had never held a bank account before joining Nu, and 52% had never held a credit card. Customers were spread across 98% of municipalities. That reach demonstrates demand for the product while also describing a relatively young population of formal banking relationships. Owning an account does not mean every payment, saving decision, or borrowing need has moved into it.
The early economics suggest Mexico can mature faster than Brazil did. At roughly the same level of adult penetration, Mexican customers generated $12.30 of monthly revenue compared with $5.60 for Brazil in 2020, after the company adjusted the Brazilian figures for inflation and exchange rates. Mexico also had more interest-earning credit, more deposits, and lower servicing cost at that comparable stage. Existing technology and operating experience mean the business does not have to build every capability from the beginning.
Mexico reached break-even in approximately six years, compared with eight in Brazil. We give that progress meaningful weight, but the distance between initial profitability and mature economics remains substantial. Our Base case reaches 40 million Mexican customers and approximately $7.65 billion of annual revenue in 2030. That is less than one-fifth of the Brazilian forecast and well below management’s discussion of a possible long-term Mexican business equal to 60% to 70% of Brazil’s scale.
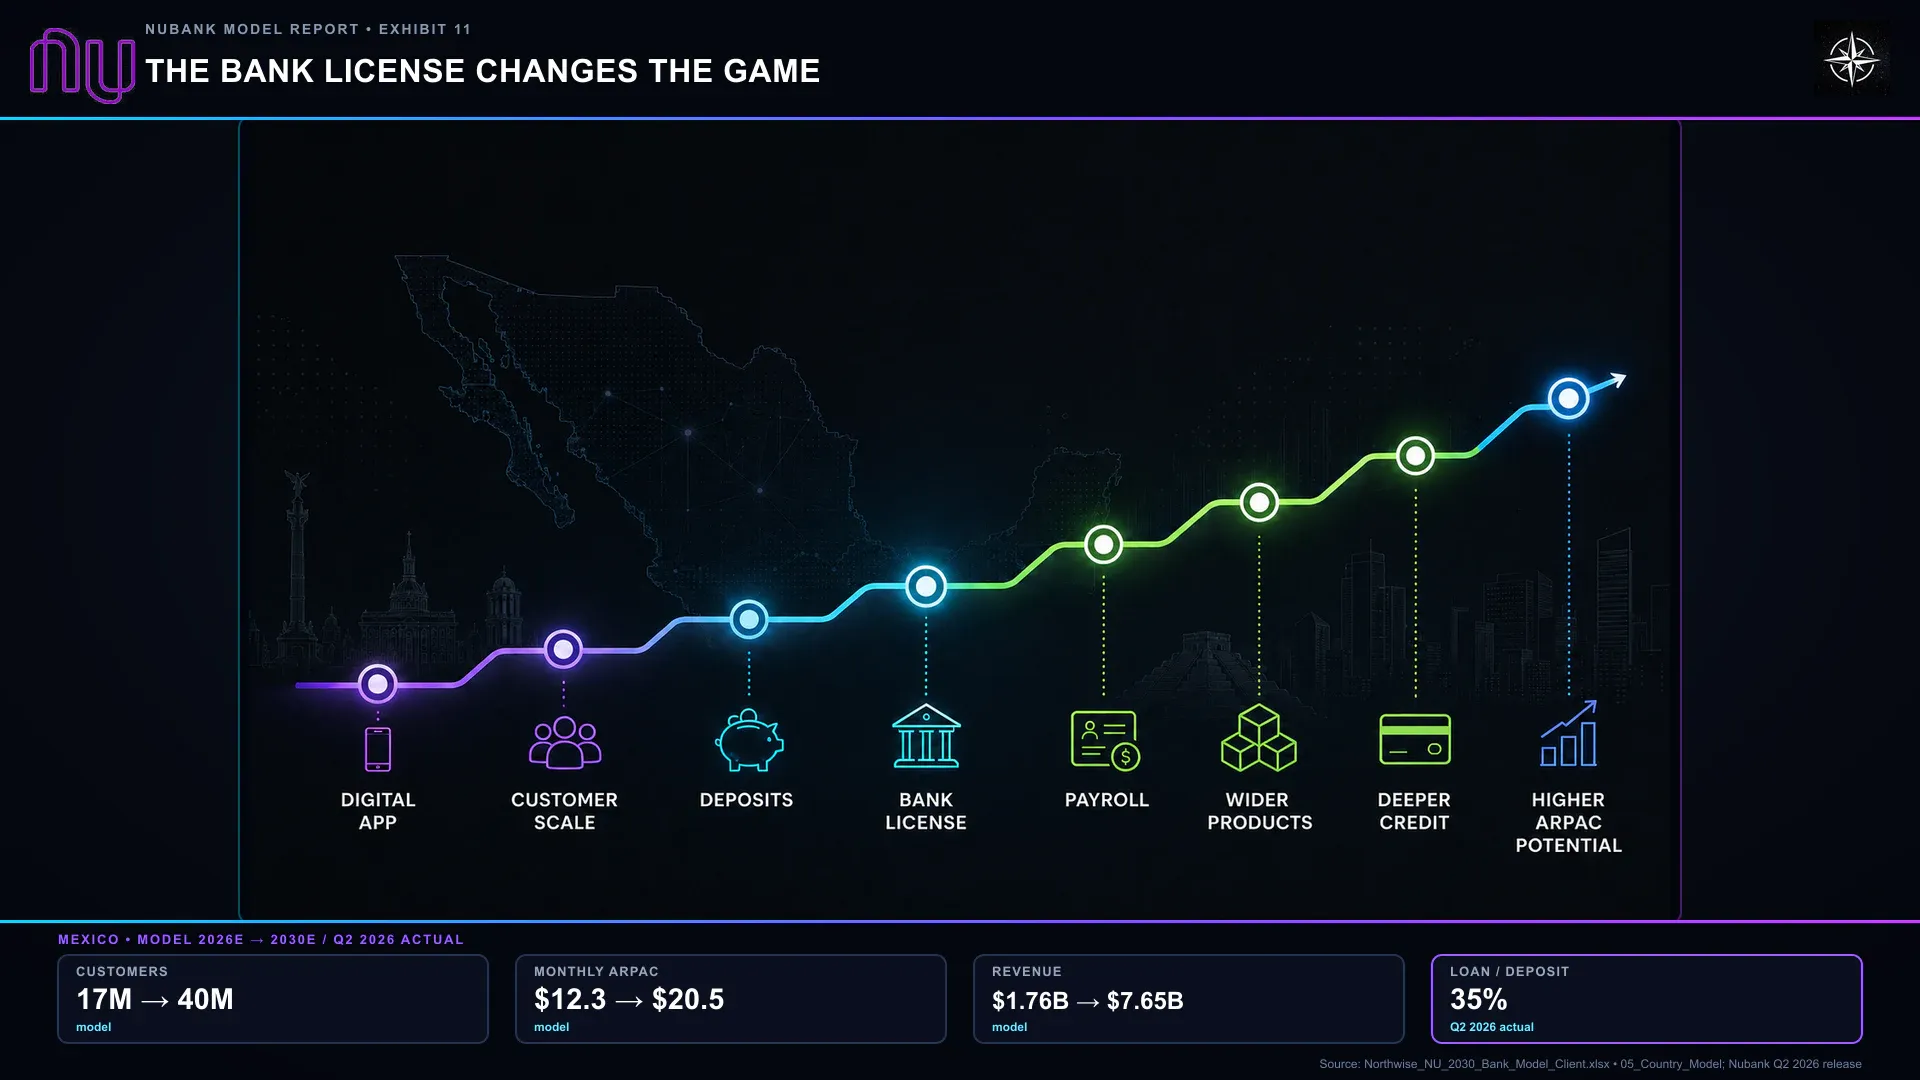
One Q2 development that might look disappointing in isolation was a modest decline in Mexican deposits. Management was reducing expensive funding rather than trying to maximize the balance, and the local loan-to-deposit ratio remained around 35%. We regard that as a useful sign of discipline. Promotional deposits can help establish a relationship, but paying to retain surplus balances merely for the appearance of growth can consume the return the bank is trying to build.
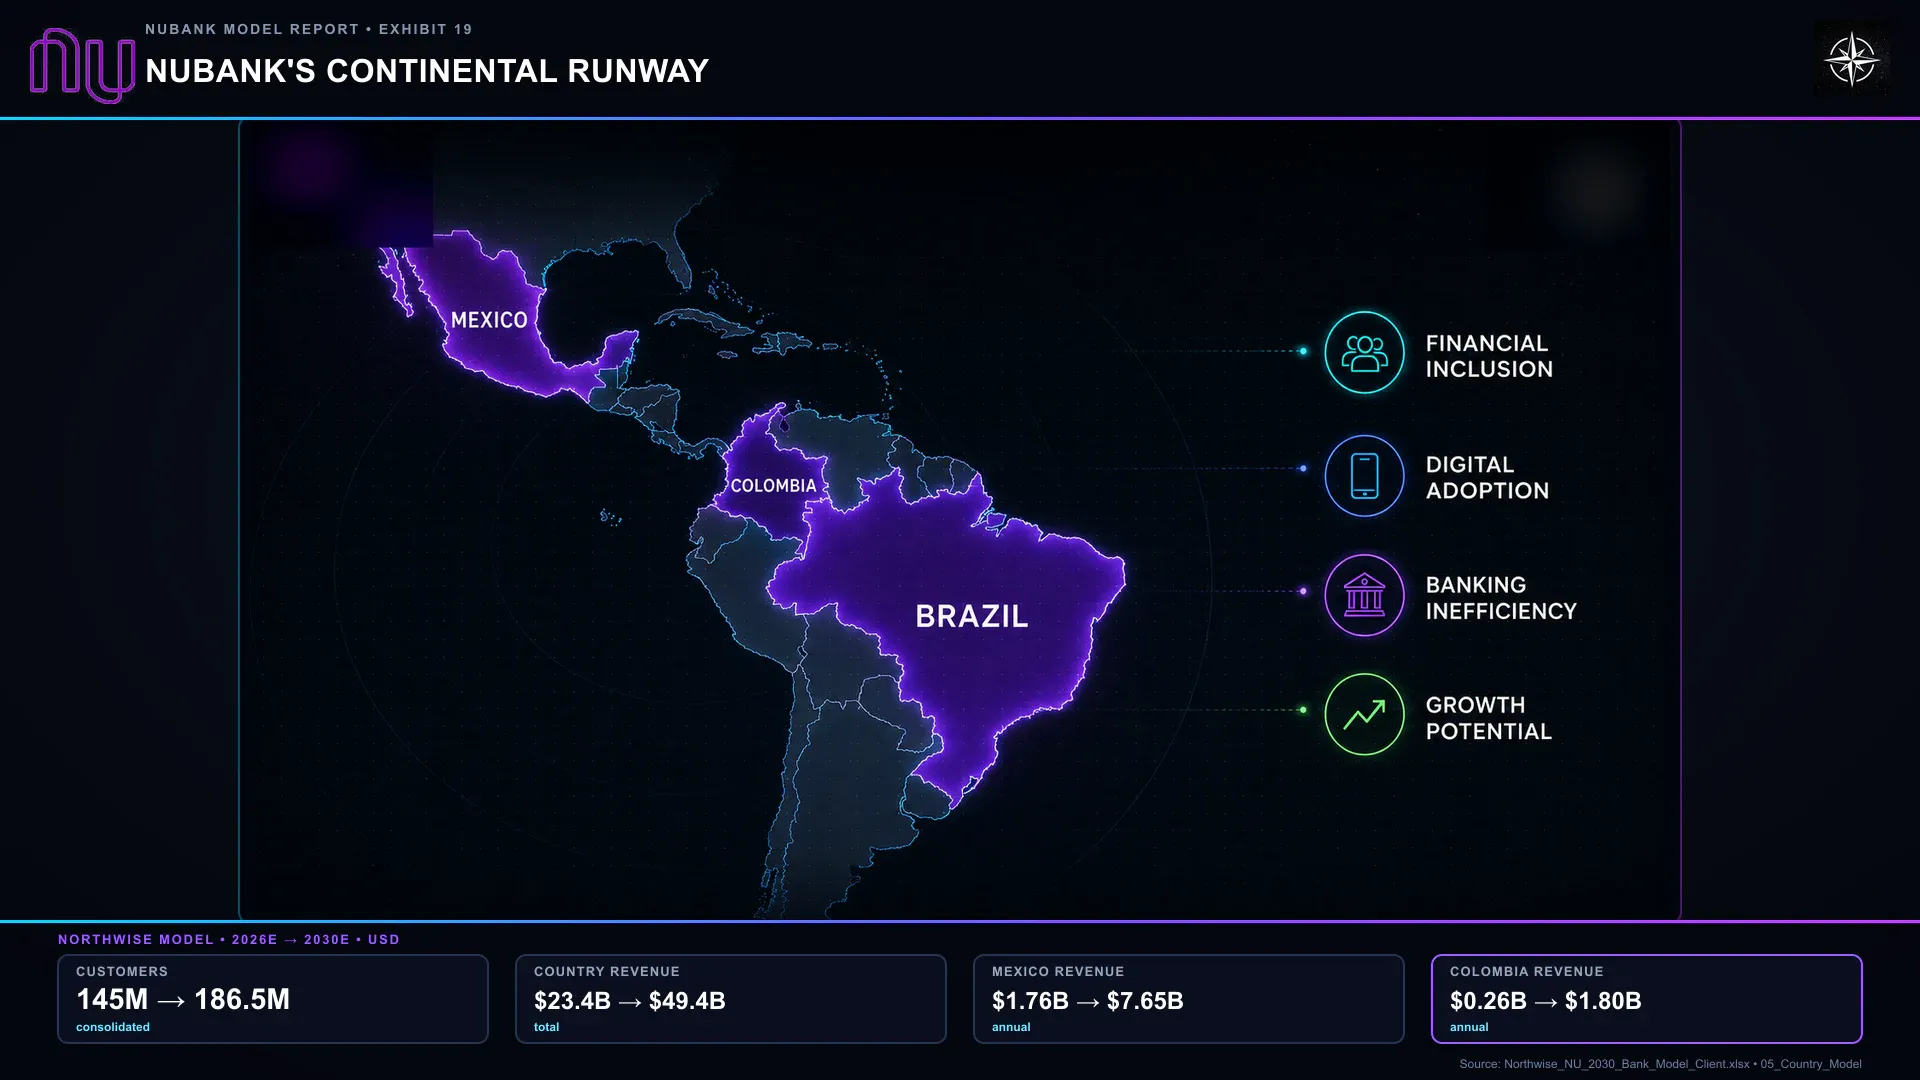
Colombia follows the same broad progression at an earlier stage. It had more than five million customers and approximately $3.3 billion of deposits in Q2. Our forecast reaches 14.5 million customers and approximately $1.8 billion of annual revenue by 2030, a meaningful business but a small share of the group. Success there would strengthen the evidence that Nubank can adapt its products and operating practices across different regulatory and consumer environments. Its lending history is younger, which is why we give it a smaller role in the earnings forecast.
The Country Forecast
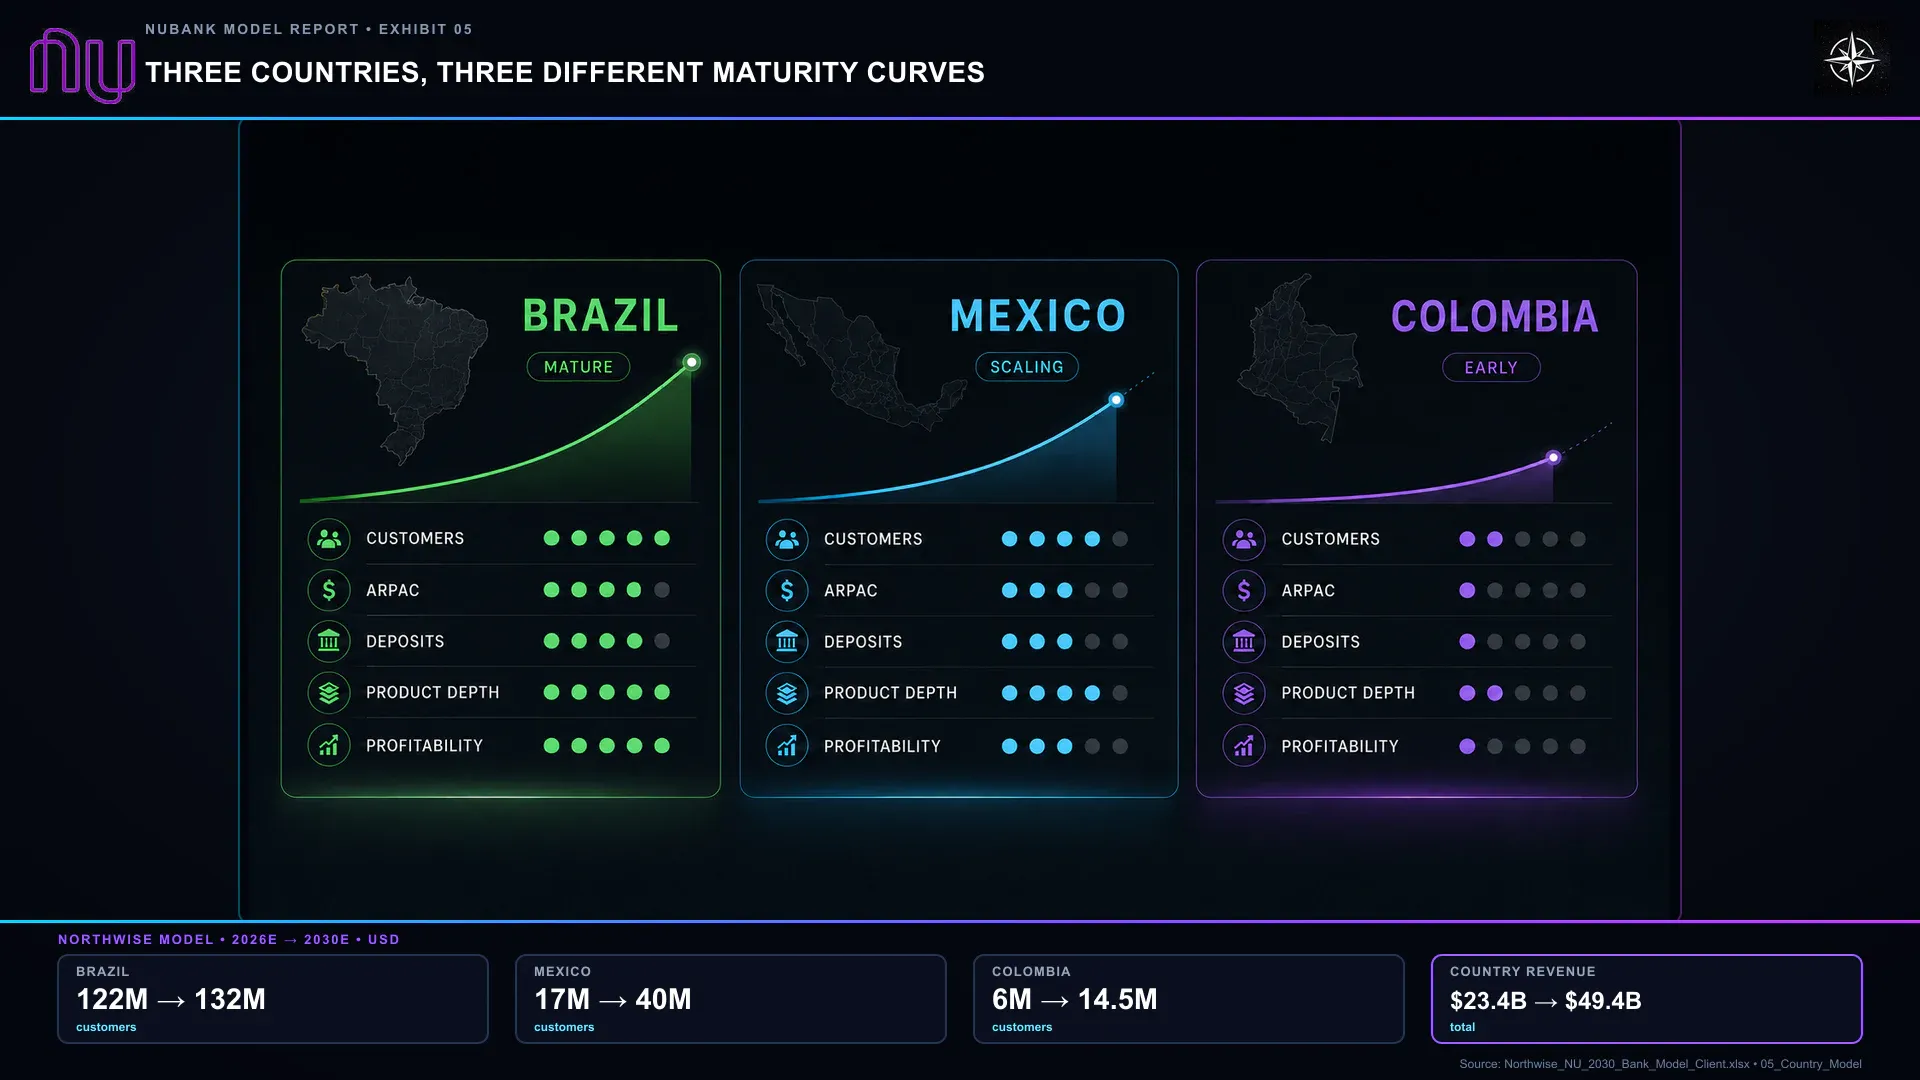
The projections below follow the relationships rather than simply extending current revenue growth. Customer additions slow in Brazil, where most of the increase comes from deeper use. Mexico provides more new customers, while Colombia contributes from a smaller base. The activity rate is the proportion of customers actively using the platform, and annual revenue uses average active customers rather than assuming every year-end account contributed twelve months of business.
Northwise country assumptions | 2026 | 2027 | 2028 | 2029 | 2030 |
|---|---|---|---|---|---|
Brazil ending customers | 122.0M | 125.0M | 127.5M | 130.0M | 132.0M |
Brazil activity rate | 86.5% | 87.0% | 87.5% | 88.0% | 88.5% |
Brazil monthly ARPAC | $17.40 | $19.50 | $22.30 | $25.30 | $28.70 |
Brazil revenue | $21.33B | $25.14B | $29.56B | $34.40B | $39.93B |
Mexico ending customers | 17.0M | 22.0M | 28.0M | 34.0M | 40.0M |
Mexico activity rate | 80.0% | 81.0% | 82.0% | 83.0% | 84.0% |
Mexico monthly ARPAC | $12.30 | $14.00 | $16.00 | $18.00 | $20.50 |
Mexico revenue | $1.76B | $2.65B | $3.94B | $5.56B | $7.65B |
Colombia ending customers | 6.0M | 9.5M | 12.0M | 13.0M | 14.5M |
Colombia activity rate | 75.0% | 77.0% | 78.5% | 80.0% | 81.0% |
Colombia monthly ARPAC | $5.80 | $7.50 | $9.50 | $11.50 | $13.50 |
Colombia revenue | $0.26B | $0.54B | $0.96B | $1.38B | $1.80B |
Total ending customers | 145.0M | 156.5M | 167.5M | 177.0M | 186.5M |
The country estimate reaches $49.38 billion of revenue in 2030, close to the $49.72 billion produced by the product-level forecast later in the report. The two approaches remain within approximately 1.5% across the period. This provides a useful check on whether the lending and funding assumptions imply a plausible level of customer business, although both approaches depend on our judgment.
These are Northwise geographical estimates. Nubank reports one operating segment, and its IFRS geographical income disclosure covers fewer categories than total managerial revenue. The allocations should not be read as company-reported country income statements.
Who Decides to Raise the Limit?
As the business expands, Nubank has to make more decisions about people whose needs and circumstances keep changing. A customer has paid reliably for a year and requests a larger limit. Another begins accumulating savings. A third applies for a personal loan shortly after income becomes less regular. Each is an opportunity to offer something useful, make a costly mistake, or decline business that looked attractive at first glance.
NuFormer, Nubank’s artificial-intelligence model for financial behavior, is intended to help with those decisions. The company describes a shared foundation that can support several applications, rather than rebuilding a separate understanding of the customer for each product. The same behavioral information can inform repayment estimates, recommendations, and customer service. Disclosed deployments included Brazilian cards and unsecured lending and Mexican cards, with testing in small-business and Colombian credit cards.
The potential gains are substantial at this scale, but they can be used in different ways. Nubank could approve the same amount of credit with fewer losses, or approve more profitable customers while holding expected losses steady. It could improve pricing, reduce irrelevant marketing, or give some of the benefit back through better products. Assuming the maximum gain in every category would overstate what one improvement can accomplish.
Management addressed that trade-off on the earnings call. Better optimization does not necessarily mean minimizing the next quarter’s costs. In markets and segments where Nubank still wants to grow, it may reinvest the benefit in a more competitive customer offer. That is consistent with the company’s strategy, and it prevents us from translating every reported AI improvement directly into higher near-term profit.
There is already a visible operating use. Management reported that AI agents handled more than 60% of Brazilian customer-support chat volume, with customer ratings at or above human parity. The scope is specific to Brazilian chat, not every customer interaction in every country. The underwriting claim takes longer to establish because improved predictions can encourage additional risk-taking before the newest loans have completed their repayment cycle.
Our forecast includes gradual improvements in loss rates and operating efficiency without creating a separate AI revenue stream. NuFormer’s value has to appear in the banking results. Some of its most useful decisions may prevent loans from being offered at all, an outcome that produces no revenue announcement but can still improve what shareholders ultimately earn.

There Is a Second Approval Behind Every Loan
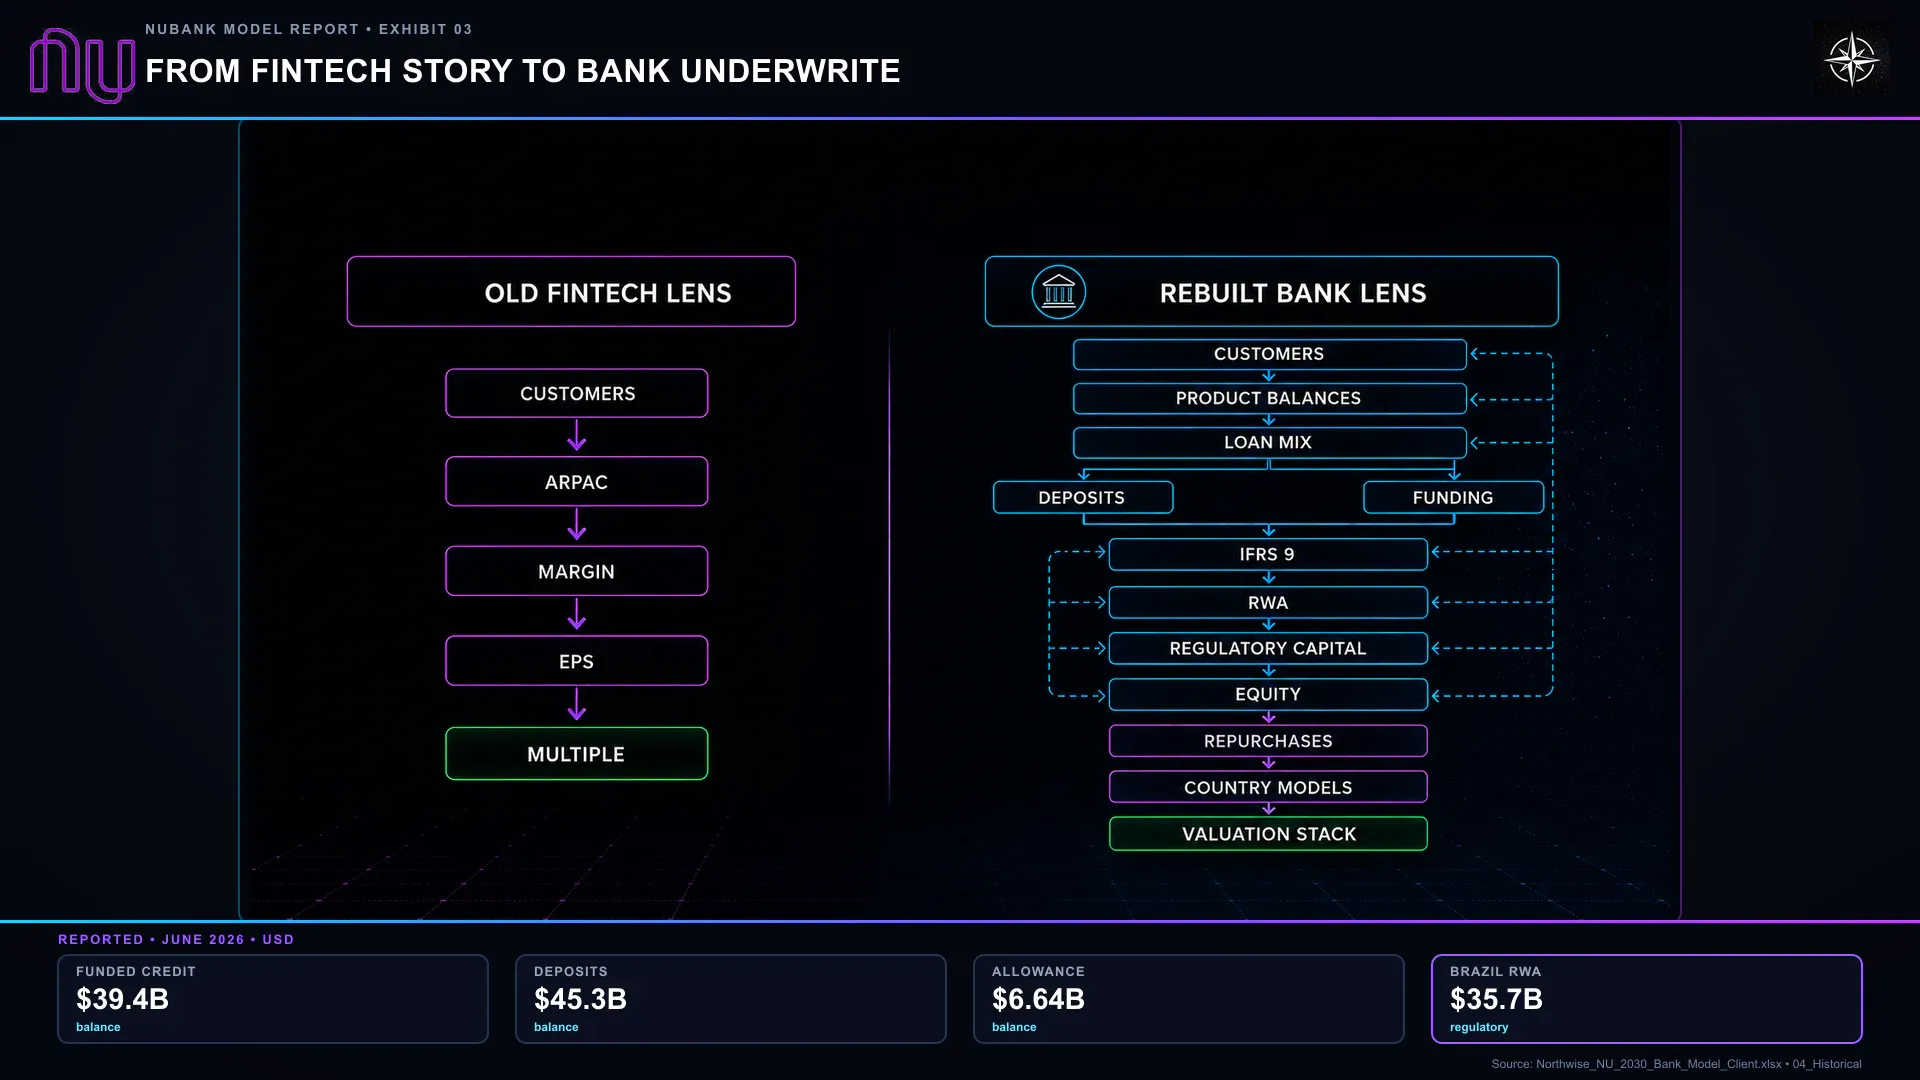
A loan with an attractive expected return still needs funding and capital. The distinction matters because a bank can have plenty of customer deposits and willing borrowers while lacking the capital required to expand at the desired pace.
A deposit is a liability for Nubank because the bank owes that money to the customer. A loan is an asset because the borrower owes Nubank. Funding supplies the money that supports assets and meets payments; shareholder equity is the accounting value left after liabilities are deducted. Regulatory capital is the financial capacity supervisors recognize as available to absorb losses under their rules. It protects against outcomes worse than the bank’s expected-loss allowance anticipates.
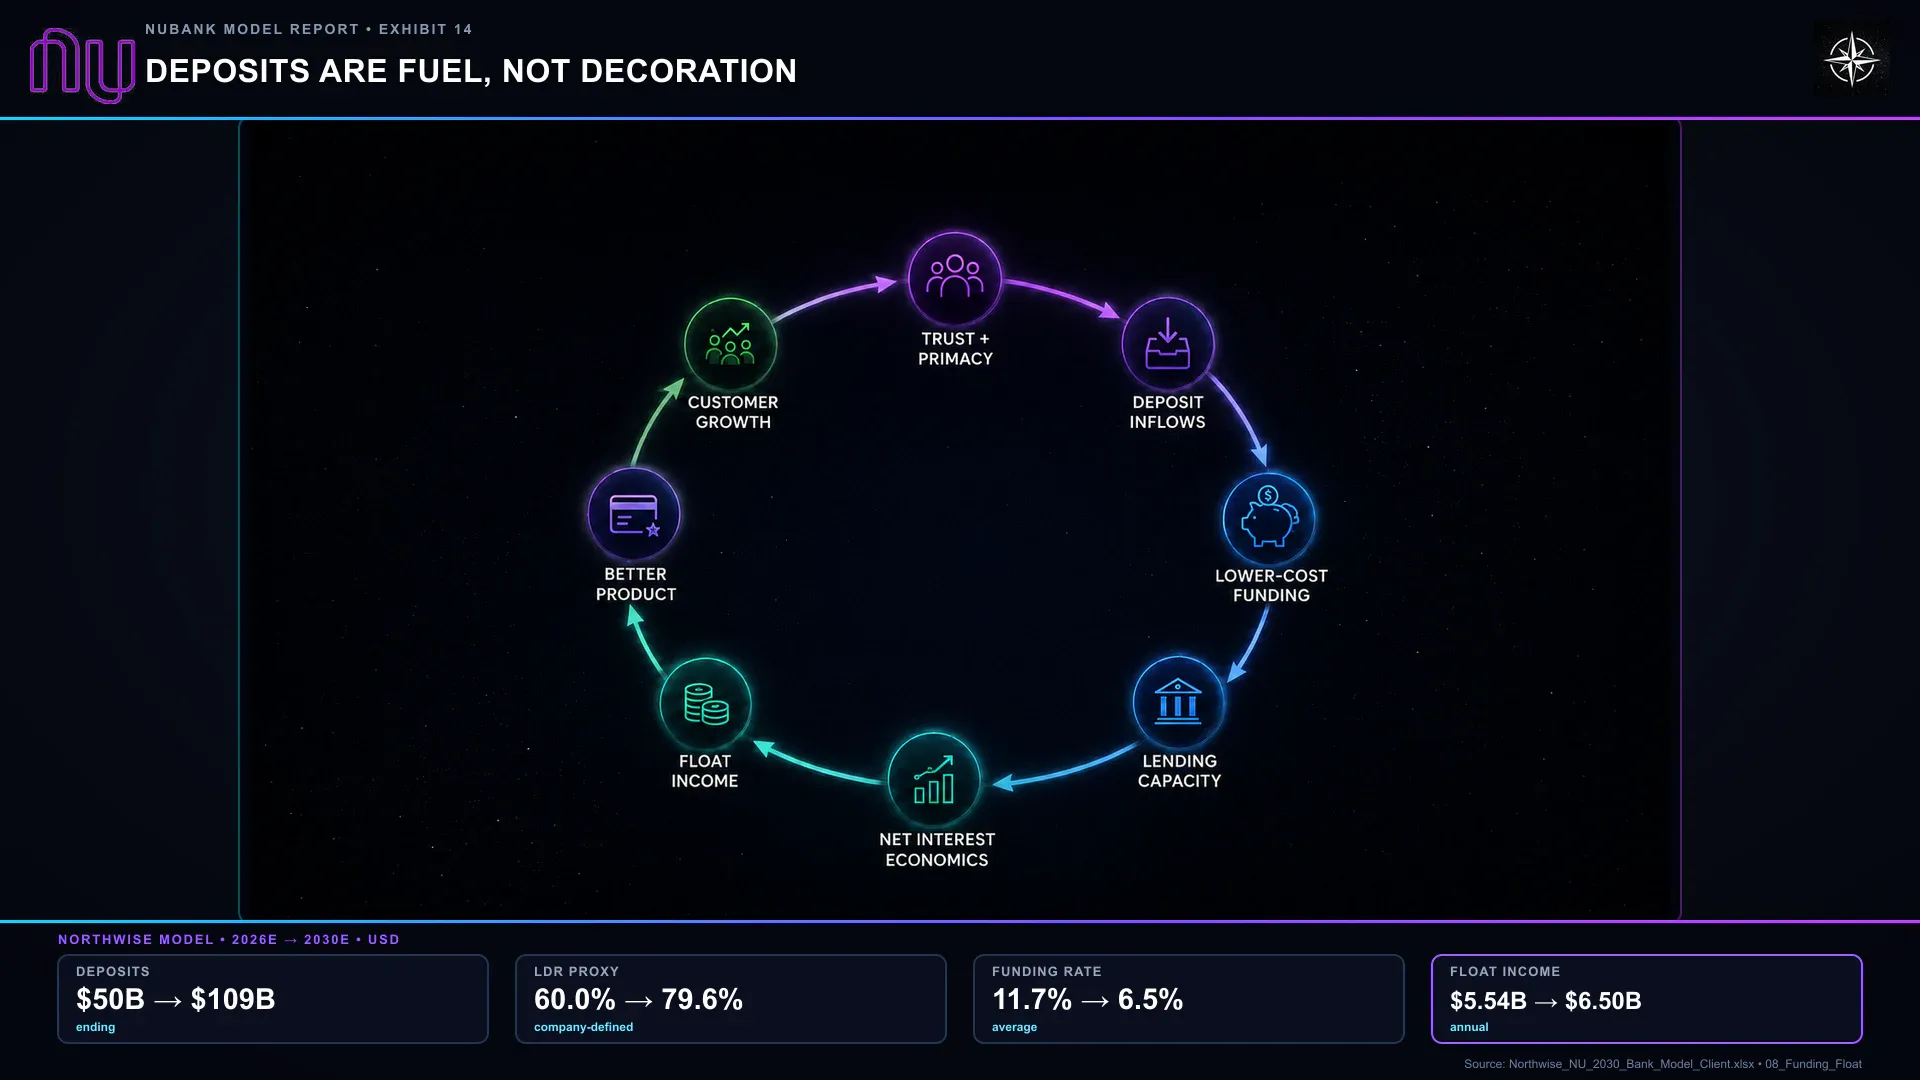
Nubank ended Q2 with $45.3 billion of deposits. Their reported cost was approximately 88% of the relevant interbank benchmark rates, meaning the company paid somewhat less than those benchmarks, not that customers received an 88% interest rate. Deposits attached to salary receipts and daily transactions can provide a more enduring relationship than money transferred solely to collect a promotional yield. They remain obligations the bank must be prepared to meet.
Much of the funding is contractually short-term or withdrawable. Nubank consequently considers expected customer behavior alongside the earliest date money can legally leave. An account used for years may be withdrawable tomorrow without being likely to disappear tomorrow. Treating all deposits as permanent would be imprudent, but treating contractual liquidity as if every customer exercises it simultaneously would also misdescribe the ordinary business.
Our forecast expects deposits to grow as relationships deepen and nominal interest rates to decline. Lower rates reduce funding expense, but also reduce income earned on liquid investments and, over time, on lending. The forecast therefore does not assume that rate normalization benefits only the cost side.
Base-case funding and capital assumptions | 2026 | 2027 | 2028 | 2029 | 2030 |
|---|---|---|---|---|---|
Ending deposits | $50.0B | $61.5B | $75.0B | $91.0B | $109.0B |
Average funding base | $49.8B | $59.0B | $72.0B | $87.5B | $105.5B |
Effective funding rate | 11.7% | 9.7% | 8.0% | 7.0% | 6.5% |
Funding cost | $5.83B | $5.72B | $5.76B | $6.13B | $6.86B |
Average liquid and float assets | $42.0B | $48.0B | $58.0B | $67.0B | $76.5B |
Effective float yield | 13.2% | 11.67% | 10.0% | 9.1% | 8.5% |
Float income | $5.54B | $5.60B | $5.80B | $6.10B | $6.50B |
Available funding | $46.0B | $57.0B | $70.0B | $85.0B | $102.0B |
Modeled funding usage | 60.0% | 66.2% | 71.7% | 76.0% | 79.6% |
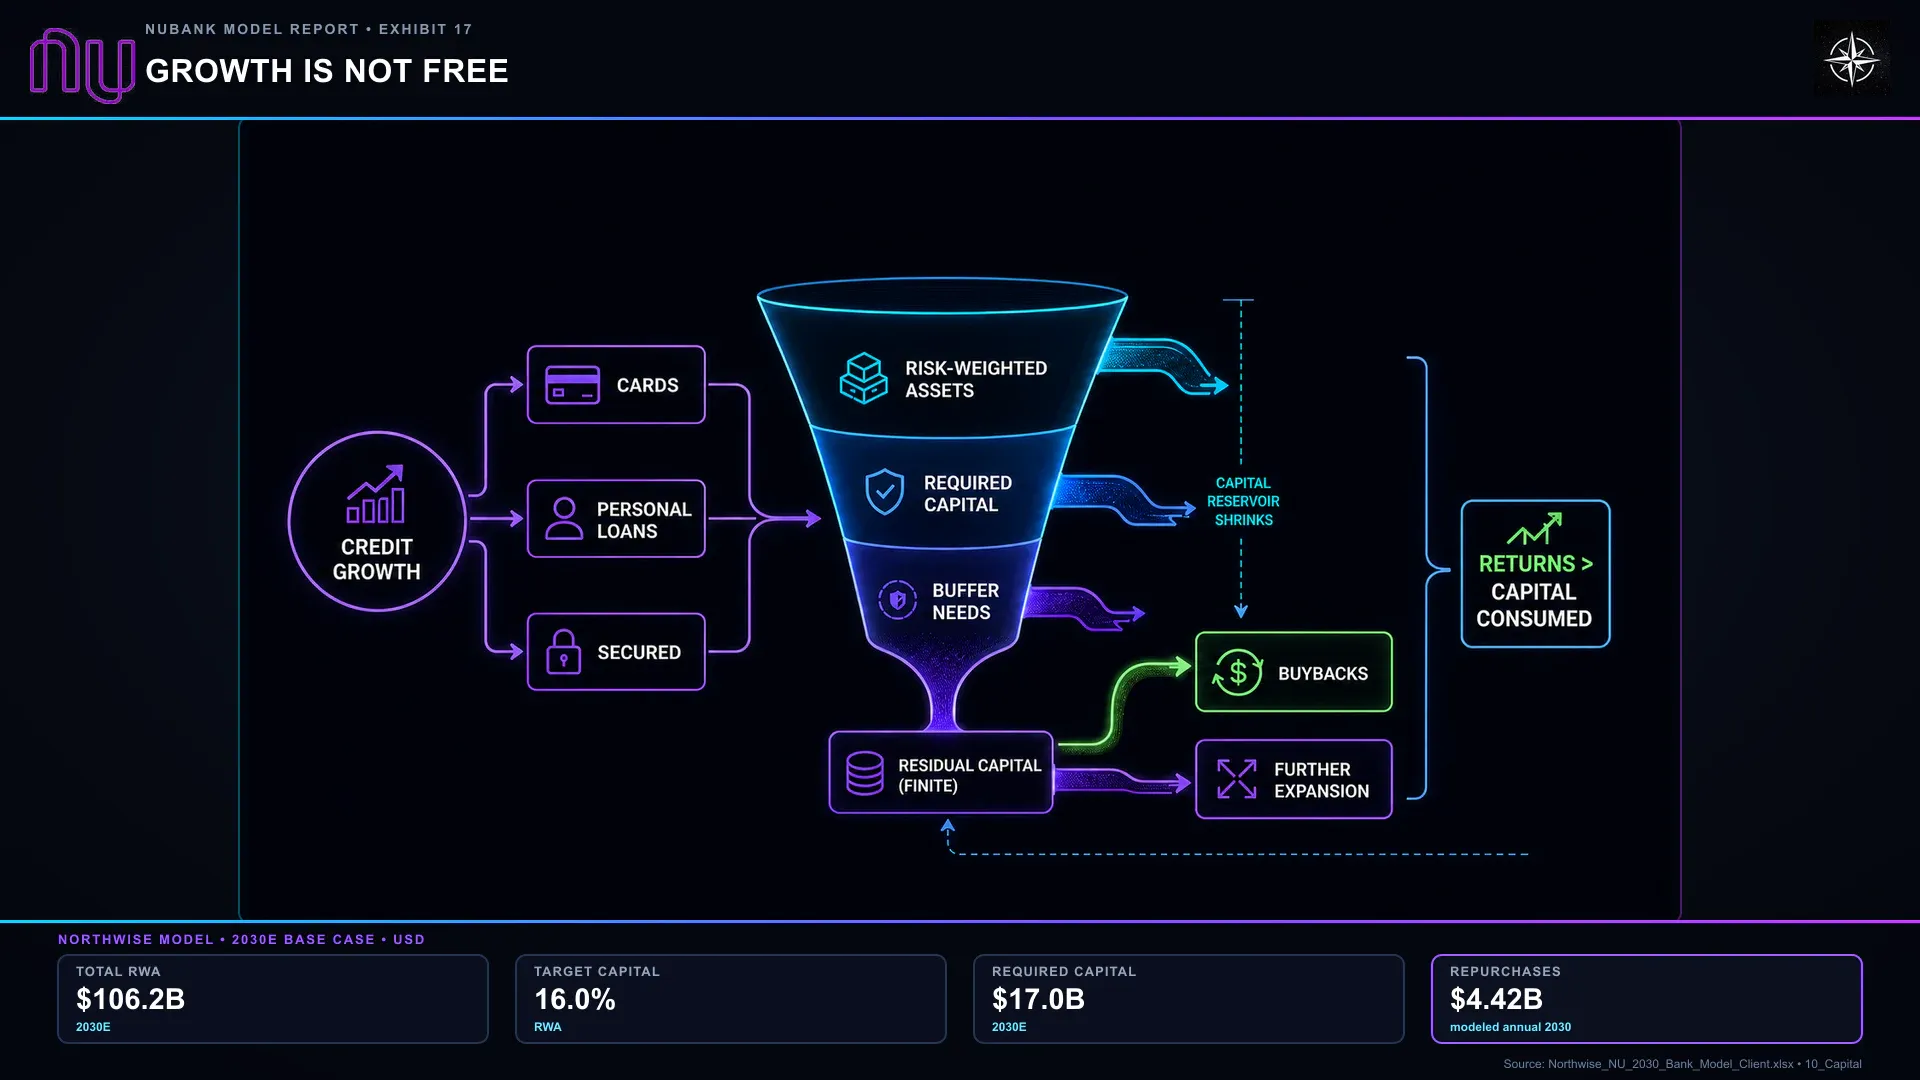
Risk-weighted assets | $44.24B | $56.91B | $71.72B | $88.15B | $106.20B |
Capital required at a 16% target | $7.08B | $9.11B | $11.47B | $14.10B | $16.99B |
Ending group equity | $14.84B | $20.61B | $28.18B | $37.50B | $48.27B |
Float income is earned from managing liquidity and other non-credit interest-earning assets. These balances grow substantially, but their yield falls, leaving a much smaller increase in income. Meanwhile, more funding is deployed into credit. The modeled usage ratio rises from 60% to 79.6%, improving earnings while reducing the relative amount of unused lending capacity.
That ratio compares net interest-earning credit with available funding. It differs from gross credit divided by deposits because card receivables, network settlement obligations, allowances, and payment timing influence the actual funding need. It is a planning measure informed by Nubank’s framework, not a complete country-by-country simulation of cash requirements during a deposit run.
Why the Regulator Cares About the Mix
Risk-weighted assets, or RWA, translate different exposures into a measure used to determine required capital. A relatively safe asset consumes less capital than unsecured consumer credit, and operational and other risks add to the total. Our analytical weights are 70% for cards, 110% for unsecured lending, and 55% for secured lending, with non-credit risk added separately. These are Northwise proxies rather than disclosed statutory weights for every Nubank product.
For illustration, a 110% risk weight makes $100 of exposure count as $110 of risk-weighted assets. A 16% capital target requires $17.60 against that amount before other relevant considerations. This is a cost of growth that cannot be understood merely by subtracting expected losses from the loan’s interest income.
Brazil’s risk-weighted assets increased from $31.14 billion at year-end to $35.71 billion in June. The total capital ratio fell from 16.6% to 15.7%, while common equity Tier 1, the core qualifying equity measure, declined from 13.0% to 11.9%. Mexico’s capital ratio was 14.9% and Colombia’s 15.3%. The disclosed ratios remained above their minimum requirements, but their direction showed capital being committed to the expanding business.
Our Base earnings support the modeled growth at group level. The gap between group equity and required capital is not immediately distributable cash, however. Capital must remain in the entities that need it, and some accounting assets receive less favorable regulatory treatment. Deferred tax assets, claims on future tax benefits, increased to $3.65 billion during the first half and should not be treated as equivalent to cash.
The July agreement to acquire Banco Porto Real addresses a different regulatory issue. It adds a banking license to the Brazilian group and helps meet requirements governing banking terminology. The filing states that the license does not introduce additional capital or liquidity requirements within the described structure. We include no separate revenue uplift from the acquisition; its role is in the legal structure supporting the business.
What Reaches Each Share
After meeting its growth and capital needs, a profitable bank can return part of its earnings to owners. Nubank had used approximately $500 million of its $1 billion share-repurchase authorization by June 30. Repurchases reduce the shares participating in future profits, while employee awards and other issuance can increase them. The net effect matters more than the amount spent buying stock.
Our Base case assumes $1 billion of repurchases in 2026, followed by approximately $0.96 billion, $1.79 billion, $2.96 billion, and $4.42 billion through 2030. Only the existing authorization is announced company policy. Later purchases are Northwise assumptions tied to earnings and constrained by the capital requirement and a $3 billion buffer.
At assumed average purchase prices of $13.50, $20, $28, $38, and $48, repurchases more than offset annual employee issuance declining from 32 million to 24 million shares. Ending diluted shares fall to approximately 4.71 billion in 2030. Diluted shares include qualifying awards and instruments that can increase the share count. Annual earnings per share use the average outstanding during the year, approximately 4.75 billion in 2030, because a share retired late in the year does not affect all twelve months equally.
The contribution is useful but not essential to the earnings case. Removing repurchases after 2026 lowers our 2030 earnings per share from approximately $3.10 to $2.95. Most of the improvement still has to come from the bank earning more money.
What Millions of These Decisions Add Up To
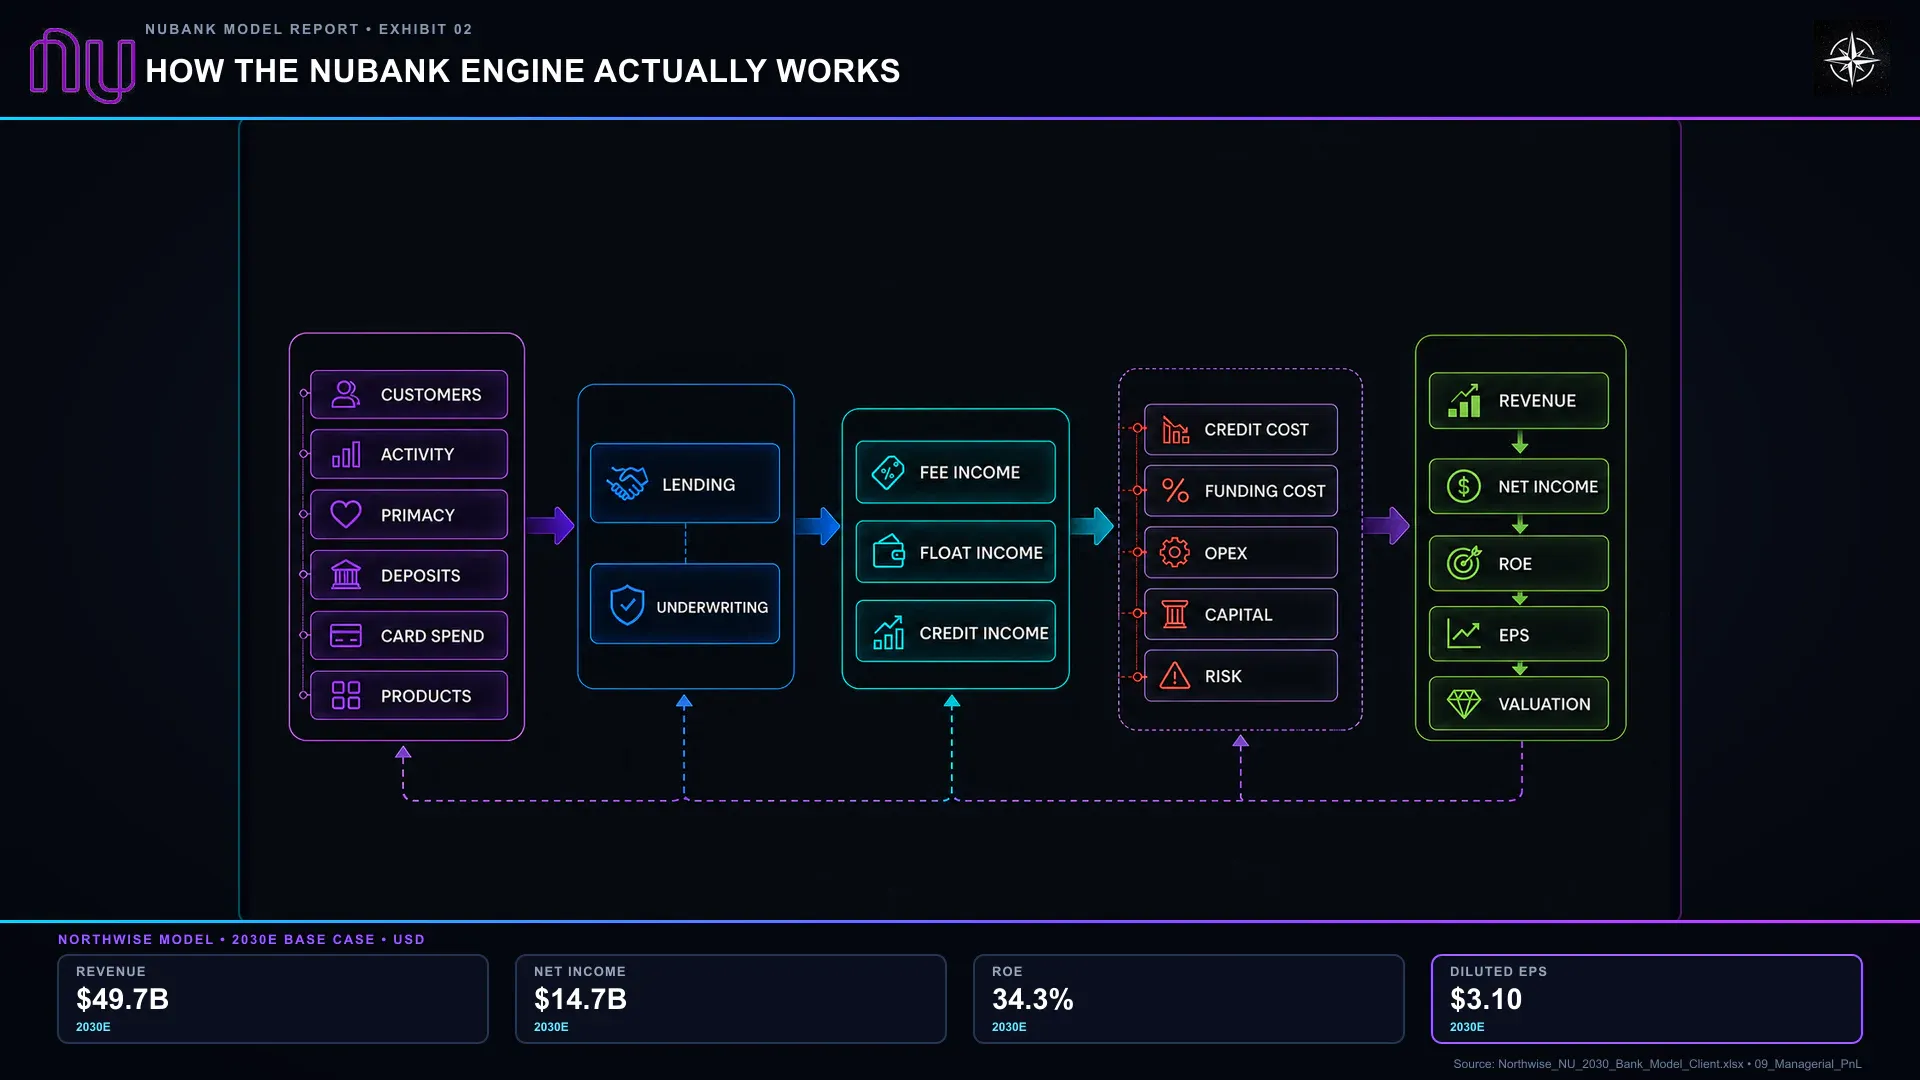
The forecast scales the customer progression described earlier. More people actively use Nubank, established customers bring additional business, and the bank makes more lending decisions against a larger base of deposits and retained capital. The resulting income is attractive only after the growing loss bill is paid.
Base-case ending credit balances | 2026 | 2027 | 2028 | 2029 | 2030 |
|---|---|---|---|---|---|
Credit cards | $29.2B | $37.5B | $46.5B | $55.5B | $65.0B |
Unsecured loans | $11.6B | $15.7B | $20.8B | $26.5B | $33.0B |
Secured loans | $3.7B | $5.8B | $8.7B | $13.0B | $18.0B |
Gross funded credit | $44.5B | $59.0B | $76.0B | $95.0B | $116.0B |
Secured share of funded credit | 8.3% | 9.8% | 11.4% | 13.7% | 15.5% |
Unused limits | $42.3B | $53.1B | $64.6B | $76.0B | $87.0B |
Funded credit compounds at approximately 27% annually between 2026 and 2030. This is an assertive assumption, even for a company with Nubank’s customer base. Cards remain the largest balance, unsecured lending grows faster, and secured lending expands fastest from a much smaller starting point. By 2030, the secured share reaches 15.5%, providing more diversification without changing the company into a predominantly low-risk lender.
We expect the bank to earn less per dollar of lending as nominal rates and product pricing normalize. Volume growth, lower funding rates, and gradual improvements in losses compensate for that decline. The product assumptions make clear how much improvement the forecast requires.
Base-case product economics | 2026 | 2027 | 2028 | 2029 | 2030 |
|---|---|---|---|---|---|
Card effective yield | 25.5% | 25.0% | 24.5% | 24.0% | 23.5% |
Unsecured effective yield | 68.0% | 66.0% | 64.0% | 62.0% | 60.0% |
Secured effective yield | 29.0% | 27.0% | 25.0% | 23.5% | 22.0% |
Card gross write-off rate | 10.5% | 10.0% | 9.6% | 9.2% | 9.0% |
Unsecured gross write-off rate | 22.0% | 21.0% | 20.0% | 19.2% | 18.0% |
Secured gross write-off rate | 3.5% | 3.3% | 3.1% | 3.0% | 2.8% |
Card allowance / ending balance | 17.0% | 16.5% | 16.0% | 15.5% | 15.0% |
Unsecured allowance / ending balance | 19.0% | 18.5% | 18.0% | 17.5% | 17.0% |
Secured allowance / ending balance | 4.5% | 4.2% | 4.0% | 3.7% | 3.5% |
Yields and write-off rates apply to average gross balances; allowances apply to ending balances. Recoveries are modeled at 20% of gross write-offs.
The recovery assumption describes the portfolio as a whole. It does not mean every loan written off in a year produces its recovery within the same year; actual collections include older exposures. For the annual forecast, we estimate expected-loss expense as net charge-offs plus the increase in the allowance. A factor of 1.08 translates that estimate into managerial credit cost, reflecting the reporting classifications used by the company. Actual accounting movements also include exchange-rate effects and other adjustments.
Base-case credit cost | 2026 | 2027 | 2028 | 2029 | 2030 |
|---|---|---|---|---|---|
Gross write-offs | $4.96B | $6.36B | $7.91B | $9.56B | $11.21B |
Recoveries | $(0.99)B | $(1.27)B | $(1.58)B | $(1.91)B | $(2.24)B |
Net charge-offs | $3.97B | $5.09B | $6.33B | $7.65B | $8.97B |
Ending allowance | $7.33B | $9.34B | $11.53B | $13.72B | $15.99B |
Increase in allowance | $2.31B | $2.00B | $2.20B | $2.19B | $2.27B |
Modeled IFRS expected-loss expense | $6.28B | $7.09B | $8.52B | $9.84B | $11.24B |
Managerial credit cost | $6.79B | $7.65B | $9.20B | $10.62B | $12.14B |
The allowance declines relative to the size of the portfolio while becoming much larger in dollars. Annual credit cost rises substantially despite lower assumed loss rates. The forecast remains consistent with a considerable amount of troubled credit: balances more than 90 days overdue stay close to 7%, and combined Stage 2 and Stage 3 exposure rises initially before declining from 22.3% in 2027 to 20.3% in 2030. Allowance coverage of late balances falls toward 206% as the portfolio matures and changes mix.
These are portfolio assumptions used to assess the earnings path, not the output of a complete simulation of every account. They show that our central case does not require delinquencies to return to an unusually benign level. It requires income and cost to remain in a favorable relationship while the balance sheet becomes much larger.
From the Interest Payment to the Bottom Line
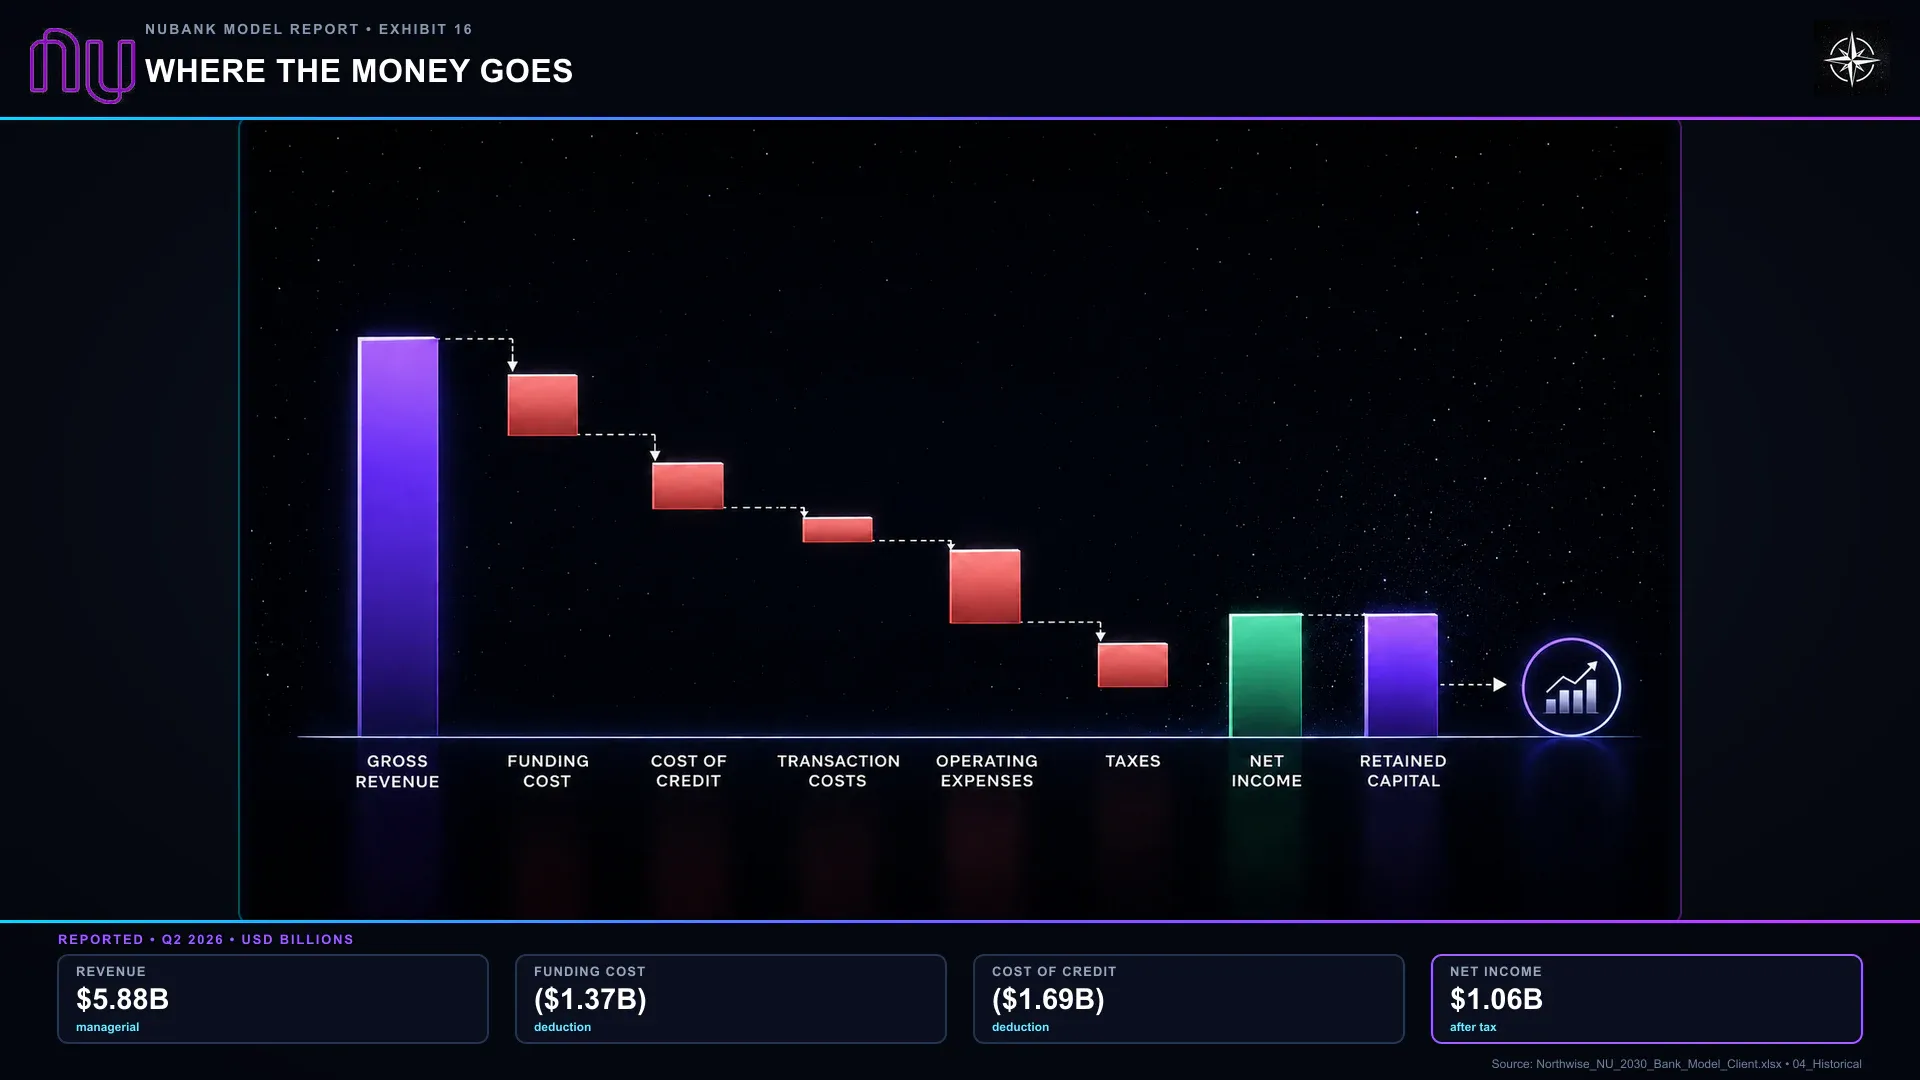
Nubank’s Managerial P&L, its supplementary profit-and-loss presentation, separates credit income, float income, and fee income before deducting their associated costs. Credit income comes from lending. Float income comes from liquidity and non-credit interest-earning assets. Fees come from payments, commissions, and other services. Funding expense, credit losses, transaction costs, and taxes then determine how much is left to cover the organization and produce profit.
This presentation differs from the statutory accounts prepared under International Financial Reporting Standards, or IFRS. Management reorganizes certain items and applies tax-equivalency adjustments, with corresponding effects in the tax line. Q2 managerial revenue was $5.876 billion and IFRS revenue $5.513 billion, but both produced the same $1.061 billion of net income. The reconciliation states that the changes do not affect cash flows, equity, or regulatory capital. We use the managerial categories below, so the tax expense should not be interpreted as a cash-tax payment schedule.
Base-case annual income statement | 2026 | 2027 | 2028 | 2029 | 2030 |
|---|---|---|---|---|---|
Credit income | $14.15B | $18.63B | $23.78B | $29.45B | $35.42B |
Float income | $5.54B | $5.60B | $5.80B | $6.10B | $6.50B |
Fee income | $3.55B | $4.20B | $5.20B | $6.40B | $7.80B |
Revenue | $23.25B | $28.43B | $34.78B | $41.95B | $49.72B |
Funding cost | $(5.83)B | $(5.72)B | $(5.76)B | $(6.13)B | $(6.86)B |
Credit cost | $(6.79)B | $(7.65)B | $(9.20)B | $(10.62)B | $(12.14)B |
Transaction cost | $(0.60)B | $(0.78)B | $(0.98)B | $(1.23)B | $(1.52)B |
Revenue-based taxes | $(0.95)B | $(1.17)B | $(1.43)B | $(1.72)B | $(2.04)B |
Gross profit | $9.08B | $13.11B | $17.41B | $22.25B | $27.17B |
Operating expenses | $(3.00)B | $(3.52)B | $(4.06)B | $(4.61)B | $(5.20)B |
Pretax income | $6.08B | $9.59B | $13.35B | $17.64B | $21.97B |
Income taxes | $(2.07)B | $(3.21)B | $(4.41)B | $(5.82)B | $(7.25)B |
Net income | $4.01B | $6.38B | $8.95B | $11.82B | $14.72B |
Average diluted shares | 4.909B | 4.879B | 4.852B | 4.808B | 4.748B |
Earnings per share | $0.82 | $1.31 | $1.84 | $2.46 | $3.10 |
Net margin | 17.3% | 22.4% | 25.7% | 28.2% | 29.6% |
Risk-adjusted NIM | 11.1% | 12.5% | 12.5% | 12.5% | 12.4% |
Efficiency ratio | 18.9% | 17.0% | 15.3% | 14.0% | 13.2% |
Return on equity | 30.7% | 36.0% | 36.7% | 36.0% | 34.3% |
Northwise estimates. Totals use unrounded figures.
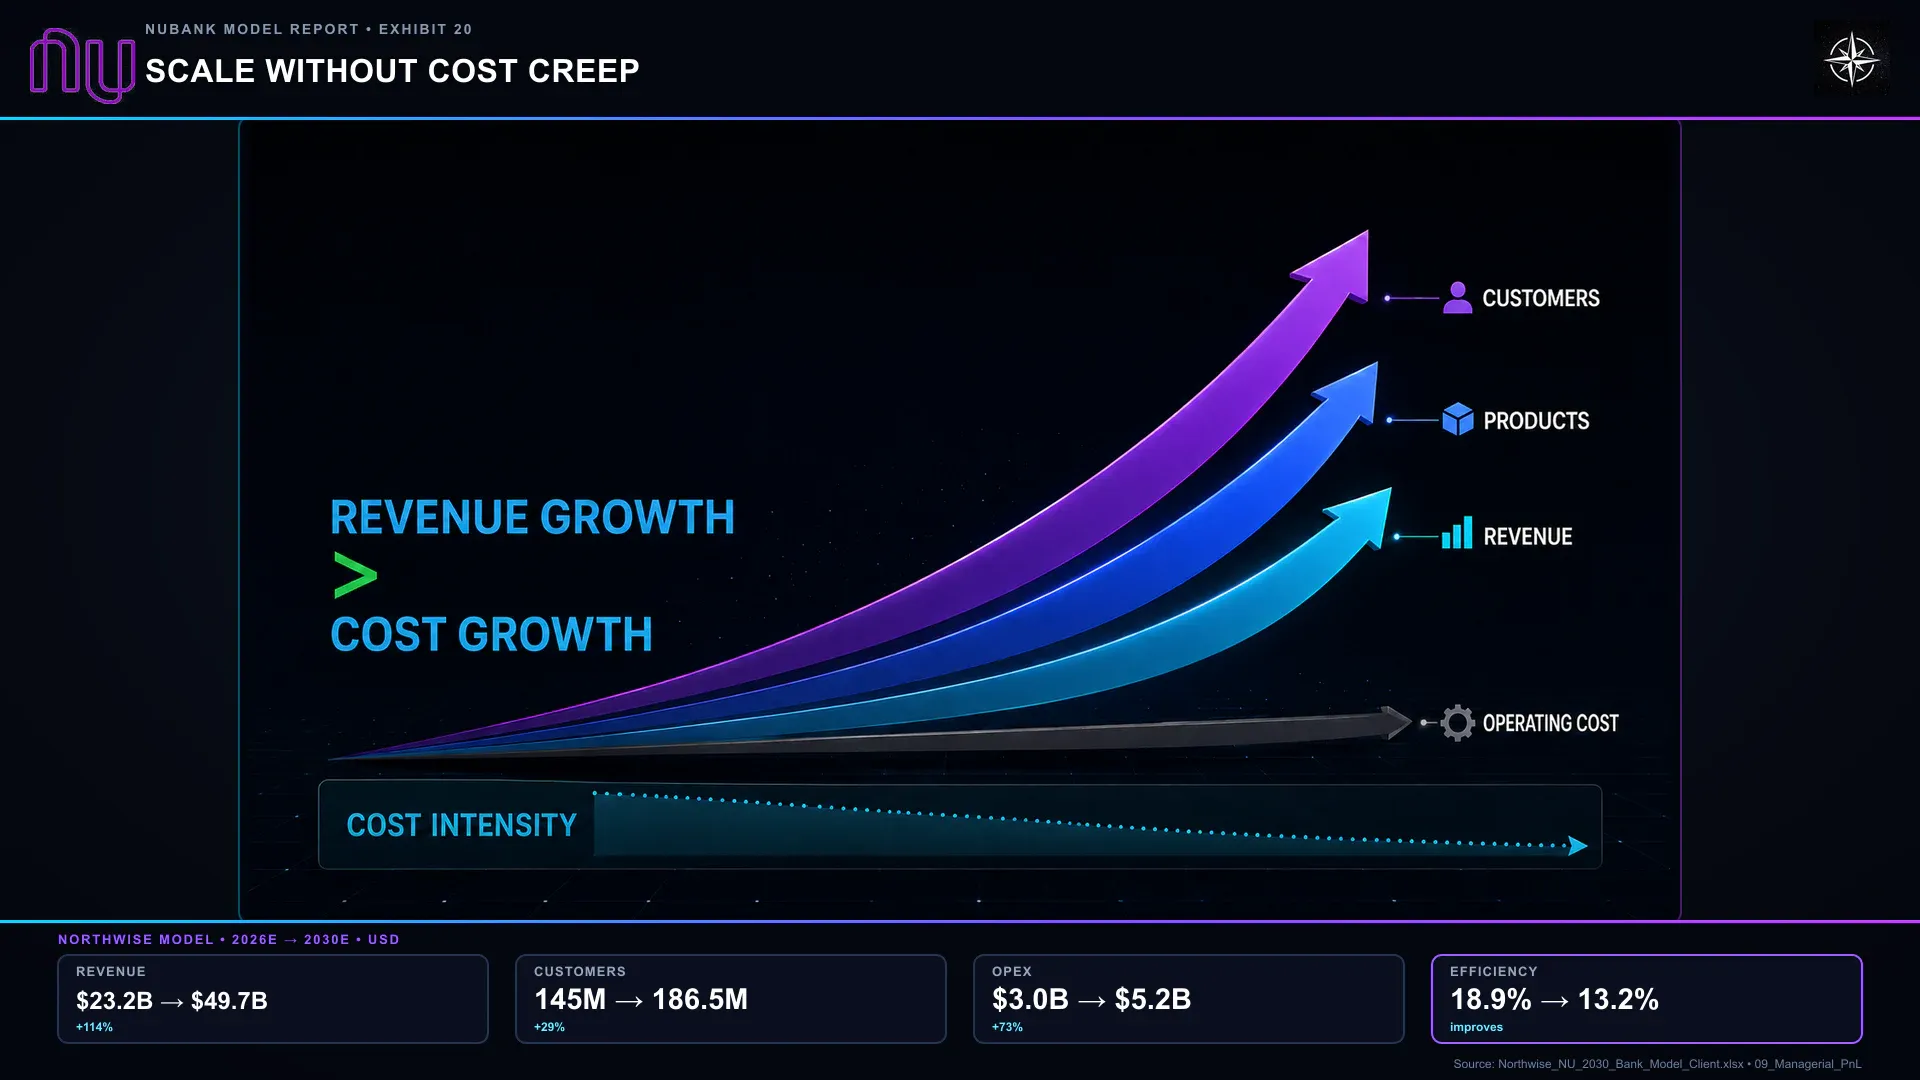
Revenue compounds at approximately 21% annually between 2026 and 2030, net income at 38%, and earnings per share at 40%. Operating expenses increase from $3 billion to $5.2 billion, so the forecast does not assume a shrinking organization. It assumes Nubank can support substantially more business without a proportionate increase in the cost of running it.
The efficiency ratio measures operating expenses against revenue after funding, transaction costs, and revenue-based taxes, but before credit cost and income taxes. Return on equity measures annual profit relative to the accounting equity supporting the bank. Neither is a direct stock return: a 34.3% ROE in 2030 is a return earned within the company, while the shareholder’s result also depends on the purchase price and the future valuation.
The projected interest margins use an implied interest-earning asset base consistent with our nominal margin assumptions. They summarize the earnings relationships rather than independently establish them. The more concrete forecast remains the dollars earned on product balances, less funding, credit, and operating costs.
Where the Forecast Is Demanding
The near-term revenue requirement is relatively modest. The 2026 estimate implies second-half revenue averaging approximately $6.03 billion per quarter, only slightly above Q2. Net income averages about $1.04 billion per quarter in the second half, slightly below Q2. The operating-cost assumption is more optimistic than management’s guidance: the company expects a full-year efficiency ratio of approximately 20%, while our forecast produces 18.9%. Management specifically warned that Q1’s unusually low ratio benefited from timing effects and was not the ongoing run rate.
Holding everything else constant, a 20% efficiency ratio would reduce our 2026 net-income estimate to approximately $3.90 billion. The 2030 assumption of 13.2% also requires considerable progress; a 15% outcome would put EPS closer to $3.00. The bank can spend somewhat more than we expect and still produce strong earnings, although sustained failure to generate operating leverage would weaken an important part of the thesis.
Credit has the larger immediate influence. A one-percentage-point reduction in 2030 risk-adjusted NIM lowers EPS by approximately $0.26. A one-percentage-point increase in funding cost reduces it by about $0.15, and a one-percentage-point rise in gross write-off rates reduces it by approximately $0.13 before secondary reserve and behavioral effects. These are isolated sensitivities that hold other variables constant. In a serious downturn, the problem would be several moving together.
Then the Salary Stops
Return to the hypothetical customer, this time under our Stress scenario. Her salary no longer arrives as expected, but the bills keep coming. Savings cover the first shortfall and then begin running out. The remaining card limit becomes more useful to her just as the bank’s confidence in repayment should be declining.
Across a small number of accounts, this is an ordinary feature of consumer lending. Across a large number simultaneously, it changes the bank’s year. More customers draw credit, collections become harder, and the allowance must increase before all those borrowers have reached the late-delinquency category. Nubank can reduce new lending, but the action does not remove loans it has already made.
Our 2027 Stress case represents a severe version of that sequence. Gross write-offs reach 20% of average card balances, 42% of unsecured balances, and 10% of secured balances. Recoveries fall to 10% of gross write-offs while allowance requirements rise. The specified outcome carries approximately $15.3 billion of managerial credit cost and a $4.29 billion annual loss. Management suspends repurchases, reduces growth, and concentrates on collections and capital protection.
The risk comes from the way these developments reinforce one another. Higher defaults can coincide with weaker recoveries and additional drawings, while a larger reserve reduces the earnings available to rebuild capital. Our Stress case eventually recovers to $4.29 billion of annual net income in 2030, but the funded credit book is much smaller than in Base and EPS is only approximately $0.86. Survival and recovery are assumptions of that scenario, not guarantees against every possible combination of credit losses, funding pressure, and regulatory action.
The More Ordinary Disappointment
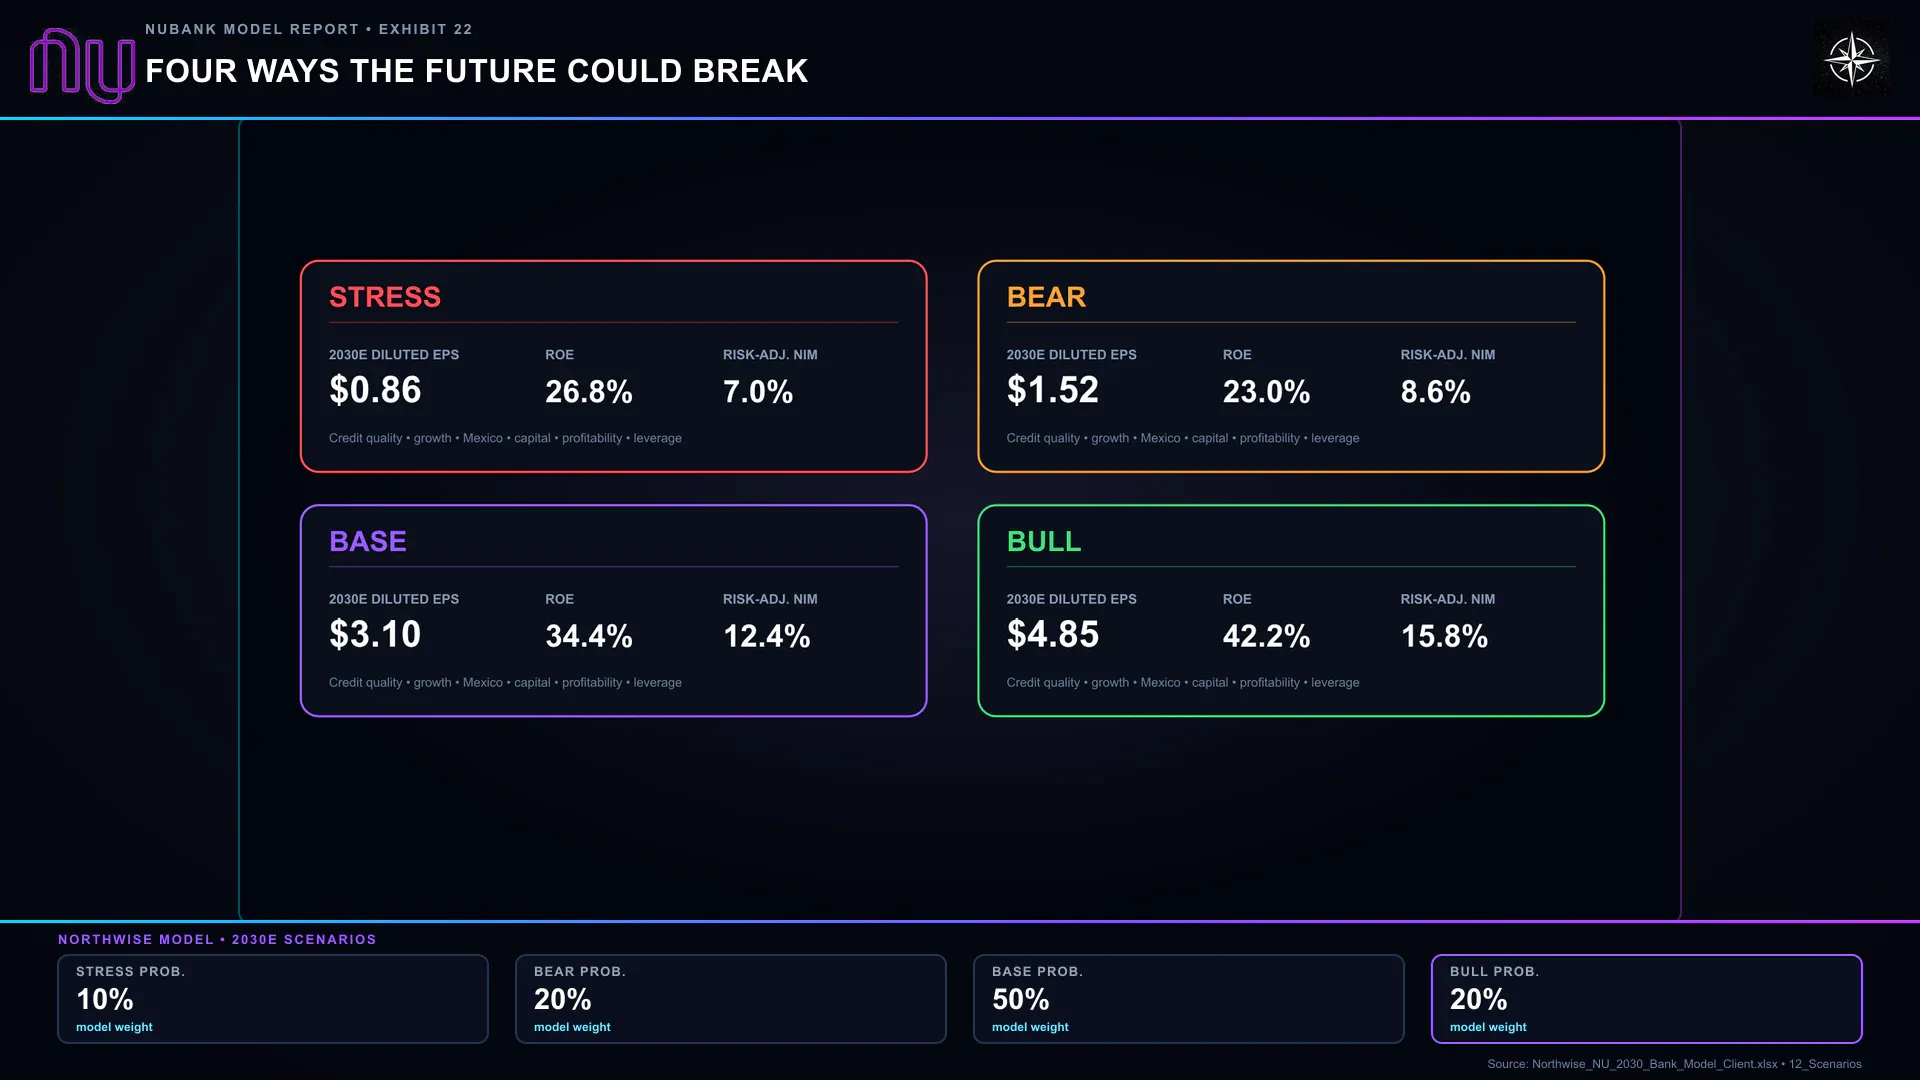
The Bear case does not require a crisis. The customer continues receiving income, but Nubank earns less from the additional business than anticipated. Deposit competition remains expensive, premium products need more subsidy, Mexican relationships deepen more slowly, and higher-risk loans produce positive but less distinctive returns. By 2030, revenue reaches $37.5 billion, net income $7.5 billion, and EPS approximately $1.52.
That would still be a large and profitable company. It would also leave shareholders with far less earnings growth than the central thesis anticipates. Product success and customer growth can continue while returns on the additional capital prove disappointing.
Base follows the progression already described: more primary relationships, gradual improvements in losses, more productive use of funding, and operating expense growing slower than income. Bull requires stronger performance across those same decisions. Better selection and pricing, more successful segmentation in Brazil, and faster Mexican monetization produce $140 billion of funded credit and a 15.8% risk-adjusted margin by 2030. That margin is materially above the current level and requires additional improvement, not simply preservation of recent economics.
Revenue / net income | Stress | Bear | Base | Bull |
|---|---|---|---|---|
2026 | $22.51B / $2.89B | $22.77B / $3.03B | $23.25B / $4.01B | $23.83B / $4.79B |
2027 | $23.01B / $(4.29)B | $26.55B / $4.06B | $28.43B / $6.38B | $30.79B / $8.10B |
2028 | $23.43B / $2.00B | $30.31B / $5.48B | $34.78B / $8.95B | $40.20B / $12.38B |
2029 | $25.40B / $2.88B | $33.99B / $6.50B | $41.95B / $11.82B | $51.48B / $17.30B |
2030 | $28.49B / $4.29B | $37.54B / $7.49B | $49.72B / $14.72B | $64.47B / $22.58B |
2030 diluted EPS | $0.86 | $1.52 | $3.10 | $4.85 |
2030 funded credit | $68B | $90B | $116B | $140B |
2030 deposits | $86B | $103B | $109B | $133B |
2030 risk-adjusted NIM | 7.0% | 8.6% | 12.4% | 15.8% |
Northwise probability | 10% | 20% | 50% | 20% |
All four paths share reported first-half 2026 results. Differences in full-year figures represent different second-half outcomes. The alternative cases are specified operating scenarios rather than independent loan-by-loan simulations, and their probabilities express our judgment rather than statistical frequencies from a large sample of identical businesses.
The Shareholder Has Risks the Customer May Not Notice
A Brazilian customer can remain satisfied with her account while a U.S. investor receives a disappointing dollar result. Nubank earns primarily in reais, Mexican pesos, and Colombian pesos, then translates the financial statements into U.S. dollars. Income and expenses generally use average exchange rates, while balance-sheet amounts use reporting-date rates. Currency weakness can reduce reported earnings and equity even when the local operation is growing. It can also arrive alongside the weaker employment and higher funding costs that affect credit.
Regulation can change the return earned on otherwise well-underwritten business. Nubank identifies Brazil’s consumption-tax reform as an impact still under assessment, with a specific financial-services regime beginning in 2027. The statutory rates cannot simply replace our 4.1% revenue-based-tax assumption because the taxable bases, credits, and accounting presentation differ. We retain that assumption rather than claiming the reform has been fully quantified in the forecast. A less favorable outcome would reduce earnings.
The United States presents a different uncertainty: whether the company can establish the information and customer relevance it already possesses elsewhere. Conditional approval to form a U.S. national bank is a regulatory milestone, not evidence of commercial success. On the Q2 call, Livingston described the need for local data, testing, and learning before expanding with the confidence Nubank has in its established markets. Our central forecast includes investment costs without requiring meaningful U.S. profit.
The technology also has to remain dependable. Outages, cyber incidents, fraud, or poorly controlled automated decisions can damage the trust that makes the customer relationship valuable. Nubank’s risk framework explicitly recognizes these exposures. Security, compliance, and resilience belong in the cost of the business, even when the customer never sees them on the screen.
What Would Change Our View
We would become substantially more concerned if deterioration spread across credit, funding, and capital while management continued prioritizing growth and repurchases. Higher delinquencies in isolation can be consistent with a deliberate change in lending. Higher delinquencies accompanied by weaker collections, declining risk-adjusted income, unexpected reserve needs, and falling capital ratios would require a different response.
Our review thresholds include sustained risk-adjusted NIM below 8%, balances more than 90 days overdue above 8%, Stage 2 and Stage 3 exposure above 26%, or allowance coverage below 180%. Local total capital ratios approaching 12.5% would prompt closer examination of the jurisdiction, its requirements, and management’s plans. These are Northwise monitoring levels, not regulatory limits or automatic trading rules. Our own Base case allows coverage to decline as the portfolio changes, so the causes matter alongside the percentages.
The evidence that would strengthen the thesis is more specific than another customer milestone. We want newer vintages performing as expected, profitable Mexican growth after the bank transition, secured products earning adequate returns, and margins holding up without temporary program support. If intentional risk expansion remains management’s explanation for higher consolidated losses, disclosure should be detailed enough to show whether those loans are following their original expectations.
Our judgment remains favorable because the customer relationships and comparative credit evidence give the lending advantage substance. The forecast nevertheless asks Nubank to preserve that advantage while operating at a much larger scale. Whether the shares compensate investors for that task is a separate question from whether the company deserves admiration.
What Are Those Earnings Worth?
The operating forecast is available above. Northwise Premium takes the analysis through valuation, including the value of each scenario, the effect of a persistent market discount, the probability-weighted 2030 target, and the prices that meet our required returns.
Continue with Northwise Premium

Northwise Premium
Choose how to continue with Northwise
Join Northwise Premium
Unlock the rest of this report, its complete valuation, the downloadable model, portfolios, and action framework.
Join Northwise PremiumCreate a Free Account
Continue across Free Northwise research, follow companies, save reports, and receive updates.
Create a Free Account
Nu stock Forecast 2030
NU stock forecast 2030: Nubank’s updated model weighs Q1 earnings, Mexico break-even, AI underwriting, credit risk, and upside.

Nu Stock Forecast
Our Nu stock forecast emphasizes how NuBank is scaling across Latin America with strong margins, low CAC, and real user engagement.

Nebius Asset-Light Business Model: The Cloud Someone Else Pays to Build
How Nebius can earn cloud fees on partner-owned GPUs. Explore owner economics, Palantir, cash flow and our 2030 asset-light scenarios in this free report.
Northwise Portfolios
See how the research becomes real decisions
Reader discussion
Discuss the research
Premium access is required to join this report's discussion.
Join Northwise Premium
No comments yet. Start a thoughtful discussion.