
CoreWeave 2030 Cloud Scale Infrastructure
This CRWV Stock Forecast 2030 evaluates CoreWeave's $55.6B backlog against its aggressive leverage and depreciation policies.
In this article
CRWV Stock Forecast 2030: Infrastructure Economics and Balance Sheet Risk
Assessing equity outcomes through the lens of capital intensity and hardware depreciation
Executive Summary
CoreWeave represents one of the purest public-market expressions of the AI infrastructure buildout. The company has positioned itself as a critical pressure valve for GPU demand at a moment when hyperscalers are constrained by power, deployment timelines, and internal capital allocation tradeoffs. That positioning has translated into exceptional revenue growth and backlog visibility.
At the same time, CoreWeave’s equity is burdened by leverage, capital intensity, and accounting sensitivity that materially shape outcomes. This is not a binary story. It is a probabilistic one. Long-term upside exists, but it is inseparable from execution discipline and balance sheet management. As a result, price and structure matter as much as growth.
What the Market Is Debating
The market broadly agrees on the demand signal. AI compute requirements are growing faster than hyperscalers can internally supply, and that gap has created space for specialized infrastructure providers like CoreWeave.
Where disagreement emerges is around durability. Bulls argue CoreWeave has secured an enduring role in the AI stack through early deployment, technical specialization, and long-term contracts. Bears counter that the business is fundamentally a leveraged lessor of rapidly depreciating hardware, vulnerable to pricing compression, customer repatriation, and accounting fragility as the cycle matures.
The stock’s volatility reflects this unresolved tension.
Why This Is a Balance Sheet and Accounting Story
AI demand growth is not the limiting factor in this analysis. The constraint lies in how that demand is financed, depreciated, and monetized over time. CoreWeave has chosen speed over balance sheet conservatism, funding its expansion through a combination of high-cost debt, aggressive depreciation assumptions, and future dilution.
Those choices amplify both upside and downside. They also mean that headline metrics like revenue growth and adjusted EBITDA are insufficient on their own. Equity outcomes hinge on interest expense, useful life assumptions, delivery execution, and the company’s ability to maintain pricing power as GPU supply expands.
This is why CoreWeave must be evaluated as an infrastructure business first and a growth story second.
Summary of Bear, Base, Bull, and Acquisition Outcomes
We assess CoreWeave using four scenarios through 2030. In the bear case, the company remains relevant but fails to convert scale into durable equity value due to capital drag and margin compression.
In the base case, execution aligns with current guidance, growth remains strong, and equity compounds, albeit with volatility and ongoing balance sheet risk. In the bull case, sustained AI demand, improved execution, and operating leverage drive substantial earnings expansion and outsized equity returns.
We also include an acquisition scenario, recognizing that CoreWeave’s assets and contracted capacity may ultimately be more valuable within a lower-cost-of-capital balance sheet than as a standalone public entity.
Probability-weighting these outcomes produces a wide valuation range and reinforces a central conclusion: CoreWeave can be attractive, but only at prices that compensate for its structural risk.
Table of Contents
1. The Historical Crucible
1a. CoreWeave’s Origins in Crypto Infrastructure
1b. The Bare-Metal Philosophy and Early Technical Differentiation
1c. The Pivot From Opportunistic Compute to AI-First Architecture
2. The AI Infrastructure Problem CoreWeave Solves
2a. Why Hyperscalers Struggle With Frontier AI Workloads
2b. Training Versus Inference and the Economics of GPU Density
2c. Where Specialized Clouds Fit in the Stack
3. Platform Architecture and Product Stack
3a. GPU Fleet Composition and Lifecycle Reality
3b. Networking, Storage, and Orchestration as Hidden Constraints
3c. Software Control Layers and Customer Stickiness
4. Revenue Model and Contract Structure
4a. Take-or-Pay Contracts and Backlog Quality
4b. Revenue Visibility Versus Execution Risk
4c. Customer Concentration and Counterparty Power
5. Financial Engine and Accounting Reality
5a. Revenue Growth and Margin Profile
5b. EBITDA Versus GAAP Earnings and What Gets Excluded
5c. Depreciation Policy, Useful Life Assumptions, and Sensitivity
5d. Interest Expense, Leverage, and Fixed Cost Drag
6. Capital Structure and Balance Sheet Risk
6a. Debt Stack Composition and Maturity Profile
6b. Asset-Backed Financing and GPU Collateral
6c. Dilution Pathways in Bullish Versus Stress Scenarios
7. Competitive Landscape: Who Solves This Problem Better
7a. CoreWeave Versus Nebius
7a.i. Accounting Discipline, Depreciation, and Balance Sheet Cleanliness
7b. CoreWeave Versus IREN
7b.i. Vertical Integration, Power Control, and Capital Intensity
7c. CoreWeave Versus CIFR
7c.i. Crypto-Native Infrastructure and Transition Risk
7d. Why AI Demand Can Be Exploding While Equity Outcomes Diverge
8. Operating Model and Forecast Framework (2025–2030)
8a. Modeling Assumptions Anchored to Management Guidance
8b. Revenue Growth Trajectories by Scenario
8c. Margin Expansion and Steady-State Economics
8d. EPS Construction and Share Count Logic
9. Scenario Analysis
9a. Bear Case
9a.i. Conditions Required
9a.ii. Revenue, Margin, EPS, and CAGR Outcomes
9b. Base Case
9b.i. Execution Consistent With Current Trajectory
9b.ii. Revenue, Margin, EPS, and CAGR Outcomes
9c. Bull Case
9c.i. Faster Scaling, Cleaner Execution
9c.ii. Revenue, Margin, EPS, and CAGR Outcomes
9d. Acquisition Case
9d.i. Who Could Buy CoreWeave and Why
9d.ii. Premium Bands, Timing Uncertainty, and Valuation Logic
10. Valuation Framework
10a. Multiple Selection Across Scenarios
10b. Scenario Price Target Ranges
10c. Probability Weighting and Expected Value
10d. Weighted 2030 Price Target
11. Portfolio Construction and Margin of Safety
11a. Entry Price Framework
11b. What Price Compensates for Balance Sheet Risk
11c. Position Sizing Implications
12. Risk Assessment
12a. Execution and Supply Chain Risk
12b. Hardware Obsolescence and Pricing Compression
12c. Customer Repatriation by Hyperscalers
12d. Financing and Refinancing Risk
13. Conclusion
13a. CoreWeave as a Leveraged Expression of AI Infrastructure
13b. What Must Go Right Versus What Already Has
13c. Why Cleaner Balance Sheets May Win This Cycle
1. The Historical Crucible
1a. CoreWeave’s Origins in Crypto Infrastructure
CoreWeave’s operating philosophy emerged from cryptocurrency mining, where hardware efficiency, power economics, and utilization determine viability. The company traces its roots to Atlantic Crypto, which mined Ethereum at scale during the late 2010s. Ethereum’s proof-of-work algorithm favored general-purpose GPUs rather than single-purpose ASICs, shaping the company’s early hardware decisions.
When crypto markets collapsed, many miners were left with stranded equipment. Atlantic Crypto retained a large fleet of programmable GPUs that could be redeployed to other parallelized workloads. That survivability shaped the company’s trajectory and its understanding of hardware as a flexible but capital-intensive asset.
From its earliest phase, CoreWeave operated without abstraction from physical constraints. Power pricing, cooling efficiency, and depreciation were immediate operating variables rather than downstream accounting considerations. That orientation carried forward as the company transitioned away from crypto mining.
1b. The Bare-Metal Philosophy and Early Technical Differentiation
As CoreWeave began offering compute beyond mining, it gravitated toward direct hardware access. GPUs were provisioned without heavy virtualization layers, networking was optimized for throughput and latency, and orchestration favored sustained utilization over flexibility.
This architecture contrasted with traditional cloud environments that evolved around CPU-centric workloads. Hypervisors and virtual machines enabled broad service offerings but introduced overhead that reduced efficiency in GPU-dense, parallelized tasks. CoreWeave’s infrastructure instead prioritized determinism, bandwidth, and consistency.
Early customers came from industries such as visual effects, rendering, and simulation. These workloads required predictable performance and long-duration compute runs. Serving them refined CoreWeave’s infrastructure around high-intensity usage rather than burst-driven demand.
Over time, this approach produced an environment optimized for tightly coupled GPU workloads.
1c. The Pivot From Opportunistic Compute to AI-First Architecture
As large-scale AI training emerged, CoreWeave’s infrastructure aligned naturally with the requirements of distributed model training. Frontier models rely on thousands of GPUs operating as coordinated systems, with performance constrained by networking, orchestration, and failure tolerance as much as raw compute.
CoreWeave reoriented its capital allocation and internal tooling toward AI-first workloads. Kubernetes became the backbone of orchestration. Networking shifted toward high-throughput, low-latency interconnects. Capacity planning moved toward forward-deployed infrastructure tied to long-duration commitments.
This transition coincided with a structural shortage of AI compute. Hyperscalers struggled to deploy dense GPU capacity at the pace demanded by frontier model development. CoreWeave’s ability to deploy quickly and operate high-density clusters positioned it as a critical extension of the AI infrastructure stack.
The company did not create this demand. It scaled into it.
2. The AI Infrastructure Problem CoreWeave Solves
2a. Why Hyperscalers Struggle With Frontier AI Workloads
Hyperscale cloud platforms were built to serve a large number of heterogeneous workloads efficiently. Their strength lies in flexibility, geographic redundancy, and service breadth. These attributes align well with traditional enterprise computing and consumer internet applications.
Frontier AI workloads impose a different set of constraints. Training large models requires thousands of GPUs operating in tightly synchronized clusters for extended periods. Performance is dictated by interconnect bandwidth, latency consistency, and failure tolerance across the entire cluster. Any bottleneck propagates across the system.
Hyperscalers face structural friction when adapting to these requirements. Data centers optimized for CPU workloads often lack the power density and cooling capacity needed for large GPU clusters. Internal capital allocation must balance AI expansion against competing priorities across dozens of product lines. Deployment timelines stretch as infrastructure decisions move through layers of organizational approval.
As a result, hyperscalers have struggled to bring dense, large-scale GPU capacity online at the pace required by frontier model development. This gap between demand and deployable supply created space for specialized infrastructure providers.
2b. Training Versus Inference and the Economics of GPU Density
AI workloads bifurcate into training and inference, each with distinct economic profiles. Training is characterized by long-duration, compute-intensive runs that demand maximum utilization and minimal interruption. Inference emphasizes responsiveness, geographic distribution, and cost efficiency at scale.
Training workloads are particularly sensitive to GPU density. The cost of underutilized hardware compounds rapidly when thousands of GPUs are reserved for a single job. Network congestion, scheduling inefficiencies, or node failures can idle entire clusters, turning capital investment into sunk cost.
High-density deployments concentrate power, cooling, and networking requirements. They also reduce the flexibility to repurpose hardware mid-cycle. These characteristics make training infrastructure expensive to build and difficult to operate, especially within environments designed for generalized workloads.
Specialized providers that design for density from the outset are able to optimize around these constraints. Their economics depend less on maximizing service breadth and more on sustaining utilization across long-duration contracts.
2c. Where Specialized Clouds Fit in the Stack
Specialized GPU clouds occupy an intermediate layer between hyperscalers and end users. They do not replace general-purpose cloud platforms. Instead, they absorb workloads that hyperscalers cannot deploy efficiently or quickly enough.
Their value proposition centers on speed of deployment, density optimization, and operational focus. By narrowing the scope of services offered, specialized providers align infrastructure design, procurement, and orchestration around a single dominant workload profile.
This positioning introduces tradeoffs. Specialized clouds carry higher capital intensity and greater exposure to hardware cycles. They rely on long-term commitments to justify deployment and are more sensitive to changes in utilization and pricing.
CoreWeave operates squarely within this layer. Its relevance is tied to the persistence of AI training demand that exceeds hyperscaler deployment capacity. As long as that imbalance exists, specialized infrastructure remains necessary. As it narrows, differentiation shifts from availability to efficiency, execution, and capital discipline.
3. Platform Architecture and Product Stack
3a. GPU Fleet Composition and Lifecycle Reality
CoreWeave’s platform is anchored in its GPU fleet, which represents both its primary revenue engine and its largest source of balance sheet risk. The company operates a heterogeneous mix of high-end data center GPUs deployed across multiple generations, with procurement decisions driven by availability, performance density, and customer requirements rather than long-term standardization.
Fleet composition evolves quickly. Newer architectures are prioritized for training workloads where performance per watt and interconnect efficiency drive economics. Older generations are redeployed toward inference, rendering, and secondary workloads as performance requirements shift. This internal cascading of hardware use underpins the company’s useful life assumptions and its belief that GPUs retain economic value beyond their training prime.
Lifecycle management is therefore central to CoreWeave’s model. Hardware is not treated as a single-purpose asset with a fixed revenue profile. Instead, it is expected to move through phases of utilization, each with different margin characteristics. The success of this approach depends on sustained demand across workload types and the company’s ability to keep utilization high as hardware ages.
This dynamic creates operating leverage when demand is strong and introduces sensitivity when it is not. Hardware depreciation continues regardless of utilization, making fleet management a determinant of both margins and equity outcomes.
3b. Networking, Storage, and Orchestration as Hidden Constraints
At scale, GPU performance is constrained as much by the surrounding system as by the chips themselves. Distributed training workloads require continuous, high-volume communication between nodes. Any weakness in networking throughput or latency propagates across the cluster.
CoreWeave has invested heavily in high-bandwidth, low-latency interconnects designed to support tightly coupled GPU clusters. Networking is treated as a first-order design parameter rather than an auxiliary service. This focus enables large training jobs to run with fewer synchronization penalties and less idle time.
Storage architecture follows a similar logic. Training workloads require sustained, high-throughput access to large datasets. Bottlenecks in data ingestion or retrieval directly reduce GPU utilization. CoreWeave’s storage layer is optimized for feeding compute rather than for general-purpose durability or geographic replication.
Orchestration ties these components together. Kubernetes-based scheduling is tuned for long-duration, resource-intensive jobs rather than short-lived bursts. Failures are managed with an emphasis on minimizing cluster-wide disruption rather than maximizing individual instance uptime.
These design choices improve efficiency for specific workloads while narrowing flexibility. The platform performs best when deployed against the problems it was built to solve.
3c. Software Control Layers and Customer Stickiness
Although CoreWeave is often described as a hardware-centric business, software plays a critical role in operational control and customer retention. Internal tooling governs scheduling, monitoring, failure detection, and performance optimization across thousands of GPUs.
For customers, these control layers reduce friction in managing large-scale training runs. Visibility into performance, utilization, and bottlenecks becomes increasingly valuable as model size and cost increase. Once workflows are tuned to a specific environment, switching costs rise even in the absence of formal lock-in.
This software layer does not transform CoreWeave into a traditional software platform. It does, however, embed the infrastructure more deeply into customer workflows. That embeddedness supports long-term contracts and contributes to backlog durability.
The platform’s effectiveness depends on the coherence of the entire stack. Hardware density, networking design, orchestration logic, and software control must align. Weakness in any layer reduces the value of the whole.
4. Revenue Model and Contract Structure
4a. Take-or-Pay Contracts and Backlog Quality
CoreWeave generates the majority of its revenue through multi-year, take-or-pay contracts. Customers commit to a fixed quantity of GPU capacity and are obligated to pay for that capacity regardless of utilization, provided the infrastructure is available. Contract durations typically range from one to four years, with pricing tied to specific hardware configurations and deployment timelines.
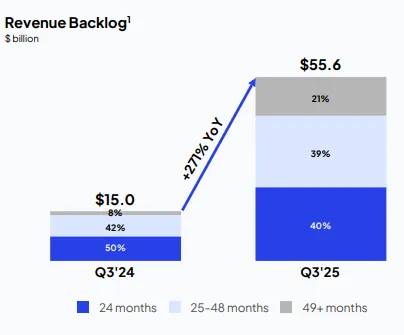
As of the end of Q3 2025, CoreWeave reported a revenue backlog of approximately $55.6 billion. This backlog represents contracted future revenue rather than non-binding pipeline and is expected to convert to recognized revenue as capacity is delivered and placed into service. For context, the backlog is more than 10x the company’s projected full-year 2025 revenue.
This structure provides unusually high forward visibility for a company operating in a rapidly evolving market. Revenue recognition is driven by contractual delivery schedules rather than short-term demand fluctuations. However, the value of the backlog is contingent on CoreWeave’s ability to execute on infrastructure deployment. Backlog does not insulate the business from delivery risk.
4b. Revenue Visibility Versus Execution Risk
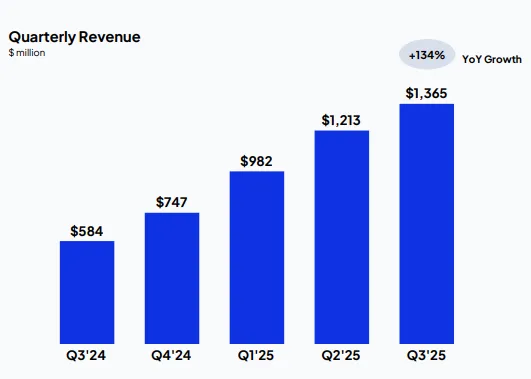
CoreWeave’s revenue growth has been constrained less by demand than by deployment capacity. In Q3 2025, the company reported revenue of approximately $1.4 billion, representing 134% year-over-year growth. Sequential growth slowed to the mid-teens on a quarter-over-quarter basis, reflecting delays in bringing new capacity online rather than any deterioration in customer demand.
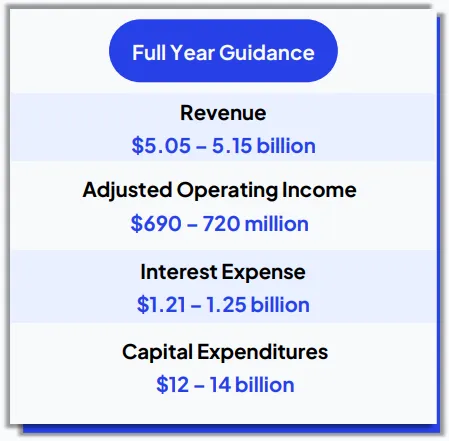
For full-year 2025, management guided to revenue between $5.05 billion and $5.15 billion, down modestly from earlier expectations due to infrastructure delivery timing. Importantly, guidance revisions were attributed to delays in powered shell availability and deployment sequencing rather than contract cancellations or pricing pressure.
This dynamic highlights the central tension in CoreWeave’s model. Revenue visibility is high, but revenue realization is gated by physical execution. Capital is deployed ahead of revenue, and any slippage in deployment pushes recognition forward without reducing fixed costs. Interest expense accrues, depreciation begins, and operating expenses are incurred regardless of whether capacity is monetized on schedule.
As scale increases, this sequencing risk becomes more consequential. Execution consistency, rather than demand generation, is the binding constraint on near-term financial performance.
4c. Customer Concentration and Counterparty Power
Microsoft is CoreWeave’s single largest customer, accounting for more than 60% of total revenue. That concentration reflects both the scale of Microsoft’s AI infrastructure needs and CoreWeave’s role in supporting workloads tied to frontier model development.
This relationship provides credibility, volume stability, and long-duration commitments. It has enabled CoreWeave to scale rapidly and maintain high utilization across newly deployed capacity. At the same time, it introduces material counterparty risk. Microsoft possesses significant negotiating leverage over pricing, renewal terms, and future capacity allocation.
Microsoft also retains strategic alternatives. As its internal AI infrastructure footprint expands, it can choose to repatriate workloads over time, even if existing contracts remain in force. The take-or-pay structure limits near-term revenue volatility but does not eliminate long-term dependency on a single counterparty whose incentives evolve alongside its own buildout.
Customer concentration therefore magnifies both upside and downside. Strong alignment sustains growth and backlog expansion. Any shift in sourcing strategy compresses margins and reduces long-term visibility. CoreWeave’s revenue model converts AI demand into contracted cash flow, but it does not neutralize the strategic power of its largest customer.
5. Financial Engine and Accounting Reality
5a. Revenue Growth and Margin Profile
CoreWeave’s revenue trajectory through 2025 reflects a business scaling into demand faster than physical infrastructure can be deployed. In Q2 2025, the company reported revenue of approximately $1.2B, representing 207% year-over-year growth. In Q3 2025, revenue increased to approximately $1.4B, representing 134% year-over-year growth.
For full-year FY 2025, management guided to revenue between $5.05B and $5.15B. The moderation in near-term growth expectations was attributed to deployment timing rather than customer demand. Backlog continued to expand even as quarterly recognition was constrained by infrastructure readiness.
On an operating basis, margins appear strong prior to capital structure effects. In Q3 2025, CoreWeave reported Adjusted EBITDA of approximately $838M, corresponding to a 61% margin. Adjusted operating income totaled approximately $217M, or a 16% margin.
These figures indicate that under contracted utilization, the gross economics of renting scarce GPU capacity can support substantial operating profitability. Whether that profitability translates into durable earnings depends on how depreciation, interest expense, and dilution evolve as scale increases.
5b. EBITDA Versus GAAP Earnings and What Gets Excluded
The difference between CoreWeave’s adjusted profitability and its GAAP results is substantial. In Q3 2025, despite reporting strong adjusted margins, the company recorded a GAAP net loss of approximately $110M, equivalent to an (8%) net margin.
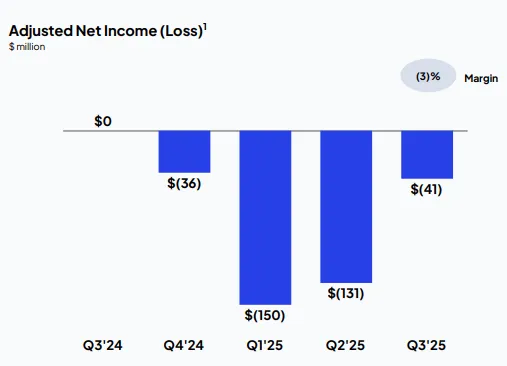
The gap between adjusted EBITDA and GAAP net income is driven primarily by depreciation and interest expense, with additional volatility introduced by non-cash fair value adjustments related to warrants and convertible instruments. These adjustments fluctuate with the company’s stock price and capital structure rather than with operating performance.
Adjusted metrics are useful for understanding unit-level economics under high utilization. GAAP results capture the full cost of financing and asset ownership. Both views are necessary to evaluate the business, but equity outcomes over a full cycle are ultimately governed by the latter.
5c. Depreciation Policy, Useful Life Assumptions, and Sensitivity
Depreciation is a central determinant of CoreWeave’s reported earnings. In Q3 2025, depreciation expense totaled approximately $630M. The company depreciates servers and GPUs over a 6-year useful life.
The sensitivity of earnings to this assumption is material. Shortening the useful life accelerates expense recognition without changing cash outlay. A shift from a 6-year to a 4-year depreciation schedule increases the annual depreciation rate by roughly 50%. Applied to the Q3 run rate, quarterly depreciation would rise to approximately $945M, an increase of about $315M.
Against $217M of adjusted operating income in the same quarter, this illustrates how tightly operating profitability is linked to useful life assumptions. Small changes in depreciation policy materially alter the income statement.
The economic implication follows the hardware lifecycle. GPU generations turn over rapidly, and training workloads migrate to newer architectures. Older hardware can remain productive for inference and secondary workloads, but utilization and pricing tend to decline as performance gaps widen. A longer depreciation schedule assumes that sufficient economic value persists across these later phases to justify extended cost recognition.
As a result, CoreWeave’s earnings profile is highly sensitive to utilization discipline and the pace of hardware obsolescence. Depreciation is an active driver of reported profitability rather than a background accounting choice.
5d. Interest Expense, Leverage, and Fixed Cost Drag
CoreWeave’s expansion has been financed with significant leverage. In Q3 2025, interest expense totaled approximately $310M, implying an annualized burden of roughly $1.2B.
These financing costs are largely fixed in the near term. They accrue regardless of deployment timing, utilization levels, or customer onboarding schedules. When capacity ramps smoothly and revenue scales, interest expense declines as a percentage of sales. When deployment is delayed, the expense remains while revenue recognition shifts.
This structure increases sensitivity to execution. Growth accelerates equity value when infrastructure delivery and utilization align with plan. Delays or inefficiencies translate quickly into pressure on earnings because financing costs do not flex with operations.
The balance sheet and income statement are therefore tightly linked. Equity outcomes depend on whether operating leverage expands faster than the combined drag of depreciation, interest expense, and dilution over the full hardware cycle.
6. Capital Structure and Balance Sheet Risk
6a. Debt Stack Composition and Maturity Profile
CoreWeave’s growth has been financed through an aggressive and layered debt strategy. As of late 2025, total debt exceeded $18B, distributed across senior notes, term loans, revolving credit facilities, and convertible instruments. Much of this capital was raised to accelerate GPU procurement and data center deployment during a period of extreme hardware scarcity.
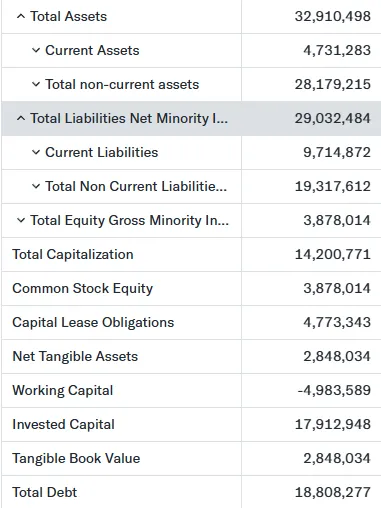
A significant portion of the debt carries interest rates near or above 9%, with maturities extending into the early 2030s. While recent convertible issuance reduced near-term cash interest expense, the broader structure remains highly sensitive to both utilization and refinancing conditions. Debt service requirements are fixed, while revenue realization depends on timely deployment and sustained demand.
The maturity profile reduces immediate liquidity risk but increases long-duration exposure. Capital committed today must remain productive across multiple hardware cycles for the equity to compound. That requirement places pressure on assumptions around asset longevity and residual value.
6b. Asset-Backed Financing and GPU Collateral
CoreWeave has relied heavily on asset-backed financing, using GPUs themselves as collateral for debt facilities. This approach reflects the scarcity value of high-end AI accelerators during the current cycle, but it embeds a critical assumption: that GPUs retain sufficient liquidation value over time.
Collateralized lending against hardware works best when asset values decline slowly and predictably. GPU economics do not follow that pattern. Performance leaps between generations are large, and pricing for older hardware adjusts quickly as newer chips enter production. While GPUs rarely become unusable, their economic value shifts sharply as training workloads migrate forward.
If GPU resale values decline faster than expected, collateral coverage weakens. That does not necessarily trigger immediate distress, but it narrows financial flexibility. Refinancing becomes more expensive, covenants tighten, and equity absorbs a larger share of execution risk.
Asset-backed financing accelerates growth. It also compresses the margin for error.
6c. Dilution Pathways in Bullish Versus Stress Scenarios
Dilution is a structural feature of CoreWeave’s model rather than a contingent outcome. Growth requires continuous capital infusion, whether through convertibles, equity issuance, or stock-based compensation. Faster growth increases dilution in absolute terms, even when deployed at higher incremental returns.
Under stress scenarios, dilution can accelerate as equity is used defensively to preserve liquidity or satisfy refinancing needs. Under bullish scenarios, dilution reflects expansion rather than survival. In both cases, share count growth interacts with depreciation and interest expense to shape per-share outcomes.
This dynamic reinforces the importance of asset productivity. Equity value depends not only on scaling revenue, but on whether deployed capital generates returns in excess of both financing costs and dilution over time.
6d. Useful Life Assumptions Versus Real-World GPU Lifecycles
CoreWeave depreciates its GPU fleet over 6 years, an assumption that materially shapes reported earnings and balance sheet strength. That assumption sits at the optimistic end of industry practice and carries risk when measured against real-world hardware cycles.
Modern AI accelerators from NVIDIA and AMD follow an aggressive release cadence. New architectures typically arrive every 18 to 24 months, delivering step-function improvements in performance per watt, memory bandwidth, and interconnect efficiency. Training workloads migrate quickly to the newest generation because compute efficiency translates directly into cost savings at scale.
Older GPUs do not become obsolete overnight, but their economic role changes. They are pushed out of frontier training and into inference or secondary workloads where pricing and utilization are lower. This transition compresses margins and reduces the revenue contribution per unit of hardware well before the end of a six-year window.
A 4-year useful life aligns more closely with this reality. It captures the period during which a GPU is likely to generate its highest economic returns before performance gaps materially affect pricing power and utilization. Extending depreciation to six years assumes that later-stage workloads sustain enough value to justify prolonged cost recognition.
This assumption is central to CoreWeave’s financial profile. Longer depreciation reduces near-term expense and improves reported operating metrics. Shorter depreciation accelerates cost recognition and reveals the true capital intensity of the model earlier in the lifecycle.
The risk is not that GPUs stop working. It is that their economic productivity declines faster than the accounting schedule implies. When depreciation outpaces economic reality, earnings quality suffers and equity becomes more sensitive to utilization shocks, pricing pressure, and refinancing conditions.
This mismatch does not invalidate the business model. It raises the bar for execution. Sustained utilization across multiple workload tiers must persist for long enough to reconcile accounting assumptions with hardware economics. If that alignment weakens, balance sheet risk rises quickly.
7. Competitive Landscape: Who Solves This Problem Better
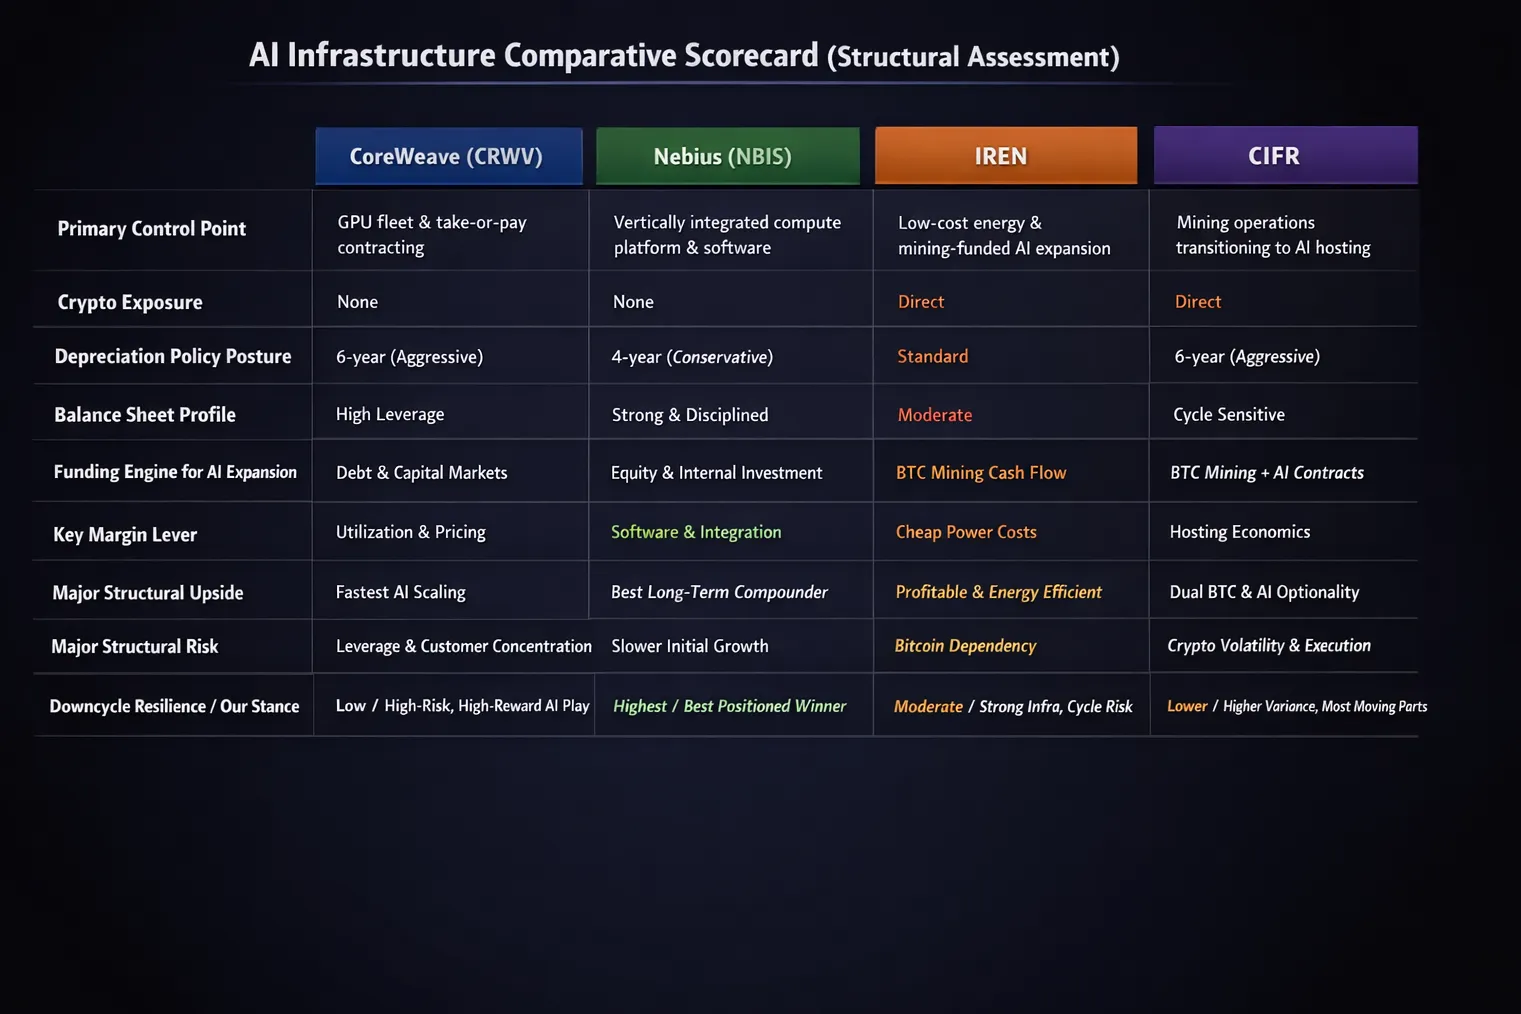
Before comparing CoreWeave to other AI infrastructure names, scope matters. Our free research on Nebius, IREN, and CIFR focuses on operating models, contract structures, and strategic positioning. Those reports discuss dilution qualitatively but do not model share count expansion scenario by scenario.
As a result, price targets and upside ranges in those pieces should be interpreted directionally and should not be treated as one-to-one comparisons with this CoreWeave analysis, which explicitly incorporates leverage, dilution, and financing dynamics into per-share outcomes.
This section is comparative rather than computational. The objective is to understand how different companies approach the same infrastructure problem and why balance sheet structure, accounting discipline, and control points in the stack lead to divergent equity outcomes even under strong AI demand.
7a. CoreWeave Versus Nebius
Nebius approaches AI infrastructure with a more vertically integrated and structurally conservative model. Unlike CoreWeave, which concentrates risk at the GPU and financing layer, Nebius emphasizes control across power, deployment, and software orchestration. This vertical integration reduces dependency on third-party delivery timelines and narrows execution risk as scale increases.
Nebius also maintains a portfolio of high-upside internal investments adjacent to its core compute platform. These initiatives introduce optionality beyond raw GPU rental economics and provide additional pathways for margin expansion that do not rely solely on hardware pricing or utilization.
A further distinction lies in software. Nebius has invested meaningfully in internal tooling designed to improve scheduling efficiency, utilization, and customer workflow integration. Over time, this software layer has the potential to lift margins above those of pure infrastructure providers by embedding compute more deeply into customer operations.
Accounting discipline reinforces these advantages. Nebius depreciates its infrastructure over a shorter useful life, aligning expense recognition more closely with observed GPU lifecycles. This produces lower reported near-term profitability but improves earnings quality and reduces sensitivity to hardware obsolescence.
Taken together, Nebius trades early scale for durability. While it may not capture demand as quickly as CoreWeave, its model is better positioned to compound equity value with less balance sheet fragility. Among the group, this structure presents the cleanest long-term risk profile.
7b. CoreWeave Versus Iris Energy
IREN solves the AI infrastructure problem from the energy layer upward. Its primary asset is access to low-cost, renewable power paired with data center development capability. This positioning allows IREN to support dense compute deployments while maintaining cost discipline at the most constrained input in the AI stack.
Unlike many infrastructure peers, IREN is currently profitable. Its bitcoin mining operations generate cash flow that can be reinvested into AI capacity buildout, reducing reliance on external financing during expansion phases. This internal funding loop lowers near-term dilution risk and provides flexibility as AI contracts scale.
The tradeoff lies in exposure to crypto market dynamics. While bitcoin mining provides capital today, sustained weakness in crypto pricing can reduce cash generation and shift the business from funding growth to preserving liquidity. In that environment, mining transitions from a source of optionality to a potential anchor on capital allocation.
IREN’s model benefits from power control and profitability. Its risk sits in the cyclicality of its funding source and the execution complexity of transitioning capacity from mining to AI workloads at scale.
7c. CoreWeave Versus Cipher Mining
CIFR follows a similar hybrid path, using bitcoin mining infrastructure and liquidity to support a move into long-duration AI hosting contracts. The model provides flexibility during the build phase and can reduce dependence on external capital when crypto markets are favorable.
As with IREN, this structure introduces an additional variable into the equity story. Bitcoin exposure affects both cash flow stability and investor perception. During strong crypto cycles, it can accelerate AI expansion. During downturns, it can complicate capital planning and increase volatility.
CoreWeave’s model is more singular. It bears full exposure to AI infrastructure economics without the offset of a parallel cash-generating business. CIFR’s diversification provides optionality, but it also layers macro sensitivity on top of execution risk.
The difference is not demand. It is the number of moving parts that must align for equity value to compound.
7d. Why AI Demand Can Be Exploding While Equity Outcomes Diverge
All of these companies operate within the same demand environment. AI compute requirements continue to expand rapidly and are likely to remain elevated for years. That shared tailwind does not produce uniform shareholder outcomes.
Equity divergence emerges from structural choices. Accounting conservatism, leverage tolerance, customer concentration, vertical integration, and control over power and software compound over time. Companies that move fastest can capture early share while increasing fragility. Companies that move more deliberately may sacrifice near-term scale while preserving long-term resilience.
This cycle will reward operators that pair demand exposure with balance sheet discipline and realistic asset lifecycle assumptions. Among the peer group, some models are better aligned with that outcome than others.
CoreWeave remains one of the most aggressive expressions of AI infrastructure demand. Its peers illustrate alternative paths. Understanding those differences is essential to underwriting risk.
8. Operating Model and Forecast Framework (2025–2030)
CoreWeave is not a business that lends itself to linear forecasting. The company sits at the intersection of extraordinary demand growth and unusually high structural risk, shaped by leverage, capital intensity, hardware lifecycle dynamics, and customer concentration. As a result, our forward view is constructed using a scenario-based framework rather than a single-point projection.
This section establishes how we translate current financials and management guidance into a 2030 operating view across multiple outcomes. It does not attempt to predict which scenario will occur. Its purpose is to define the mechanics of each path so that valuation and probability weighting in later sections are grounded in operating reality rather than narrative preference.
8a. Modeling Assumptions Anchored to Management Guidance
Our base inputs are anchored to reported results and management guidance through 2025 and early 2026. In 2025, CoreWeave reported revenue of approximately $1.2B in Q2 and $1.4B in Q3, with full-year guidance of $5.05B–$5.15B. These figures establish the current run rate and confirm that demand is not the limiting factor.
The base case assumes execution broadly consistent with this trajectory. Capacity continues to come online, delivery constraints ease gradually, and backlog converts into revenue without a step-change in pricing or utilization assumptions. We do not assume perfect execution, nor do we assume structural deterioration relative to what management has already communicated.
The bear and bull cases are constructed by deviating from this path along a limited set of variables: deployment velocity, pricing persistence, utilization stability, and capital efficiency. We do not alter the business model itself. We alter how well it is executed.
8b. Revenue Growth Trajectories by Scenario
Revenue growth through 2030 is driven by three factors already observed in the business.
First is capacity deployment. Revenue scales as powered infrastructure is delivered and placed into service. Delays shift revenue recognition without eliminating demand, but repeated slippage compounds operational and perception risk.
Second is utilization. Take-or-pay contracts provide visibility, but economic outcomes still depend on how fully and consistently the fleet is utilized, particularly as hardware ages and workloads migrate.
Third is mix. Frontier training workloads support premium economics, while inference and secondary workloads expand volume but can compress pricing depending on supply conditions and competition.
The bear case assumes deployment friction persists longer than expected, pricing power softens as supply normalizes, and older hardware transitions into lower-value workloads more quickly. Revenue continues to grow, but at a meaningfully slower rate.
The base case assumes deployment improves in line with guidance, utilization remains high, and pricing moderates without collapsing. Revenue growth remains elevated through the second half of the decade, though not at peak-cycle rates.
The bull case assumes faster and cleaner delivery, sustained demand for high-value workloads, and successful diversification beyond a narrow customer set. Revenue compounds rapidly through 2030 under this outcome.
8c. Margin Expansion and Steady-State Economics
Reported operating margins already demonstrate the economic power of scarce AI infrastructure under contract. In Q3 2025, CoreWeave reported adjusted EBITDA margins above 60% and adjusted operating margins in the mid-teens. At the same time, depreciation and interest expense dominated GAAP results.
Our framework treats margin expansion as possible but not inevitable. Margins depend on sustained utilization, pricing discipline, and the economic life of the GPU fleet relative to depreciation assumptions. As hardware transitions from training to inference, margin quality matters as much as margin level.
The base case assumes modest improvement in net margins as operating leverage emerges and revenue scales faster than fixed costs. The bear case assumes margin gains are largely absorbed by depreciation and financing drag. The bull case assumes operating leverage outpaces those drags, allowing earnings to scale meaningfully despite capital intensity.
8d. EPS Construction and Share Count Logic
Per-share outcomes are central to this analysis. CoreWeave’s model is capital intensive, and capital is not free.
Interest expense remains a fixed burden that does not flex with utilization timing. Depreciation reflects real economic cost tied to hardware productivity, not a temporary accounting distortion. Share count expands as capital is raised through convertibles, equity issuance, and stock-based compensation.
Importantly, higher dilution in bullish outcomes is not a modeling error. Faster growth requires more capital. The distinction between scenarios is not whether dilution occurs, but whether incremental capital is deployed at returns sufficient to overwhelm that dilution.
The base case assumes continued but manageable share count growth consistent with funding needs implied by guidance. The bear case assumes dilution accelerates under execution pressure. The bull case assumes dilution persists, but capital is deployed at higher incremental returns, preserving per-share upside.
9. Scenario Analysis
This section translates the operating framework from Section 8 into discrete, internally consistent outcomes. Each scenario reflects a different interaction between demand, execution, capital intensity, and market perception. None of these scenarios require a collapse in AI demand. The divergence comes from how effectively CoreWeave converts demand into durable per-share value.
9a. Bear Case
9a.i. Conditions Required
The bear case assumes CoreWeave remains operationally relevant but structurally constrained. Demand for AI compute persists, yet several frictions prevent scale from translating into strong equity outcomes.
Deployment continues, but delivery timing remains uneven. Powered shells and infrastructure readiness lag expectations, pushing revenue recognition forward while fixed costs accrue. Pricing power compresses as GPU supply normalizes and hyperscalers expand internal capacity. Older GPU generations are pushed into lower-value workloads sooner than anticipated, reducing fleet-level economics.
Customer concentration persists, limiting negotiating leverage and strategic flexibility. Depreciation and interest expense continue to dominate the income statement, preventing meaningful GAAP profitability despite revenue growth. Capital requirements remain elevated, forcing continued dilution under less favorable conditions.
9a.ii. Revenue, Margin, EPS, and CAGR Outcomes
Northwise Premium
Choose how to continue with Northwise
Join Northwise Premium
Unlock the rest of this report, its complete valuation, the downloadable model, portfolios, and action framework.
Join Northwise PremiumCreate a Free Account
Continue across Free Northwise research, follow companies, save reports, and receive updates.
Create a Free Account
CoreWeave Stock Forecast 2030
CoreWeave can become the dominant independent AI cloud and still deliver poor shareholder returns. This model tests the growth, financing, and dilution required.

Celsius Stock Analysis: The Shelf Reset and the Second Growth Curve
Celsius stock analysis of the shelf reset, Alani growth, Pepsi economics and cash flow, with a 2030 model and a Premium valuation and entry-price framework.

Meta AI Spending: The Customer Is Already Here
Can Meta turn AI spending into shareholder returns? We model advertising, Muse, hardware, capital costs and cash flow through 2030, with a full valuation.
Northwise Portfolios
See how the research becomes real decisions
Reader discussion
Discuss the research
Premium access is required to join this report's discussion.
Join Northwise Premium
No comments yet. Start a thoughtful discussion.