
CELH Stock Forecast 2027: When the Second Brand Leads

Our CELH 2027 forecast explains Alani growth, CELSIUS recovery, international expansion, evidence-based scenarios and the valuation framework.
In this article
Alani Nu just became the largest brand inside Celsius Holdings. We follow every brand from the shelf to the income statement and ask how much 2027 can earn once the portfolio has to carry the company.
The Name on the Door
For most of its public life, Celsius Holdings was a single brand with a stock ticker attached. In the third quarter of 2026, that stopped being true. According to the company's third-quarter results, Alani Nu generated $410.1 million of revenue against $356.8 million for the CELSIUS brand, and the company now sells more of a drink it acquired than of the one it is named after.
The handover happened at an awkward moment. CELSIUS revenue fell about 6% in the quarter, gross margin slid to 46.8%, and management pushed its timeline for a return to low-50s margins further out. The shares closed at $28.46 on November 20, 2026, against a 52-week high of $59.31.
Two numbers frame the year ahead. Wall Street expects 2027 revenue to grow about 8%. Our probability-weighted forecast grows it 17%.
The gap comes almost entirely from one brand. Our 2027 central build reaches $3.85 billion of revenue, and Alani in North America supplies roughly two-thirds of the increase. CELSIUS recovers modestly, international keeps compounding from a small base, Rockstar holds flat, and a small Alani launch outside North America opens a second geography for the newer brand.
Our October Celsius analysis laid out the long arc of the portfolio through 2030. Here we narrow the lens to a single year and follow each brand from retail demand to booked revenue, from gross profit to the earnings that remain after Pepsi's preferred claims, and from operating cash to what that cash can fund.
The Debate Around the Stock
The bear camp has plenty to work with. The flagship brand has shrunk for most of 2026, gross margin has fallen for three consecutive quarters, and analysts have spent the autumn trimming estimates. Costco now sells a cheaper Kirkland energy drink beside the brand on its shelves. To a skeptic, Alani's surge looks like a limited-time-offer machine that will cool once its fall flavors leave the cooler.
The bull camp sees a portfolio doing what portfolios are supposed to do. Retail sales across CELSIUS, Alani Nu and Rockstar rose 14.7% in tracked U.S. channels during the third quarter, and the company held roughly 20.7% of U.S. energy drink dollar share. Core Alani retail sales grew about 50% even after stripping out the Witch's Brew seasonal launch. International revenue rose 78%.
Both camps are reading the same quarter. The disagreement is over which line of the income statement tells the truth about 2027.
Our work lands closer to the bulls on revenue and closer to the bears on margins. We think the market is underestimating how much Alani's consumer demand will turn into reported sales once the distribution transition settles, and we think the gross margin recovery will be slower and smaller than the optimists hope. Earnings growth in our forecast comes from volume and operating leverage, with a cost base that improves only at the edges.
Where We Part Ways With the Street
Consensus figures are useful only when periods and definitions line up. The table compares our forecast with Yahoo Finance consensus viewed on November 19, 2026, after the third-quarter report.
Calendar metric | Street | Northwise weighted | Difference |
|---|---|---|---|
Q4 2026 revenue | $736.6M | $807.0M | +9.6% |
2026 revenue | $3.19B | $3.25B | +2.0% |
2027 revenue | $3.45B | $3.81B | +10.4% |
2027 revenue growth | 8.2% | 17.1% | +8.9 pts |
2027 normalized EPS | $1.67 | $1.835 | +9.9% |
Growth explains most of the revenue gap. Our higher 2026 exit explains roughly $70 million of the 2027 difference. The remaining $290 million or so comes from expecting the business to grow about twice as fast as consensus next year.
The fourth quarter is the first place the two views collide. Our $807 million estimate implies about 12% growth over the $721.6 million Celsius reported a year earlier, while the Street's $736.6 million implies about 2%.
On the third-quarter call, management said fourth-quarter growth would fall below the 36% year-to-date pace, citing $20 million to $25 million of shipments pulled into the third quarter and a roughly $25 million inventory benefit in the prior-year period. Our estimate already absorbs both items. We simply hold a firmer view of underlying demand than the average analyst.
The definitions are close enough to compare. Celsius's adjusted EPS removes acquisition, integration, distributor termination and reorganization costs. Our normalized EPS removes only a modeled debt-fee writeoff, keeps stock compensation and acquisition amortization as expenses, and allocates earnings to Pepsi's preferred shares before common holders. If anything, our measure is the stricter of the two, which makes the 10% EPS gap more meaningful.
The EPS gap is narrower than the revenue gap for a reason that runs through the whole forecast. A great deal of our incremental revenue comes from Alani sold through direct-store-delivery partners and from international markets, and both carry lower margins than the CELSIUS core. Growth arrives, and some of its profitability is shared along the way.
How a Retail Dollar Becomes Revenue
Alani's third quarter contained two very different growth rates. Tracked retail sales rose about 58%. Company revenue rose about 24%. Investors who pick one of those numbers and ignore the other end up with very different stocks.
Retail scanner data counts what shoppers buy at the register in covered channels. Company revenue counts what Celsius sells to its customers, after trade spending, billbacks and contract accounting. Over a full year the two should travel together, though inventory movements, promotions and changes in who distributes the product can pull them apart for quarters at a time.
The distribution change is the largest of those forces for Alani. As more volume moves through PepsiCo's direct-store-delivery system, distributors take a share of each retail dollar in return for placing product in more coolers. Celsius said higher DSD mix brought higher trade investments and billbacks that reduced reported net revenue in the quarter.
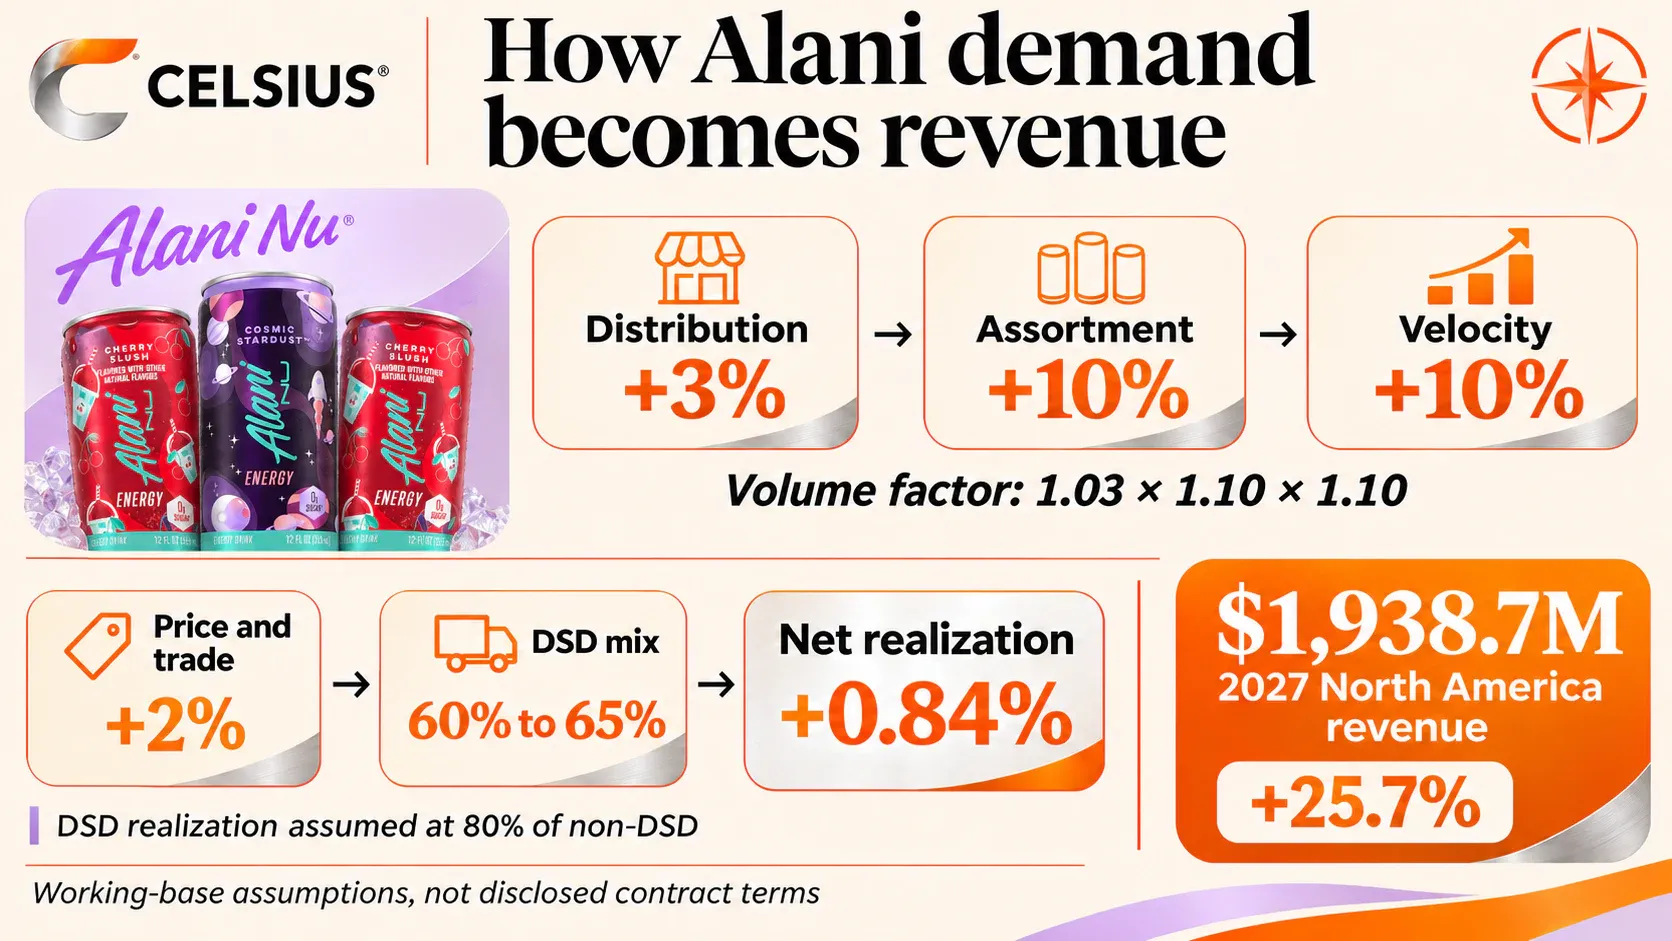
We model that mechanism explicitly. DSD carries about 60% of Alani volume in 2026 and 65% in 2027, with Celsius realizing 80% as much revenue per unit through DSD as it does selling direct. Both figures are our estimates, since the contracts are not disclosed. They mean that a 2% improvement in Alani price and trade terms becomes only about 0.8% of net realization after mix.
Management expects cleaner Alani comparisons around the second quarter of 2027, once the transition has been lapped. From that point the gap between retail growth and revenue growth should narrow, and the company's reported numbers will start to show how much of Alani's consumer momentum Celsius actually keeps.
The 2026 Exit Sets the Table
Every 2027 growth rate depends on where 2026 ends. Our starting point combines $2,447.8 million of reported revenue for the first nine months with an $807 million fourth-quarter estimate.
Brand and geography | Nine months 2026 | Q4 2026 estimate | 2026 estimate |
|---|---|---|---|
CELSIUS North America | $988.2M | $297.0M | $1,285.2M |
Alani North America | $1,142.6M | $400.0M | $1,542.6M |
Rockstar North America | $213.5M | $67.0M | $280.5M |
CELSIUS international | $103.6M | $43.0M | $146.6M |
Total | $2,447.8M | $807.0M | $3,254.8M |
North America here means the United States and Canada, and international excludes both. Brand figures follow the revenue disaggregation in the September 2026 10-Q. They are analytical divisions, and Celsius does not report separate brand profits.
The fourth-quarter estimate already reflects the shipment timing management described, so we do not subtract it a second time. Nine-month growth of 36% also flatters any simple extrapolation, since it includes Alani for periods when the prior year did not. A fully comparable 2027 grows from the full-year base above.
International needs one more note. Our $43 million fourth-quarter estimate is nearly double the $22.1 million reported a year earlier, which means 2027 international growth starts from an exit rate that has already accelerated. The 55% annual growth in our central case sits on top of that higher base.
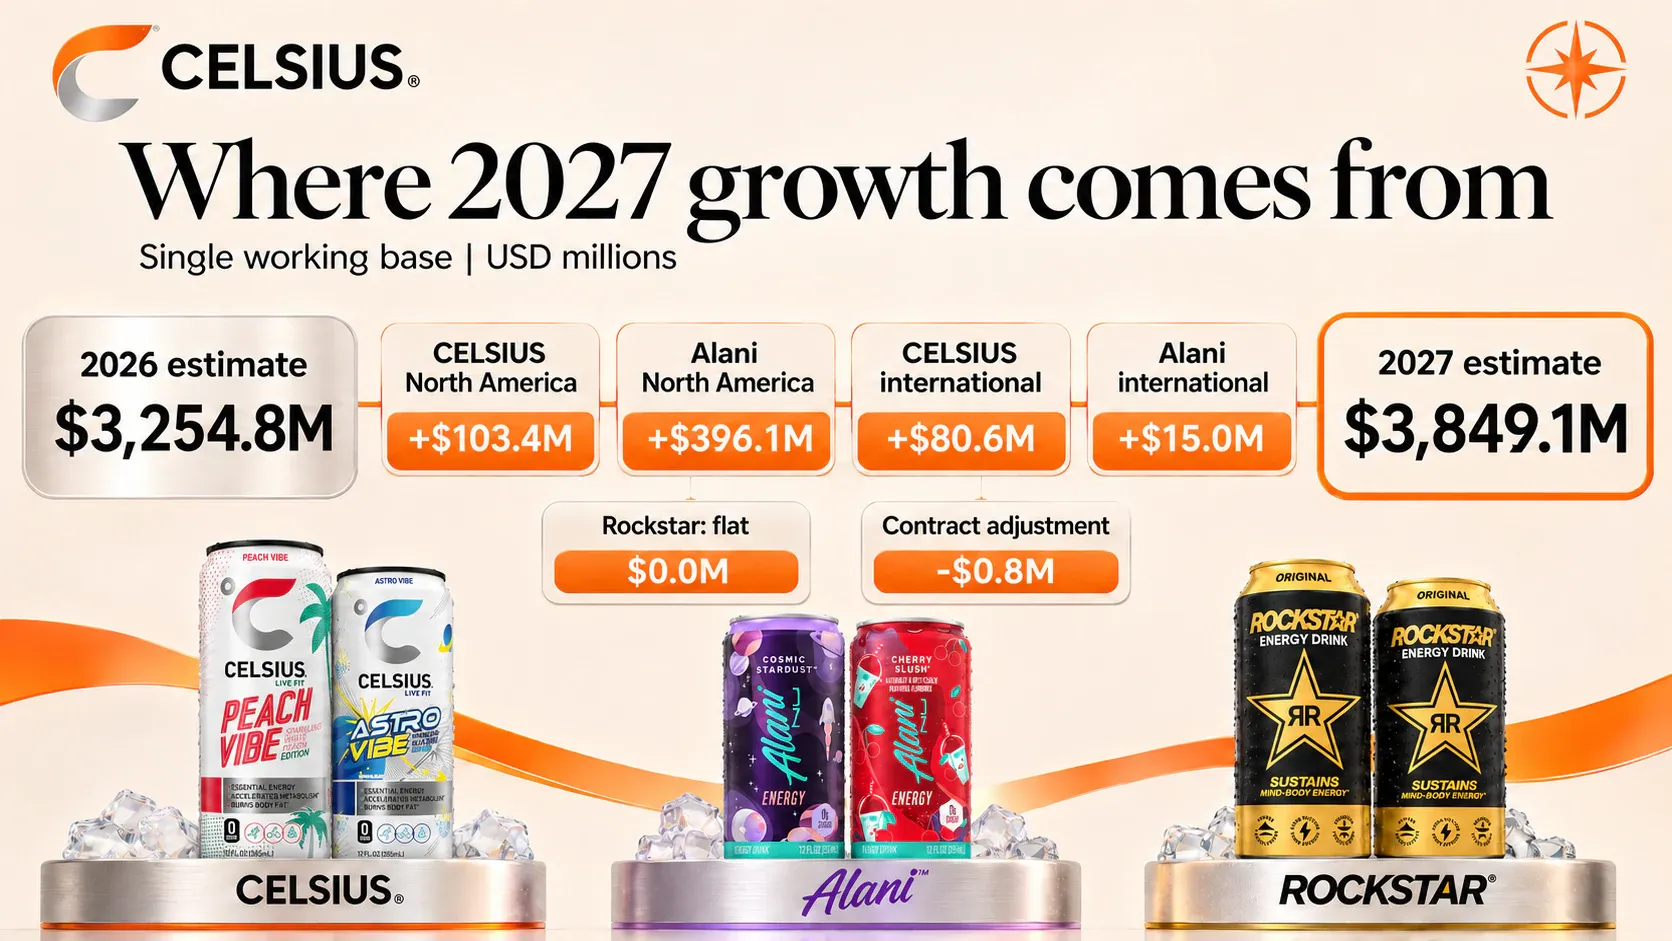
Here is how each brand moves from that starting point in our central build, the single path where every central assumption holds.
Brand and geography | 2026 estimate | 2027 central build | Growth | Revenue added |
|---|---|---|---|---|
CELSIUS North America | $1,285.2M | $1,388.6M | 8.0% | $103.4M |
Alani North America | $1,542.6M | $1,938.7M | 25.7% | $396.1M |
Rockstar North America | $280.5M | $280.5M | 0.0% | $0.0M |
CELSIUS international | $146.6M | $227.2M | 55.0% | $80.6M |
Alani international | $0.0M | $15.0M | New | $15.0M |
Contract adjustment | ($0.8M) | ($0.8M) | ||
Consolidated | $3,254.8M | $3,849.1M | 18.3% | $594.3M |
Alani: Where Two-Thirds of the Growth Lives
Alani Nu adds $396 million of revenue in our central build, more than every other brand and region combined. Its forecast rests on four separate drivers, and keeping them separate is most of the work.
Distribution measures how many productive locations carry the brand. Assortment measures how many products each of those locations carries. Velocity measures how fast each comparable product sells in each comparable location. Price and trade capture what Celsius keeps per unit before the channel shift.
Alani North America driver | Weaker | Central | Stronger |
|---|---|---|---|
Productive distribution growth | 2% | 3% | 4% |
Productive assortment growth | 6% | 10% | 12% |
Comparable-product velocity growth | 5% | 10% | 13% |
Price and trade before channel mix | 0% | 2% | 2% |
DSD share of volume, 2027 | 65% | 65% | 65% |
Company revenue | $1,731.3M | $1,938.7M | $2,047.4M |
Growth from 2026 | 12.2% | 25.7% | 32.7% |
The drivers multiply. In the central build, distribution adds $46.3 million, assortment $158.9 million, velocity $174.8 million and price and trade $38.5 million, before the channel shift takes back $22.3 million.
Most of the growth now has to come from inside stores the brand already reaches. Alani's weighted distribution in convenience already sits near the top of the range, so another 3% of productive doors is a modest ask. Ten percent more products per store and 10% faster sales per product are the larger commitments, and they describe a brand earning more cooler space and repeat purchases from shoppers who already know it.
The evidence supports that direction. Core retail sales grew about 50% in the third quarter excluding Witch's Brew, which generated more than $130 million of retail sales on its own across traditional and club channels. A brand growing that fast on its permanent lineup has room to slow considerably and still meet a 26% revenue forecast.
The forecast has two ways to overstate itself, and we try to avoid both. Applying retail growth directly to company revenue ignores the DSD economics. Counting the same productivity gain as both a new product and a faster-selling product inflates the result through multiplication. Public data cannot fully separate assortment from velocity, so our split is an estimate and a matched-store panel would sharpen it.
The weaker path still grows 12.2%, a sharp slowdown from current demand that remains consistent with continued distribution gains. We do not treat zero growth as an ordinary downside. Getting there would require evidence that shoppers are leaving the permanent lineup, and the data so far points the other way.
CELSIUS: Repair Before Growth
The namesake brand enters 2027 in recovery mode. Third-quarter CELSIUS revenue fell about 6%, and tracked retail sales declined roughly 7%, though sales per distribution point improved as weaker products came off the shelf. Removing slow sellers lifts the average for those that remain, and that improvement can coexist with a shrinking brand.
Management has reorganized around the problem. Celsius Holdings now runs its U.S. business as three divisions, CELSIUS, Alani Nu, and Rockstar Energy and Emerging Growth, each led by a president reporting to the chief executive. Alex Zigliara leads CELSIUS, and the company is still searching for an Alani president.
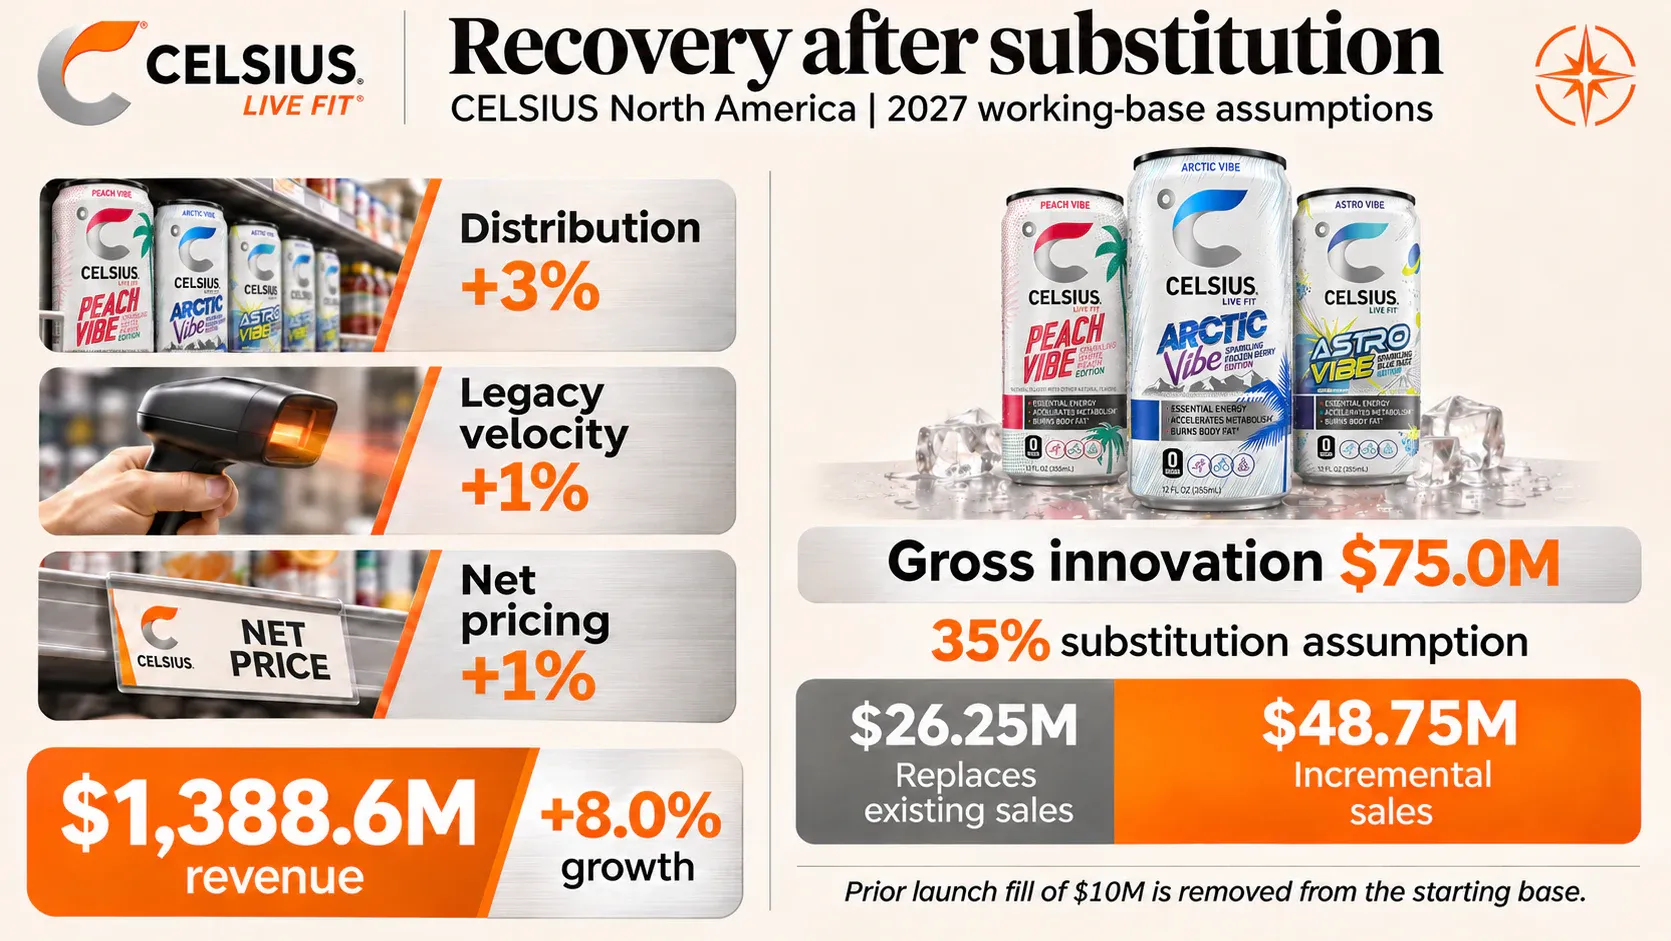
Our central forecast asks for repair before growth. We first remove an assumed $10 million of launch inventory shipped into 2026, then apply 3% productive distribution growth, 1% comparable velocity and 1% net pricing to the legacy business.
CELSIUS North America driver | Weaker | Central | Stronger |
|---|---|---|---|
Productive distribution growth | 1% | 3% | 4% |
Comparable existing-product velocity | -3% | 1% | 3% |
Net pricing | 0% | 1% | 1% |
New-product sales before substitution | $45M | $75M | $100M |
Share of new sales replacing legacy sales | 40% | 35% | 30% |
Company revenue | $1,276.3M | $1,388.6M | $1,449.6M |
Growth from 2026 | -0.7% | 8.0% | 12.8% |
Innovation sits on top. The central build assumes $75 million of new-product sales, with 35% of it coming out of existing CELSIUS purchases, for $48.75 million of net revenue. Energy + Hydration, a noncarbonated line shown at the NACS show in October, is one piece of that program, and management's November commentary described a broader innovation slate alongside work on the core.
A simple hurdle shows what $75 million requires. Fifty thousand active equivalent doors carrying two new products, each selling 15 cans a week for 50 weeks at about $1 of company revenue per can, gets there. The figures are illustrative units, not secured placements, and they give a concrete way to test the assumption as the products reach shelves.
Even the central build's 1% legacy velocity growth is a recovery assumption, and the third quarter has not yet proven it. We give the brand less confidence than Alani for that reason, and the probabilities later in the forecast reflect it directly.
Competition adds pressure at both ends of the price ladder. Costco's Kirkland Signature sparkling energy drink competes for the bulk-pack shopper, while Monster and Red Bull remain far larger in the convenience cooler. We handle private label inside the CELSIUS velocity and pricing drivers instead of layering a separate share penalty on top, which would count the same weakness twice.
Rockstar Holds Its Ground
Rockstar generated about $80 million of revenue in the third quarter, and management said the products it kept after trimming the lineup were tracking within about 1% of prior-year retail sales. We hold North American Rockstar revenue flat at $280.5 million in every outcome.
Flat is a simplification. A 5% decline would cost about $14 million of revenue and less than a cent of EPS, and a 3% gain would add about $8 million. Rockstar's 35.4% estimated gross margin, the lowest in the portfolio, keeps its earnings effect small either way.
The brand's larger contribution sits outside its own income statement. Its volume supports purchasing scale and retail relationships, and the new division gives it dedicated leadership. We would worry more about Rockstar absorbing management attention than about its sales line.
International: Two Separate Bets
Celsius sells the CELSIUS brand outside North America through partners such as Suntory Beverage & Food in Spain, and international revenue has accelerated through 2026. Growth ran about 55% in the first quarter, 10% in the second and 78% in the third, with nine-month growth of 47%.
The uneven sequence is a useful reminder that a single quarter is not an annual forecast. Management's November commentary pointed to progress across the U.K., France, Ireland, the Netherlands, Belgium, Spain and Portugal, with aided brand awareness roughly doubling in the U.K. and France since early 2025, and stronger results in Australia and New Zealand.
CELSIUS international outcome | Growth | 2027 revenue | Probability |
|---|---|---|---|
Slower conversion of listings into sales | 40% | $205.2M | 25% |
Central expansion path | 55% | $227.2M | 50% |
Stronger distribution and repeat purchasing | 70% | $249.2M | 25% |
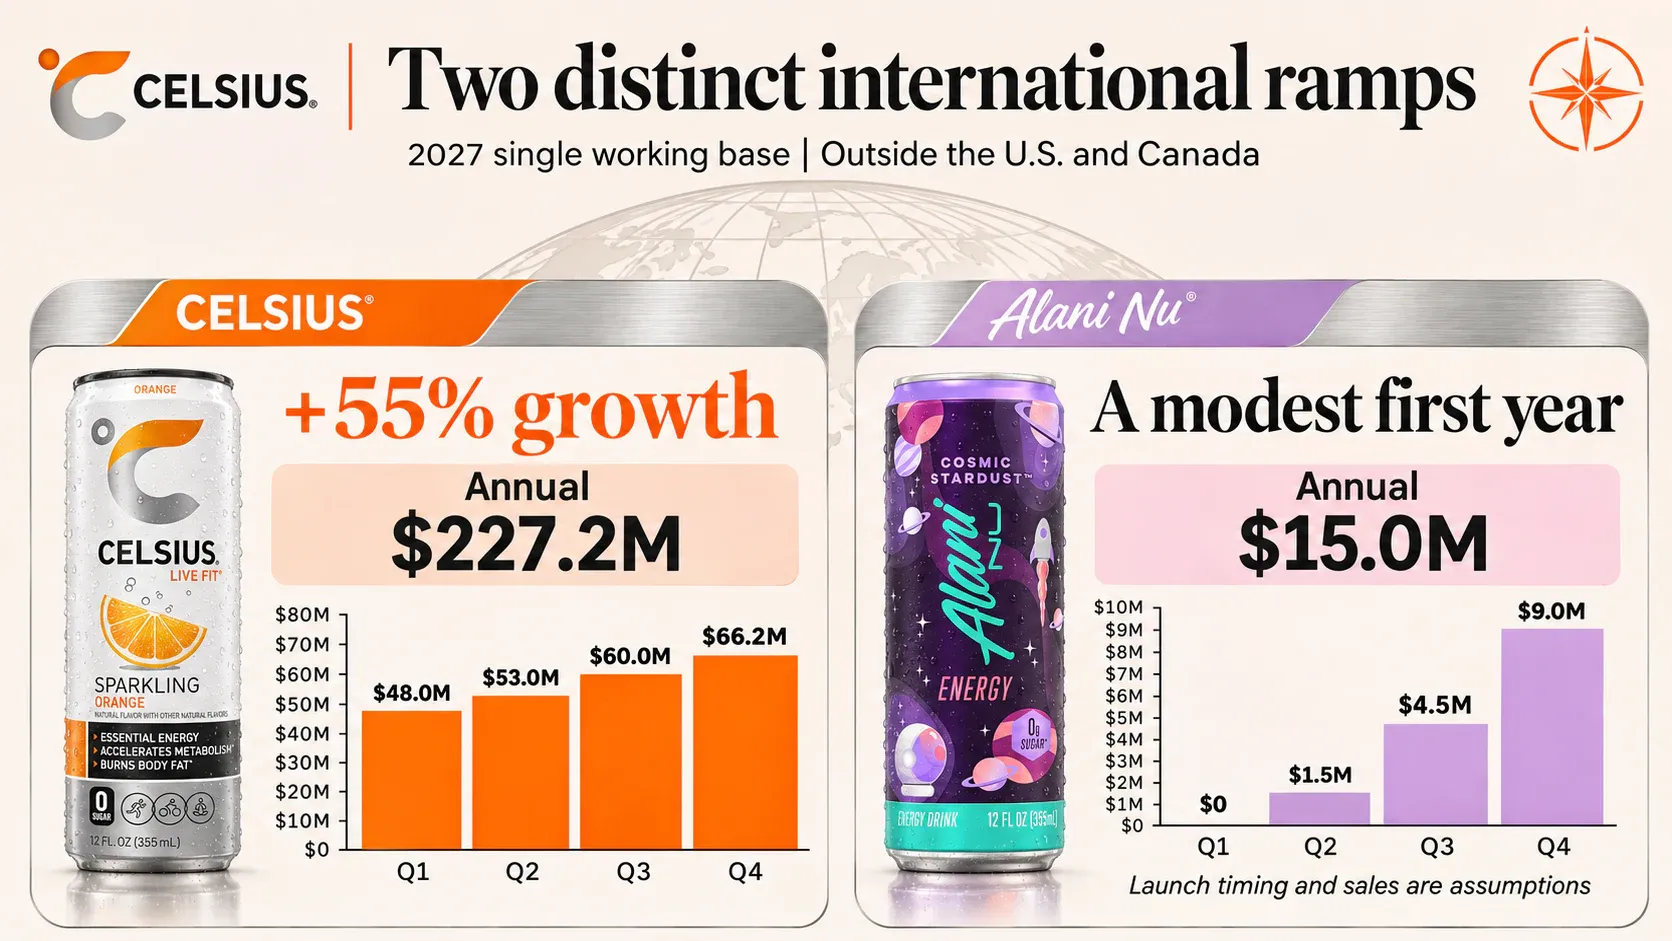
The central path builds quarter by quarter from $48 million to $66 million. Even the 40% path represents meaningful expansion. The mechanism we care about is distribution followed by reorders, and a shipment into a new market proves only the first half of it.
Management's longer-term ambition is for markets outside the United States to exceed 15% of revenue. Its definition includes Canada, and our international line excludes it, so the two do not compare directly.
Alani's first steps abroad are a separate and much smaller bet. Management discussed entering a few international markets in 2027 at its June investor conference, and said in November that launch markets were being finalized. We model $15 million of 2027 revenue, building from nothing in the first quarter to $9 million in the fourth, with branches of $0, $15 million and $25 million at 20%, 60% and 20% probabilities.
The launch carries its own economics. We assume a 38.5% gross margin, advertising at 20% of sales, variable selling costs of 4.5% and $1 million of fixed launch expense that remains even if sales never arrive. The result is roughly $1 million of contribution after launch costs in the central build. The launch matters for what it could become in later years far more than for anything it earns in 2027.
Margins: Where the Savings Have to Show Up
Gross margin is the part of the story where we sit closest to the bears. The third quarter's 46.8% compared with 48.1% in the second quarter and 51.3% a year earlier, as aluminum and freight costs rose. Management now describes full-year gross margin in the high 40s.
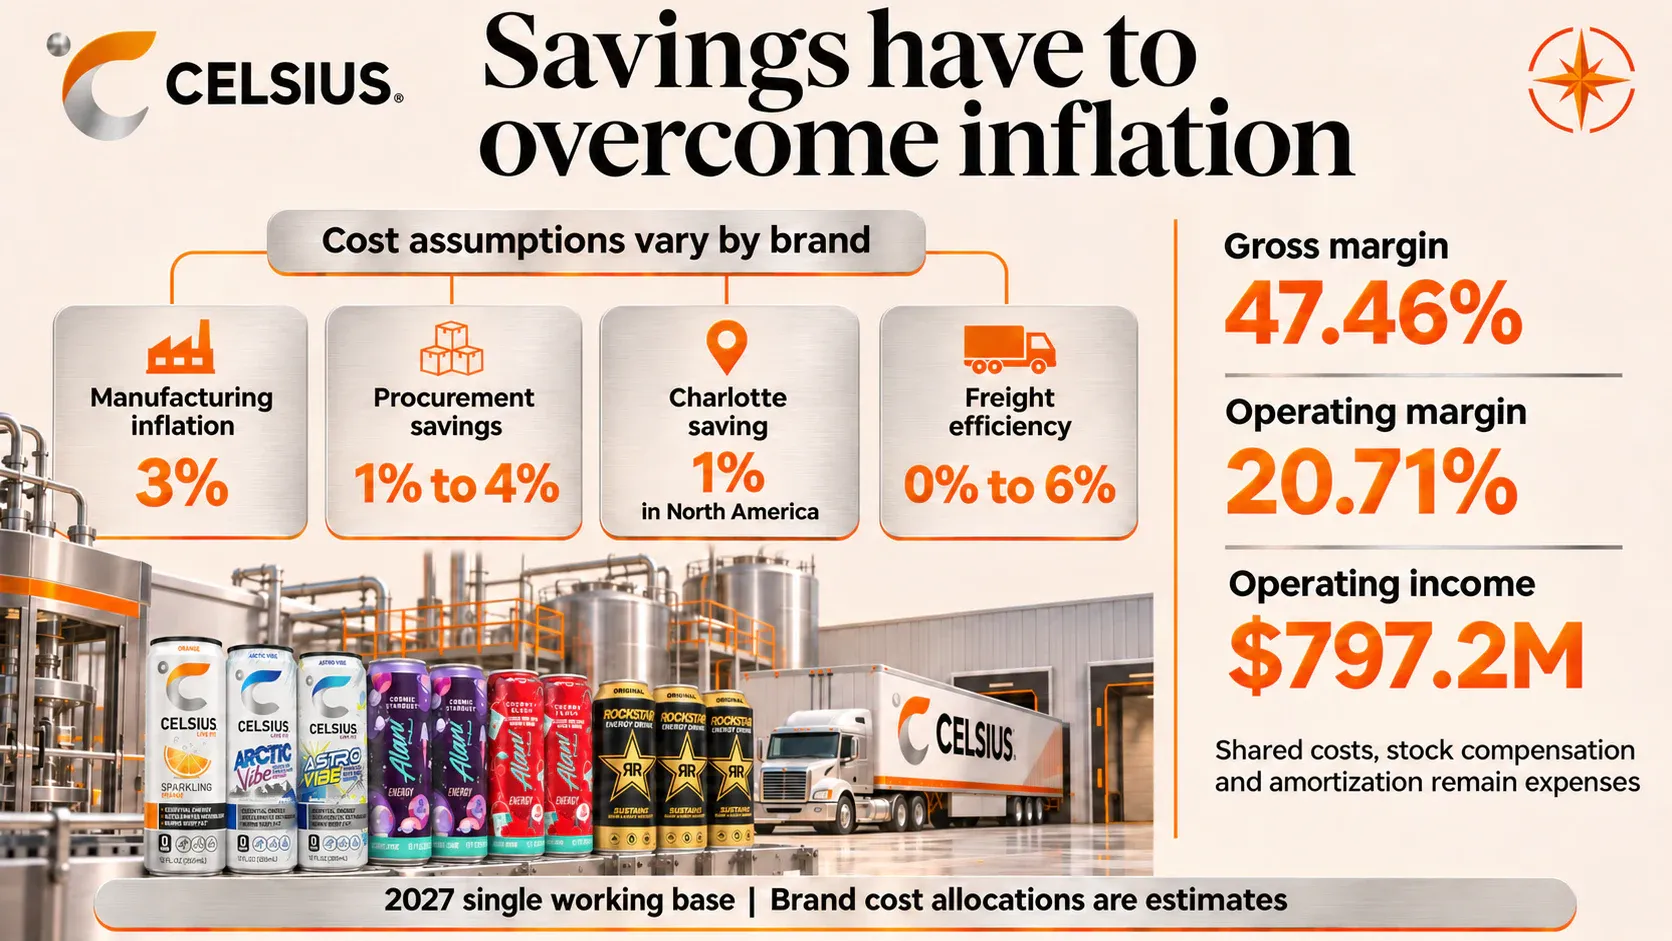
Our central build produces a 47.5% gross margin for 2027. Costs rise first, with 3% inflation in both manufacturing and freight. Savings then come from three specific places: coordinated procurement across three brands, the second production line in Charlotte, and freight efficiencies as the brands share a network.
Cost assumption | CELSIUS NA | Alani NA | Rockstar NA | CELSIUS intl |
|---|---|---|---|---|
Manufacturing inflation | 3% | 3% | 3% | 3% |
Procurement saving | 1.5% | 3% | 4% | 1% |
Charlotte manufacturing saving | 1% | 1% | 1% | 0% |
Freight inflation | 3% | 3% | 3% | 3% |
Freight efficiency | 3% | 6% | 6% | 0% |
The direction of each saving comes from management's commentary. The size of each one is our estimate. We give Alani and Rockstar the larger freight benefit, consistent with management's description of where routing opportunities sit.
Brand margins differ widely, and the mix shift toward Alani and international caps the consolidated result. Brand cost allocations are estimates that reconcile to Celsius's reported consolidated costs.
2027 central build | Estimated gross margin | Contribution before shared costs |
|---|---|---|
CELSIUS North America | 51.2% | $481.7M |
Alani North America | 47.8% | $606.2M |
Rockstar North America | 35.4% | $53.0M |
CELSIUS international | 37.7% | $29.9M |
Alani international | 38.5% | $2.1M |
Contribution here deducts product costs, freight, advertising at 12% of North American sales and 20% internationally, and variable field selling of 4.5%. Shared costs come out next.
Central build operating bridge | 2027 |
|---|---|
Brand contributions | $1,172.9M |
Contract revenue adjustment | ($0.8M) |
Fixed field expense | ($120.9M) |
Corporate overhead | ($167.5M) |
Alani launch fixed expense | ($1.0M) |
Stock-based compensation | ($48.1M) |
Depreciation and amortization in SG&A | ($37.4M) |
Operating income | $797.2M |
The result is a 20.7% operating margin. Advertising stays at a steady share of sales, so the growth forecast keeps paying to support demand. There is no separate synergy line: the original synergy program sits in the starting cost base, and the remaining savings are already in the cost ratios above.
Pepsi's Share of the Earnings
PepsiCo is Celsius's distributor, its strategic partner and, through two series of convertible preferred stock, a claimant on its earnings. Any per-share forecast has to account for that claim before common shareholders see a dollar.
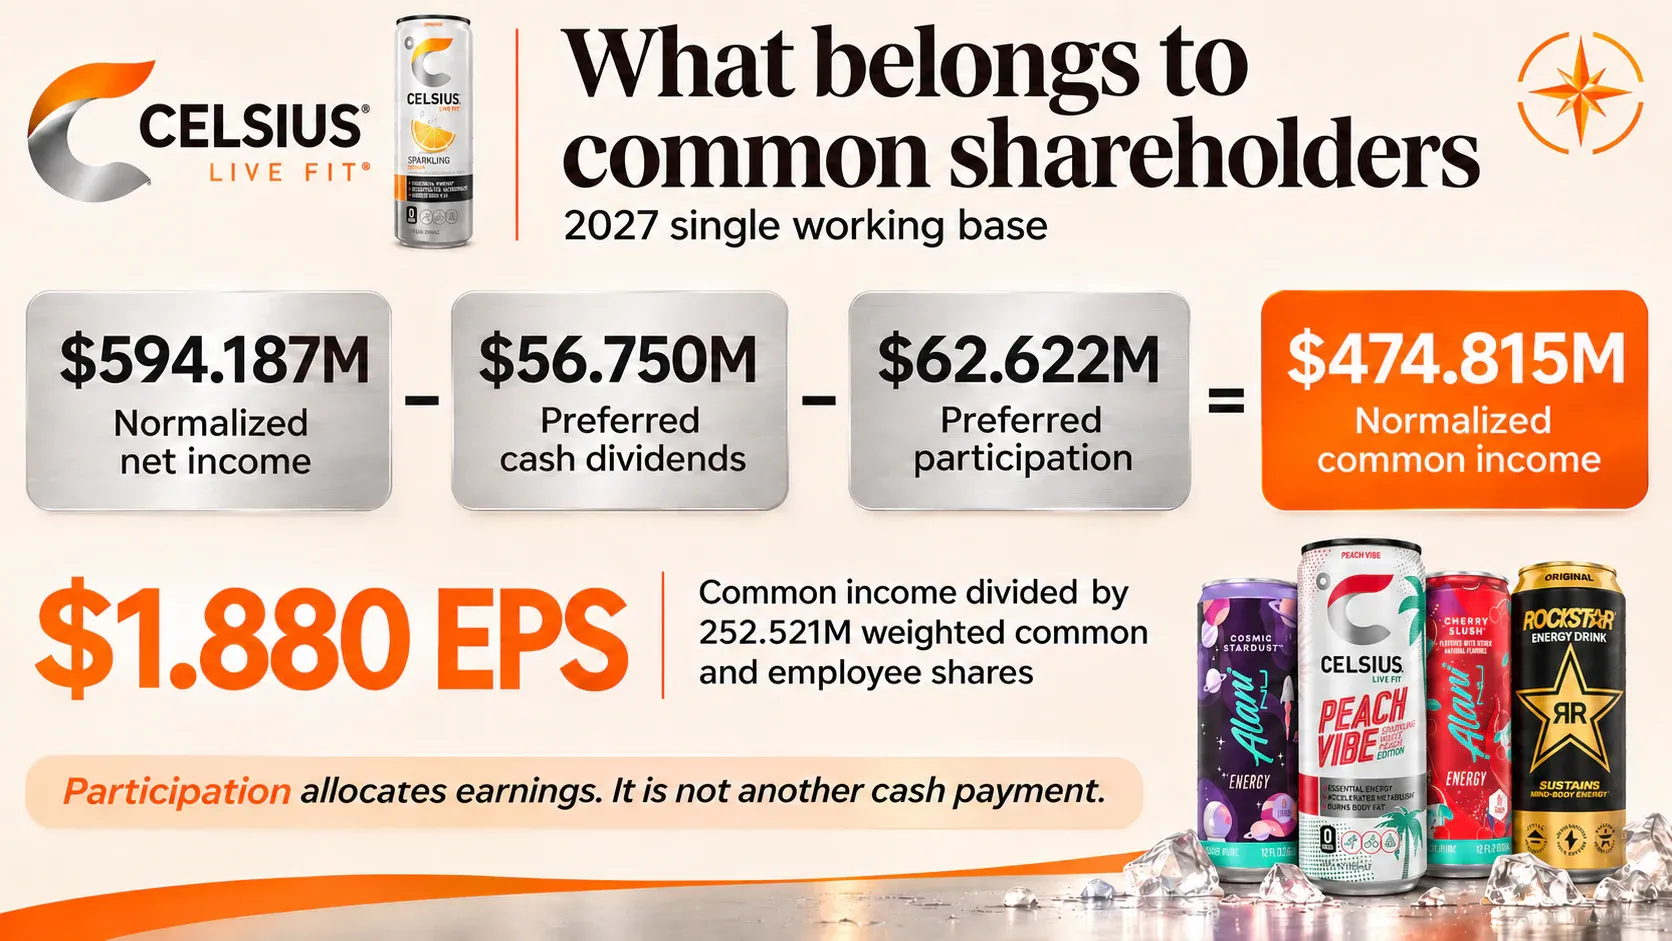
In our central build, operating income of $797.2 million becomes $591.5 million of net income after interest, interest income, a debt-fee writeoff and a 24% tax rate. Adding back the after-tax writeoff gives $594.2 million of normalized net income.
The preferred shares then take two slices. They receive $56.75 million of cash dividends, and they participate in the remaining earnings alongside common shares as if converted, through about 33.3 million common-share equivalents. Dividing the remainder across 252.5 million weighted common and employee shares plus those equivalents produces $1.880 of normalized common EPS.
Skipping the participation step would overstate EPS by more than 10%. The allocation is an accounting split of earnings, not a second cash payment, and we assume no preferred conversion in 2027.
Cash Generation and What It Funds
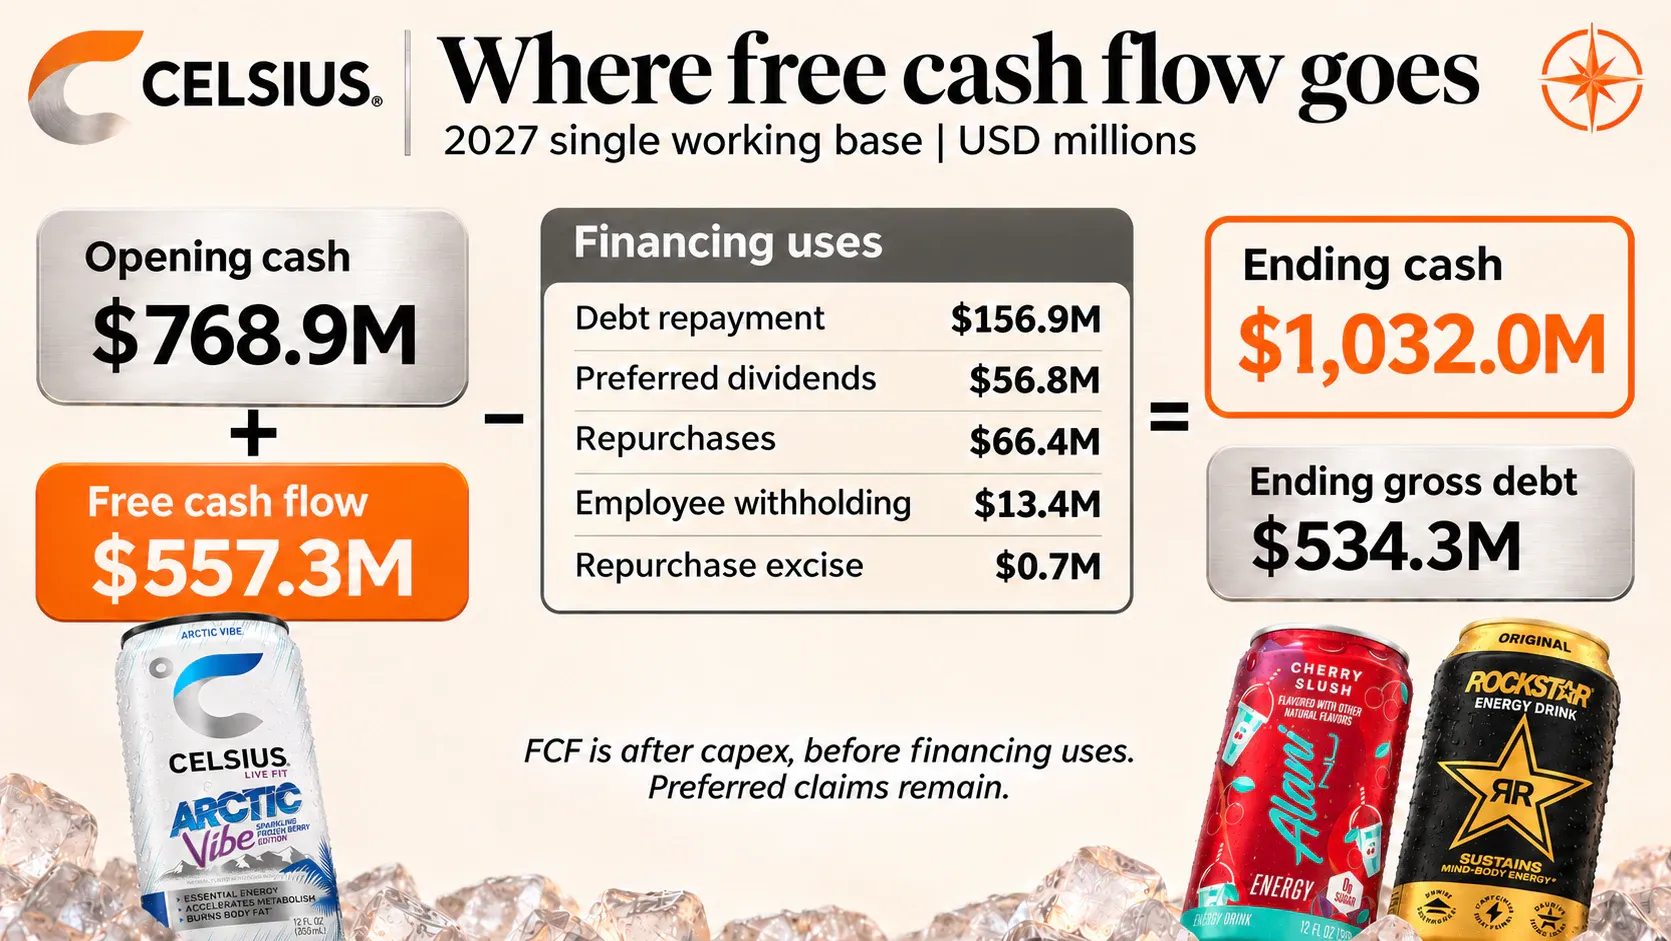
Celsius outsources much of its production, which keeps capital spending light. Our central build generates $622.7 million of operating cash flow and $557.3 million of free cash flow after $65.4 million of capital expenditure.
Two items hold cash flow below earnings. Working capital absorbs $57.0 million as receivables and inventory grow with sales, and a final $25 million legal settlement payment falls in the first quarter. The settlement was accrued earlier, so it reduces cash without touching 2027 earnings.
Central build cash bridge | 2027 |
|---|---|
Cash entering 2027 | $768.9M |
Operating cash flow | $622.7M |
Capital expenditure | ($65.4M) |
Preferred cash dividends | ($56.8M) |
Mandatory debt repayment | ($6.9M) |
Voluntary debt repayment | ($150.0M) |
Share repurchases | ($66.4M) |
Repurchase excise and employee withholding | ($14.1M) |
Ending cash | $1,032.0M |
We assume Celsius uses the $91.4 million left on its repurchase authorization at September 30, spending $25 million in the fourth quarter of 2026 and $66.4 million in 2027 at an assumed $35 average price. We assume no new authorization. Gross debt falls to $534.3 million by year end.
Cash ends the year comfortably above debt. Pepsi's preferred claims still sit above the common stock, and our earnings already include the interest earned on that cash, so we do not add it again when thinking about value per share.
How the Year Unfolds
Revenue in our central build peaks in the third quarter, following the seasonal shape of the energy drink business and the timing of Alani's fall releases.
2027 central build | Q1 | Q2 | Q3 | Q4 | Full year |
|---|---|---|---|---|---|
Revenue | $863.8M | $970.1M | $1,038.3M | $976.9M | $3,849.1M |
Operating income | $169.0M | $195.8M | $220.6M | $211.9M | $797.2M |
Normalized common EPS | $0.385 | $0.459 | $0.528 | $0.509 | $1.880 |
Free cash flow | $67.8M | $127.9M | $166.7M | $194.9M | $557.3M |
Our first-quarter revenue sits about 4% above the Street's $828 million estimate. The first half also carries the settlement payment and seasonal working capital, which is why free cash flow builds through the year.
Three Cases and 81 Outcomes
A single forecast hides the most important question, which is how the brands can disappoint or surprise independently of one another. Our model builds 81 complete outcomes, each with its own quarterly statements, from four separate sets of branches.
Alani North America defines the headline cases, since it drives the most revenue. We assign 20% to the weaker path, 55% to the central path and 25% to the stronger one. Strong current core demand argues against making stagnation the ordinary downside, and the five-point tilt toward the stronger path reflects demand evidence that remains firmer than the bear case assumes.
CELSIUS is conditional on Alani. A weak Alani year suggests broader execution or category trouble, and a strong one suggests the opposite, so the CELSIUS odds shift with each Alani outcome.
Alani environment | CELSIUS weaker | CELSIUS central | CELSIUS stronger |
|---|---|---|---|
Weaker Alani | 45% | 45% | 10% |
Central Alani | 30% | 55% | 15% |
Stronger Alani | 20% | 50% | 30% |
Across all outcomes, CELSIUS has a 30.5% chance of the weaker path and only a 17.75% chance of the stronger one. The recovery gets less confidence than Alani's growth, and the probabilities show it openly. International and the Alani launch are modeled independently at 25%, 50% and 25% and at 20%, 60% and 20%.
Each headline case averages the 27 outcomes inside its Alani regime, mixing good and bad results for the other brands. The central build, where every central assumption holds at once, has only a 9.1% probability on its own.
2027 metric | Bear | Base | Bull | Weighted |
|---|---|---|---|---|
Probability | 20% | 55% | 25% | 100% |
Revenue | $3,596.3M | $3,823.6M | $3,952.7M | $3,810.4M |
Revenue growth | 10.5% | 17.5% | 21.4% | 17.1% |
Operating income | $703.0M | $787.7M | $825.7M | $780.3M |
Operating margin | 19.5% | 20.6% | 20.9% | 20.5% |
Normalized common EPS | $1.629 | $1.855 | $1.956 | $1.835 |
Free cash flow | $503.6M | $552.1M | $569.3M | $546.7M |
Ending cash | $978.3M | $1,026.7M | $1,044.0M | $1,021.4M |
The Bear case still grows revenue 10.5% and earns $1.63 of normalized EPS, close to the Street's full-year figure. Our downside absorbs a slower Alani year and a stalled CELSIUS recovery and still describes a business that keeps growing.
The probabilities are judgments. No historical dataset establishes a 20% or 25% frequency for a brand in Alani's position, and the weights should move as comparable-store sales and net realization data arrive.
Costs are shared across every outcome, so the cases isolate demand. We test cost risks separately.
Isolated change to the central build | Normalized EPS | Free cash flow |
|---|---|---|
Manufacturing inflation of 4% instead of 3% | -$0.046 | -$14.8M |
No Charlotte manufacturing saving | -$0.044 | -$14.2M |
No Alani price and trade improvement | -$0.082 | -$22.2M |
Alani's price realization is the single largest cost-side sensitivity, larger than an extra point of inflation. How much of each retail dollar survives the move to DSD shapes 2027 earnings more than any line in the cost of goods.
What Would Change Our View
The fourth quarter of 2026 comes first. A print near $807 million would support our starting point and much of our disagreement with consensus. A print near the Street's $737 million would lower our base for every 2027 growth rate, and we would rebuild the brand bridge from the new starting point.
For Alani, we want permanent-lineup velocity to hold as new distribution slows, and net revenue per unit to stabilize once the DSD transition laps in the second quarter. Rising trade spending that keeps retail growth high while revenue lags would lower our confidence quickly.
For CELSIUS, the test is total-brand consumer sales turning positive after the 2027 shelf resets, with new products adding sales instead of replacing them. Restocking alone proves little.
For international, we watch reorders, productive listings and revenue moving together, and for the Alani launch we watch for named markets and shipment dates. No launch announcement by the end of the first quarter would justify revisiting its timing, without writing off the year.
On margins, we want manufacturing and freight cost per unit to fall, visible in gross margin even if commodities stay firm. On cash, receivables and inventory need to grow no faster than sales.
Where This Leaves Us
Our 2027 forecast asks four things of Celsius: Alani's consumer demand has to keep turning into revenue as the distribution transition matures, CELSIUS has to stabilize and recover modestly, international listings have to keep converting into reorders, and cost savings have to hold margins near current levels. Uneven results across the brands are built into every case.
If those conditions hold, 2027 revenue lands roughly 10% above published expectations and normalized EPS near $1.84, with free cash flow above $500 million in every case we model. The disagreement with the Street is mostly about Alani's growth rate and the fourth-quarter exit, and both will be tested within months.
What that business is worth at the end of 2027, and what price makes it worth owning today, depends on a second disagreement. The market currently values Celsius at a steep discount to the company it most often gets compared with.
Our premium section carries the same evidence standards into that question: the multiple framework behind our December 2027 targets, the probability-weighted value, the implied return from today's price, the Northwise rating and entry zones, and how much of the answer rests on the multiple. Premium members also receive the complete, editable CELH 2027 model behind every figure in this forecast.
Northwise Premium
Choose how to continue with Northwise
Join Northwise Premium
Unlock the rest of this report, its complete valuation, the downloadable model, portfolios, and action framework.
Join Northwise PremiumCreate a Free Account
Continue across Free Northwise research, follow companies, save reports, and receive updates.
Create a Free Account
Celsius Stock Analysis: The Shelf Reset and the Second Growth Curve
Celsius stock analysis of the shelf reset, Alani growth, Pepsi economics and cash flow, with a 2030 model and a Premium valuation and entry-price framework.
CELH Stock Forecast 2030
CELH Stock Forecast 2030 covering Celsius, Alani Nu, Rockstar, Pepsi distribution, Costco risk, and international growth model.

Nebius Alberta Data Center
Nebius plans 100 MW across Alberta campuses. Follow the path to first delivery in 2027 through Alberta power, permits, and the Brooks-area filings.
Northwise Portfolios
See how the research becomes real decisions
Reader discussion
Discuss the research
Premium access is required to join this report's discussion.
Join Northwise Premium
No comments yet. Start a thoughtful discussion.