
MELI Stock Forecast 2030: The Credit Engine and the Delayed Margin Harvest

Northwise's 2030 MercadoLibre forecast models commerce, Pago, credit, margins, FCFE and four scenarios to estimate MELI's long-term value.
In this article
A premium valuation framework for MercadoLibre through 2030, built from buyers and parcels upward through payments, product-level credit economics, sponsor capital, and what actually reaches an owner once the balance sheet is funded honestly.
Executive Summary
MercadoLibre grew revenue almost 50% in the second quarter of 2026. Its operating margin was 6.7%, down from 12.2% in the same quarter a year earlier.
Both numbers are correct. Most of the argument about this stock is really an argument about how to hold them at the same time.
One camp reads the margin compression as evidence that the business is getting worse. Competition is forcing free shipping. Credit losses are climbing.
The card book is a subprime experiment dressed as a fintech flywheel. On that reading, a company earning 6.7% margins at $10 billion of quarterly revenue has already shown you its ceiling.
The other camp reads the same numbers and sees a company choosing to spend. Management has been explicit about lowering shipping thresholds, discounting take rates for sellers, and issuing cards faster than the cohorts can season. On that reading, the margin is suppressed by choice and the harvest is coming.
Neither framing does the work. The useful question is narrower and harder: how much underlying profit is MercadoLibre actually capable of producing right now, how much of it is being deliberately spent, and how much of the resulting growth belongs to equity holders after the lending book is funded honestly.
Answering it requires modeling six engines separately. Commerce services, first-party and cross-border product sales, advertising, payments, credit, and logistics all behave differently, carry different margins, and consume different amounts of capital. Collapsing them into one revenue line and one multiple buries every question worth asking.
The most contested engine is credit, and it is the one most often modeled badly. Bulls treat the loan book as cheap fintech float. Bears treat every dollar of receivable growth as owner-funded risk. Both are wrong, and this forecast takes neither shortcut.
The credit portfolio is modeled by product, with separate yields, funding burdens, loss burdens, and after-loss spreads for consumer lending, credit cards, merchant credit, and secured lending. Cards reach 62% of the book by 2030 and carry the lowest spread of the four. The mix shift, more than any single loss assumption, governs where consolidated profitability lands.
The Base case holds a specific and non-consensus view. Revenue growth fades slowly rather than falling off a cliff, dropping from 45.7% in 2026 to 20.4% in 2030. Reported operating margin stays between 6% and 8% through 2028 while underlying harvestable margin climbs from 12.5% to 16%. The harvest arrives in 2029 and 2030, from a much larger base than most models carry.
Base 2030 operating metric | Modeled outcome |
|---|---|
Revenue | $115.0B |
Reported EBIT margin | 15.0% |
Harvestable EBIT margin | 20.0% |
EBIT | $17.3B |
Net income | $12.6B |
Diluted EPS | $246.25 |
Normalized FCFE | $11.35B |
GMV | $237.7B |
TPV | $1.26T |
Gross credit portfolio | $59.0B |
Blended NIMAL | 22.8% |
Card NIMAL | 19.0% |
Diluted shares | 51.0M |
Those figures describe a company generating $115 billion of revenue and $246 per share of earnings in 2030, having spent roughly $26 billion of cumulative revenue on deliberate growth investment along the way, with no buyback assumed and share count essentially flat.
The cash flow line is the strictest number in the table. Normalized free cash flow to equity starts negative in 2026 and reaches $11.35 billion by 2030, after charging the model for every dollar of parent capital required to support net lending growth. Charging for it is what separates an honest fintech cash flow from a flattering one.
Everything ahead of the premium gate explains how each of those lines is built, where the assumptions come from, and what would break them. The premium section prices those outcomes.
Part I: What MercadoLibre Actually Is
Six engines, not two
MercadoLibre is usually described one of two ways. It is a marketplace with a fintech attachment, or it is a fintech with a marketplace attached. Both descriptions are tidy and neither survives contact with the income statement.
The company runs six operating engines with sharply different economics.
Engine | What it sells | Economic character |
|---|---|---|
Commerce marketplace | Listing, transaction and fulfillment services | Take rate on GMV, high incremental margin |
Product sales | First-party inventory and cross-border goods | Low margin, working-capital intensive, selection-building |
Mercado Ads | Merchant access to purchase intent | Very high margin, scales with GMV and search quality |
Mercado Pago | Payment processing, acquiring, balances, ancillary products | Spread and fee business on volume and float |
Mercado Crédito | Consumer, card, merchant and secured lending | Balance-sheet business with loss and funding burdens |
Mercado Envios | Physical fulfillment and delivery | Cost engine, not a revenue line, densifies with volume |
Only four of those produce a revenue line. Logistics is a cost engine, and advertising is not separately disclosed by the company at all, which means any ad revenue figure in any model is a reconstruction. This forecast reconstructs it from disclosed penetration commentary and treats the estimate as an estimate.
Why the engines reinforce one another
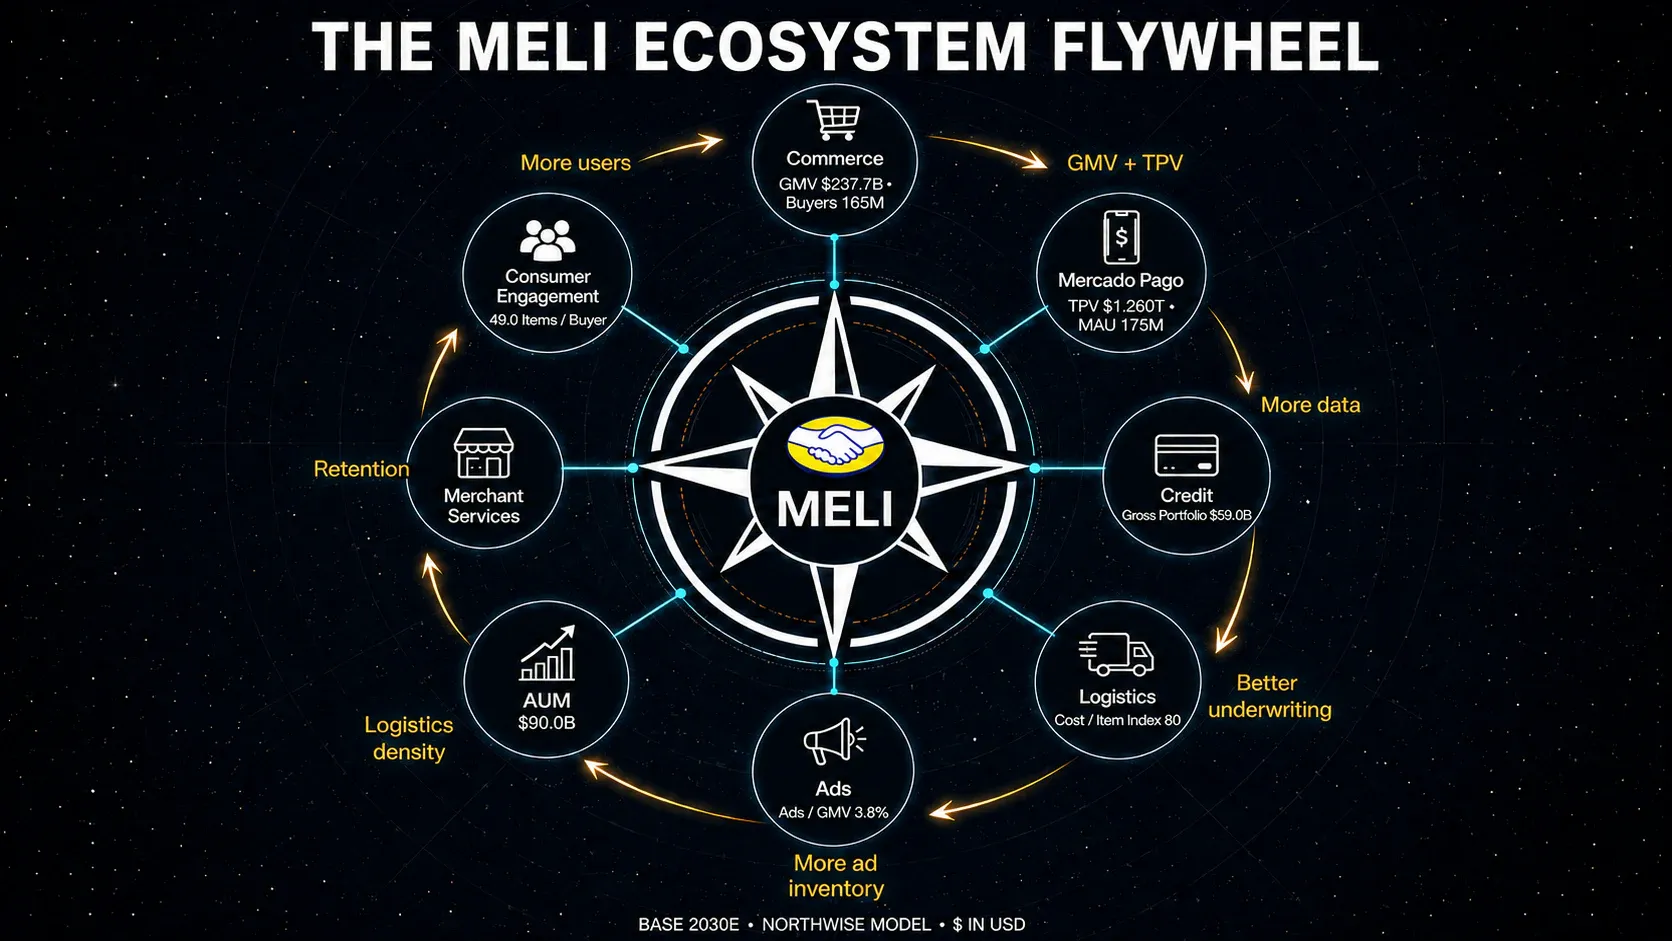
The interesting property of this structure is that the engines are not independent. Improving one improves the others, in ways that show up in different line items than the one where the investment was made.
Lowering the free-shipping threshold in Brazil raises order frequency. Higher frequency raises items per buyer, which raises GMV, which raises parcel volume. Higher parcel volume improves route density, which lowers cost per item, which funds a lower shipping threshold. The loop runs entirely inside commerce and logistics, and it appears in the income statement as a margin drag before it appears as an advantage.
A second loop runs through Pago. A buyer who pays with a Mercado Pago balance is a payments customer. A payments customer who keeps a balance is an AUM customer.
An AUM customer generates underwriting data. Underwriting data lowers the cost of extending credit, and credit raises conversion on the marketplace where the loop started.
A third loop runs through advertising. More sellers competing for the same buyers raises ad demand. Better search and better conversion raise the value of an ad impression. Ad revenue carries very high margin and funds the take-rate discounts being handed to those same sellers.
The organizing idea, stated once and plainly. MercadoLibre is a regional operating system for Latin American commerce and finance, where each engine lowers the cost of operating the others.
Where the ecosystem argument gets abused
The framing is also where a great deal of sloppy analysis lives, and it needs a guardrail.
If a credit card makes a user a better ecosystem participant, and that participation shows up as higher purchase frequency, then the value of the card is already inside the GMV forecast. Counting it again as a separate ecosystem premium double-counts the same dollar.
This model quarantines the halo. Card cohorts are assessed on their own direct economics, including servicing, rewards, and acquisition costs. The ecosystem uplift is calculated and displayed as a diagnostic to judge card payback, and it is never added to consolidated earnings, to the sum-of-the-parts, or to the valuation. The uplift is already embedded in buyer frequency, TPV intensity, AUM, and retention assumptions.
The discipline costs the Base case roughly $1.5 billion of 2030 contribution that a looser model would happily add on top. Leaving it out is the correct treatment.
Part II: The Last Twelve Months
The Q2 2026 scorecard
The second quarter of 2026 puts all six engines and the margin question on a single page.
Q2 2026 metric | Result |
|---|---|
Net revenue and financial income | $10,169M |
Year-over-year growth | 49.8% |
Income from operations | $683M |
EBIT margin | 6.7% |
Net income | $466M |
Diluted EPS | $9.19 |
Unique active buyers | 89.3M |
Items sold | 795M |
GMV | $21,926M |
Fintech MAU | 88.0M |
TPV | $100,952M |
Assets under management | $23,214M |
Gross credit portfolio | $16,375M |
Quarterly originations | $15,931M |
Blended NIMAL | 20.7% |
Unused card commitments | $14,047M |
Read across the quarter, the engines are all accelerating and the margin is all going somewhere else. Buyers grew, frequency grew, GMV grew, payment volume crossed $100 billion in a single quarter, and the credit book grew 75% year over year. Operating margin fell 550 basis points.
Two rows in that table belong next to each other. Gross credit receivables reached $16.4 billion. Unused credit card commitments, which are contractual capacity MercadoLibre has already extended but customers have not yet drawn, reached $14.0 billion. The funded book substantially understates the risk boundary the company has created, and most models do not look at the second number at all.
What actually changed in the business
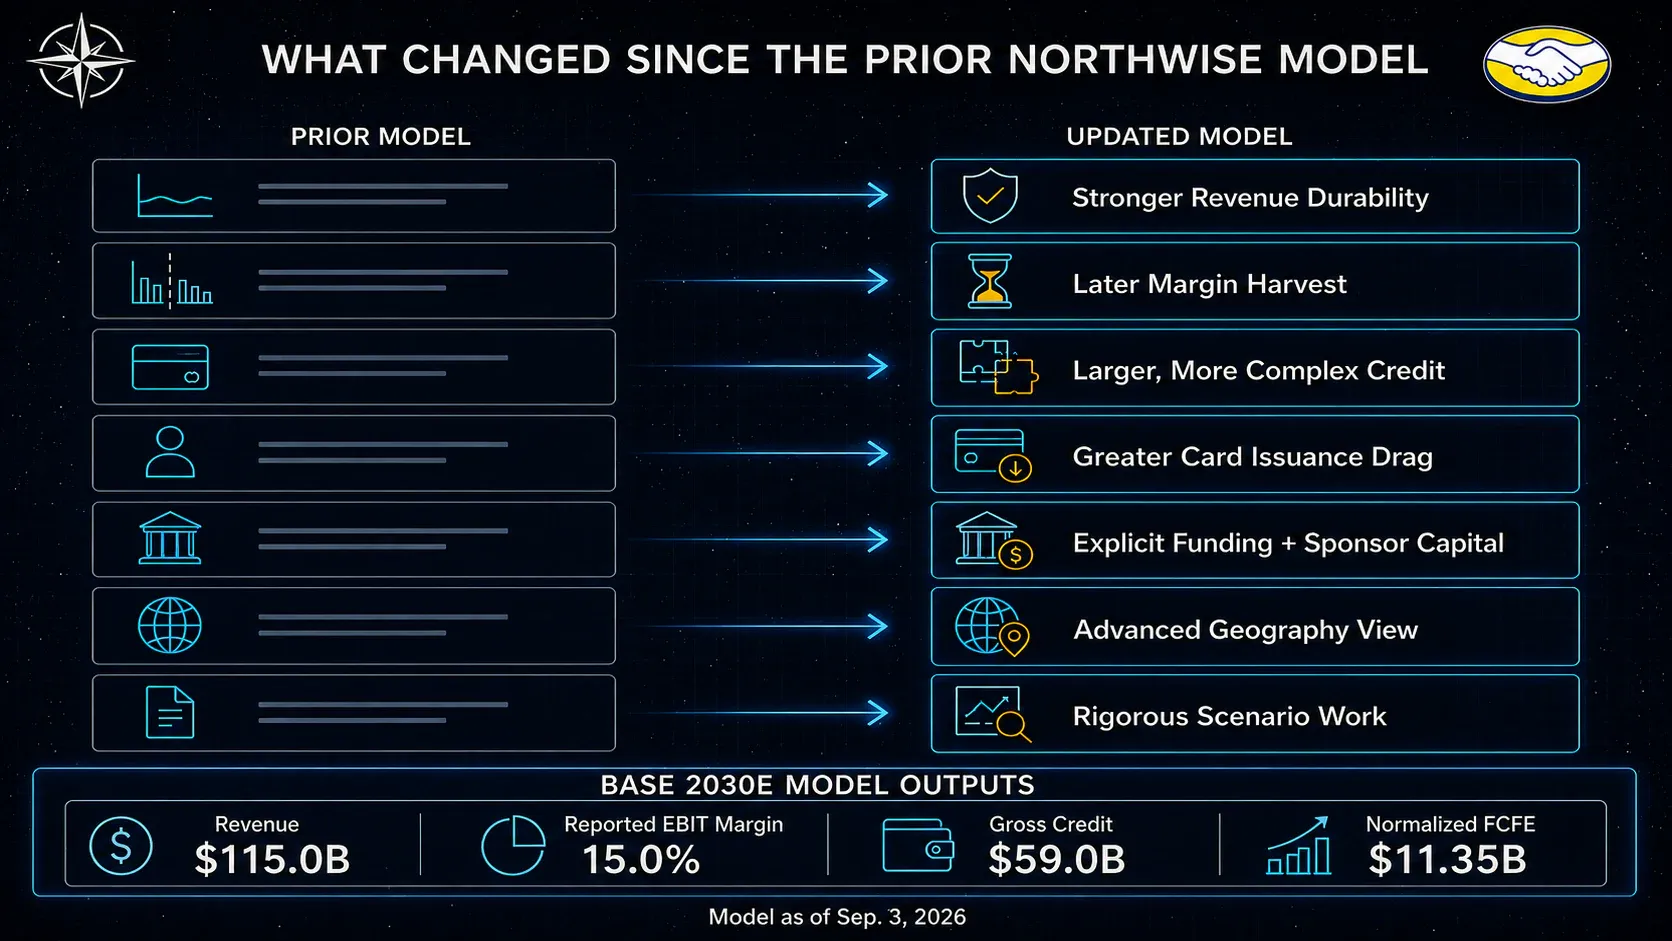
Revenue growth held near 50% and did not decelerate on the schedule most models assumed. The law of large numbers has not yet arrived, and pushing the fade out by two years changes the terminal base more than any margin assumption does.
Management reinforced its reinvestment posture instead of softening it. Free shipping thresholds came down, targeted seller take-rate discounts expanded, first-party assortment grew, and AI spending rose. The company is not signaling a pivot to near-term margin maximization, and any forecast assuming a near-term pivot is fighting the evidence.
Card issuance accelerated hard. Cards ended 2025 at 45% of gross receivables and head toward 62% by 2030 on the Base path, with the balance more than doubling again in 2026. A book dominated by cards behaves differently from a book dominated by merchant credit, which is what older MercadoLibre credit frameworks were built on.
Private payroll-deducted lending launched in Brazil. These loans are repaid from salary before the borrower sees the money, which carries materially lower loss rates and longer duration than unsecured consumer credit. The product reaches $5.0 billion of balances inside consumer credit by 2030 in the Base case. It improves risk mix gradually and does not de-risk the book overnight.
A marketplace partnership with Magazine Luiza added roughly 27,000 first-party items and initial delivery integration, with pickup and returns as future optionality. The strategic signal is larger than the financial one at current scale, and it is embedded in commerce growth and not carried as a separate line.
Pharmacy expansion moved from a Brazilian pilot toward a proposal in Chile, opening a category that pulls users onto a platform more reliably than almost anything else sold online.
Brazil began weighing tighter consumer-credit rules as household debt stress mounts. The proposals target exactly the products MercadoLibre is scaling fastest.
How each development is treated
The temptation with a list like that is to treat it as news. Each item changes a specific input, and the treatment is set out below so nothing arrives twice or arrives without a home.
Development | Base treatment | Bull optionality | Downside treatment |
|---|---|---|---|
Magazine Luiza partnership | Inside buyer selection and commerce growth, no separate line | Physical pickup, returns and large-item logistics | Minimal impact if assortment underperforms |
Private payroll lending | Inside consumer credit, reaching $5.0B by 2030 | Faster low-risk primacy and larger balances | Duration, employment turnover and funding mismatch |
Pharmacy and healthcare | Zero dedicated Base revenue | High-frequency regulated category | Regulatory, quality and reputational risk |
AI search and agents | Inside conversion, ads and productivity | Faster frequency and ad monetization | Inference cost with weak consumer adoption |
Brazil credit regulation | No change until rules are enacted | None | Explicit card growth, NIMAL and capital pressure in Stress and Bear |
Free shipping thresholds | Explicit drag in the margin bridge | Frequency responds faster than modeled | Drag becomes permanent competitive cost |
Seller take-rate discounts | Core take rate falls 128bp by 2030 | Volume and ad demand more than offset | Discounts spread without volume response |
Two treatments in that table are worth defending directly.
Pharmacy carries zero Base revenue despite being the most attractive new category in front of the company. It depends on regulatory approval market by market, and approval is not a forecastable input. Optionality that requires a regulator to say yes stays optionality.
Brazilian credit regulation gets the opposite treatment for the same reason. Proposed rules are not enacted rules, so Base carries no impact. The exposure is real enough that Stress is built around it, with the card book retrenching to $38 billion and blended after-loss spread falling to 15%.
None of it is decoration. All of it changes a number or is deliberately kept out of one.
Part III: Commerce, Frequency, and the Monetization Stack
GMV is an output, not a driver
Most commerce forecasts start with a GMV growth rate and work backward. Starting there hides every interesting question about the business.
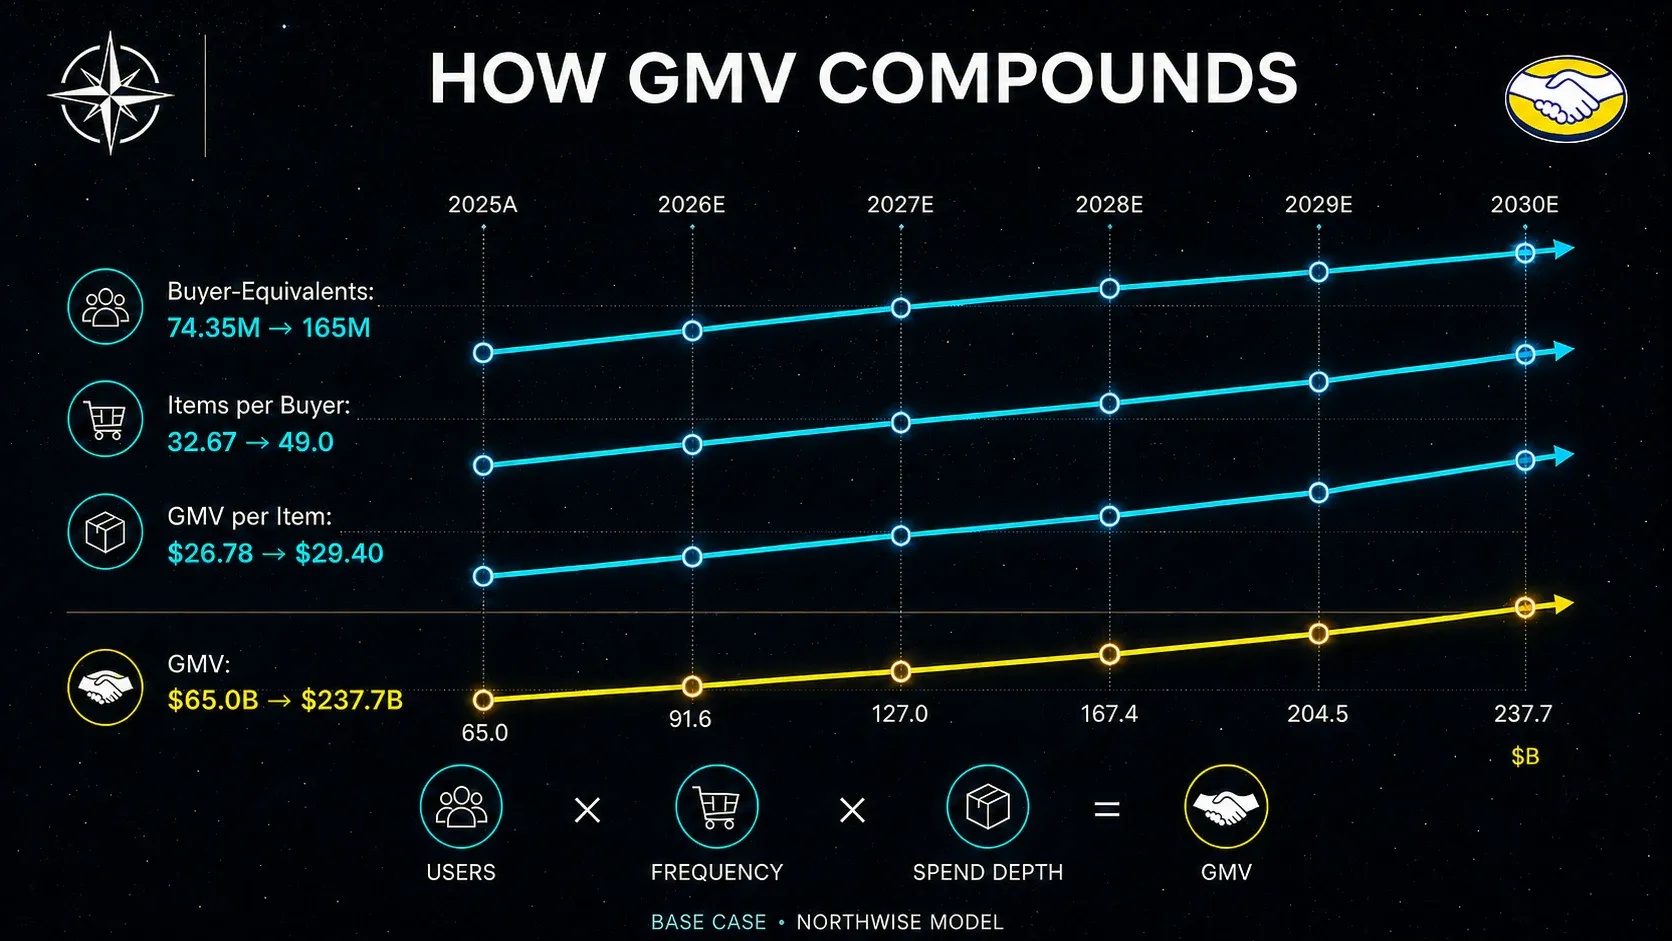
GMV is the product of three things a company can actually influence. How many people buy, how often they buy, and how much each purchase is worth. Separating those three exposes which lever is doing the work, and in MercadoLibre's case the answer is not the one most models assume.
Commerce driver | 2025A | 2026E | 2027E | 2028E | 2029E | 2030E |
|---|---|---|---|---|---|---|
Average buyer-equivalents (M) | 74.4 | 91.2 | 112.0 | 132.0 | 150.0 | 165.0 |
Annual items per buyer | 32.67 | 36.33 | 40.50 | 44.50 | 47.00 | 49.00 |
Items sold (M) | 2,429 | 3,313 | 4,536 | 5,874 | 7,050 | 8,085 |
GMV per item | $26.78 | $27.65 | $28.00 | $28.50 | $29.00 | $29.40 |
GMV ($mm) | 65,049 | 91,613 | 127,008 | 167,409 | 204,450 | 237,699 |
Notice what the last row of drivers does. GMV per item rises from $26.78 to $29.40 across five years, which is roughly 1.9% annually. The Base case assumes almost no basket inflation and almost no upmarket mix shift.
GMV nearly quadruples anyway, driven by buyers growing 122% and frequency growing 50%. This is a volume forecast, not a price forecast, which makes it considerably harder to knock over with a currency argument or a consumer-weakness argument.
Frequency is the variable that compounds
Buyer growth is the visible number and frequency is the one that matters more, as it compounds against a base that is already large.
A user who buys 33 times a year is buying something roughly every 11 days. At 49 times a year, that becomes every seven and a half days. The behavioral shift required is not a new user acquisition campaign. It is the migration of small, frequent, previously-offline purchases onto the platform: household goods, personal care, groceries, replacements.
Those purchases only migrate when shipping is fast, cheap, and predictable enough that a $12 order makes sense. Which is precisely why the free shipping threshold, the same-day network, and the first-party assortment expansion are not margin accidents. They are the price of the frequency curve above.
The company is also becoming more useful in ways that raise frequency without any spending at all. Better search, AI-assisted product discovery, and a wider assortment each reduce the number of failed shopping trips. A platform that answers more queries successfully gets asked more queries.
The monetization stack
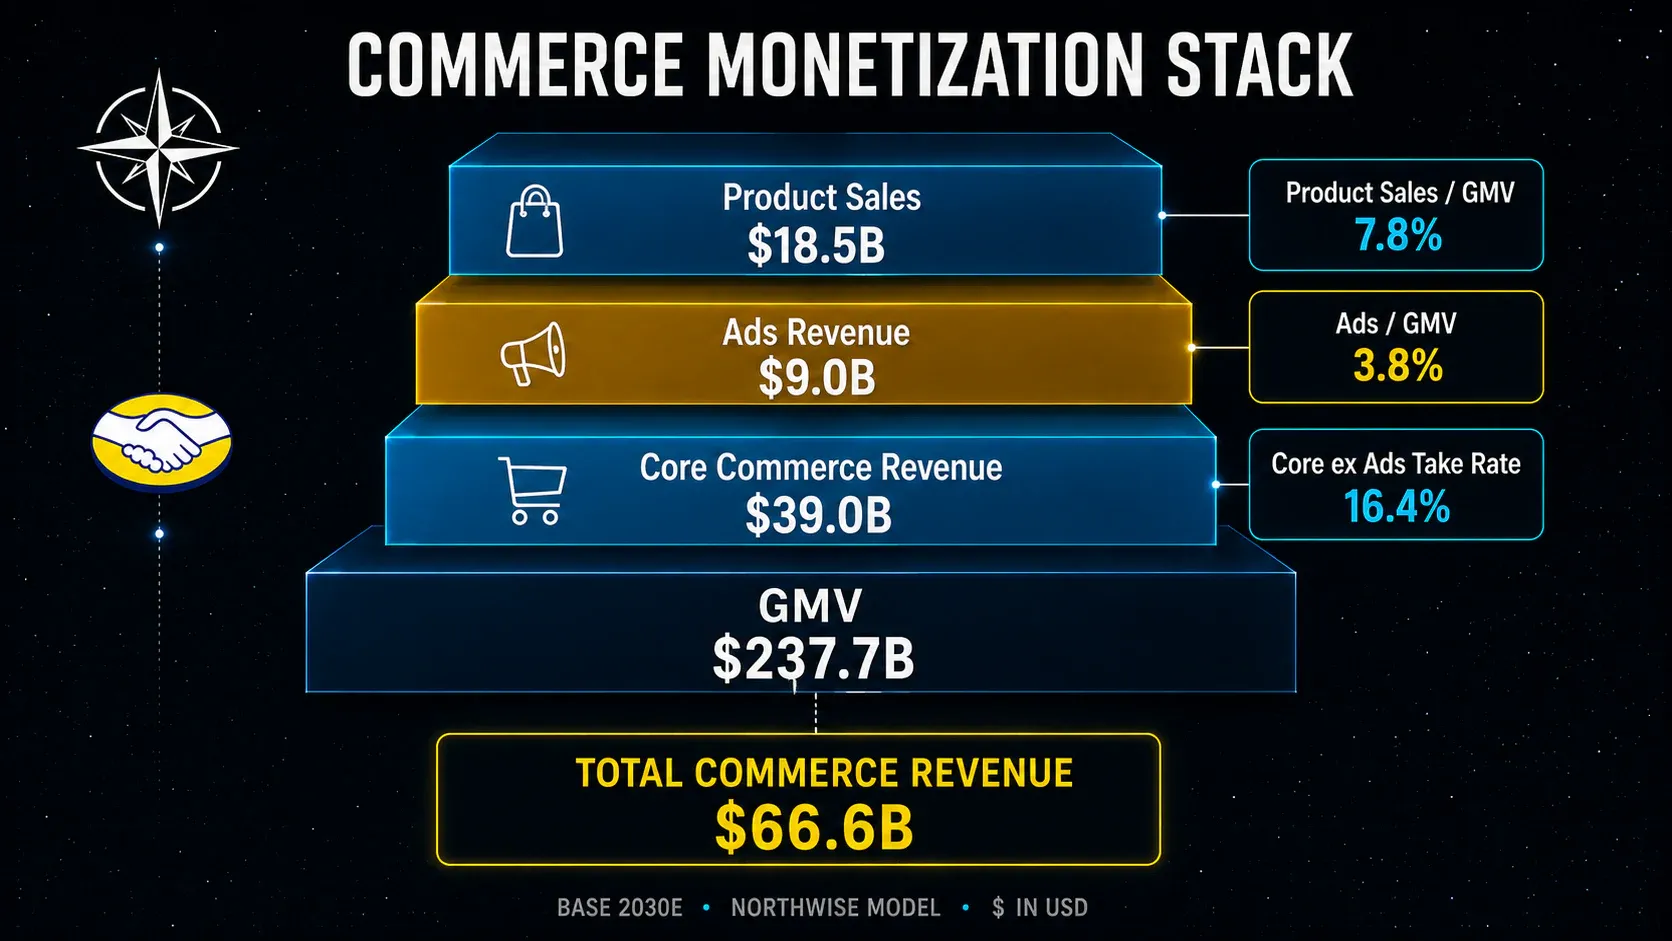
Revenue does not come from one take rate. Three layers sit on top of GMV, and they move in different directions.
Monetization layer | 2025A | 2026E | 2027E | 2028E | 2029E | 2030E |
|---|---|---|---|---|---|---|
Core commerce take rate ex Ads | 17.68% | 17.00% | 16.80% | 16.60% | 16.50% | 16.40% |
Mercado Ads / GMV | 1.92% | 2.35% | 2.80% | 3.20% | 3.50% | 3.80% |
Product sales / GMV | 5.45% | 6.24% | 6.40% | 6.60% | 7.00% | 7.80% |
The core take rate falls by 128 basis points across the forecast. The decline is deliberate and it is the seller-side investment showing up where it belongs, in the revenue line instead of buried in costs. Targeted discounts, richer low-ticket mix, and shipping subsidies all pull it down.
Advertising nearly doubles as a share of GMV over the same period and offsets most of the damage. Product sales rise as first-party and cross-border assortment expand, adding revenue at low margin while improving selection.
Commerce revenue ($mm) | 2025A | 2026E | 2027E | 2028E | 2029E | 2030E |
|---|---|---|---|---|---|---|
Core commerce services | 11,501 | 15,574 | 21,337 | 27,790 | 33,734 | 38,983 |
Mercado Ads | 1,249 | 2,153 | 3,556 | 5,357 | 7,156 | 9,033 |
Commerce product sales | 3,545 | 5,717 | 8,129 | 11,049 | 14,312 | 18,541 |
Total commerce revenue | 16,295 | 23,444 | 33,022 | 44,196 | 55,202 | 66,556 |
Total commerce revenue reaches $66.6 billion in 2030 against $16.3 billion in 2025, growing faster than GMV despite the falling core take rate. Advertising and product sales carry the difference.
Mercado Ads is the most underdiscussed line in the business
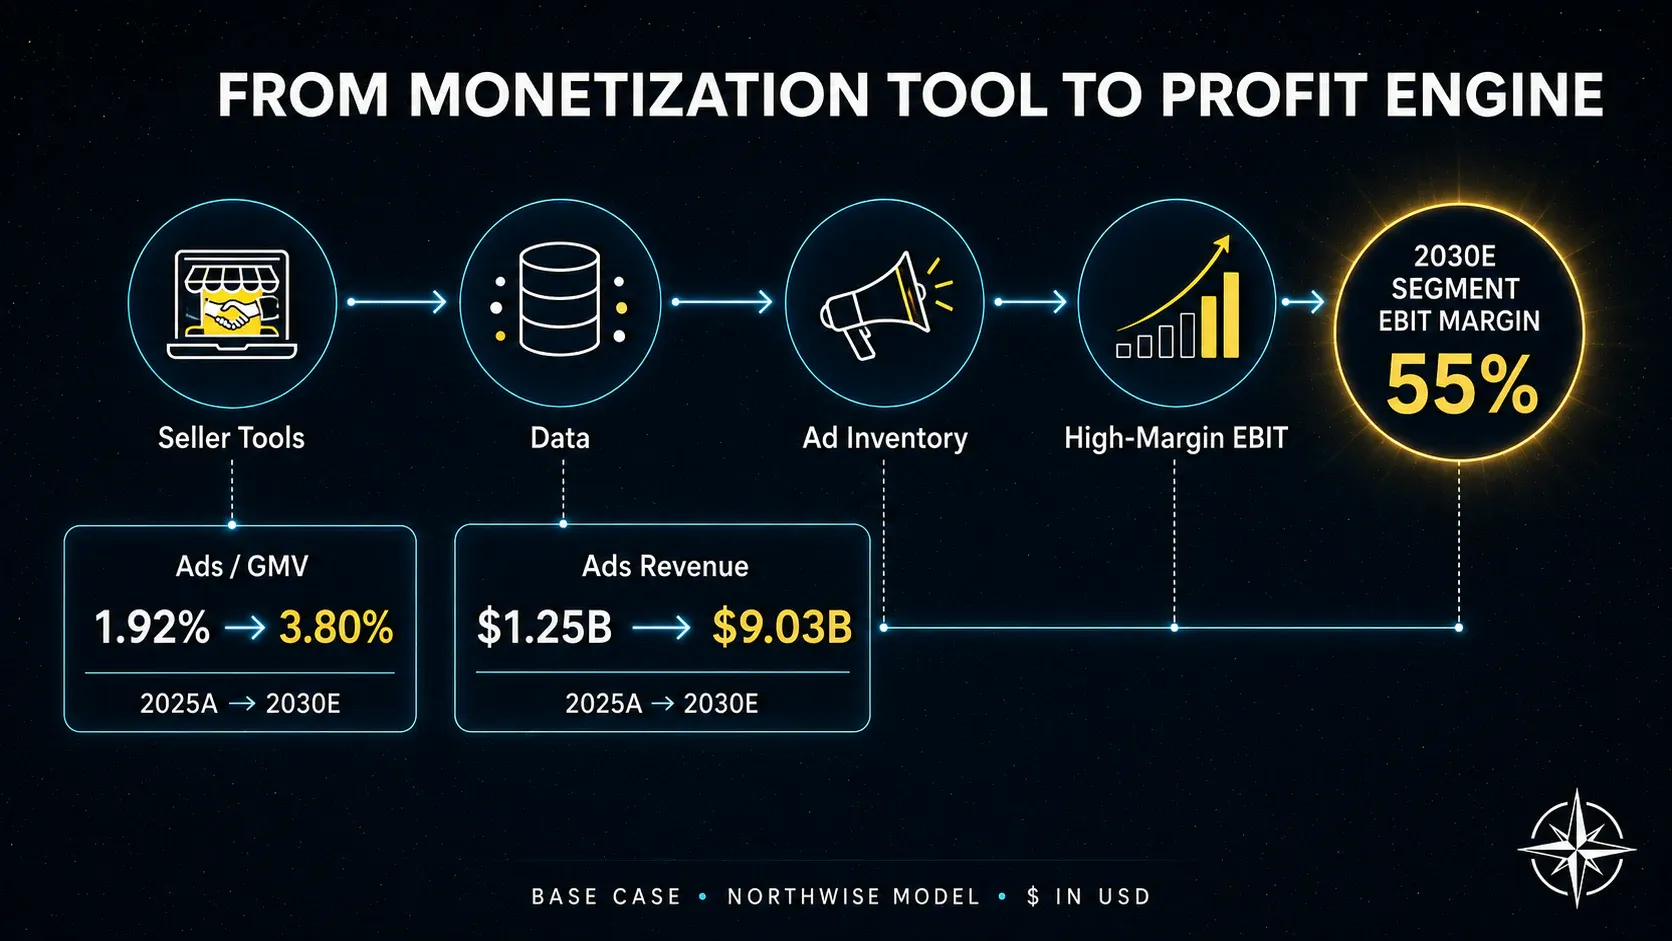
MercadoLibre does not disclose advertising revenue as a standalone figure, which is one reason the market underweights it. The reconstruction here puts ads at roughly $9.0 billion of 2030 revenue, up from an estimated $1.2 billion in 2025.
Advertising on a transactional marketplace is a structurally excellent business. The platform already knows what the shopper is looking for, already handles the transaction, and can therefore prove that an ad produced a sale. Sellers competing for placement on a platform that controls their access to demand have limited leverage on price.
The margin profile follows from that. Serving an additional ad impression costs almost nothing, so incremental ad revenue converts to operating profit at very high rates. The sum-of-the-parts section carries a 55% segment EBIT margin for advertising in the Base case, against 10% for core commerce.
The asymmetry is why the take-rate discount strategy is coherent rather than reckless. Handing sellers a lower commission grows their volume, which grows the auction they are bidding into, which grows a revenue stream with five times the margin of the one being discounted.
Two constraints keep the ad forecast honest. Penetration reaches 3.8% of GMV by 2030, which sits below where mature transactional marketplaces in other regions have landed. And ad load has a ceiling, and a search results page filled with sponsored listings converts worse than one that is not.
Part IV: Logistics and Density
The cost engine that funds the growth
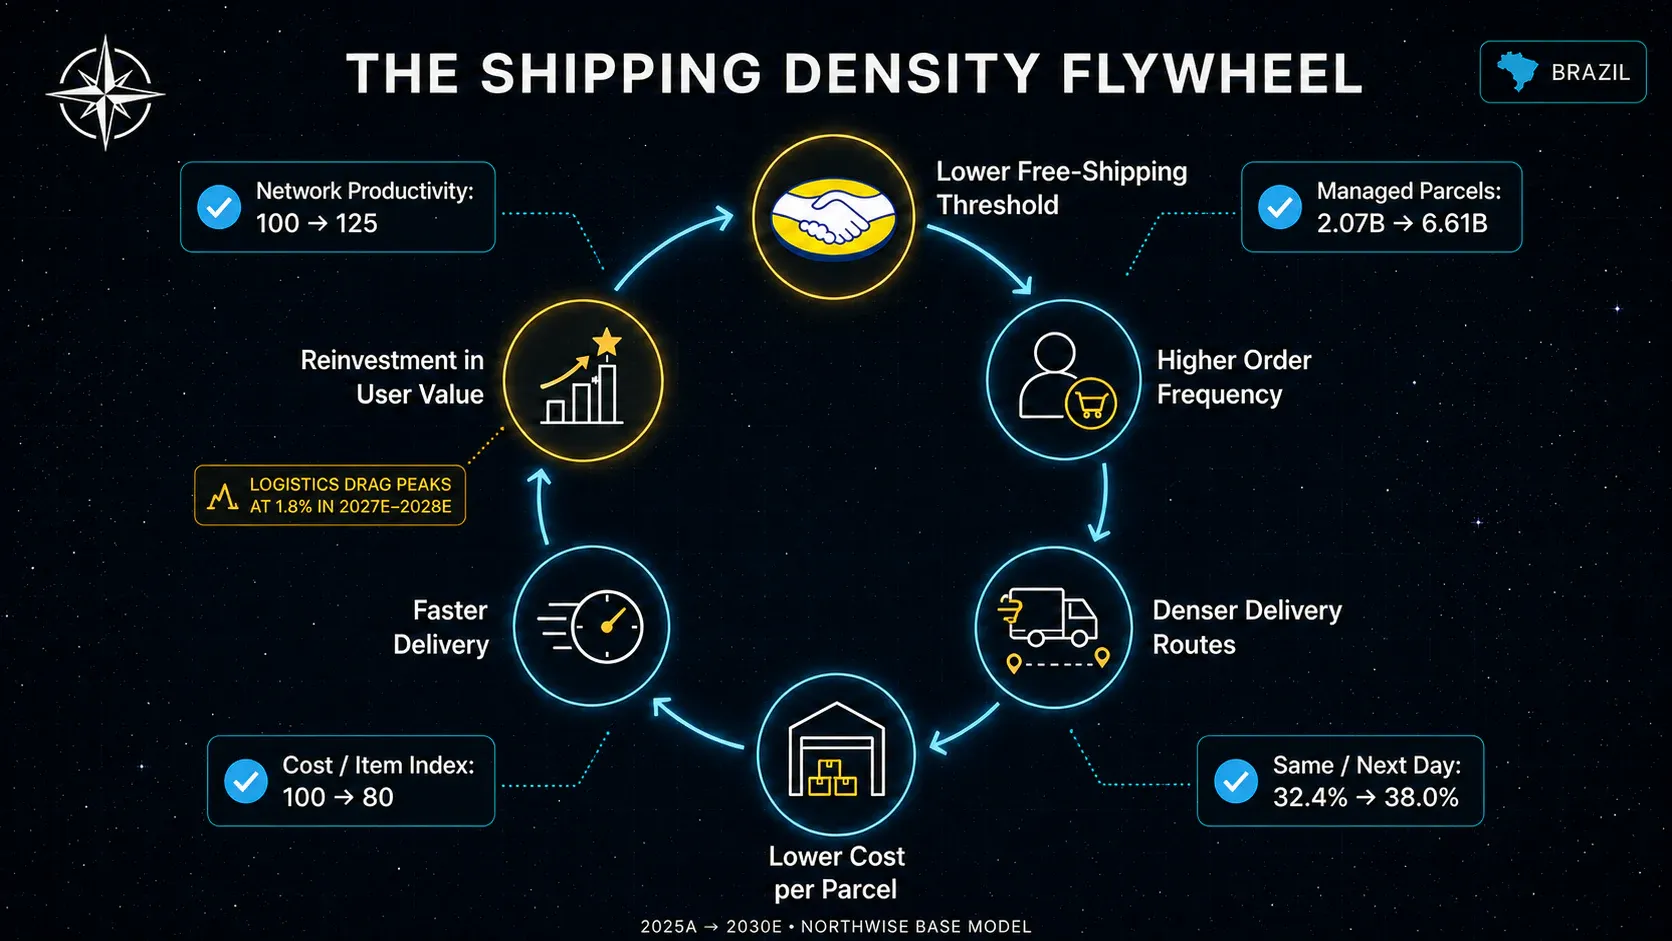
Mercado Envios does not appear as a revenue line. It appears as a cost line, a capital expenditure line, and a margin drag, which is why it gets discussed less than it should.
It is also the mechanism through which frequency becomes affordable. Every improvement in delivery cost per item can be handed back to the buyer as a lower shipping threshold, and every reduction in the shipping threshold raises order volume.
Logistics driver | 2025A | 2026E | 2027E | 2028E | 2029E | 2030E |
|---|---|---|---|---|---|---|
Managed-network penetration | 95.3% | 96.0% | 96.2% | 96.3% | 96.4% | 96.5% |
Managed parcels (M) | 2,067 | 2,790 | 3,794 | 4,876 | 5,809 | 6,612 |
Items per parcel | 1.12 | 1.14 | 1.15 | 1.16 | 1.17 | 1.18 |
Same/next-day share | 32.4% | 34.0% | 35.0% | 36.0% | 37.0% | 38.0% |
Cost per item index (2025 = 100) | 100 | 88 | 84 | 82 | 81 | 80 |
Managed-network penetration is already 95.3%, so there is very little left to capture there. The leverage comes from three other places.
Parcel consolidation improves as frequency rises, as a buyer ordering more often is more likely to order two things at once. Items per parcel moving from 1.12 to 1.18 sounds trivial and removes roughly 5% of parcels from the network for a given item volume.
Route density improves as parcel volume grows within a fixed geography. A van covering a Brazilian neighborhood with 40 stops costs less per stop than the same van making 25. This is the oldest advantage in physical distribution and it does not stop working.
Speed penetration rises to 38% of managed shipments. Faster delivery raises conversion, which raises volume, which improves density, which lowers cost, which funds faster delivery.
The cost index falls 20% by 2030 against a 2025 base. The path is restrained relative to what the company reported in Brazil during Q1 2026, where cost per shipment fell 17% in a single year.
Why the savings do not show up in margin
The obvious question is where a 20% reduction in fulfillment cost goes, when consolidated margin falls over the same period.
It goes back to the buyer. The explicit free shipping and logistics investment drag runs at 1.6% to 1.8% of revenue from 2026 through 2028, reaching a cumulative $5.7 billion across the forecast. Every unit of density improvement is being converted into a lower threshold, a faster promise, or a cheaper delivery for the customer.
This is the single clearest example of the pattern that governs the whole company. Unit economics improve, consolidated margin does not, and the difference is reinvested immediately into making the next cohort larger.
The drag fades to 1.0% of revenue by 2030, which is where a meaningful share of the reported margin recovery comes from. Physics does not deliver that fade. Management does.
Part V: Mercado Pago Beyond Payments
TPV is not revenue
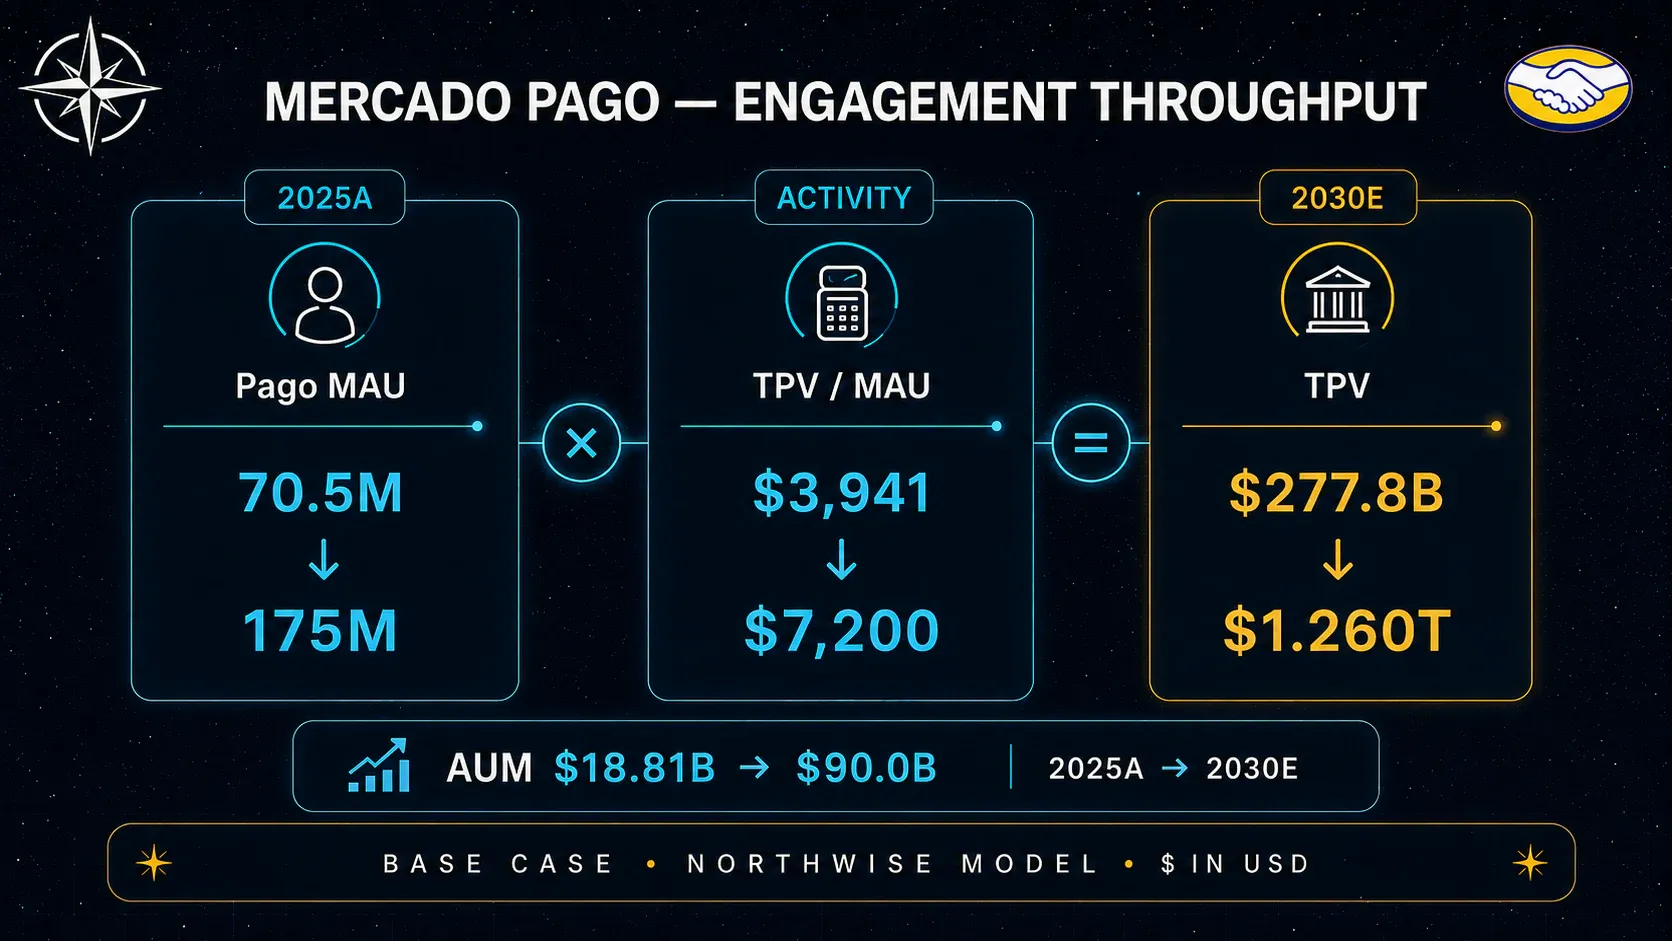
Mercado Pago processed $100.9 billion of payment volume in the second quarter of 2026 alone. Payment volume is the most quoted fintech metric and the least informative, with a take rate under 2% and falling.
Volume and monetization stay separate throughout, and neither masquerades as the other.
Fintech driver | 2025A | 2026E | 2027E | 2028E | 2029E | 2030E |
|---|---|---|---|---|---|---|
Average fintech MAU (M) | 70.5 | 90.5 | 111.0 | 132.0 | 153.0 | 175.0 |
Annual TPV per MAU | $3,941 | $4,721 | $5,200 | $5,900 | $6,500 | $7,200 |
TPV ($mm) | 277,841 | 427,251 | 577,200 | 778,800 | 994,500 | 1,260,000 |
Ending AUM ($mm) | 18,810 | 30,000 | 42,000 | 56,000 | 72,000 | 90,000 |
Two things are growing at once, and the second one carries the thesis. User count grows 148% across the forecast. Volume per user grows 83%.
Volume per user is what principality looks like in a spreadsheet. A user running $3,941 of annual volume through Pago is using it for some things. A user running $7,200 is using it for most things: paying merchants, receiving money, holding a balance, buying on the marketplace, servicing a card.
Assets under management nearly quintuple to $90 billion. Balances are the closest thing a digital wallet has to a deposit franchise, and they matter for three separate reasons. They generate net spread income.
They keep users on the platform. And they provide the cash-flow visibility that makes underwriting a loan to that user substantially less risky than underwriting a stranger.
Where the non-credit revenue comes from
Non-credit fintech revenue ($mm) | 2026E | 2027E | 2028E | 2029E | 2030E |
|---|---|---|---|---|---|
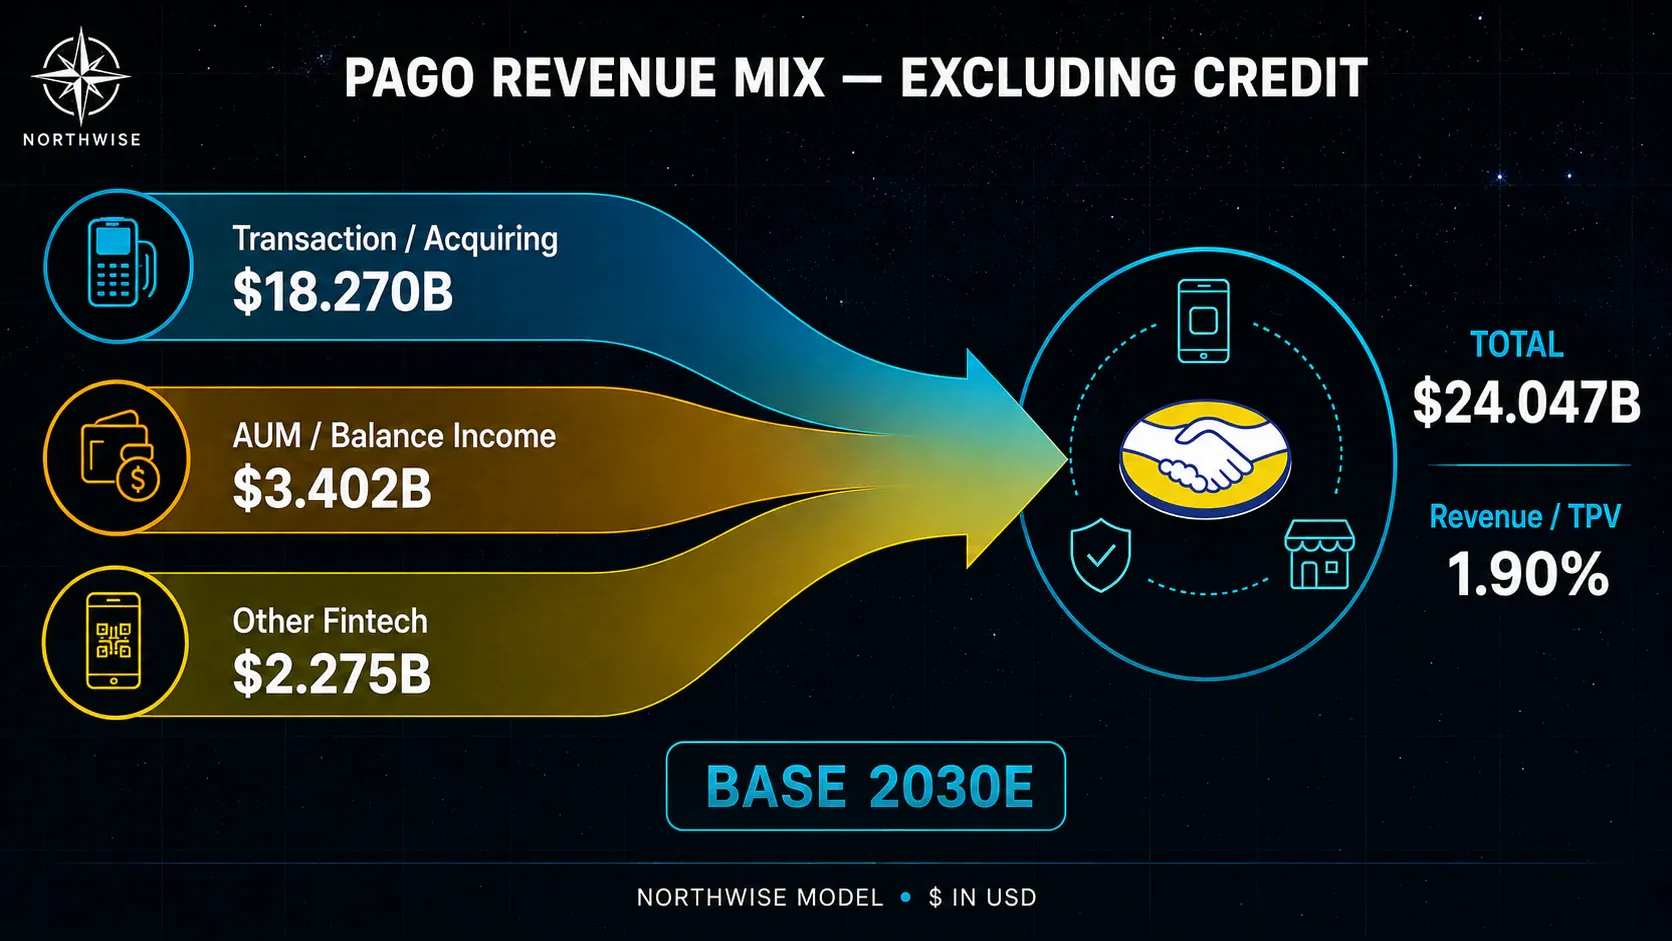
Transaction and acquiring | 6,622 | 8,658 | 11,526 | 14,520 | 18,270 |
AUM and balance income | 1,415 | 1,872 | 2,352 | 2,880 | 3,402 |
Other fintech services | 706 | 1,055 | 1,452 | 1,836 | 2,275 |
Fintech product sales | 69 | 75 | 82 | 90 | 100 |
Total non-credit fintech | 8,813 | 11,660 | 15,412 | 19,326 | 24,047 |
Every monetization rate inside that table declines. The transaction and acquiring net rate falls from 1.55% to 1.45% as off-platform acquiring becomes a larger share of a lower-monetized mix. The net AUM spread falls from 5.8% to 4.2% as rates normalize across the region.
Revenue almost triples anyway. Financial services revenue as a percentage of TPV drops from 2.05% to 1.90% while the absolute dollars rise from $8.8 billion to $24.0 billion.
That relationship recurs throughout this business. Monetization rates compressing and absolute economics expanding are not contradictory outcomes. Throughput and balances are growing far faster than the rates are falling, and a lower rate applied to a much larger base is how payments businesses have always scaled.
The one line that grows on rate as well as volume is other fintech services, running from $7.80 to $13.00 per user annually. Insurance, subscriptions, debit products, and ancillary services deepen product density per user and represent the closest thing Pago has to a cross-sell engine independent of transaction volume.
Part VI: The Credit Book
Four products wearing one name
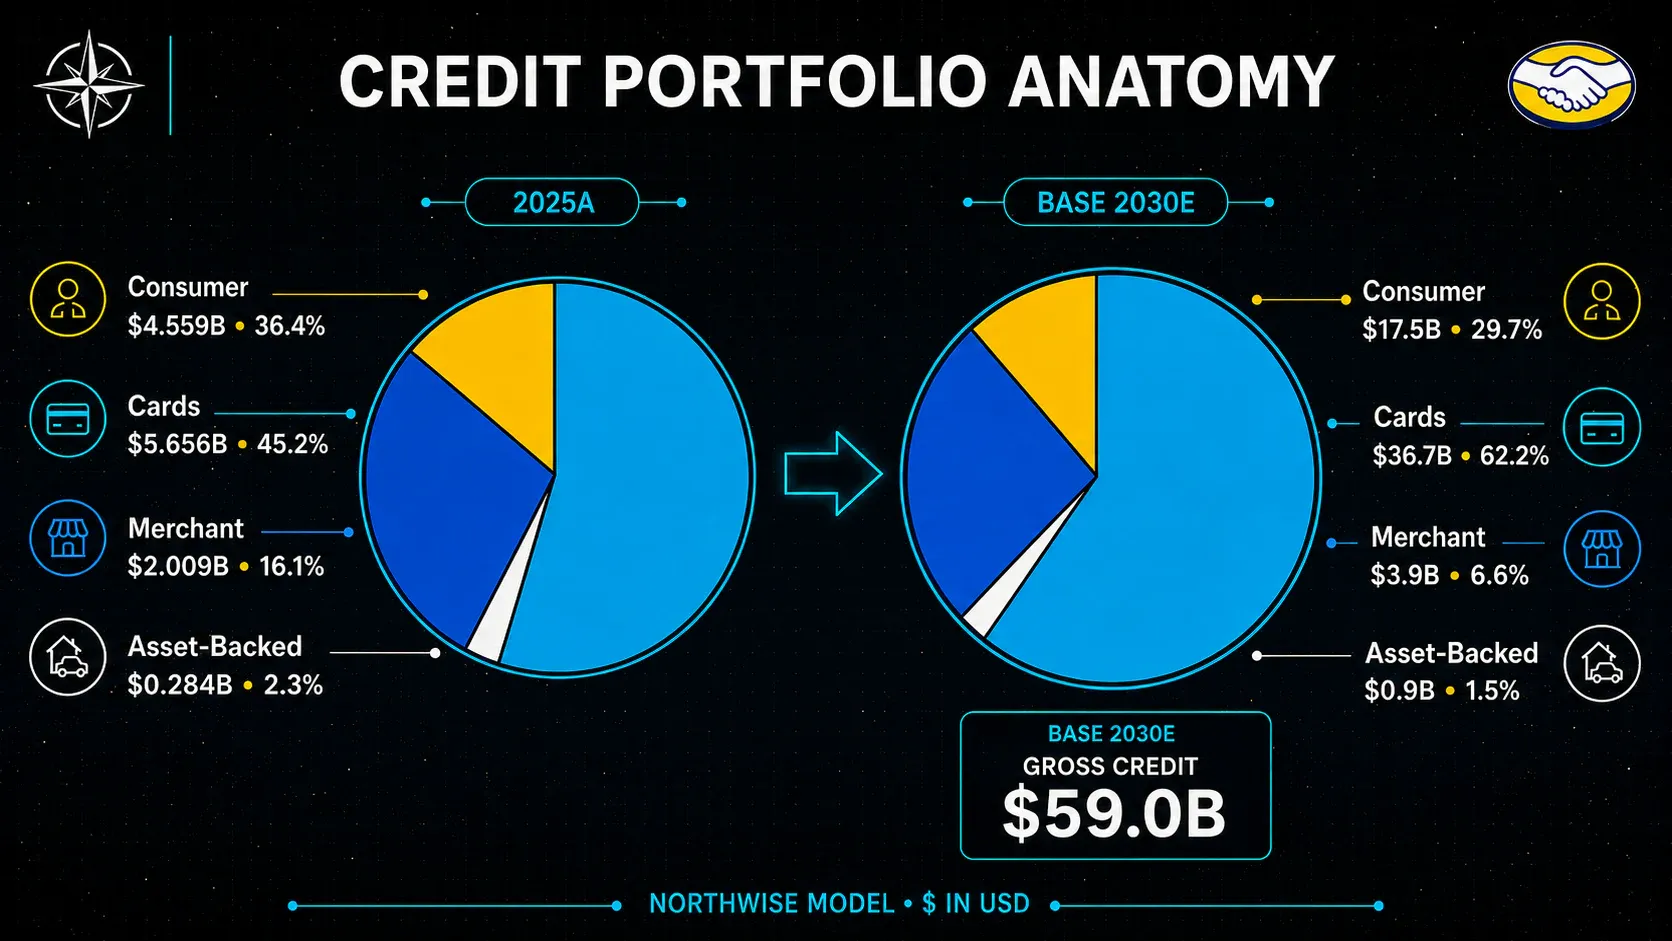
Mercado Crédito gets discussed as though it were a single thing. It is four businesses with almost nothing in common except a borrower base.
Ending gross receivables ($mm) | 2025A | 2026E | 2027E | 2028E | 2029E | 2030E |
|---|---|---|---|---|---|---|
Consumer credit | 4,559 | 7,800 | 10,200 | 12,800 | 15,200 | 17,500 |
Credit cards | 5,656 | 11,500 | 17,700 | 24,200 | 30,500 | 36,700 |
Merchant credit | 2,009 | 2,800 | 3,000 | 3,300 | 3,500 | 3,900 |
Asset-backed credit | 284 | 500 | 600 | 700 | 800 | 900 |
Gross portfolio | 12,508 | 22,600 | 31,500 | 41,000 | 50,000 | 59,000 |
Card share of portfolio | 45.2% | 50.9% | 56.2% | 59.0% | 61.0% | 62.2% |
The last row is the most consequential number in this section, and possibly in the whole forecast.
Merchant credit is lending against a seller's own receivables and future sales on a platform MercadoLibre controls. Repayment can be taken directly from the seller's incoming settlements. It carries the highest spread of any product in the book by a wide margin.
Consumer credit is unsecured personal lending, now increasingly including payroll-deducted loans repaid before the borrower is paid. High yield, high losses, short duration.
Credit cards are a revolving relationship product with interchange, interest income, and a long cost tail of rewards, fraud, servicing, and acquisition. They earn the thinnest spread in the book and carry the most strategic weight.
Asset-backed credit is vehicle and secured lending. Low yield, low losses, long duration, small.
In 2025 the book was 45% cards. By 2030 it is 62% cards, and merchant credit falls from 16% of the portfolio to under 7%. The blended economics of the book are being rewritten by mix, and any framework built on the merchant-credit-dominated portfolio of a few years ago will produce the wrong answer.
Turnover, originations, and what the balance hides
A $59 billion loan book understates the volume flowing through the credit engine, as these are short-duration loans that recycle several times a year.
Credit volume | 2025A | 2026E | 2027E | 2028E | 2029E | 2030E |
|---|---|---|---|---|---|---|
Average gross portfolio ($mm) | 12,508 | 17,554 | 27,050 | 36,250 | 45,500 | 54,500 |
Originations / average portfolio | 3.30x | 3.75x | 3.70x | 3.60x | 3.50x | 3.40x |
Originations ($mm) | 41,276 | 65,828 | 100,085 | 130,500 | 159,250 | 185,300 |
Payroll balances inside consumer | 0 | 100 | 700 | 1,800 | 3,300 | 5,000 |
MercadoLibre originates roughly $185 billion of credit in 2030 to hold a $59 billion balance. Turnover declines gradually as cards and payroll lending extend average duration, and it stays extraordinarily high by banking standards throughout.
The volume is both a strength and a warning. Short duration means the book reprices and re-underwrites constantly, so a deteriorating credit environment shows up in the numbers within quarters, not years. It also means the company is making an enormous number of underwriting decisions annually, and the quality of that machinery is not directly observable from outside.
Payroll lending reaches $5.0 billion inside consumer credit by 2030, or 28.6% of the consumer book. It is carried as a memo subset and never added to the portfolio twice. Deducting repayment from salary before it reaches the borrower materially lowers loss rates, which improves consumer risk mix gradually across the forecast.
It does not de-risk the book. Payroll balances are 8.5% of the total portfolio in 2030, against cards at 62%.
Product-level economics
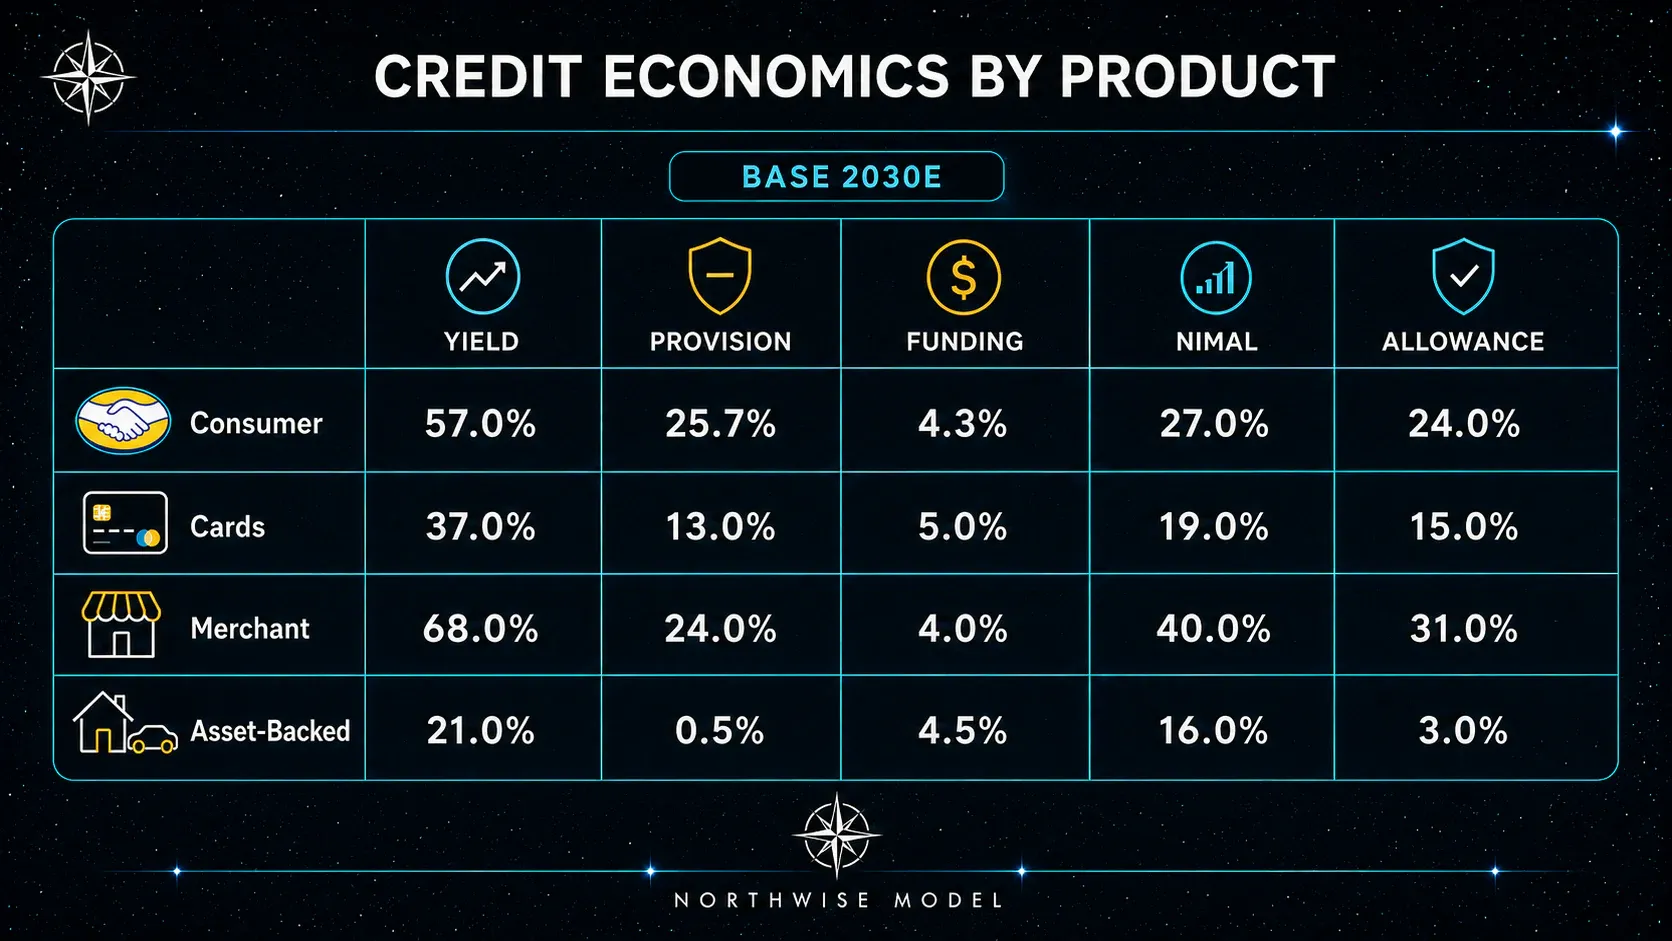
Each product carries its own realized yield, funding burden, and loss burden. What remains is net interest margin after losses, which is the measure MercadoLibre itself reports and the only credit profitability figure worth arguing about.
2030E credit economics | Consumer | Cards | Merchant | Asset-backed |
|---|---|---|---|---|
Average gross balance ($mm) | 16,350 | 33,600 | 3,700 | 850 |
Realized revenue yield | 57.0% | 37.0% | 68.0% | 21.0% |
Provision burden | 25.7% | 13.0% | 24.0% | 0.5% |
Funding burden | 4.3% | 5.0% | 4.0% | 4.5% |
NIMAL | 27.0% | 19.0% | 40.0% | 16.0% |
Ending allowance / gross | 24.0% | 15.0% | 31.0% | 3.0% |
Yields at these levels look alarming to anyone accustomed to developed-market lending, and they are not the right comparison. Latin American consumer credit carries base rates, inflation expectations, and loss rates that no North American or European book faces. A 57% yield on Brazilian unsecured consumer credit sits against a 25.7% provision burden. The spread, not the headline rate, is the economic fact.
Merchant credit remains the standout product, holding a 40% after-loss spread even after normalizing from 54% in 2026. Lending against sales you can see and settlements you control is structurally advantaged, and the reason merchant credit is not the growth engine is that the addressable seller base is finite.
Cards are the opposite case. The 37% yield is the lowest of the three unsecured products, the 5.0% funding burden is the highest, and the 19% NIMAL sits well below consumer and merchant. Cards are also where all the growth is.
What that produces in aggregate
Aggregate credit ($mm) | 2026E | 2027E | 2028E | 2029E | 2030E |
|---|---|---|---|---|---|
Credit revenue | 9,851 | 13,920 | 17,477 | 20,996 | 24,446 |
Provision expense | (5,358) | (7,581) | (8,909) | (9,484) | (9,462) |
Third-party funding cost | (1,061) | (1,577) | (1,990) | (2,315) | (2,569) |
NIMAL dollars | 3,432 | 4,763 | 6,578 | 9,198 | 12,415 |
Blended NIMAL | 19.6% | 17.6% | 18.2% | 20.2% | 22.8% |
Ending allowance | 5,803 | 7,386 | 8,881 | 10,019 | 10,941 |
Implied write-offs | 2,696 | 5,998 | 7,414 | 8,346 | 8,540 |
The blended NIMAL curve has a shape that repays study. It starts at 23.3% in 2025, falls to 17.6% in 2027, and recovers to 22.8% in 2030.
The dip is not a credit deterioration story. It is a mix story. Low-spread cards are growing from 45% to 56% of the book across those two years, dragging the blend down even while each individual product performs. The recovery from 2028 onward comes almost entirely from card cohorts seasoning, which is the subject of the next section.
Provision expense peaks in 2029 and declines in 2030 in absolute dollars, despite the portfolio still growing. Provisioning under an expected-loss framework front-loads the cost of new originations, so a book whose growth rate is slowing sheds provision expense even as balances rise. Provision as a percentage of originations falls from 8.1% to 5.1% across the forecast, which is the cleaner cross-cycle underwriting control.
Part VII: The Card Debate
Cohort economics and aggregate economics are not the same number
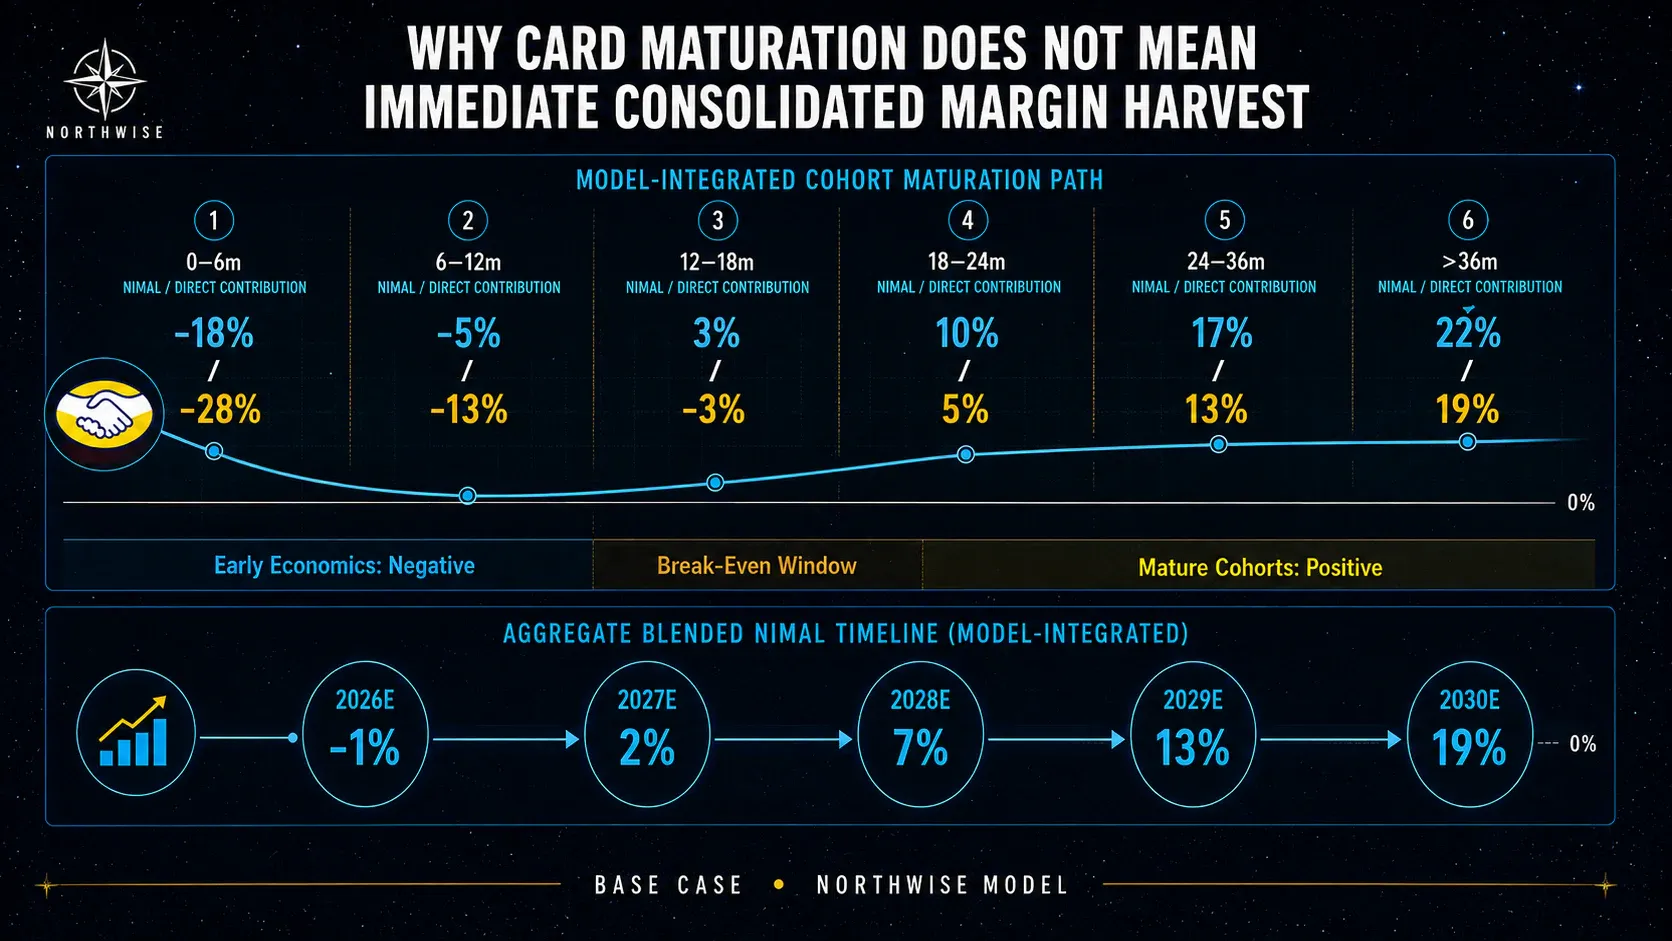
The credit card book is where the bull and bear cases actually collide, and most of the disagreement comes from comparing different things.
A card cohort matures along a curve. In its first six months it loses money badly, as the account is provisioned upfront, rewards and acquisition costs are incurred immediately, and the balance has not yet started revolving. It gets less bad.
Around 12 to 18 months it crosses into positive NIMAL, which management has disclosed as the typical Brazilian pattern. Beyond that it becomes attractive.
Cohort age | NIMAL | Post-NIMAL servicing drag | Direct contribution |
|---|---|---|---|
0 to 6 months | (18%) | (10%) | (28%) |
6 to 12 months | (5%) | (8%) | (13%) |
12 to 18 months | 3% | (6%) | (3%) |
18 to 24 months | 10% | (5%) | 5% |
24 to 36 months | 17% | (4%) | 13% |
Over 36 months | 22% | (3%) | 19% |
The third column is the part usually left out. NIMAL break-even is not economic break-even, as servicing, rewards, fraud, support, and acquisition costs all sit below the NIMAL line. A cohort reaching positive NIMAL at 15 months does not reach positive direct contribution until roughly 20.
The bull argument is that mature cohorts earn 19% direct contribution, and MercadoLibre is building an enormous stock of accounts that will all eventually get there. That argument is correct about the destination.
The bear argument is that aggregate reported card profitability has been poor and shows little sign of improving. That argument is correct about the present.
Both are describing the same fact from different ends. Aggregate profitability stays depressed as long as the company keeps creating immature cohorts faster than the old ones season, and MercadoLibre is doing exactly that on purpose.
The aggregate card path
Card metrics | 2025A | 2026E | 2027E | 2028E | 2029E | 2030E |
|---|---|---|---|---|---|---|
Ending card portfolio ($mm) | 5,656 | 11,500 | 17,700 | 24,200 | 30,500 | 36,700 |
Average exposure per active card | $420 | $470 | $500 | $520 | $540 | $560 |
Implied active card users (M) | 13.5 | 24.5 | 35.4 | 46.5 | 56.5 | 65.5 |
New account equivalents (M) | 7 | 11 | 11 | 10 | 9 | 8 |
Aggregate card NIMAL | n/a | (1%) | 2% | 7% | 13% | 19% |
Card NIMAL dollars ($mm) | n/a | (86) | 292 | 1,467 | 3,556 | 6,384 |
Servicing, rewards, acquisition ($mm) | (566) | (1,174) | (1,770) | (2,373) | (2,937) | (3,473) |
Direct card contribution ($mm) | (566) | (1,260) | (1,478) | (907) | 618 | 2,911 |
The bottom row is the honest picture of the card business. It loses money every year through 2028, bottoming at a $1.5 billion annual loss in 2027, and turns positive in 2029.
Cumulatively, the card book consumes roughly $3.6 billion of direct contribution between 2026 and 2028 before producing anything. Building a 65 million-user card franchise costs that much, and it is the single largest identifiable reason reported operating margin stays in the 6% to 8% range through 2028.
The aggregate card NIMAL assumption of 19% by 2030 is the most consequential single input in the forecast. It sits below the 22% mature-cohort rate, reflecting the fact that MercadoLibre is still issuing eight million new accounts in 2030 and therefore still carrying immature cohorts. It also assumes no deterioration in the underlying credit environment.
The halo, and why it stays quarantined
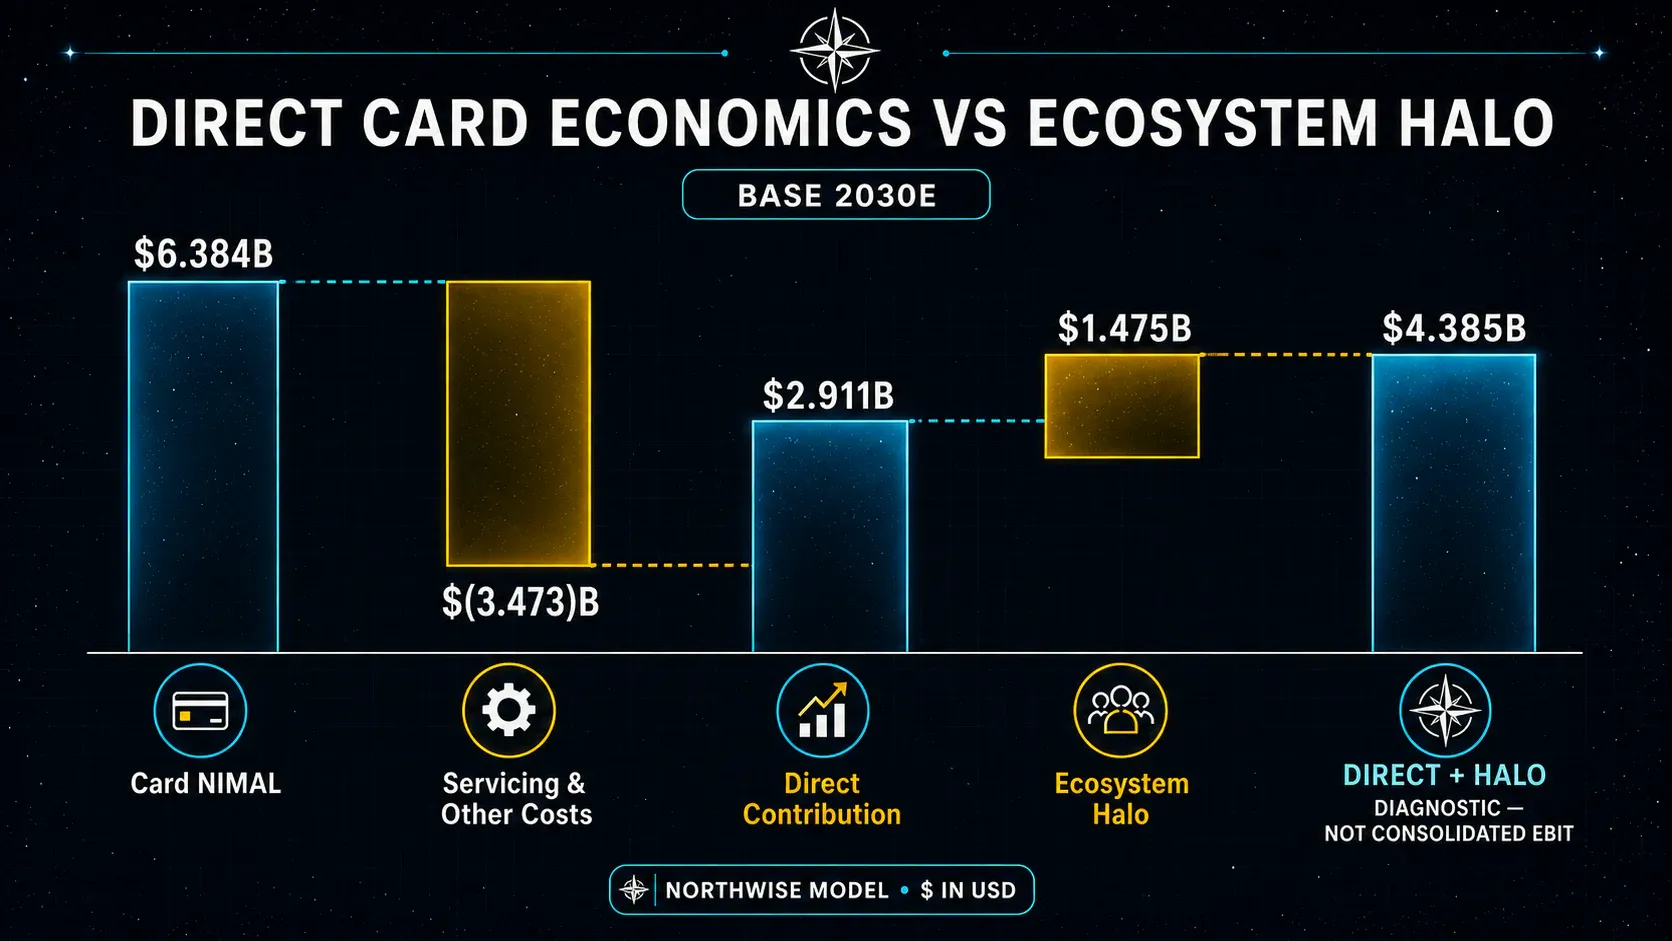
Card users become better ecosystem users. They shop more, hold larger balances, and stay longer. The diagnostic here estimates that effect at roughly $1.5 billion of 2030 contribution, and adding it to direct card economics would make the card business look substantially better.
It is not added. Not to earnings, not to the sum-of-the-parts, not to the valuation.
The reason is arithmetic, not conservatism for its own sake. The frequency assumption in the commerce model, the TPV-per-user assumption in the payments model, and the AUM growth assumption already reflect users who are more engaged than they would otherwise be. A portion of that engagement comes from card ownership. Counting it once inside those drivers and again as a separate ecosystem premium counts the same dollar twice.
The diagnostic exists to answer a different question, which is whether issuing a card is a rational use of capital. Including the halo, the card program crosses into positive territory in 2028 instead of 2029. That is a useful fact for judging management's decision and a dangerous one for building a valuation.
Part VIII: Funding, Sponsor Capital, and Shadow Exposure
The question most fintech models refuse to answer
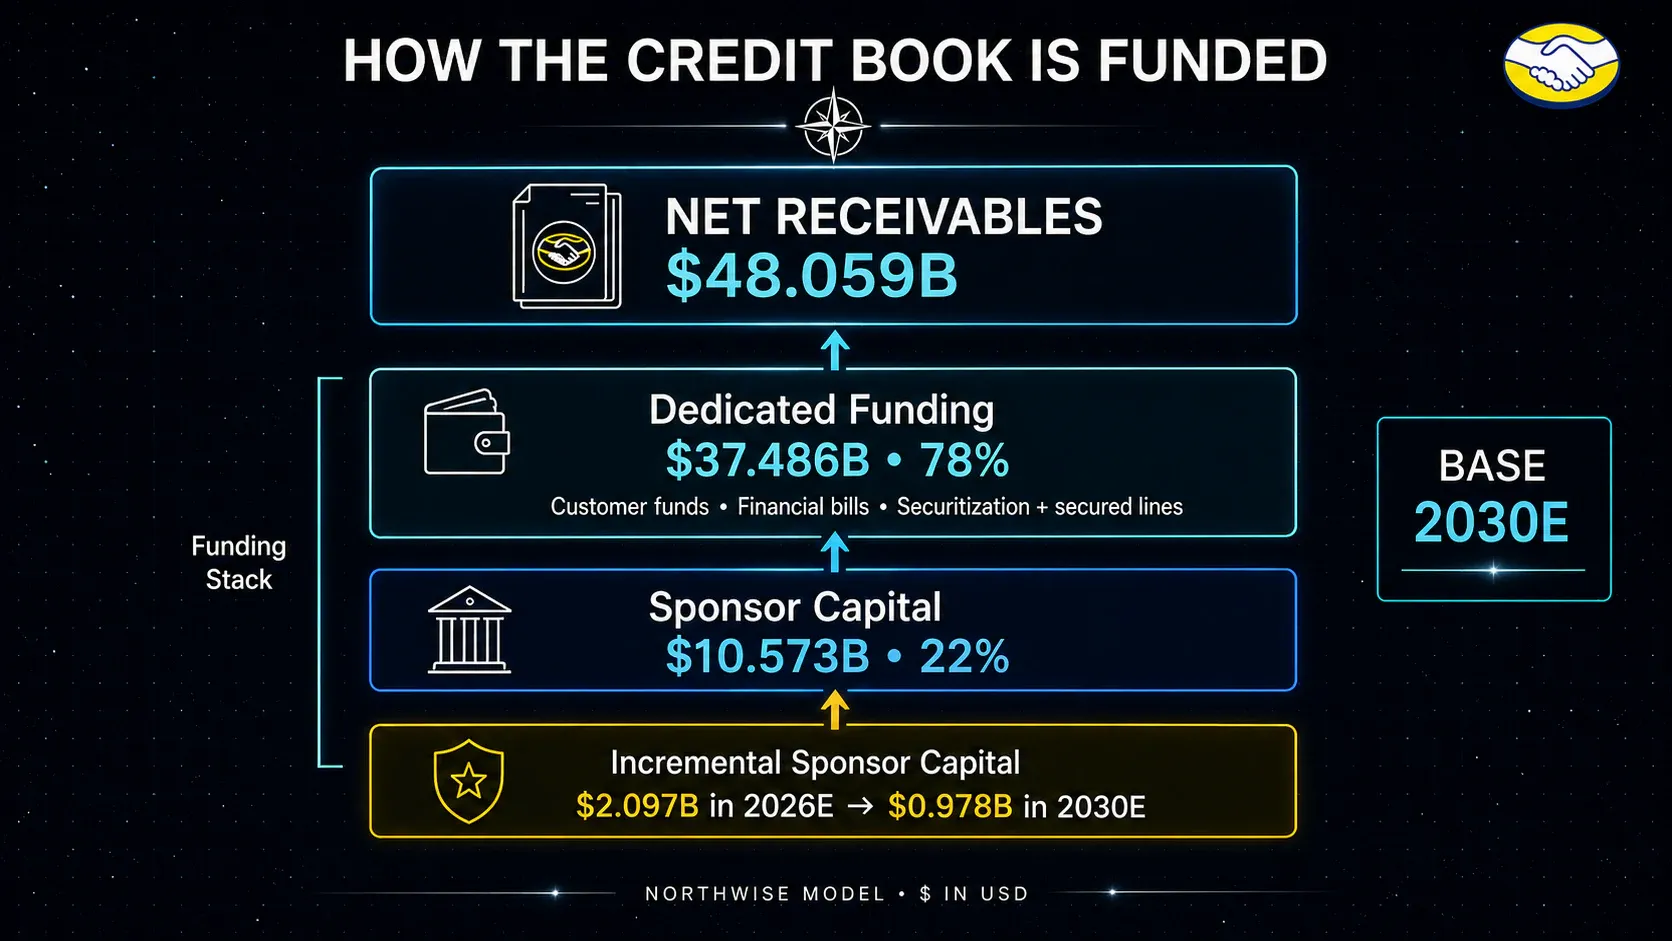
A lending business growing receivables from $12.5 billion to $59.0 billion has to fund $46.5 billion of new assets from somewhere. How that is treated determines whether the cash flow statement means anything.
Two shortcuts are common and both are wrong.
The first treats all deposit and liability growth as offsetting all receivable growth, which produces a company that appears to generate cash while its balance sheet expands by tens of billions. That framing makes any lender look like a software business.
The second subtracts the entire increase in receivables from free cash flow, which treats a bank as though shareholders personally funded every loan. That framing makes any lender look uninvestable.
This model does neither. It funds what is actually funded externally and charges the parent for the rest.
Credit funding ($mm) | 2025A | 2026E | 2027E | 2028E | 2029E | 2030E |
|---|---|---|---|---|---|---|
Gross credit portfolio | 12,508 | 22,600 | 31,500 | 41,000 | 50,000 | 59,000 |
Ending allowance | (3,142) | (5,803) | (7,386) | (8,881) | (10,019) | (10,941) |
Net credit receivables | 9,366 | 16,797 | 24,114 | 32,119 | 39,981 | 48,059 |
Dedicated funding share | 65% | 68% | 72% | 74% | 76% | 78% |
Dedicated credit funding | 6,088 | 11,422 | 17,362 | 23,768 | 30,386 | 37,486 |
Parent / sponsor capital | 3,278 | 5,375 | 6,752 | 8,351 | 9,595 | 10,573 |
Incremental sponsor capital | n/a | 2,097 | 1,377 | 1,599 | 1,245 | 978 |
Dedicated funding means liabilities raised specifically against the credit book: customer balances, financial bills and deposit certificates, securitizations, receivable sales, bank lines, and secured facilities. At June 30, 2026 the company reported $10.6 billion of total loans and other financial liabilities, including $3.6 billion of collateralized debt and $2.7 billion of financial bills and deposit certificates.
The share rises from 65% to 78% across the forecast, the largest single improvement in the capital structure. Every point of dedicated funding share is a point of parent capital released back to shareholders.
What remains is sponsor capital, meaning consolidated equity tied up supporting the loan book. It reaches $10.6 billion by 2030. The incremental annual requirement peaks at $2.1 billion in 2026 and falls to under $1.0 billion by 2030, and that incremental figure is charged directly against normalized free cash flow.
The exposure that does not appear on the balance sheet
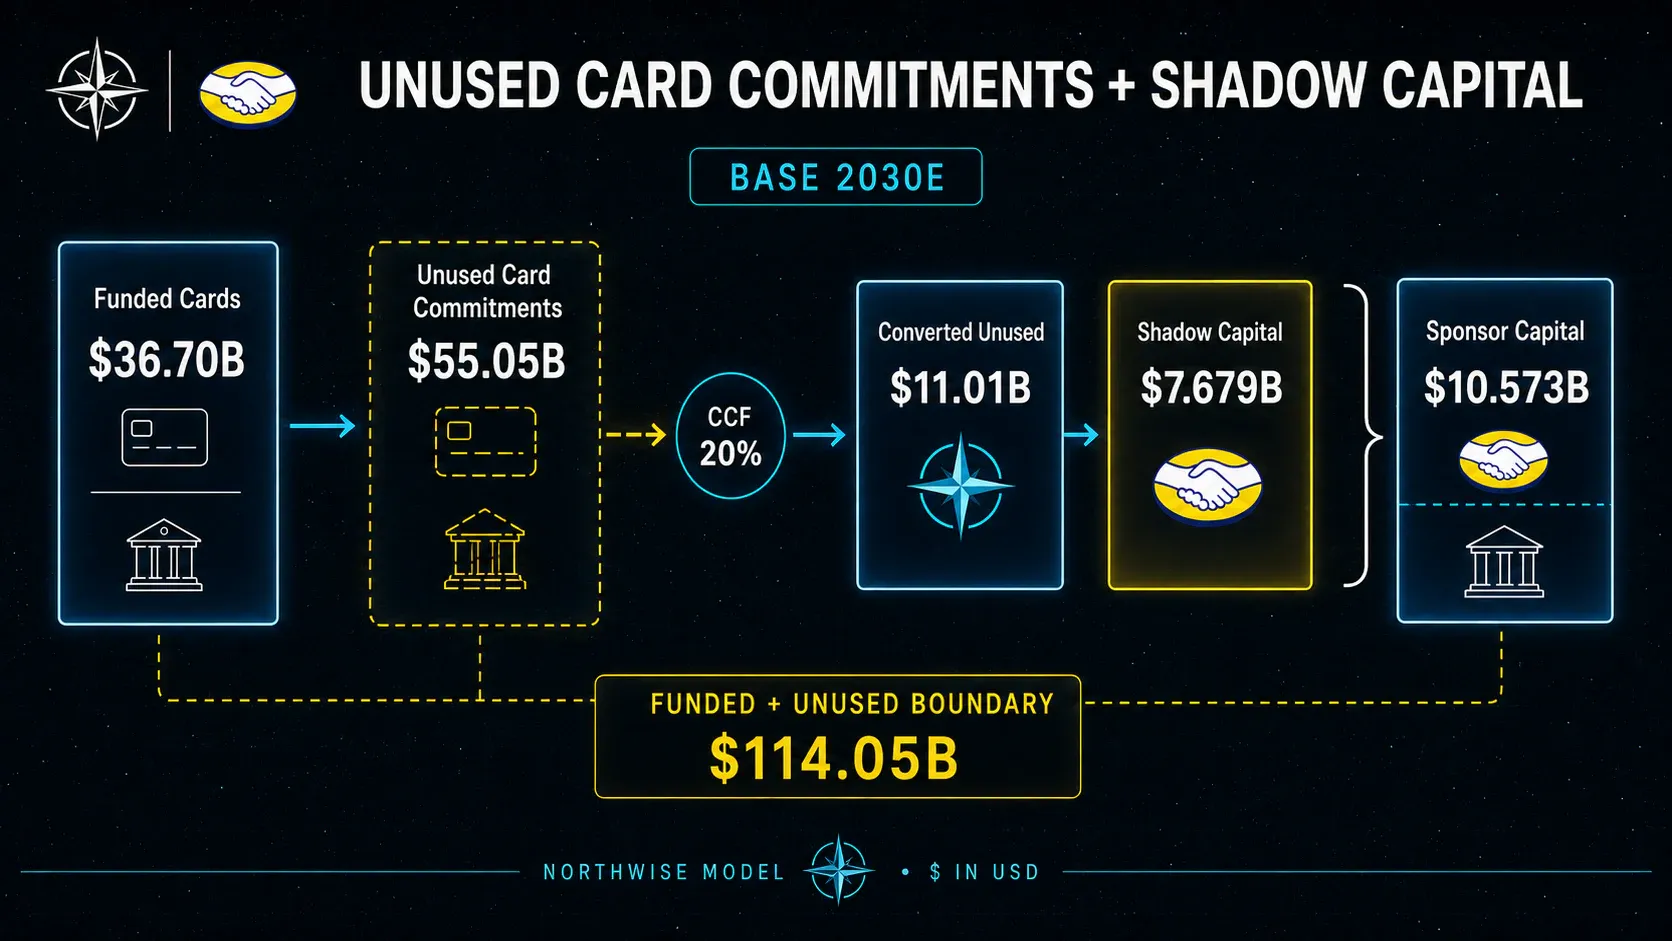
A credit card is a promise to lend, not a loan. MercadoLibre has extended far more contractual capacity than customers have drawn, and the gap is growing faster than the funded book.
Card commitments ($mm) | 2025A | 2026E | 2027E | 2028E | 2029E | 2030E |
|---|---|---|---|---|---|---|
Funded card receivables | 5,656 | 11,500 | 17,700 | 24,200 | 30,500 | 36,700 |
Funded line utilization | 38.6% | 35.0% | 36.0% | 37.0% | 38.5% | 40.0% |
Total agreed card lines | 14,653 | 32,857 | 49,167 | 65,405 | 79,221 | 91,750 |
Unused card commitments | 8,997 | 21,357 | 31,467 | 41,205 | 48,721 | 55,050 |
Converted unused exposure | 1,350 | 3,204 | 5,035 | 7,417 | 9,257 | 11,010 |
Northwise shadow capital | 1,393 | 2,600 | 3,789 | 5,140 | 6,401 | 7,679 |
The company disclosed $14.0 billion of unused card commitments at June 30, 2026, up from $9.0 billion at the end of 2025. By 2030 the Base case carries $55.1 billion of undrawn capacity against $36.7 billion of funded balances.
Not all of it will be drawn, and utilization has been running in the mid-thirties. Applying a credit conversion factor of 15% to 20% produces roughly $11.0 billion of risk-weighted contingent exposure in 2030, and a 13% economic capital charge against funded and contingent exposure together produces $7.7 billion of shadow capital.
Shadow capital is a diagnostic and is not deducted from cash flow. It exists to make one point clearly. The funded loan balance understates the boundary of risk MercadoLibre has created, and a model that looks only at receivables is looking at roughly two thirds of the picture.
What honest cash conversion looks like
Charging the model for sponsor capital produces a very different cash flow profile than the reported statements suggest.
Normalized FCFE bridge ($mm) | 2026E | 2027E | 2028E | 2029E | 2030E |
|---|---|---|---|---|---|
Net income | 1,937 | 2,598 | 4,029 | 7,163 | 12,559 |
D&A | 1,179 | 1,641 | 2,081 | 2,484 | 2,876 |
Capital expenditure | (1,769) | (2,637) | (3,623) | (4,299) | (4,832) |
Non-credit working capital | 632 | 879 | 1,156 | 1,433 | 1,726 |
Incremental sponsor credit capital | (2,097) | (1,377) | (1,599) | (1,245) | (978) |
Normalized FCFE | (118) | 1,104 | 2,044 | 5,537 | 11,351 |
FCFE / net income | (6%) | 43% | 51% | 77% | 90% |
MercadoLibre converts negative cash in 2026 and 43% of net income in 2027. A model that ignores sponsor capital would show $1.98 billion and $2.48 billion respectively, which is a different company.
Conversion reaches 90% by 2030, and the improvement comes from three places working together. Dedicated funding share rises, so less of each incremental dollar of receivables falls on the parent. Portfolio growth decelerates, so there are fewer incremental dollars. And net income grows faster than either, so the charge shrinks as a proportion.
One note on the working capital line, which is deliberately understated. A marketplace that collects from buyers before paying sellers generates real float, and only 1.5% of revenue is carried here of revenue as a structural non-credit working capital benefit. The actual benefit has run higher. Understating it keeps the cash flow line defensible.
Part IX: Geography
One company, four economies
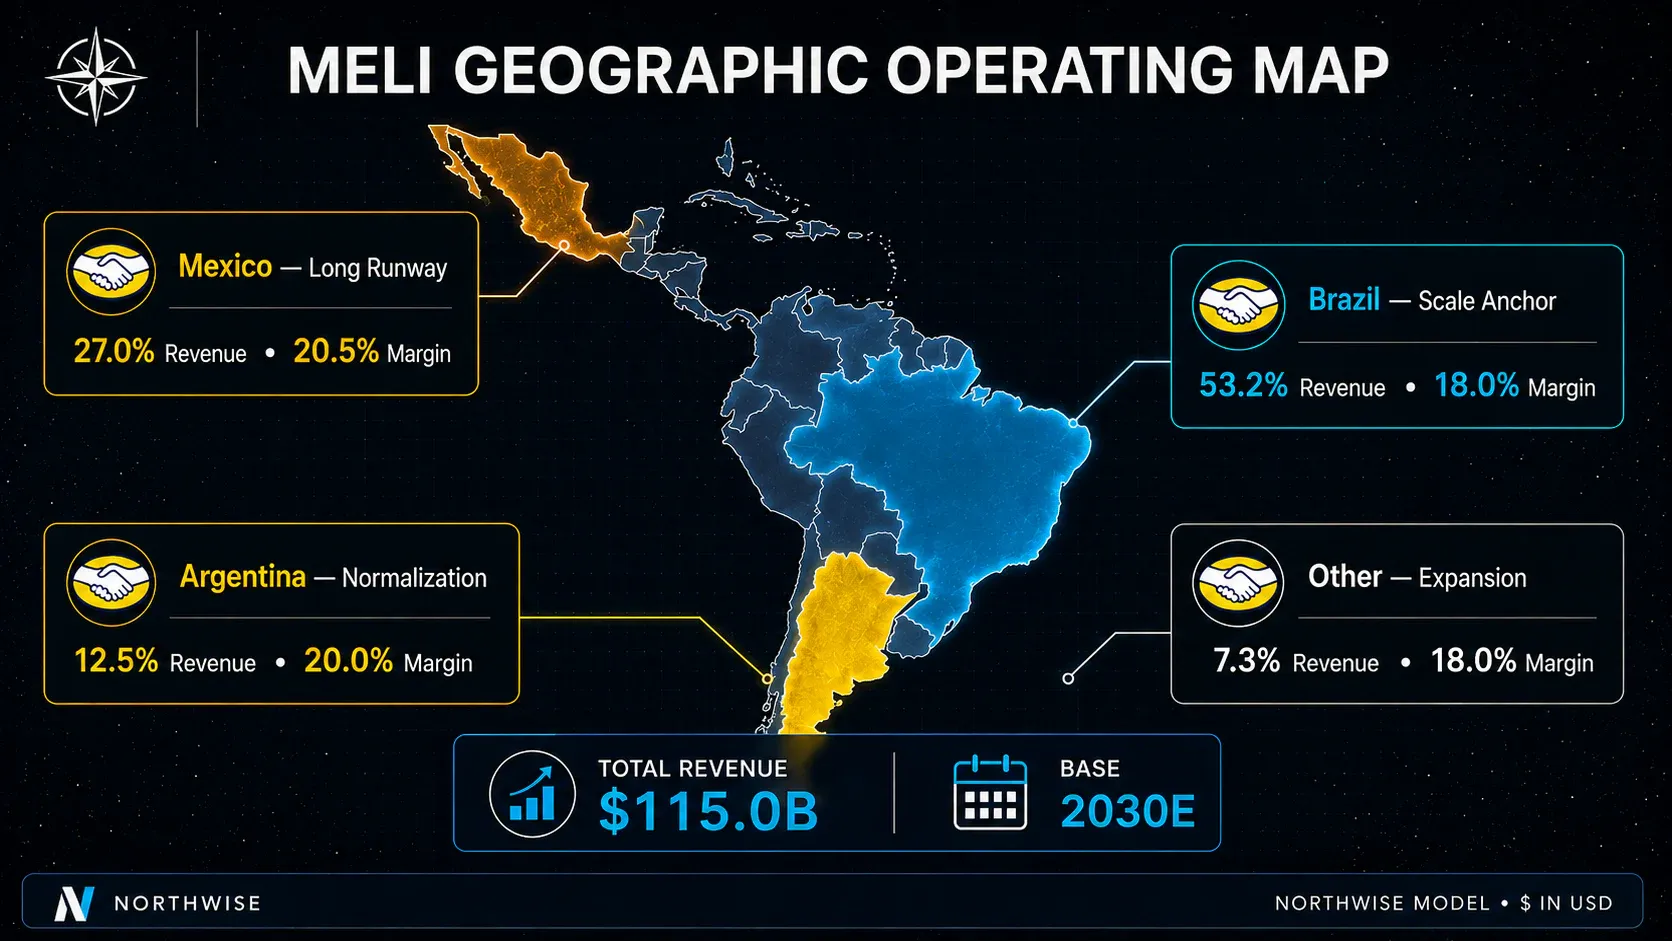
MercadoLibre operates across Latin America, and treating that footprint as a single market is the fastest way to build a wrong model. The four reporting geographies have different growth rates, different margins, and different reasons for both.
2030E geography | Revenue share | Revenue ($mm) | Direct margin | Direct contribution ($mm) |
|---|---|---|---|---|
Brazil | 53.2% | 61,206 | 18.0% | 11,017 |
Mexico | 27.0% | 31,063 | 20.5% | 6,368 |
Argentina | 12.5% | 14,381 | 20.0% | 2,876 |
Other | 7.3% | 8,399 | 18.0% | 1,512 |
Consolidated | 100% | 115,049 | 18.9% | 21,773 |
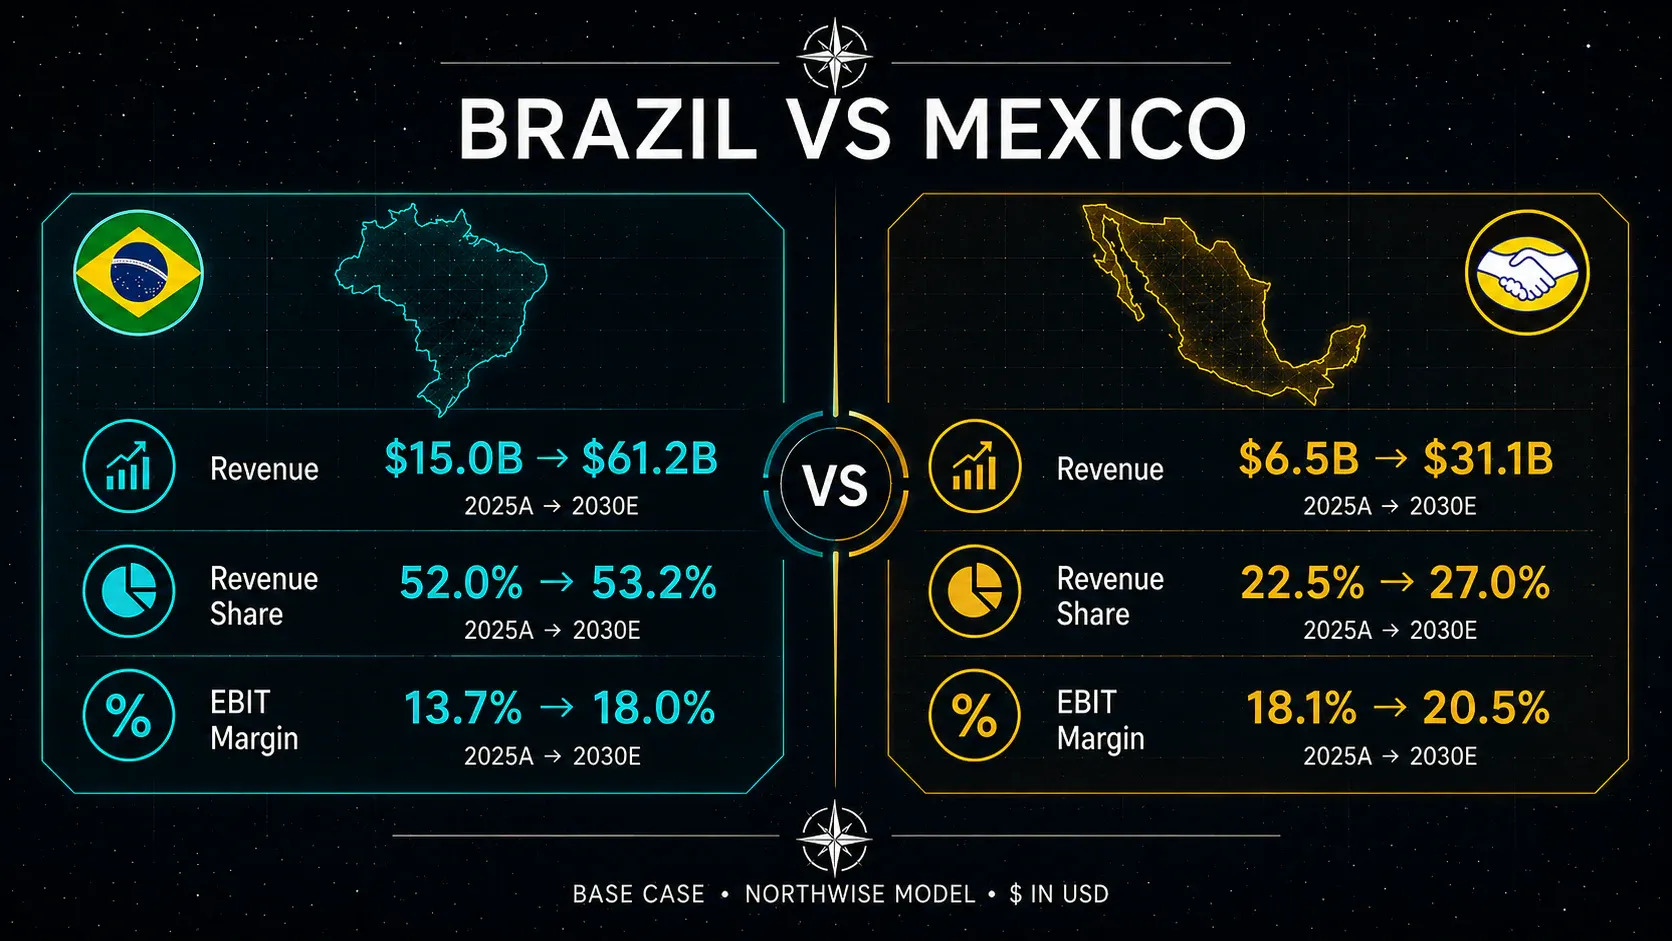
Brazil is the anchor and the density machine. It holds just over half of revenue throughout the forecast, which is where the fulfillment network is deepest, where the card program is most aggressive, and where the free shipping investment is heaviest.
Brazilian direct margin is also where the reinvestment shows most clearly. It falls from 13.7% in 2025 to 10.5% in 2026 and 2027, then recovers to 18.0% by 2030. The anchor market is absorbing the cost of the growth strategy and is expected to repay it late.
Mexico is the second engine and the more important medium-term growth story. Revenue share rises from 22.5% to 27.0%, and direct margin recovers from 14.5% to 20.5% as acquiring, credit, and fulfillment scale. Mexico ends the forecast as the highest-margin geography in the company.
Argentina requires the most careful handling. Direct margin of 41.6% in 2025 is not a sustainable operating result. It reflects an inflationary environment where nominal pricing runs ahead of nominal costs, and it normalizes to 20.0% across the forecast while revenue share falls from 21.8% to 12.5%.
The normalization is a headwind hiding inside consolidated numbers. Argentina contributes $2.62 billion of direct contribution in 2025 and $2.88 billion in 2030, essentially flat across five years while the company nearly quadruples revenue. Consolidated margin has to overcome that drag before it can improve at all.
Other markets, principally Chile and Colombia, roughly double their revenue share to 7.3% and reach 18.0% direct margin. They matter more at the end of the forecast than the beginning.
The reconciliation that keeps the geography honest
Direct contribution is not EBIT. The gap is corporate and indirect cost, and forcing that reconciliation prevents the geographic build from becoming a separate story that never touches the income statement.
Reconciliation ($mm) | 2025A | 2026E | 2027E | 2028E | 2029E | 2030E |
|---|---|---|---|---|---|---|
Consolidated direct contribution | 6,005 | 6,421 | 8,582 | 11,360 | 15,839 | 21,773 |
Direct contribution margin | 20.8% | 15.3% | 14.6% | 14.7% | 16.6% | 18.9% |
Corporate and indirect cost | (2,798) | (3,600) | (4,773) | (5,579) | (5,809) | (4,516) |
Corporate cost / revenue | 9.7% | 8.6% | 8.1% | 7.2% | 6.1% | 3.9% |
Reported EBIT | 3,207 | 2,821 | 3,809 | 5,781 | 10,030 | 17,257 |
Corporate cost falling from 9.7% to 3.9% of revenue is a real assumption that carries weight. Roughly 580 basis points of the consolidated margin improvement across the forecast comes from central cost leverage and not from any geography or engine.
A company adding $86 billion of revenue against a corporate function that does not need to grow proportionally can plausibly deliver it. It is also the kind of assumption that should be tracked and not trusted, and it appears in the monitoring framework for that reason.
Part X: The Margin Bridge
Reported margin is not earnings power
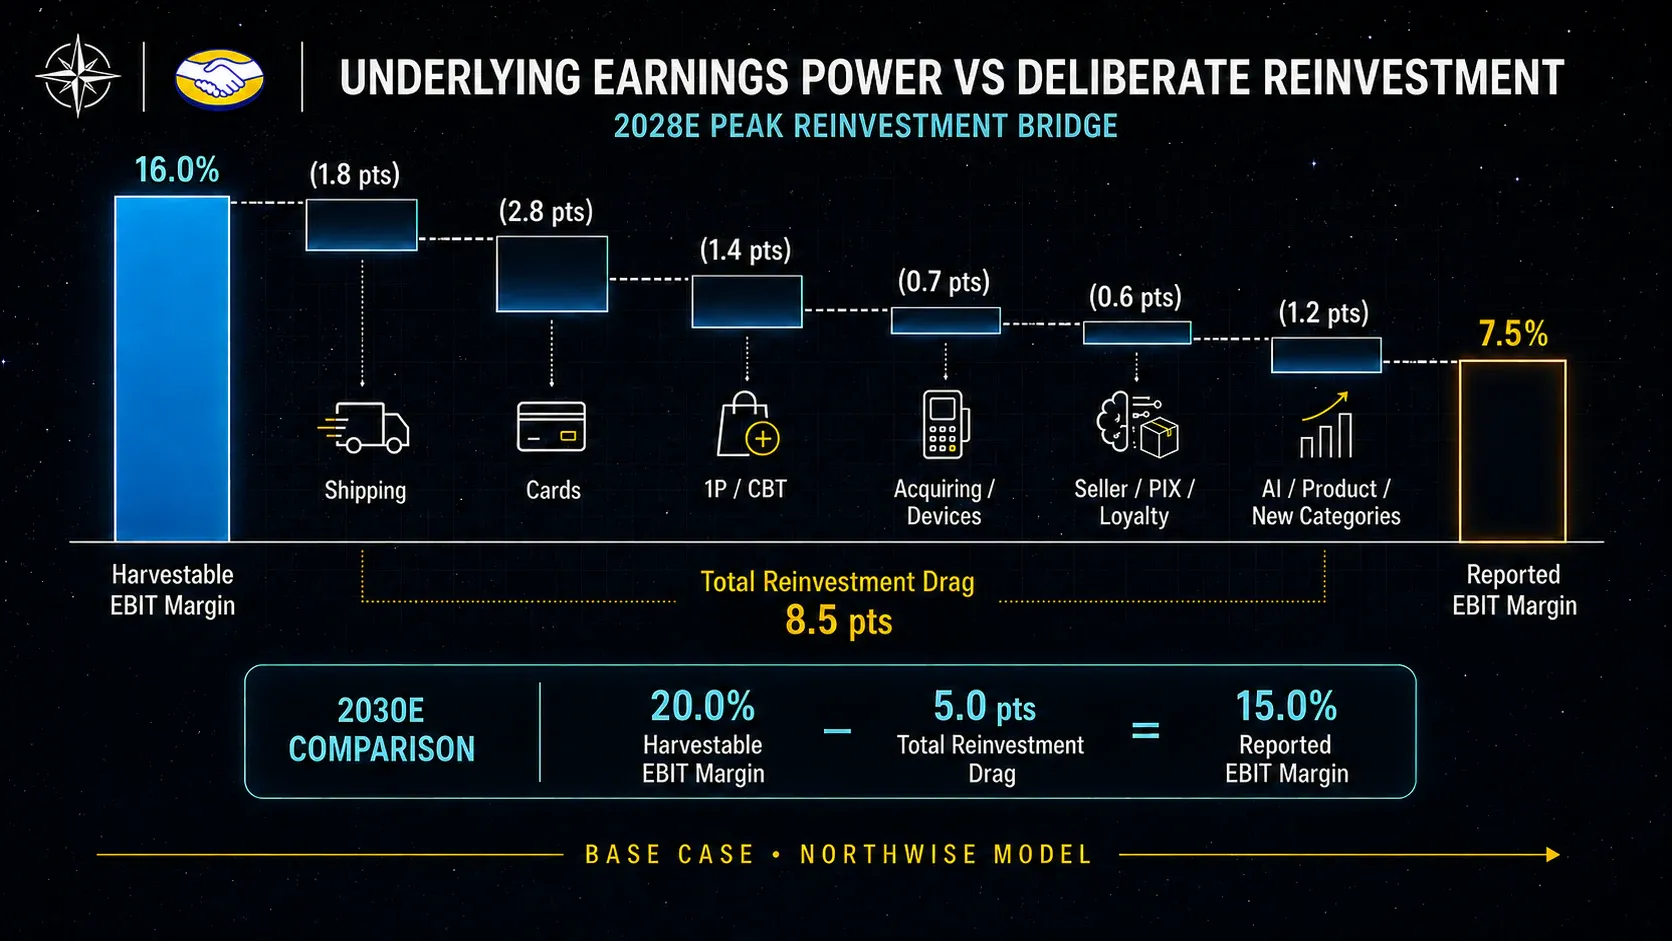
This is the conceptual center of the report and the place where the Northwise view departs most sharply from consensus.
MercadoLibre's reported operating margin fell from 11.1% in 2025 to a forecast 6.7% in 2026 and 6.5% in 2027. Read as a performance measure, that is a deteriorating business. Read as a decision, it is something else entirely.
Two numbers that most forecasts blend are kept apart here. Harvestable EBIT margin is what the business would earn if management turned the growth dial down and stopped funding the next cohort. Reported EBIT margin is what actually appears after the growth investment is subtracted.
Margin architecture | 2025A | 2026E | 2027E | 2028E | 2029E | 2030E |
|---|---|---|---|---|---|---|
Harvestable EBIT margin | 13.0% | 12.5% | 14.0% | 16.0% | 18.0% | 20.0% |
Total growth investment drag | 1.9% | 5.8% | 7.5% | 8.5% | 7.5% | 5.0% |
Reported EBIT margin | 11.1% | 6.7% | 6.5% | 7.5% | 10.5% | 15.0% |
Underlying earnings power rises in every single year of the forecast. Reported margin falls for two of them, bottoms in 2027, and does not exceed its 2025 level until 2030.
Both statements describe the same company. The gap between them is a management decision, taken deliberately, and running to a cumulative $26.3 billion of revenue reinvested between 2026 and 2030.
Where the money actually goes
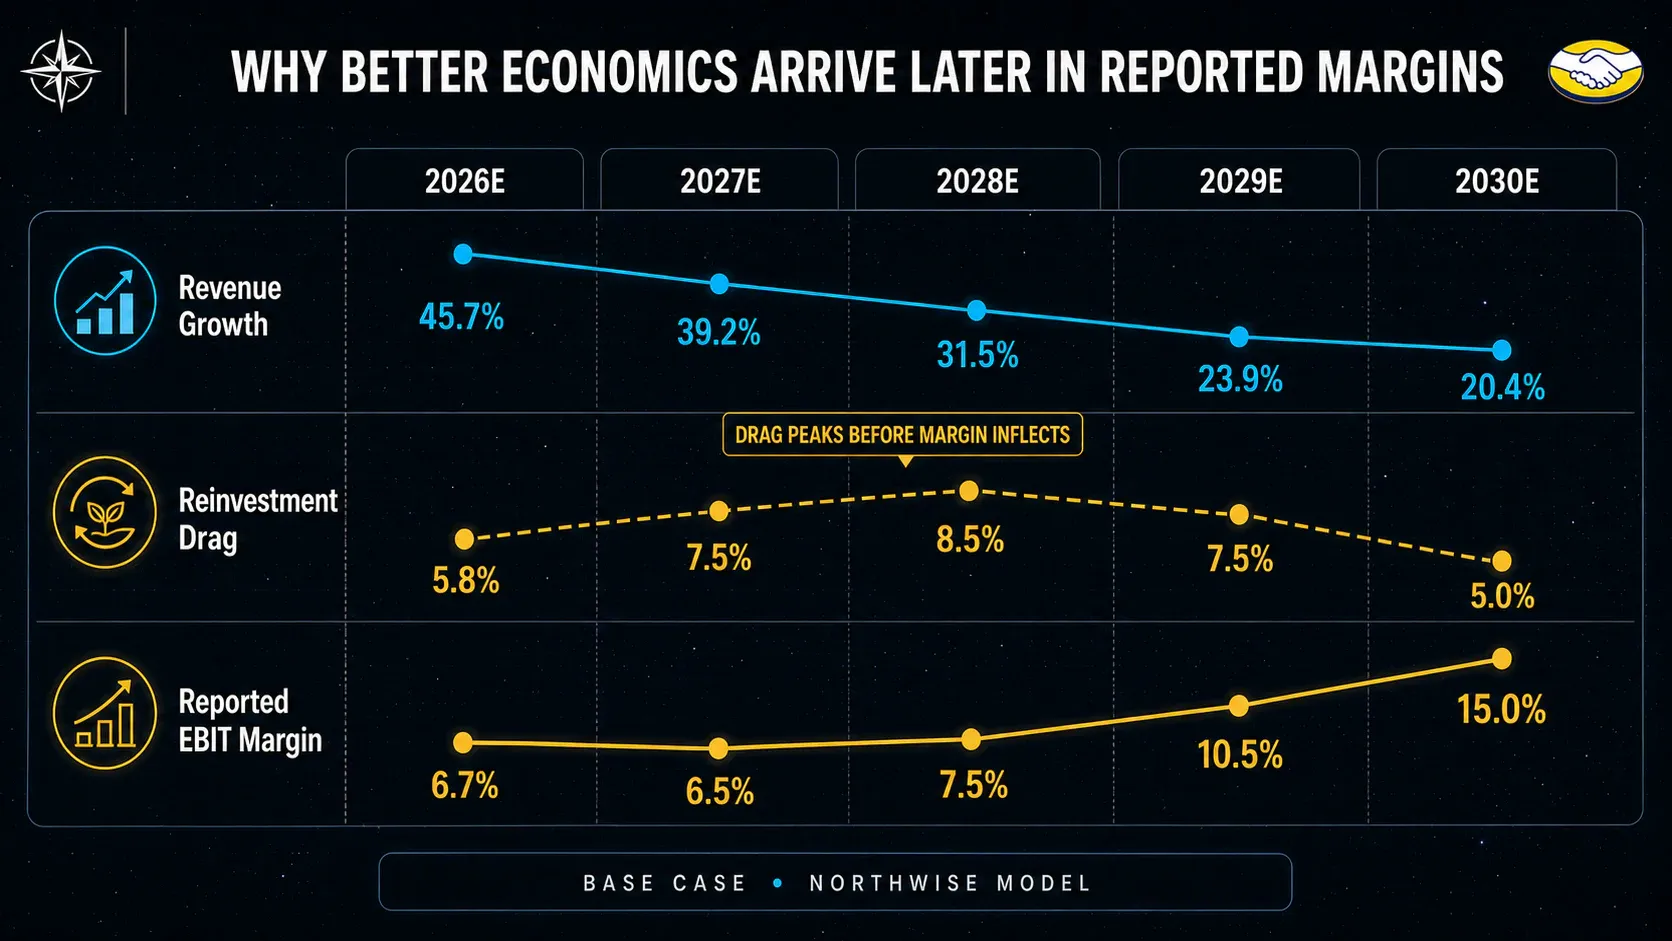
Treating the drag as one number would make it a plug. It is built from six identified programs.
Growth investment drag (% of revenue) | 2026E | 2027E | 2028E | 2029E | 2030E |
|---|---|---|---|---|---|
Free shipping and logistics | 1.6% | 1.8% | 1.8% | 1.5% | 1.0% |
Card issuance and credit | 1.8% | 2.5% | 2.8% | 2.2% | 1.3% |
First-party and cross-border | 0.8% | 1.2% | 1.4% | 1.3% | 1.0% |
Acquiring and devices | 0.5% | 0.6% | 0.7% | 0.7% | 0.5% |
Seller, PIX and loyalty incentives | 0.5% | 0.6% | 0.6% | 0.6% | 0.4% |
AI, product and new categories | 0.6% | 0.8% | 1.2% | 1.2% | 0.8% |
Total | 5.8% | 7.5% | 8.5% | 7.5% | 5.0% |
Total ($mm) | 2,442 | 4,395 | 6,552 | 7,164 | 5,752 |
Card issuance is the largest single line and peaks in 2028, matching the card contribution trough identified earlier. Free shipping runs a close second and peaks earlier, as the logistics investment front-loads while the credit investment follows the issuance curve.
AI and new categories triple in dollar terms between 2026 and 2029, which is the least measurable and most forward-looking of the six. It covers model inference cost, shopping agents, product development, and category experiments including pharmacy.
The fade from 8.5% in 2028 to 5.0% in 2030 is what produces the reported margin recovery. The fade is an assumption about management behavior and the one most likely to be wrong in either direction.
The bear case that has to be taken seriously
The strongest argument against this thesis is not that the credit book will blow up. It is that the drag never fades.
A company that reinvests every efficiency gain into the next growth layer, in a competitive market where competitors are doing the same thing, may find that the investment is not discretionary at all. Free shipping thresholds tend not to go back up. Take-rate discounts tend not to get reversed. If the drag is a permanent competitive cost being described as a temporary investment, then harvestable margin is a fiction and reported margin is the only real number.
The argument cannot be dismissed, and it is not the Base case for a specific reason. The drag has moved before, and it has moved with the growth rate. It ran at 1.9% of revenue in 2025 when growth was slower. It rises through 2028 as the card program peaks, and the card program is the one component with a mechanical end, as a book that stops doubling stops creating immature cohorts at the same rate.
The Bear and Stress scenarios both carry a permanently elevated drag, and the monitoring framework treats a 2029 drag that fails to decline as a thesis-level warning.
Part XI: The Consolidated Model and Owner Cash Flow
How the forecast is built
The forecast runs in one direction. Physical and behavioral drivers first, meaning buyers, frequency, parcels, payment volume, balances, and loan balances. Revenue follows from those drivers, engine by engine. Harvestable margin applies to consolidated revenue, growth investment is subtracted explicitly, and reported EBIT falls out.
Non-operating results and tax produce net income. Share count is held nearly flat with no buyback assumed. D&A, capital expenditure, working capital, and incremental sponsor credit capital produce normalized free cash flow to equity. Valuation happens last, after the gate, and never determines any operating input.
Revenue by engine
Revenue ($mm) | 2025A | 2026E | 2027E | 2028E | 2029E | 2030E |
|---|---|---|---|---|---|---|
Commerce services incl. Ads | 12,750 | 17,727 | 24,894 | 33,147 | 40,890 | 48,015 |
Commerce product sales | 3,545 | 5,717 | 8,129 | 11,049 | 14,312 | 18,541 |
Financial services and income | 6,678 | 8,744 | 11,585 | 15,330 | 19,236 | 23,947 |
Credit revenue | 5,858 | 9,851 | 13,920 | 17,477 | 20,996 | 24,446 |
Fintech product sales | 63 | 69 | 75 | 82 | 90 | 100 |
Total revenue | 28,894 | 42,107 | 58,602 | 77,085 | 95,523 | 115,049 |
Revenue growth | n/a | 45.7% | 39.2% | 31.5% | 23.9% | 20.4% |
The growth curve is the non-consensus part. Deceleration from 45.7% to 20.4% across five years is a long fade rather than a cliff, and it assumes the company is still growing at 20% in 2030 on a $95 billion base.
Credit revenue reaching $24.4 billion, or 21% of the total, is the other feature to note. Roughly a fifth of MercadoLibre's revenue in 2030 comes from a business that carries loss provisions and requires capital, which is exactly why the valuation section refuses to apply one multiple to the whole company.
Earnings and per-share outcomes
Consolidated ($mm except per share) | 2025A | 2026E | 2027E | 2028E | 2029E | 2030E |
|---|---|---|---|---|---|---|
Reported EBIT | 3,207 | 2,821 | 3,809 | 5,781 | 10,030 | 17,257 |
EBIT margin | 11.1% | 6.7% | 6.5% | 7.5% | 10.5% | 15.0% |
Non-operating result | (100) | (168) | (250) | (300) | (350) | (400) |
Effective tax rate | 30.0% | 27.0% | 27.0% | 26.5% | 26.0% | 25.5% |
Net income | 1,997 | 1,937 | 2,598 | 4,029 | 7,163 | 12,559 |
Diluted shares (M) | 50.7 | 50.8 | 50.8 | 50.9 | 50.9 | 51.0 |
Diluted EPS | $39.39 | $38.16 | $51.14 | $79.23 | $140.73 | $246.25 |
EPS growth | n/a | (3.1%) | 34.0% | 54.9% | 77.6% | 74.9% |
Earnings per share fall in 2026 and then compound at more than 50% annually from 2027 onward. The shape of that row is the entire investment argument.
The near-term decline is what makes the stock difficult to hold, and it is a direct consequence of the reinvestment decision. The back-end acceleration is what makes it worth holding, and it depends on the margin bridge behaving as modeled.
Share count is essentially flat at 51.0 million by 2030, with no buyback assumed. A company generating $11 billion of free cash flow in 2030 with 51 million shares outstanding has obvious capital return capacity, and none of it appears here. That is a deliberate omission, not an oversight.
Normalized free cash flow
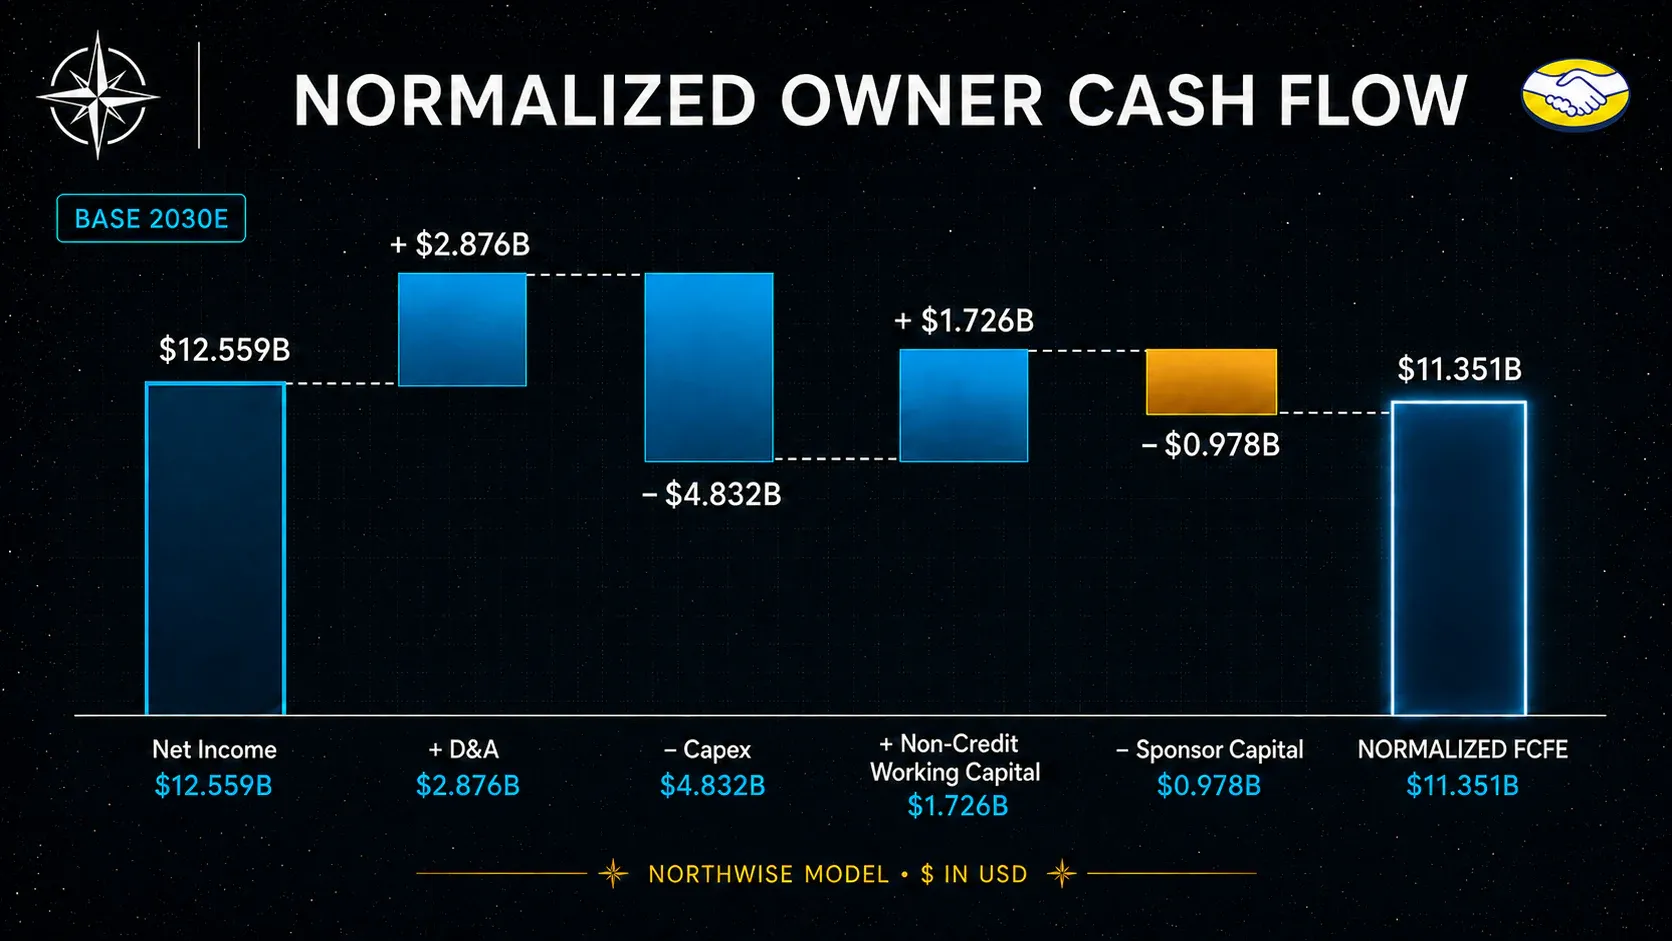
Normalized FCFE | 2026E | 2027E | 2028E | 2029E | 2030E |
|---|---|---|---|---|---|
Normalized FCFE ($mm) | (118) | 1,104 | 2,044 | 5,537 | 11,351 |
FCFE margin | (0.3%) | 1.9% | 2.7% | 5.8% | 9.9% |
Cumulative 2026-2030 ($mm) | (118) | 986 | 3,031 | 8,567 | 19,918 |
Cumulative normalized free cash flow across the forecast is $19.9 billion, of which $11.4 billion arrives in the final year. Cash generation is heavily back-loaded, and any investor underwriting this needs to be comfortable with four years of very modest owner cash flow before the curve turns.
The back-loading is the honest cost of the strategy. A company reinvesting 5% to 8.5% of revenue while funding a lending book that requires parent capital is not going to produce meaningful free cash flow in the middle of that program, and pretending otherwise requires ignoring one or both of those charges.
Part XII: Scenarios
Four operating paths
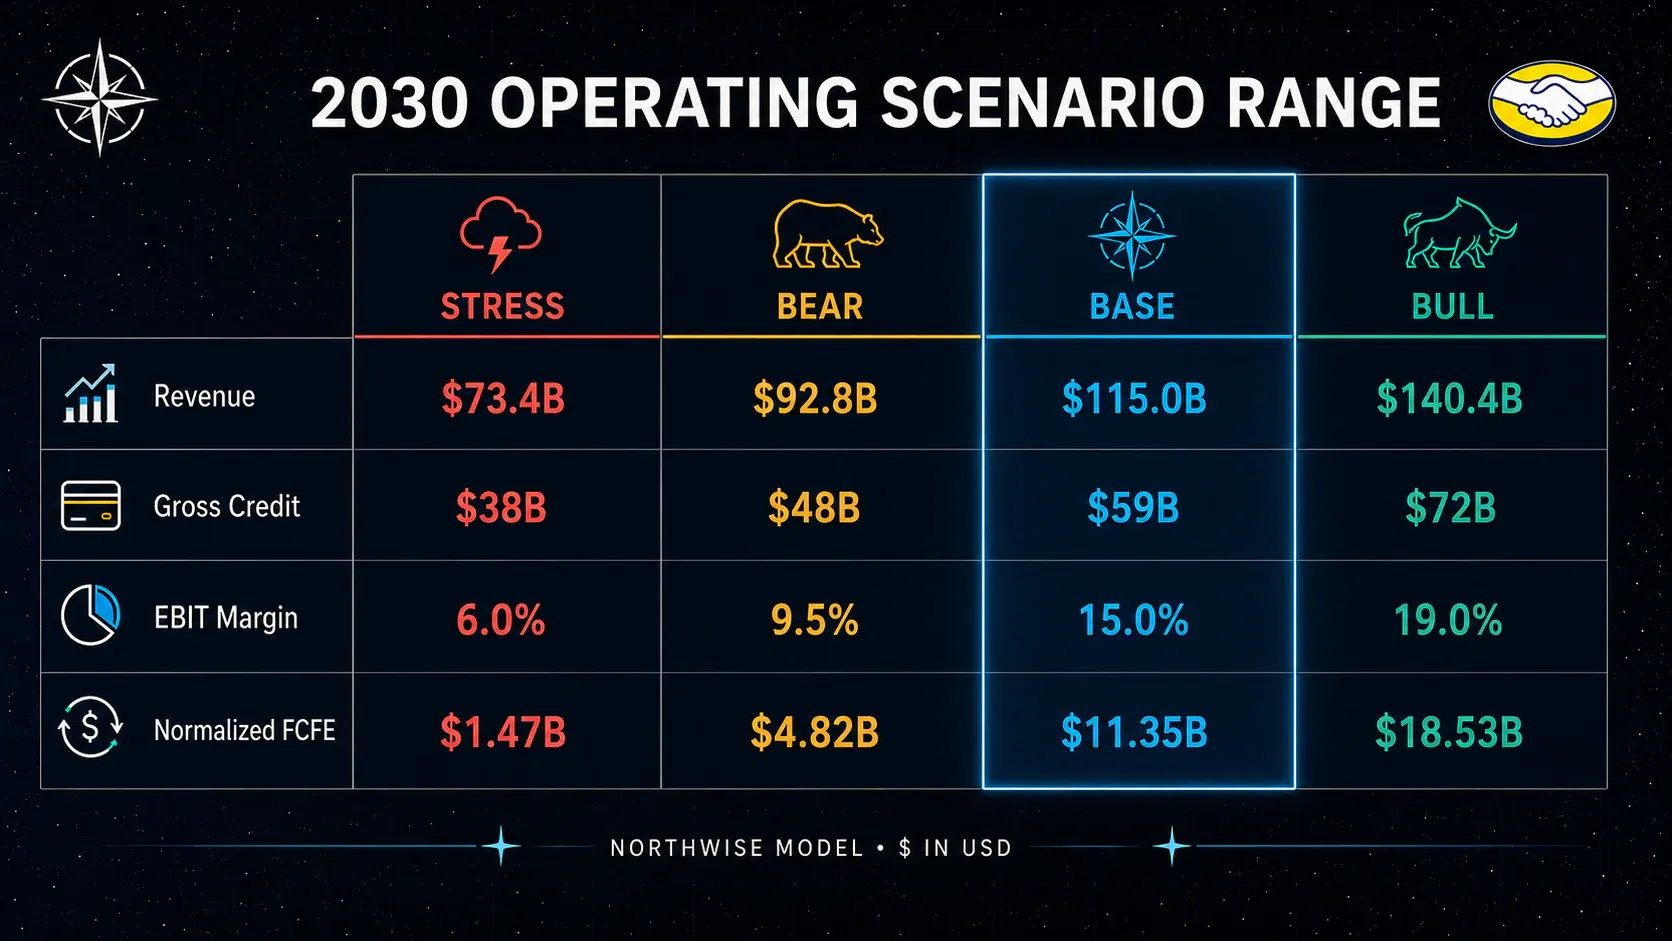
Scenario differences here are explicit across revenue, margin, cash conversion, and credit economics. No scenario is a percentage adjustment to another.
2030E outcome | Stress | Bear | Base | Bull |
|---|---|---|---|---|
Revenue ($mm) | 73,363 | 92,752 | 115,049 | 140,357 |
2027-2030 revenue growth path | 23% to 10% | 32% to 15% | 39% to 20% | 44% to 30% |
Reported EBIT margin | 6.0% | 9.5% | 15.0% | 19.0% |
EBIT ($mm) | 4,402 | 8,811 | 17,257 | 26,668 |
Net income ($mm) | 2,770 | 6,062 | 12,559 | 19,794 |
Diluted EPS | $54.11 | $118.63 | $246.25 | $388.89 |
Normalized FCFE ($mm) | 1,467 | 4,823 | 11,351 | 18,527 |
Ending gross credit ($mm) | 38,000 | 48,000 | 59,000 | 72,000 |
Card NIMAL | 8% | 14% | 19% | 24% |
Blended NIMAL | 15% | 19% | 22.8% | 27% |
Diluted shares (M) | 51.2 | 51.1 | 51.0 | 50.9 |
Stress is a regulatory and credit event, not a demand event. Brazilian lending curbs are enacted, card losses run ahead of plan, and MercadoLibre retrenches the credit book to $38 billion. Commerce keeps growing, revenue still reaches $73 billion, and reported margin sits at 6% as balance-sheet intensity absorbs the value the platform creates. Normalized free cash flow is negative for three consecutive years before turning modestly positive.
Bear is the scenario that should be hardest to dismiss. The platform wins operationally, revenue reaches $92.8 billion, and card economics never fully validate the premium narrative. Card NIMAL reaches 14% instead of 19%, blended NIMAL stalls at 19%, margin reaches 9.5%, and the company ends the forecast earning less than half the Base EPS.
Nothing breaks. The premium simply is not earned.
Base holds revenue durability, the delayed margin harvest, and card cohorts seasoning on the disclosed pattern. Growth stays above 20% through 2030 and profitability arrives primarily in the last two years.
Bull is a compounding case and not a heroic one. Pago primacy, advertising penetration, logistics density, and mature card cohorts reinforce one another faster than Base, revenue reaches $140 billion at 19% margin, and card NIMAL reaches 24%. It requires no new business line, no pharmacy revenue, and no acquisition.
What separates them
The four paths differ on three variables, and everything else follows.
Revenue durability is the first. The spread between Stress at 10% terminal growth and Bull at 30% produces a $67 billion revenue gap by 2030, which is larger than the company's entire 2025 revenue base.
Card economics are the second. Card NIMAL between 8% and 24% moves 2030 card NIMAL dollars by roughly $5.4 billion of pre-tax profit on the Base average balance, which flows almost directly to EPS.
Margin realization is the third and it is partly a consequence of the first two. A company growing slower needs less reinvestment, and a company with worse credit economics has less to reinvest.
Note what does not separate them. Share count moves by less than 1% across all four scenarios, given that MercadoLibre funds itself from operations and dedicated credit facilities instead of equity issuance. Dilution risk, which dominates the outcome distribution for many high-growth companies, is close to irrelevant here.
Part XIII: Risks, Red Team, and the Monitoring Dashboard
The bear case, argued properly
A risk section that lists ten concerns and dismisses them is worth nothing. These are the arguments that would actually change the answer.
Credit is structurally riskier than the bulls admit. The book is 62% credit cards by 2030, extended to a consumer base in markets with limited credit history infrastructure, at yields that imply expected losses well above developed-market norms. Reported over-90-day non-performing loans ran at 18.7% in Q2 2026. The bull response is that these losses are priced in and the spread is what matters, and that response is correct only if the loss assumptions hold through a genuine consumer downturn, which this book has not yet experienced at scale.
Reported margins may stay low much longer than modeled. The entire back half of the earnings curve depends on the growth investment drag falling from 8.5% to 5.0% of revenue. If competition makes free shipping and take-rate discounts permanent rather than discretionary, the harvest never arrives and the company is a low-margin business that has been describing itself as a high-margin business in waiting.
External funding could become less favorable. The Base case moves dedicated funding share from 65% to 78%, which requires continued access to Brazilian and Mexican local capital markets on reasonable terms. A funding market disruption would push the burden back onto parent capital, and the sponsor capital charge scales directly with that share.
Regulation targets the exact products being scaled. Brazil is weighing tighter consumer-credit rules as household debt stress mounts. Caps on rates, restrictions on card issuance, or higher capital requirements would hit the fastest-growing part of the portfolio directly.
Competition may force perpetual reinvestment. Shopee, Amazon, Nubank, and regional players are all spending. A market where every participant subsidizes shipping and discounts take rates is a market where nobody harvests.
Argentina normalization drags consolidated optics. Direct contribution from Argentina is roughly flat in dollars from 2025 to 2030 while its margin falls from 41.6% to 20.0%. Argentina is a real headwind embedded in every consolidated number.
The market may not pay a premium multiple forever. MercadoLibre has traded at a premium for most of its public life. Valuation compression is a risk that operates independently of anything the company does.
The Northwise response
These risks are real and they are not symmetric with the thesis.
The credit concern is the strongest and it is addressed by structure and not by assertion. Modeling four products separately, charging each for its own losses and funding, quarantining the ecosystem halo, charging the parent for sponsor capital, and displaying undrawn commitments alongside funded balances is what an honest version of this analysis looks like. The Stress case exists to show what happens when the credit concern is correct, and it still produces a company with $73 billion of revenue.
The margin concern is the one that calls for ongoing monitoring in place of a settled answer. The forecast takes a position, and the position is falsifiable on a specific timeline.
What the risks do not do is invalidate the operating stack. Buyers, frequency, parcels, payment volume, and balances are all compounding, and none of the bear arguments above requires those to stop.
What to monitor
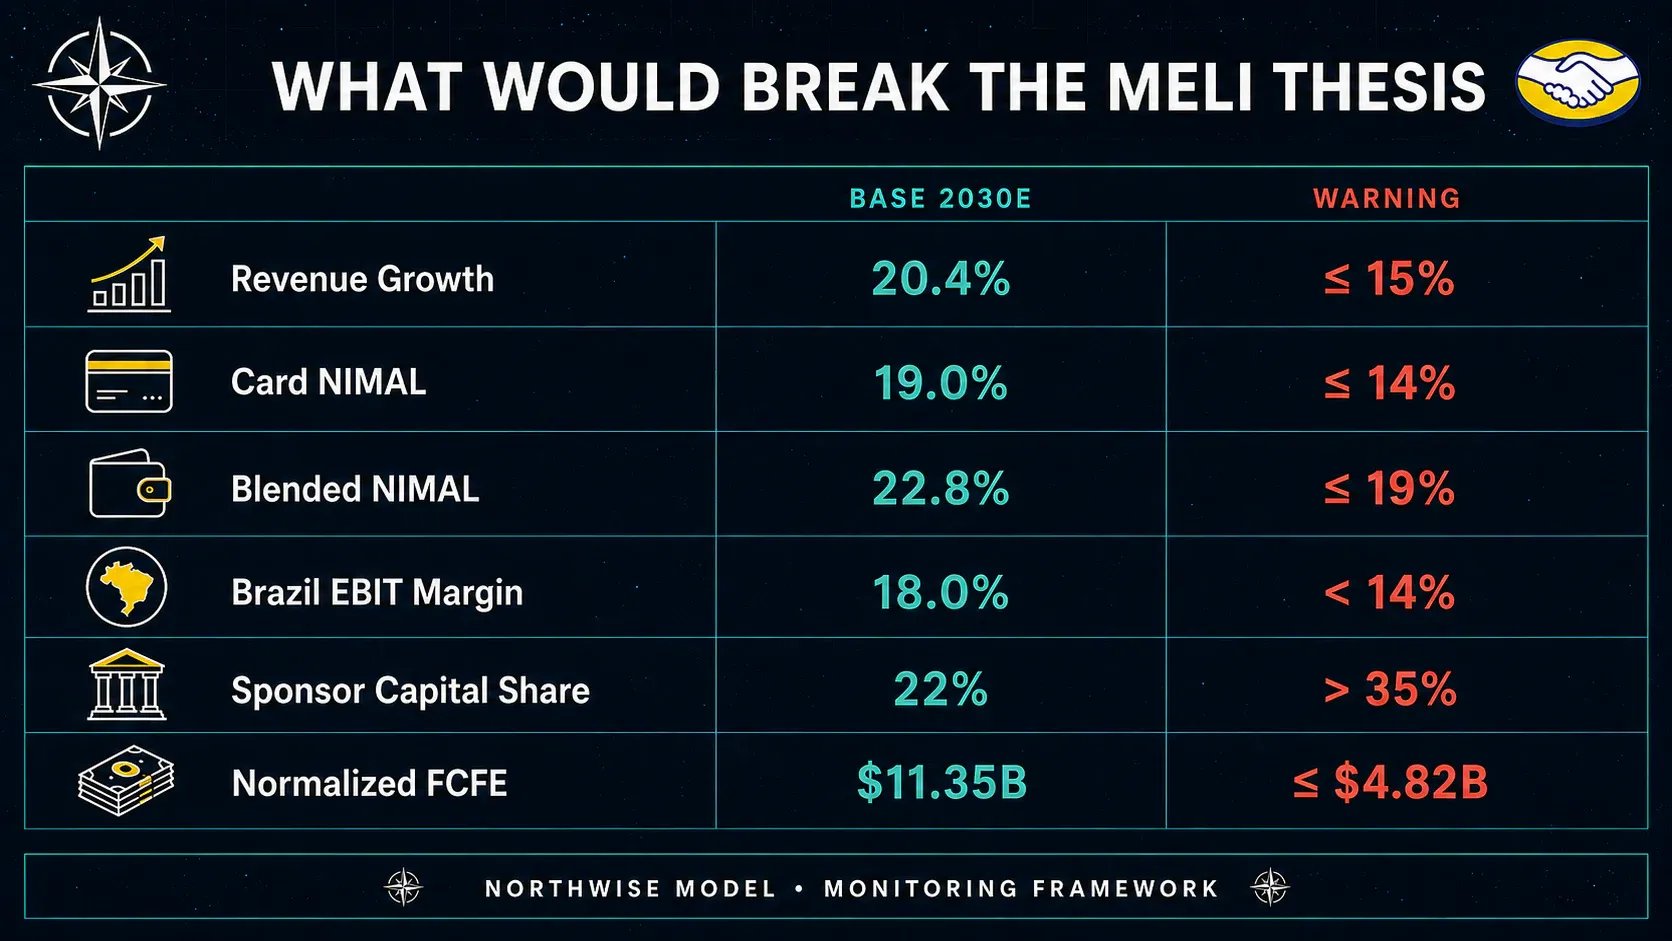
Metric | Base requirement | Early warning |
|---|---|---|
Revenue growth | 39% in 2027, 31.5% in 2028 | Buyer growth and TPV growth fall together |
Card NIMAL | 7% in 2028, 19% in 2030 | Below 10% through 2028 |
Blended NIMAL | Recovers from 17.6% in 2027 | Compression continues past 2028 |
Reported EBIT margin | 6% to 8% through 2028, 15% in 2030 | Drag fails to decline in 2029 |
Dedicated credit funding | 74% by 2028, 78% by 2030 | Parent share remains above 35% |
Brazil direct margin | 18% by 2030 | Below 14% exiting 2028 |
Allowance / gross receivables | Falls as mix seasons | Stays above 24% after 2028 |
Normalized FCFE | Positive from 2027, $11.4B in 2030 | Negative through 2028 |
Ads penetration | 3.8% of GMV by 2030 | Stalls below 3.0% |
Sponsor capital | Incremental need falls below $1.0B by 2030 | Rises instead of falling |
The thesis should be tracked like an underwriting file, not defended like a position. Any two of those warnings triggering together moves the company from Base toward Bear, and the credit warnings are the ones that move it fastest.
Part XIV: The Free Model Ends Here
What the reader now has
Everything above is a complete operating analysis of MercadoLibre.
The six-engine structure and how the engines reinforce one another. The Q2 2026 results and what each recent development changes. The commerce build from buyers through frequency to GMV, and the three-layer monetization stack including a reconstructed advertising line.
Logistics density and where the cost savings actually go. Payment volume, balances, and non-credit fintech revenue with every monetization rate declining. The credit book broken into four products, each charged for its own losses and funding.
The card maturation curve, the aggregate card contribution path, and the quarantined ecosystem halo. Dedicated funding, sponsor capital, undrawn commitments, and shadow capital. Geography with a full reconciliation to consolidated EBIT.
The margin bridge separating harvestable earnings power from reported margin, with all six investment programs itemized. The consolidated income statement, EPS, and normalized free cash flow after sponsor capital. Four operating scenarios, the full red team, and the monitoring dashboard.
The operating question is closed. What MercadoLibre is building, how each engine scales, what the credit book actually earns, what it costs to fund, and what could break it are all on the table.
The remaining question is different in kind. It concerns what each of those outcomes is worth to one share.
Northwise Premium
Everything below this line is decision-useful valuation output.
Premium members receive the full valuation architecture across earnings, normalized cash flow, and sum-of-the-parts, the four scenario price targets with the multiples and segment economics behind each, the probability weighting, the probability-weighted 2030 value, a separate discounted cash flow cross-check on current value, expected total return and expected CAGR at the current price, the required-return ladder showing the maximum entry price for each threshold, the sensitivity tables for card NIMAL and margin realization, and the formal Northwise rating.
Premium members also receive the complete MercadoLibre 2030 model as a downloadable Excel workbook. Every driver is editable and every output is linked. Anyone who disagrees with the 19% card NIMAL, the 30x terminal multiple, the 50% Base probability, the 78% dedicated funding share, or the shape of the margin bridge can change the input and watch the target recalculate from buyers and parcels all the way through to the return ladder.
The valuation section follows.
Northwise Premium
Choose how to continue with Northwise
Join Northwise Premium
Unlock the rest of this report, its complete valuation, the downloadable model, portfolios, and action framework.
Join Northwise PremiumCreate a Free Account
Continue across Free Northwise research, follow companies, save reports, and receive updates.
Create a Free Account
MELI Stock Forecast
MELI Stock Forecast with a clear view of MercadoLibre’s ecosystem across ecommerce, logistics, fintech, credit, ads, and long term drivers.

MercadoLibre Stock Forecast 2030
MercadoLibre Stock Forecast 2030 explores why MELI is more than ecommerce. It's building Latin America's vertically integrated digital backbone.

Nebius Asset-Light Business Model: The Cloud Someone Else Pays to Build
How Nebius can earn cloud fees on partner-owned GPUs. Explore owner economics, Palantir, cash flow and our 2030 asset-light scenarios in this free report.
Northwise Portfolios
See how the research becomes real decisions
Reader discussion
Discuss the research
Premium access is required to join this report's discussion.
Join Northwise Premium
No comments yet. Start a thoughtful discussion.