
CIFR Stock Forecast 2030

CIFR Stock Forecast 2030 models Cipher Digital’s AI data center ramp, contracted HPC capacity, dilution risk, and fair value.
In this article
A full CIFR stock forecast 2030, focused on contracted HPC capacity, energized MW, project financing, dilution, and 2030 fair value.
1. Executive Summary
1.1 Core Investment Judgment
Cipher Digital has crossed an identity threshold. The company that filed Q1 2026 earnings is not the same company that operated under the Cipher Mining name a year ago. It now holds 907 MW of operating and contracted capacity, $11.4B of contracted lease revenue, and a 3.3 GW development pipeline. The asset base is substantial, the contracts are signed, and the construction work is visibly progressing.
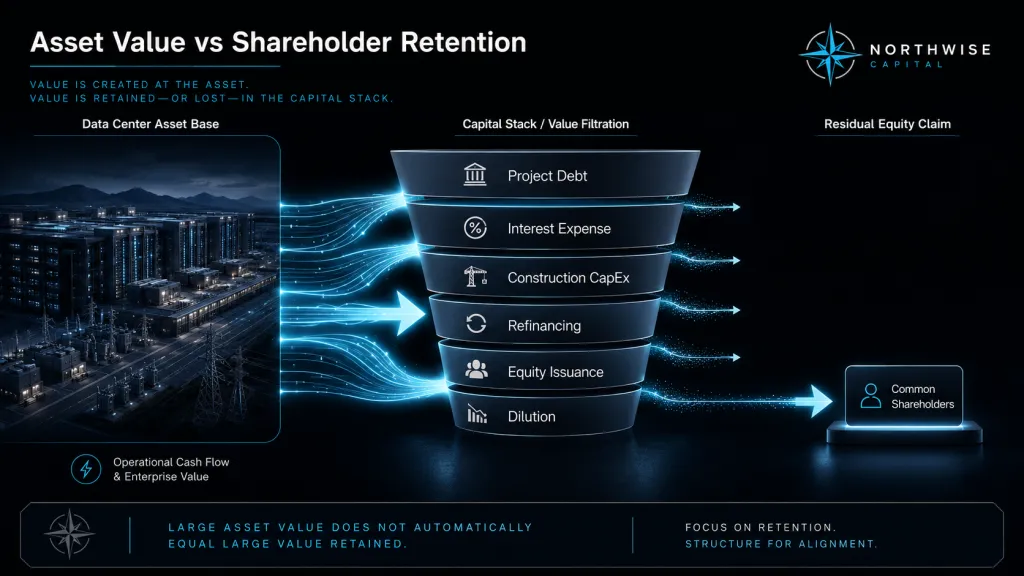
The investment question has moved with it. The debate is no longer whether AI infrastructure demand exists, whether powered land is scarce, or whether hyperscalers need third-party capacity. Those questions are settled. The remaining question is narrower and harder. How much of the value created by this buildout reaches common shareholders after project debt, construction CapEx, interest expense, refinancing cycles, and equity issuance take their share.
CIFR is best understood as a residual equity claim on a capital-intensive infrastructure platform. The platform is real. The residual is uncertain.
1.2 What Changed After Q1 2026
Three things changed materially after the Q1 2026 disclosure.
First, the third hyperscale lease was sized and located. Stingray is 100 MW in Andrews County, Texas, fully approved, targeting Q4 2026 energization. That brings total contracted HPC capacity to 700 MW across three sites and three tenants.
Second, contracted NOI is now disclosed at the consolidated level. Management framed the three executed leases as generating $787M of average annualized contracted NOI from October 2026 through September 2036, with $892M of contracted NOI in 2035. That disclosure replaces guesswork about lease economics with an anchored number.
Third, the development pipeline is no longer described in vague gigawatt terms. Reveille and Ulysses sit in the 2027 window. McLennan, Mikeska, Milsing, and Colchis represent 2.5 GW of 2028 to 2029 capacity. The pipeline carries timing risk, particularly through ERCOT Batch 0, but the schedule is now legible.
1.3 Why CIFR Is No Longer Primarily a Bitcoin Mining Story
Odessa still operates 207 MW of Bitcoin mining capacity at 11.6 EH/s. It generated 346 BTC in Q1 2026 at roughly $0.028/kWh. It is profitable and it provides liquidity during construction.
It is also winding down. Management said it expects mining to be removed from the company narrative by year-end 2027 at the latest, possibly sooner. Odessa carries optionality as a future HPC conversion site if hyperscaler interest and PPA terms align, but the mining business itself is no longer the center of the equity case.
By 2030, Bitcoin mining contributes effectively nothing to the operating model. Anyone underwriting CIFR on Bitcoin price exposure is misreading the company.
1.4 The Central Debate: Asset Value Versus Shareholder Retention
Gross asset value at full buildout is large. A 4 GW infrastructure portfolio leased to investment-grade hyperscalers on 10 to 15 year terms produces meaningful contracted NOI. The strategic value of powered land, completed interconnection, and operating data centers is significant in a capacity-constrained market.
That value is not what common shareholders own. They own the residual after project-level debt, future debt issuance, equity dilution to fund pipeline conversion, and operating expenses are subtracted.
The buildout requires substantial new project debt and some new equity. The exact ratio depends on lease quality, tenant credit, project financing markets, and the share price at the time of each issuance. Strong execution and a strong stock price compound favorably. Weak execution and a weak stock price compound the other way. This asymmetry is the model's most important variable.
1.5 Summary of Scenario Conditions
The model evaluates three scenarios. Each scenario reflects a different combination of pipeline conversion, lease pricing, project financing terms, and dilution.
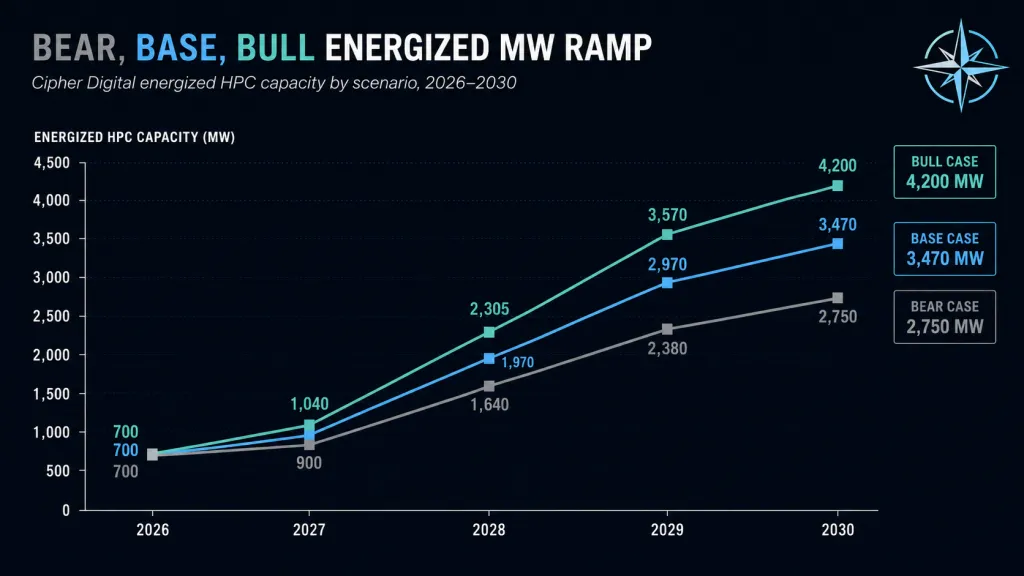
The bear case assumes partial pipeline conversion. The current contracted base operates as planned, Reveille and Ulysses come online, and one to two of the larger 2028 to 2029 sites convert on schedule. Lease pricing holds but does not improve materially. Project financing is available but at less favorable terms, and equity must be issued at moderate prices to bridge the buildout. The company exits 2030 at roughly 2.75 GW.
The base case assumes the contracted book operates as planned, the 2027 pipeline energizes on schedule, and the majority of 2028 to 2029 sites convert successfully. Lease pricing on new sites prices above the current contracted average due to scarcity and timing. Project financing remains accessible at constructive terms. The company exits 2030 at roughly 3.47 GW.
The bull case assumes nearly the full 4.2 GW grid portfolio converts. Premium pricing persists on new sites. Project financing is abundant and cheap. Equity issuance is minimal. The company exits 2030 at 4.2 GW with the lowest share count growth of any scenario.
The cases differ in MW, in pricing, in financing terms, and in dilution. The combined effect on per-share value is non-linear. That non-linearity is the reason the model produces a wide outcome range.
Table of Contents
1. Executive Summary
1.1 Core Investment Judgment
1.2 What Changed After Q1 2026
1.3 Why CIFR Is No Longer Primarily a Bitcoin Mining Story
1.4 The Central Debate: Asset Value Versus Shareholder Retention
1.5 Summary of Scenario Conditions
2. Cipher Digital Today
2.1 From Cipher Mining to Cipher Digital
2.2 What the Company Actually Does Now
2.3 Why the Rebrand Matters
2.4 What CIFR Is Not: Not Nebius, Not CoreWeave, Not a Pure Miner
2.5 The Correct Valuation Lens: Lease-Backed AI Infrastructure Developer
3. The AI Infrastructure Problem Cipher Solves
3.1 Why Power Is the Binding Constraint
3.2 Why Hyperscalers Need Third-Party Capacity
3.3 Speed to Market, Interconnection, and Powered Land Scarcity
3.4 Why West Texas Has Become Strategically Relevant
3.5 Why PJM Diversification Matters
4. Contracted Capacity and Lease Book
4.1 Current Operating and Contracted Capacity
4.2 Barber Lake: Fluidstack and Google
4.3 Black Pearl: AWS
4.4 Stingray: The Third 100 MW Hyperscale Lease
4.5 Contracted Revenue and NOI Profile
4.6 Why Contracted NOI Is More Useful Than Headline MW
5. Construction Execution and Procurement
5.1 Barber Lake Construction Progress
5.2 Black Pearl Conversion From Mining to HPC
5.3 Stingray Mobilization and Q4 2026 Target
5.4 Equipment Procurement Risk
5.5 Why Construction Timing Determines Revenue Recognition
6. Development Pipeline and Energization Path
6.1 Reveille and Ulysses as 2027 Proof Points
6.2 McLennan, Mikeska, Milsing, and Colchis
6.3 ERCOT Batch 0 and Interconnection Risk
6.4 Barber Lake Expansion Optionality
6.5 Final Site-by-Site Base Case Energization Timeline
7. Bitcoin Mining as a Funding Bridge
7.1 Odessa’s Current Role
7.2 Why Mining Is No Longer the Core Thesis
7.3 Mining Cash Flow Through 2027
7.4 Odessa HPC Conversion Optionality
7.5 Why Bitcoin Upside Helps but Should Not Carry the Thesis
8. Business Model Economics
8.1 Revenue Per MW and NOI Per MW
8.2 Contracted NOI Versus Future Pipeline Economics
8.3 CapEx Per MW
8.4 Maintenance and Refresh Capital
8.5 SG&A and Corporate Expense Layer
8.6 Adjusted Cash EBITDA Formula
9. Capital Structure and Funding Bridge
9.1 Existing Debt and Liquidity
9.2 Restricted Cash and Project-Level Financing
9.3 Why Nonrecourse Financing Matters
9.4 Why Project Debt Still Matters to Equity
9.5 Funding Bridge Across Bear, Base, and Bull Cases
9.6 Dilution Assumptions by Scenario
9.7 Why Shareholder Retention Is the Model’s Core Variable
10. Full Operating Model
10.1 Modeling Methodology
10.2 Bear Case
10.3 Base Case
10.4 Bull Case
10.5 Depreciation and Interest Expense Check
10.6 Why EV/Cash EBITDA Is the Primary Valuation Method
11. Risk Assessment
11.1 Construction Execution Risk
11.2 ERCOT and Grid Interconnection Risk
11.3 Financing and Refinancing Risk
11.4 Dilution Risk
11.5 Customer Concentration and Tenant Power
11.6 Lease Pricing Compression Risk
11.7 Depreciation, Interest, and GAAP Earnings Risk
11.8 Bitcoin Wind-Down and Transition Risk
11.9 Compute Ownership Risk
11.10 Behind-the-Meter Generation Risk
12. Valuation Framework
12.1 Why P/E Is Not the Right Primary Tool
12.2 EV/Cash EBITDA Methodology
12.3 Bear Valuation
12.4 Base Valuation
12.5 Bull Valuation
12.6 Scenario Probability Weighting
12.7 Weighted 2030 Fair Value
13. Present Value Framework
13.1 Discount Rate Selection
13.2 Present Value at 10%, 12%, 15%, and 18%
13.3 Interpretation Versus Current Share Price
13.4 What Return Hurdle CIFR Clears
14. Northwise Positioning
14.1 What the Model Says
14.2 Where CIFR Fits in an AI Infrastructure Portfolio
14.3 Position Sizing Implications
14.4 Buy, Hold, Trim, and Sell Zones
14.5 What Would Make Us More Bullish
14.6 What Would Break the Thesis
15. Conclusion
15.1 The Final Investment Judgment
15.2 Why the Opportunity Exists
15.3 The One Variable Investors Must Watch Most Closely
15.4 Final Northwise Synthesis
2. Cipher Digital Today
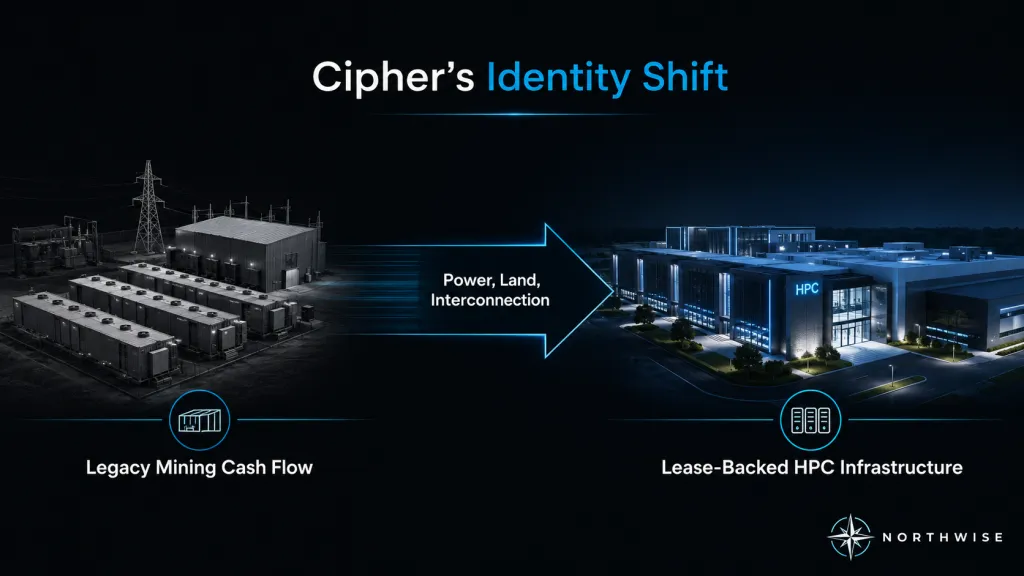
2.1 From Cipher Mining to Cipher Digital
The rebrand is not cosmetic. Cipher Mining built itself as a low-cost Bitcoin mining operator on cheap West Texas power. Cipher Digital is being built as a hyperscale data center developer that happens to retain a single legacy mining site. The skill set required for each is different. The capital structure required is different. The customer is different. The contract duration is different.
The company's senior management has framed 2026 as the year of execution. The phrase used on the Q1 call, "Built for Hyperscale," is meant to describe organizational capability rather than positioning. In-house power origination, engineering, construction management, and operations are presented as the foundation of a vertically organized infrastructure developer.
That framing is consistent with the contracts the company has signed. Hyperscalers do not lease 300 MW of capacity on 10 to 15 year terms from operators they cannot evaluate as long-term partners. The signed lease book is, in itself, a credentialing event.
2.2 What the Company Actually Does Now
Cipher originates power, secures sites, designs and builds data center infrastructure, and leases the completed facilities to hyperscale customers under long-duration contracts. It also operates one Bitcoin mining facility at Odessa, which generates cash flow during the buildout phase.
The leasing model is colocation. Cipher provides the building, the power infrastructure, the cooling, and the operational support. The tenant brings its own compute. This distinction matters for how the business is valued and how risk is allocated. The tenant takes the hardware lifecycle risk. Cipher takes the construction risk and the long-term lease counterparty risk.
The signed leases are with Fluidstack and Google at Barber Lake, AWS at Black Pearl, and a third hyperscale tenant at Stingray. The tenants are creditworthy. The lease terms are long. The contracted revenue is disclosed.
2.3 Why the Rebrand Matters
A name change is normally a minor signal. In this case, it carries information.
The mining business is winding down. Public communication, investor relations, and capital allocation are being reorganized around the data center business. The board and management are signaling to debt and equity markets that the company should be valued as an infrastructure developer, not as a Bitcoin proxy. Project-level financing markets respond to this signal. So do hyperscale procurement teams.
The rebrand also has implications for benchmark comparison. As Cipher Mining, the natural peer set was Riot, Marathon, CleanSpark, and other public miners. As Cipher Digital, the relevant peer set shifts toward Applied Digital, Iris Energy, CoreWeave on the cloud side, and traditional data center operators on the infrastructure side. The valuation framework follows from peer set selection. A company valued as a miner is not valued as a developer.
2.4 What CIFR Is Not: Not Nebius, Not CoreWeave, Not a Pure Miner
The risk in covering Cipher is that readers map it onto better-known names. It is not Nebius. Nebius operates a vertically integrated AI cloud, sells inference and training capacity directly, and owns the compute. Cipher does not own the compute and does not sell cloud services.
It is not CoreWeave. CoreWeave owns large fleets of GPUs and operates as a specialized cloud provider with revenue tied to compute utilization. Cipher's revenue is rent under long-duration leases, not GPU rental.
It is not a pure miner. The mining footprint is a single 207 MW site that is winding down within two years.
It is not a generic data center REIT. The asset concentration, single-tenant lease structure, and AI-purpose-built design distinguish it from diversified colocation operators.
The closest framing is a lease-backed AI infrastructure developer with residual mining cash flow and major capital structure sensitivity. That framing should govern how the company is modeled and valued.
2.5 The Correct Valuation Lens: Lease-Backed AI Infrastructure Developer
Because the asset base is heavy, the contracts are long, and the buildout is debt-financed, traditional earnings multiples are not the right primary tool. The capital structure produces large depreciation and interest expense during the buildout phase. GAAP earnings will look weaker than the underlying cash economics for several years.
The cleaner lens is enterprise value relative to cash EBITDA, with cash EBITDA defined as project NOI minus SG&A minus a maintenance and refresh reserve. The equity value is then the enterprise value minus net debt, divided by fully diluted share count. This approach captures the economics of the operating platform while explicitly accounting for the debt and dilution that accumulate during construction.
3. The AI Infrastructure Problem Cipher Solves
3.1 Why Power Is the Binding Constraint
The AI infrastructure buildout is constrained by power, not by capital, not by chips, and not by demand. Hyperscalers can purchase compute. They can raise capital. They can sign long-duration revenue commitments. What they cannot easily do is energize hundreds of megawatts of contiguous, interconnected, deliverable power on the timelines their AI workloads require.
This is a permitting problem, an interconnection queue problem, a transmission problem, and a generation problem at once. Building new generation takes years. Securing transmission capacity takes years. Completing utility interconnection studies takes years. The result is a structural shortage of energized capacity that no amount of additional capital can resolve quickly.
Operators who already hold mature power positions, completed interconnection studies, and approved capacity have a scarcity premium that does not depend on operational sophistication alone.
3.2 Why Hyperscalers Need Third-Party Capacity
Hyperscalers continue to build their own capacity at scale. They are also increasingly willing to lease from third parties. Three forces drive this.
Speed to market is the first. A hyperscaler that needs 300 MW online in 2026 cannot wait for a self-built campus that energizes in 2028. Leasing from a developer with shovels already in the ground compresses time-to-revenue for the AI workloads the hyperscaler needs to deploy.
Capital flexibility is the second. Hyperscaler CapEx budgets are large but not infinite. Leasing converts a capital expenditure into an operating expense, preserves balance sheet flexibility for compute and chip purchases, and shifts construction risk to the developer.
Geographic and grid diversification is the third. A hyperscaler operating across multiple regions benefits from non-concentrated power exposure. Texas (ERCOT), Ohio (PJM), and other regions provide grid diversification that reduces curtailment risk and reliability risk.
Cipher's lease book reflects all three forces. Each tenant has chosen leased capacity over self-build for specific projects, and each lease is longer than typical hyperscaler internal payback windows.
3.3 Speed to Market, Interconnection, and Powered Land Scarcity
The competitive moat in this market is not technology. It is queue position. A site with completed interconnection, an executed PPA, and finished earthwork is, on a delivery basis, two to three years ahead of an otherwise identical site that has not begun those processes.
Cipher's portfolio carries this advantage at multiple sites. Barber Lake and Black Pearl are deep into construction. Stingray is fully approved with earthwork underway. Reveille has ERCOT interconnection approval and is not subject to the Batch 0 process. Ulysses is advancing through PJM.
The 2028 sites are the period of greatest interconnection risk because their delivery depends on the resolution of ERCOT Batch 0 in mid-2026. That is one of the swing variables in the model.
3.4 Why West Texas Has Become Strategically Relevant
West Texas was historically valued for low-cost wind and solar power supporting Bitcoin mining. The same geography is now valued for different reasons. Land is available. Permitting timelines are shorter than coastal markets. Renewable generation is abundant. ERCOT, despite known reliability concerns, has accommodated large industrial loads more flexibly than other ISOs.
Cipher's site concentration in West Texas is not incidental. It is the product of years of power origination work and PPA development that predate the AI buildout cycle. That early positioning translates directly into 2026 to 2028 deliverable capacity.
3.5 Why PJM Diversification Matters
Pure ERCOT exposure carries reliability and curtailment risk. PJM operates differently, with different congestion patterns, different capacity market dynamics, and different state-level policy environments. Ulysses in southeastern Ohio gives Cipher its first material PJM site. McLennan and Mikeska remain in ERCOT. The diversification is meaningful for tenant procurement teams who are explicitly building multi-region strategies.
The pipeline geography is therefore not a portfolio of identical sites. It is a deliberate distribution across two of the largest interconnection regions in the U.S.
4. Contracted Capacity and Lease Book
4.1 Current Operating and Contracted Capacity
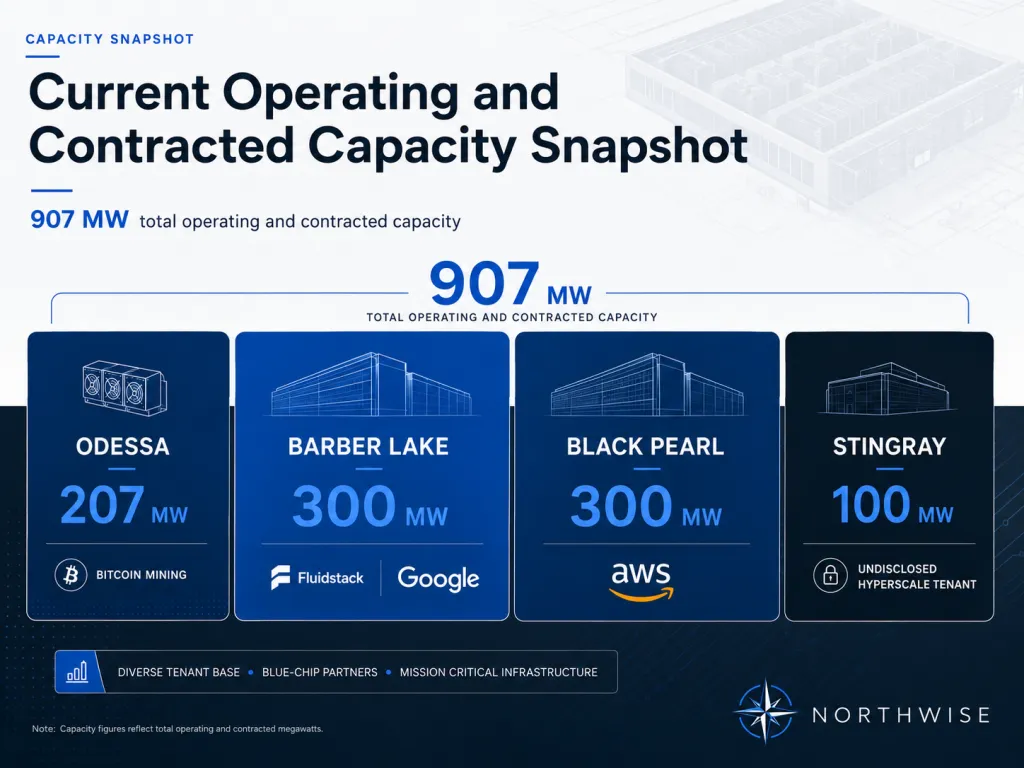
Cipher's operating and contracted capacity as of Q1 2026 totals 907 MW. This breaks down as follows.
Site | Capacity | Status | Tenant |
|---|---|---|---|
Odessa | 207 MW | Operating | Self-operated Bitcoin mining |
Barber Lake | 300 MW | Under construction | Fluidstack and Google |
Black Pearl | 300 MW | Under construction (mining-to-HPC conversion) | AWS |
Stingray | 100 MW | Approved, earthwork underway | Third hyperscale tenant (undisclosed) |
Total HPC contracted capacity is 700 MW across three sites and three tenants.
4.2 Barber Lake: Fluidstack and Google
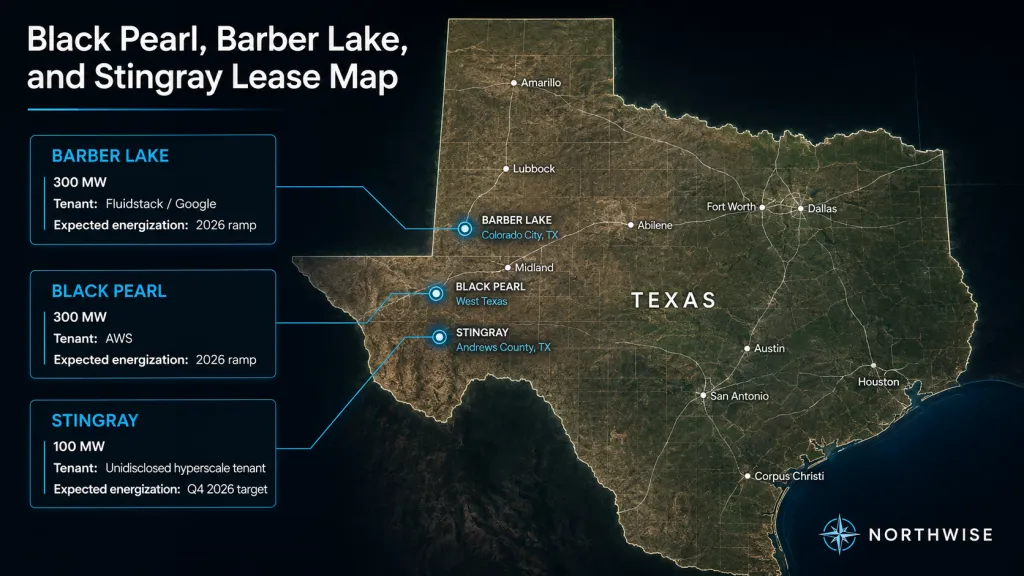
Barber Lake is the lead site. The 300 MW capacity is contracted to Fluidstack with Google as a financial backstop. The structure provides Cipher with a creditworthy ultimate counterparty while supporting Fluidstack's operational role as the AI compute provider.
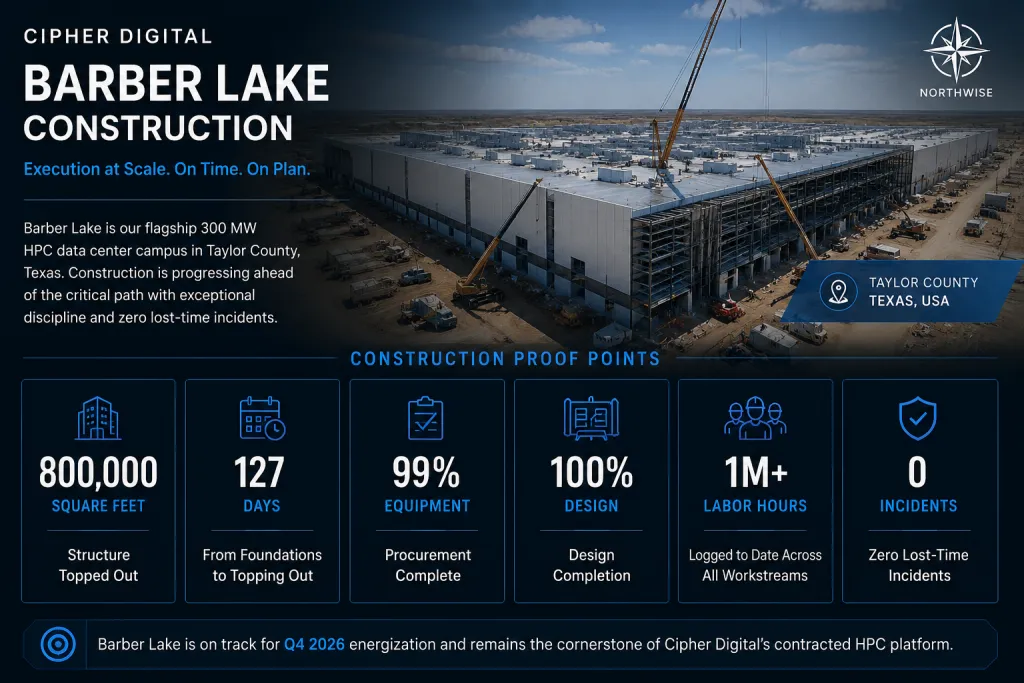
Construction is the most advanced of any site in the portfolio. The 800,000 square foot structure topped out 127 days after foundations began. Equipment procurement is 99% complete. Daily active construction workforce was over 1,100 in April 2026 with more than 1,400 expected in May. The project has accumulated more than one million labor hours with zero lost-time incidents.
These metrics carry weight beyond construction trivia. They indicate the project is on a delivery path consistent with the contractual schedule, and lease commencement timing flows directly through to revenue recognition.
4.3 Black Pearl: AWS
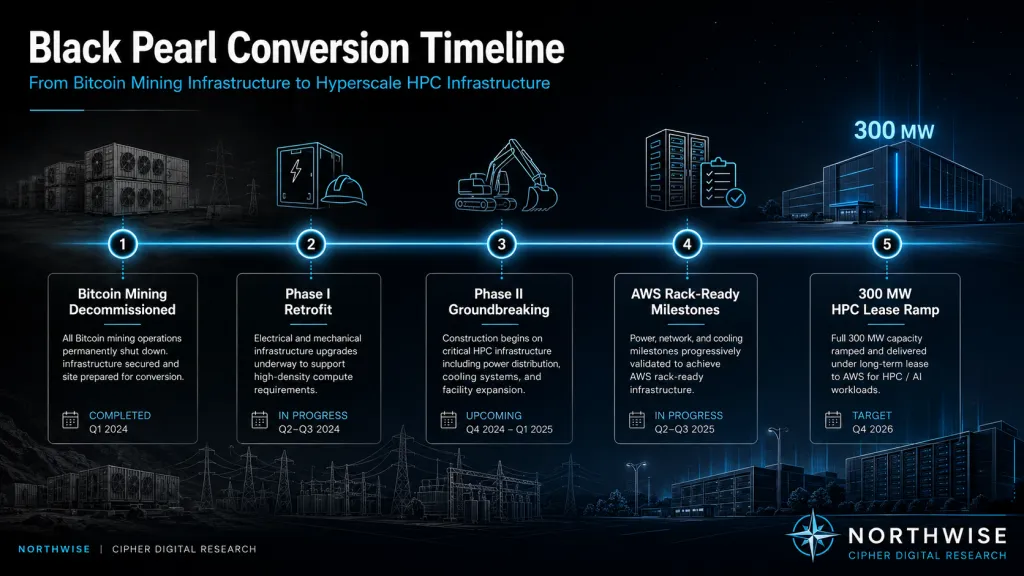
Black Pearl is the conversion site. Original mining infrastructure has been decommissioned. Phase I retrofit is progressing toward contractual early access and rack-ready milestones. Phase II broke ground three months after design kickoff.
Equipment procurement stands at 93% for Phase I and 80% for Phase II. The site is contracted to AWS, an investment-grade tenant. Project financing is supported by $2.0B of senior secured notes at the Black Pearl Compute level, carrying a 6.125% coupon and maturing February 2031. The financing is sufficient to complete construction without additional corporate capital.
The tenant identity matters. AWS is one of the largest hyperscale operators globally and represents one of the highest-quality counterparty exposures available in the data center leasing market.
4.4 Stingray: The Third 100 MW Hyperscale Lease
Stingray is the most recent addition. Located in Andrews County, Texas, it carries 100 MW of fully approved gross capacity and targets Q4 2026 energization. Earthwork and pad preparation are underway. Substation electrical work has commenced.
The tenant identity has not been disclosed publicly. The exact site-level economics are also not disclosed. For modeling purposes, Stingray is included in the consolidated contracted NOI disclosure rather than treated as a separate revenue line. This is the appropriate level of conservatism given the limited site-level disclosure.
4.5 Contracted Revenue and NOI Profile
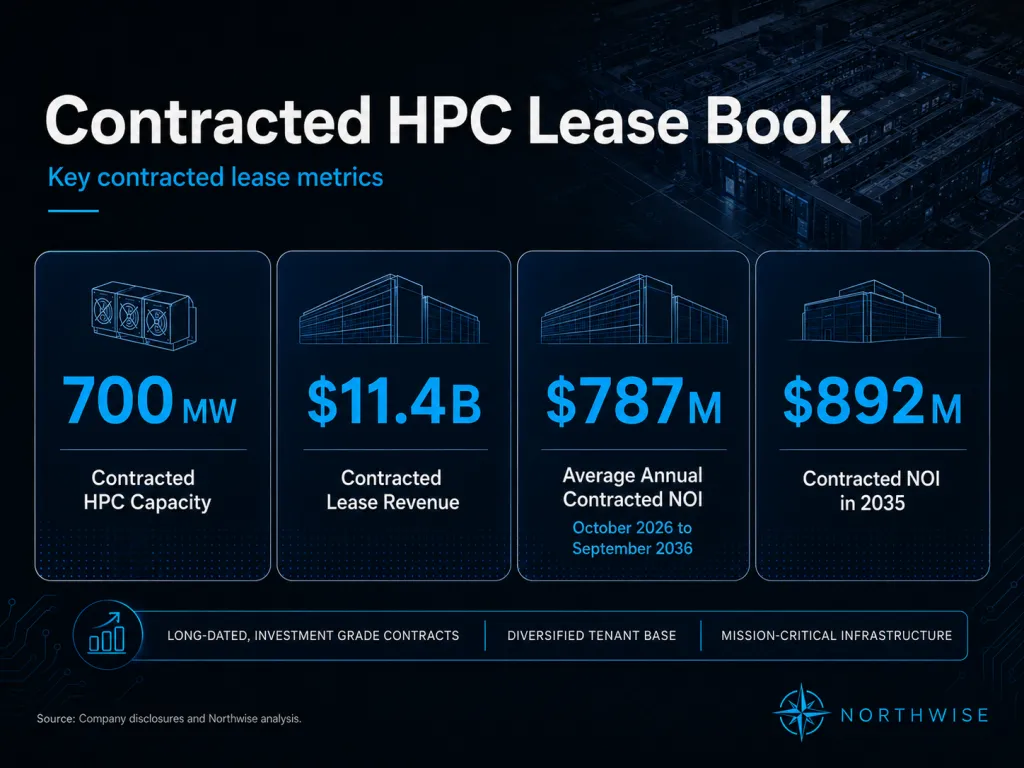
Across the three executed leases, the company has disclosed:
- $11.4B of total contracted revenue across base lease terms of 10 to 15 years
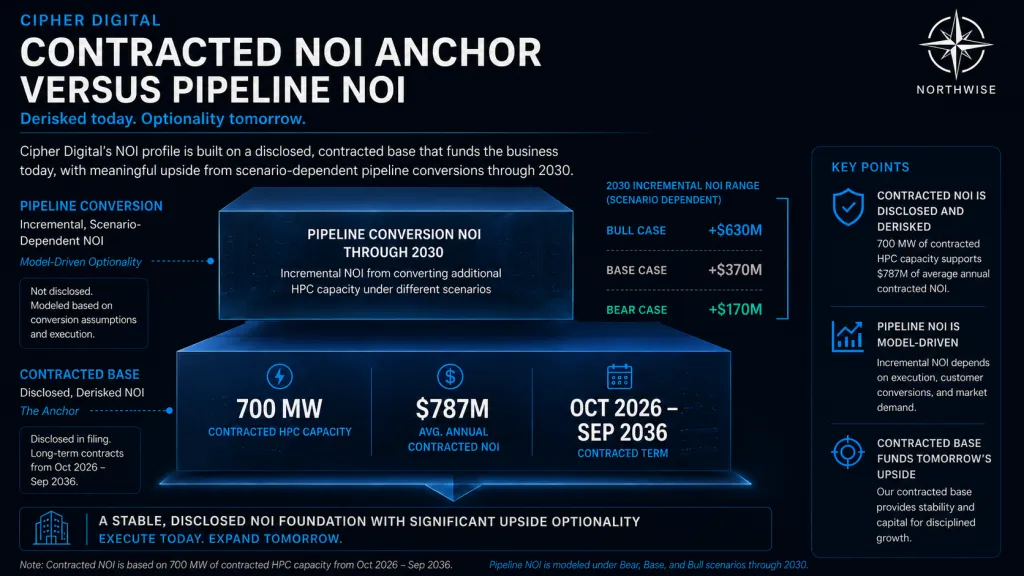
- $787M of average annualized contracted NOI from October 2026 through September 2036
- $892M of contracted NOI in 2035
These figures are management-disclosed and tied to the executed contracts. They are not projections of pipeline economics. They represent the floor of contracted cash generation from the existing lease book once all three sites reach steady-state operation.
4.6 Why Contracted NOI Is More Useful Than Headline MW
A common error in evaluating data center developers is to multiply headline MW by an assumed revenue per MW. This produces wide ranges depending on the assumption.
Cipher's disclosure replaces that assumption with an anchor. The 700 MW of contracted HPC capacity generates approximately $1.12M of NOI per MW on the consolidated disclosed basis. That number reflects the blended economics of three different sites with three different tenants and three different contract structures.
This anchor has two implications. First, it disciplines the model. Future site economics should be evaluated relative to this benchmark rather than against optimistic peer comparables. Second, it allows the model to differentiate between contracted economics and pipeline economics. The contracted base produces $787M of NOI. Pipeline conversion produces additional NOI with more modeling assumption attached. Mixing the two without explicit attribution overstates certainty.
The model treats the 700 MW contracted base as derisked at the disclosed NOI level and treats pipeline NOI as scenario-dependent. This separation is the foundation of disciplined valuation work for this name.
5. Construction Execution and Procurement
5.1 Barber Lake Construction Progress
Barber Lake is the most visible execution test in the portfolio. The metrics matter for revenue timing, not for narrative purposes.
The 800,000 square foot structure topped out 127 days after foundations. That is fast. Daily construction labor reached over 1,100 in April 2026 with more than 1,400 expected in May. Cumulative labor hours have exceeded one million with zero lost-time incidents. Equipment procurement stands at 99% complete. Design is 100% complete.
Each of these metrics has a model implication. Equipment procurement de-risks supply chain delays. Design completion eliminates rework risk. Labor scaling without safety incidents reduces the probability of regulatory or insurance-driven schedule disruption. Together they support the company's contractual delivery commitments.
5.2 Black Pearl Conversion From Mining to HPC
Black Pearl is the operational test of Cipher's ability to convert existing mining infrastructure into hyperscale-grade data center capacity. This is non-trivial. The power infrastructure can be reused. The cooling, electrical distribution, racks, and physical building requirements for AI workloads differ substantially from Bitcoin mining.
Mining infrastructure has been decommissioned. Phase I retrofit is progressing on the contractual schedule. Phase II broke ground three months after design kickoff. Equipment procurement is 93% for Phase I and 80% for Phase II.
The conversion model has implications beyond Black Pearl. Odessa carries optionality as a future HPC conversion candidate. Successful Black Pearl execution validates the conversion playbook for any future repurposing.
5.3 Stingray Mobilization and Q4 2026 Target
Stingray is the most recently approved site. Site approval, earthwork mobilization, and substation electrical commencement have occurred in sequence consistent with the Q4 2026 energization target.
Q4 2026 is an aggressive timeline. Slippage to Q1 or Q2 2027 would not be unusual for a site of this scale. The model treats Stingray's revenue ramp conservatively in the early year.
5.4 Equipment Procurement Risk
AI data center construction is unusually equipment-dependent. Switchgear, transformers, cooling infrastructure, and electrical components have all experienced supply chain pressure during the recent buildout cycle. Lead times of 18 to 24 months for major switchgear are common.
Cipher's procurement progress at Barber Lake (99%) and Black Pearl Phase I (93%) materially reduces this risk for the contracted book. Pipeline sites carry residual procurement risk that becomes more acute as multiple sites enter active construction simultaneously. The 2028 to 2029 buildout window represents the period of greatest concurrent procurement exposure.
5.5 Why Construction Timing Determines Revenue Recognition
Lease revenue does not begin at site approval. It begins at rack-ready handoff or contractual early access date, depending on lease structure. A site that energizes one quarter late shifts revenue and NOI by one quarter. A site that slips two or three quarters has a more substantial impact on the revenue ramp profile.
This is why the 2027 to 2030 modeling window depends so heavily on construction execution. The contracted book is largely determined. The pipeline is where timing slippage compounds.
6. Development Pipeline and Energization Path
6.1 Reveille and Ulysses as 2027 Proof Points
Two sites anchor the 2027 pipeline.
Reveille is 70 MW in Cotulla, Texas. ERCOT interconnection has been approved. The site is not subject to the Batch 0 interconnection process and carries a Q3 2027 target energization date. Reveille is small relative to the contracted book, but its execution validates the company's ability to bring new pipeline sites online without disruption.
Ulysses is 200 MW in southeastern Ohio. PJM approvals are in process. Target energization is Q4 2027. Ulysses represents the company's first material PJM site and adds geographic diversification to a portfolio otherwise concentrated in ERCOT.
Together, Reveille and Ulysses add 270 MW of capacity in the 2027 window. They are the proof of pipeline conversion before the larger 2028 sites need to deliver.
6.2 McLennan, Mikeska, Milsing, and Colchis
These four sites represent 2.5 GW of additional capacity in the 2028 to 2029 window. McLennan, Mikeska, and Colchis are advancing through ERCOT's interconnection process and are expected to be in Batch 0. Milsing is at an earlier development stage.
The size of this group means the difference between the bear and base scenarios is largely determined here. Successful conversion of three of these four sites supports the base case. Conversion of one or two supports the bear case. ERCOT delays affecting all three Batch 0 candidates would deepen the bear scenario through both delayed revenue and increased dilution risk.
6.3 ERCOT Batch 0 and Interconnection Risk
ERCOT's interconnection process has changed. The Batch 0 process applies to large industrial loads seeking energization in specific windows. Approval status, batch composition, and timing are subject to ERCOT determination.
Management has expressed expectation of a constructive outcome from the Batch 0 finalization process. The process is not under management's control. Adverse outcomes would directly delay 2028 energization for the three affected sites.
This is one of the most concrete external risks in the model and one of the few that cannot be mitigated through execution alone.
6.4 Barber Lake Expansion Optionality
Beyond the contracted 300 MW, Barber Lake carries a 500 MW expansion opportunity. Power, land, and interconnection are positioned for additional capacity. The expansion would extend the site's gross capacity to 800 MW.
The expansion is not currently contracted. It is included in upside scenarios but not in the base case. Realization depends on tenant demand, lease pricing, and capital allocation priorities at the time of decision.
6.5 Final Site-by-Site Base Case Energization Timeline
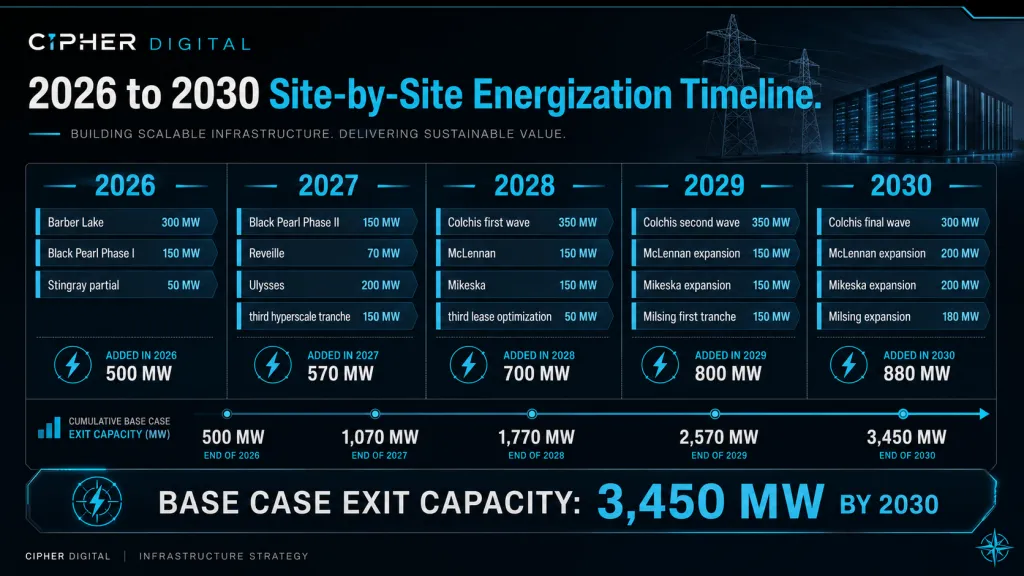
The base case energization schedule for HPC capacity is as follows.
Year | New MW Energized | Cumulative HPC MW |
|---|---|---|
2026 | 700 (Barber Lake, Black Pearl, Stingray) | 700 |
2027 | 270 (Reveille, Ulysses) | 970 |
2028 | 1,000 (McLennan, partial Mikeska) | 1,970 |
2029 | 1,000 (Milsing, Colchis, completion of 2028 sites) | 2,970 |
2030 | 500 (Barber Lake expansion or alternative pipeline) | 3,470 |
This schedule assumes 2028 ERCOT sites convert as planned, 2029 sites operate, and the 2030 exit reflects substantial but not complete conversion of the broader pipeline. The bull case adds the remaining capacity to reach 4,200 MW. The bear case removes roughly 720 MW to reach 2,750 MW.
7. Bitcoin Mining as a Funding Bridge
7.1 Odessa's Current Role
Odessa operates 207 MW of Bitcoin mining capacity at 11.6 EH/s with a 17.2 J/TH fleet efficiency. It mined 346 BTC in Q1 2026. Power costs run approximately $0.028/kWh. No further capital investment in mining is planned.
The site generates positive cash flow. That cash flow contributes to corporate liquidity during the construction phase and reduces the equity that would otherwise be required to fund the buildout. This is the only role mining plays in the current investment case.
7.2 Why Mining Is No Longer the Core Thesis
Mining is cyclical. It depends on Bitcoin price, network hashrate, and energy costs. Each of these variables is outside management's control. The signed HPC lease book, by contrast, generates contracted revenue regardless of Bitcoin price.
A reasonable underwriting framework treats mining as a residual contributor that may add value but cannot carry the equity case. The company's own communication is consistent with this. Management has signaled mining will be substantially gone from the narrative within 18 to 24 months.
7.3 Mining Cash Flow Through 2027
Mining cash flow during the 2026 to 2027 window is modeled as a positive but declining contribution. The contribution depends on Bitcoin price, but at current network conditions the site produces meaningful operating cash flow on the order of $100M to $200M annually before tax.
That contribution is included in liquidity but not in the 2030 valuation framework. By 2030, mining is modeled as zero contribution, regardless of Bitcoin price assumptions.
7.4 Odessa HPC Conversion Optionality
Odessa carries optionality as a future HPC conversion candidate. The site has 207 MW of operating power infrastructure, established interconnection, and existing operating staff. Converting it would require capital investment for AI-grade cooling, electrical distribution, and building modification.
The conversion would only proceed if hyperscale tenant interest, lease pricing, and PPA renegotiation produce returns competitive with greenfield development. This is a real call option but not a base case assumption.
7.5 Why Bitcoin Upside Helps but Should Not Carry the Thesis
Higher Bitcoin prices in the 2026 to 2027 window produce additional cash flow that reduces the required equity issuance for pipeline construction. This is a meaningful but bounded benefit. A 50% increase in Bitcoin price might add $50M to $100M of additional cash flow over the bridge period. That is helpful but not transformative.
An investor who underwrites CIFR primarily on Bitcoin price exposure is misallocating attention. The lease book and the pipeline are where value is created or destroyed.
8. Business Model Economics
8.1 Revenue Per MW and NOI Per MW
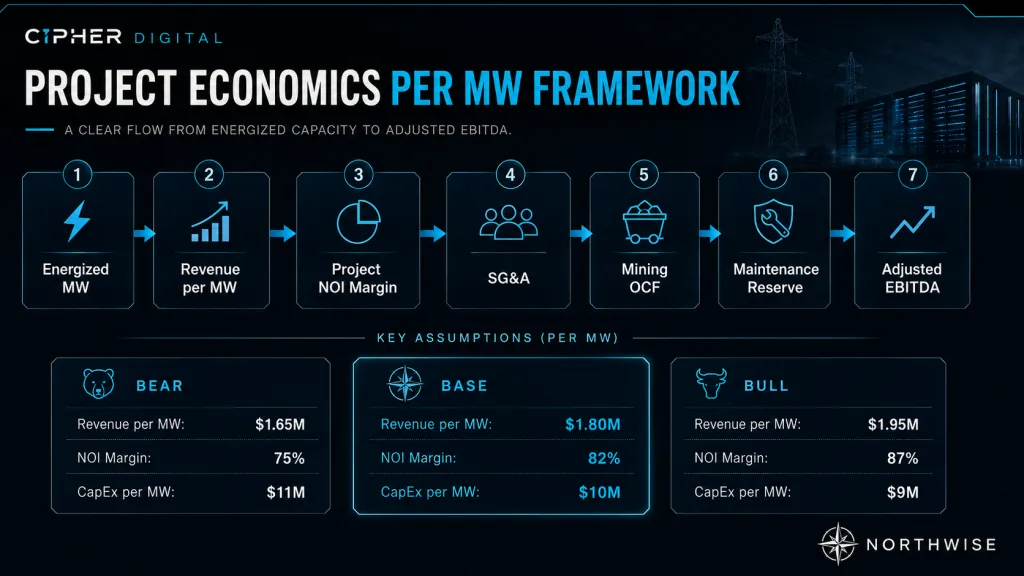
The contracted lease book implies approximately $1.12M of NOI per MW on a consolidated basis. This is the disclosed anchor. Future pipeline sites are modeled with NOI per MW assumptions that vary by scenario.
Scenario | 2030 NOI per MW |
|---|---|
Bear | $1.18M |
Base | $1.28M |
Bull | $1.45M |
Bear assumes the contracted economics persist with limited improvement, with some risk of compression on the marginal pipeline sites that do convert. Base assumes new sites price modestly above the contracted average due to scarcity premiums and timing advantage. Bull assumes premium pricing on new sites consistent with the strongest end of management's stated pricing power.
8.2 Contracted NOI Versus Future Pipeline Economics
The model treats the 700 MW contracted base at the disclosed NOI level across all scenarios. The differences between scenarios are driven entirely by pipeline conversion and pipeline pricing, not by changes to the contracted base.
This separation is important. It means the contracted floor is consistent across scenarios. The variability is concentrated in the pipeline, which is where the actual analytical uncertainty lies.
8.3 CapEx Per MW
CapEx assumptions vary by scenario, reflecting differences in cost inflation, construction efficiency, and equipment availability.
Scenario | CapEx per MW |
|---|---|
Bear | $10.75M |
Base | $10.0M |
Bull | $9.25M |
These numbers are consistent with hyperscale data center construction costs in the U.S. market. The bull case assumes scale efficiencies and procurement leverage that bring per-MW costs to the lower end of the observed range. The bear case assumes some cost inflation and procurement friction relative to the base.
8.4 Maintenance and Refresh Capital
Operating data centers require ongoing maintenance and periodic refresh of mechanical and electrical systems. The model treats this as a percentage of revenue.
Scenario | Maintenance Reserve |
|---|---|
Bear | 5.5% of revenue |
Base | 4.0% of revenue |
Bull | 3.0% of revenue |
The variation reflects scenario-specific assumptions about lease terms (some leases include tenant maintenance obligations), the age and condition of the asset base, and the operational efficiency of the platform.
8.5 SG&A and Corporate Expense Layer
SG&A scales with platform size but is largely fixed within scenario ranges. The model uses the following 2030 assumptions.
Scenario | 2030 SG&A |
|---|---|
Bear | $420M |
Base | $350M |
Bull | $325M |
The bear SG&A is higher per MW because operational inefficiency, higher legal and refinancing costs, and equity issuance support add to corporate expense. The bull case SG&A is lower per MW because scale absorbs corporate overhead more efficiently.
8.6 Adjusted Cash EBITDA Formula
The model defines cash EBITDA as:
Project NOI minus SG&A minus maintenance reserve equals cash EBITDA.
This formulation excludes depreciation and interest expense, which are separately modeled as a GAAP earnings check. Cash EBITDA is the primary operating output used for valuation.
9. Capital Structure and Funding Bridge
9.1 Existing Debt and Liquidity
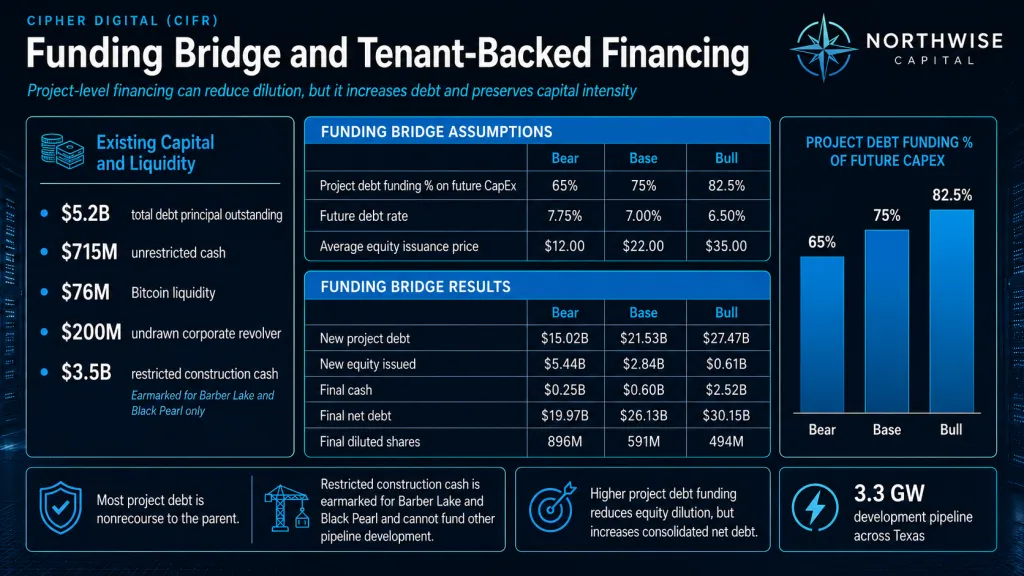
As of Q1 2026, Cipher's capital structure includes:
- $5.2B total debt principal outstanding
- $715M unrestricted cash
- $76M Bitcoin liquidity
- $200M undrawn corporate revolver
- $3.5B restricted construction cash
The $5.2B debt total is comprised primarily of two project-level senior secured note structures.
Debt Tranche | Principal | Coupon | Maturity |
|---|---|---|---|
Cipher Compute (Barber Lake) senior secured notes | $1.7B | 7.125% | November 2030 |
Black Pearl Compute senior secured notes | $2.0B | 6.125% | February 2031 |
The remaining debt sits at corporate or other project levels. Most of the structure is nonrecourse to the parent.
9.2 Restricted Cash and Project-Level Financing
The $3.5B of restricted construction cash represents proceeds from project-level financings earmarked for construction completion at Barber Lake and Black Pearl. This is a critical item in the funding bridge.
The cash is restricted to specific project uses, which means it cannot fund pipeline development at other sites. But it does mean that Barber Lake and Black Pearl can be completed without additional corporate capital. The signed contracted base is, on a construction funding basis, substantially derisked.
9.3 Why Nonrecourse Financing Matters
Nonrecourse project debt is structured against specific project cash flows. The lender's recourse is to the project assets and contracted revenue, not to the parent company's general balance sheet. This structure protects the parent equity from cascading default risk if a single project encounters distress.
It also means that project-level debt does not dilute the parent's flexibility to finance new projects. New pipeline sites can be financed with new project-level debt without the parent having to refinance or restructure existing project debt.
9.4 Why Project Debt Still Matters to Equity
Nonrecourse structuring does not make project debt invisible to equity holders. Three reasons.
First, project debt service consumes project cash flow before any cash reaches the parent. Until project debt is paid, the contracted revenue is dedicated to debt service rather than dividends or reinvestment.
Second, project debt is consolidated on the parent balance sheet for GAAP purposes. The reported net debt of the company includes all project-level debt. Investors evaluating the equity look at consolidated leverage.
Third, project debt limits financial flexibility. If a project underperforms, the equity owner of that project is the parent. Project equity cushions against project debt service shortfalls. The parent's ability to support multiple projects through stress depends on its corporate liquidity.
9.5 Funding Bridge Across Bear, Base, and Bull Cases
The buildout from 700 MW to the 2030 exit MW requires substantial new capital. The model decomposes this into project debt and equity issuance, with the mix varying by scenario based on lease quality, financing market conditions, and share price.
Assumption | Bear | Base | Bull |
|---|---|---|---|
Project debt funding % on future CapEx | 65% | 75% | 82.5% |
Future debt rate | 7.75% | 7.0% | 6.5% |
Average equity issuance price | $12.00 | $22.00 | $35.00 |
Minimum operating cash buffer | $250M | $250M | $250M |
The bear case funding bridge includes a $250M minimum operating cash buffer rather than running corporate liquidity to zero. A company building hyperscale infrastructure cannot operate at zero cash without triggering covenant trips, vendor disputes, and lender concerns. The buffer is funded by a marginal increase in equity issuance, which is reflected in the diluted share count.
The funding bridge results follow from these assumptions and the CapEx required for each scenario's pipeline conversion.
Case | New Project Debt | New Equity Issued | Final Cash | Final Net Debt | Final Diluted Shares |
|---|---|---|---|---|---|
Bear | $15.02B | $5.44B | $0.25B | $19.97B | 896M |
Base | $21.53B | $2.84B | $0.60B | $26.13B | 591M |
Bull | $27.47B | $0.61B | $2.52B | $30.15B | 494M |
9.6 Dilution Assumptions by Scenario
The dilution dynamic in this model is asymmetric and worth understanding clearly.
In the bear, the company builds materially less than the base but still requires substantial equity issuance at moderate prices to fund the partial pipeline conversion. Share count more than doubles from current levels. The combination of weaker execution and a depressed share price compounds against existing shareholders.
In the base, project financing absorbs more of the buildout, equity issuance is moderate, and the share price is healthy enough that dilution is contained.
In the bull, project financing covers most of the buildout, equity issuance is minimal, and the share price is high enough that the small amount of equity issued creates limited dilution.
The base and bull cases produce per-share value not only because of larger asset bases but because the asset base is built with less shareholder dilution.
9.7 Why Shareholder Retention Is the Model's Core Variable
The model's most important insight is not the gross asset value at full buildout. It is the retention rate of that value to common shareholders.
A 4 GW infrastructure portfolio is large in absolute terms in any scenario. The question is what fraction of the resulting cash flow reaches common equity after debt service and what fraction of that equity value is retained by existing shareholders versus new equity holders.
This is why the per-share outcomes diverge so dramatically across scenarios despite asset bases that differ by less than a factor of two. The combination of dilution leverage and capital structure leverage produces non-linear per-share outcomes.
10. Full Operating Model
10.1 Modeling Methodology
The model uses a 2030 run-rate framework. Each scenario produces a 2030 exit state that includes operating MW, project NOI, cash EBITDA, net debt, and diluted share count. The valuation is applied to the 2030 cash EBITDA figure using an EV/cash EBITDA multiple appropriate to the scenario.
This approach has two advantages. First, it focuses on the steady-state operating economics rather than transitional construction-period accounting. Second, it allows clean comparison across scenarios with different buildout speeds.
The model does not project quarterly cash flows. The buildout period is intentionally compressed into bridge assumptions about cumulative new debt, cumulative new equity, and ending net debt. This is a deliberate simplification that emphasizes the structural drivers over the timing details.
10.2 Bear Case
The bear case assumes partial pipeline conversion. The 2027 sites energize, one to two of the 2028 sites convert, and the remaining pipeline is delayed or descoped. Lease pricing holds at contracted levels with limited improvement. Project debt funding covers 65% of future CapEx at a 7.75% rate. Equity is issued at a moderate average price of $12, with a marginal additional issuance to maintain a $250M operating cash buffer.
Bear Operating Output | Value |
|---|---|
2030 HPC MW | 2,750 |
2030 NOI per MW | $1.18M |
2030 Project NOI | $3.25B |
2030 SG&A | $420M |
2030 Maintenance reserve | $240M |
2030 Cash EBITDA | $2.59B |
Final Net Debt | $19.97B |
Final Diluted Shares | 896M |
The bear case still produces significant cash EBITDA, but heavy net debt and material dilution constrain per-share outcomes. Share count more than doubles from current levels.
10.3 Base Case
The base case assumes the contracted book operates as planned, the 2027 pipeline energizes on schedule, and the majority of 2028 to 2029 sites convert successfully. Lease pricing on new sites improves modestly above the contracted average. Project debt funding covers 75% of future CapEx at a 7.0% rate. Equity is issued at a stronger price reflecting market confidence in execution.
Base Operating Output | Value |
|---|---|
2030 HPC MW | 3,470 |
2030 NOI per MW | $1.28M |
2030 Project NOI | $4.44B |
2030 SG&A | $350M |
2030 Maintenance reserve | $230M |
2030 Cash EBITDA | $3.86B |
Final Net Debt | $26.13B |
Final Diluted Shares | 591M |
The base case produces the cleanest combination of asset growth and shareholder retention. The diluted share count grows but at a controlled pace.
10.4 Bull Case
The bull case assumes nearly full conversion of the 4.2 GW grid portfolio. Premium pricing persists on new sites. Project debt funding covers 82.5% of future CapEx at a 6.5% rate. Equity issuance is minimal because the company can largely self-finance through project debt and operating cash flow.
Bull Operating Output | Value |
|---|---|
2030 HPC MW | 4,200 |
2030 NOI per MW | $1.45M |
2030 Project NOI | $6.09B |
2030 SG&A | $325M |
2030 Maintenance reserve | $215M |
2030 Cash EBITDA | $5.55B |
Final Net Debt | $30.15B |
Final Diluted Shares | 494M |
The bull case carries the highest absolute net debt but the smallest dilution relative to asset growth. This is the scenario where shareholder retention is highest.
10.5 Depreciation and Interest Expense Check
A standard concern with infrastructure-heavy companies during buildout is that GAAP earnings understate underlying cash economics. The model runs a depreciation and interest expense check using a 15-year straight-line assumption for data center infrastructure.
Case | 2030 Depreciation | 2030 Interest Expense | 2030 Net Income After D&I |
|---|---|---|---|
Bear | $1.97B | $1.37B | ($513M) |
Base | $2.31B | $1.71B | $51M |
Bull | $2.59B | $1.94B | $974M |
The implications are important. The bear case produces a GAAP loss despite generating positive cash EBITDA. The base case produces marginal GAAP profitability. Only the bull case produces meaningful GAAP earnings.
This pattern is normal for capital-intensive infrastructure businesses during buildout. Public markets do sometimes punish equities for weak GAAP earnings even when underlying cash economics are constructive. This is one of the secondary risks investors should weigh.
10.6 Why EV/Cash EBITDA Is the Primary Valuation Method
Three reasons drive the choice of EV/cash EBITDA over P/E.
First, GAAP earnings during buildout are dominated by depreciation and interest expense that reflect the construction phase rather than the steady-state economics. Using GAAP earnings produces valuations that fluctuate with construction timing rather than business quality.
Second, project NOI is the cleanest operating anchor. It reflects the contracted revenue net of operating costs at the project level, which is what the underlying contracts produce.
Third, infrastructure investors and acquirers consistently use NOI-based or EBITDA-based valuation frameworks. P/E is not the standard tool for this asset class.
The EV/cash EBITDA approach calculates enterprise value as the multiple times cash EBITDA, equity value as enterprise value minus net debt, and per-share value as equity value divided by diluted shares. This produces clean comparison across scenarios and correctly attributes the impact of capital structure.
11. Risk Assessment
11.1 Construction Execution Risk
Construction execution is the most immediate operational risk. The contracted book requires Barber Lake, Black Pearl, and Stingray to deliver on contractual schedules. Slippage at any of these sites delays revenue recognition and may trigger contractual penalties.
Equipment procurement progress mitigates this risk for the contracted book. Pipeline sites carry residual procurement risk that becomes more acute as multiple sites enter active construction simultaneously.
The risk flows through the model as delayed cash EBITDA in the year of slippage and as a potential dilution accelerator if the company must issue equity to bridge revenue shortfalls.
11.2 ERCOT and Grid Interconnection Risk
McLennan, Mikeska, and Colchis are advancing through ERCOT's Batch 0 process. Adverse outcomes from the Batch 0 finalization in mid-2026 would directly delay 2028 energization. This risk is material and largely outside management's control.
Reveille is not subject to Batch 0 and carries lower interconnection risk. Ulysses is in PJM and carries different but generally lower interconnection risk than ERCOT Batch 0 sites.
Grid interconnection risk flows through the model as delayed pipeline conversion. Severe ERCOT delays would push the company toward the bear scenario through deferred revenue recognition and increased dilution to bridge the timing gap.
11.3 Financing and Refinancing Risk
The buildout requires substantial new project debt. Project financing markets are currently constructive but cyclical. A material widening of credit spreads or a contraction in available capacity would raise the cost of new debt and could limit the percentage of CapEx that can be debt-funded.
Both Barber Lake and Black Pearl notes carry 2030 to 2031 maturities. Refinancing those notes is a 2030 event that depends on market conditions at the time of refinancing. Adverse conditions would increase financing costs and could require equity contribution.
The risk flows through the model as either higher interest expense, more equity dilution, or both, depending on the specific stress.
11.4 Dilution Risk
Equity issuance at depressed prices is the most asymmetric risk in the model. The same dollar of capital raised at $12 produces nearly three times the dilution of capital raised at $35. This is why the bear case produces materially weaker per-share outcomes despite a 2.75 GW asset base that is itself substantial.
Management's options to mitigate dilution include accelerating project debt issuance, scaling back pipeline conversion, asset sales, or strategic transactions. Each carries its own costs.
The risk flows through the model as a multiplier on the per-share outcomes. Heavy dilution at low prices is the primary mechanism by which strong assets produce weak equity outcomes.
11.5 Customer Concentration and Tenant Power
Three tenants account for 100% of contracted HPC revenue. This is structurally normal for hyperscale leasing but creates concentration risk. A dispute, default, or non-renewal at a single site would have material consequences.
The credit quality of the tenants partially mitigates this risk. Google, AWS, and the third hyperscale tenant are all significant credit counterparties. Lease defaults are unlikely. Renewal terms at lease expiration are a separate consideration but extend beyond the 2030 modeling window.
The risk flows through the model as a potential revenue gap at any individual site if a contract is disrupted. The model does not currently include scenario-specific contract failures.
11.6 Lease Pricing Compression Risk
The model assumes pipeline lease pricing meets or exceeds the contracted average across most scenarios. This assumption depends on continued AI infrastructure scarcity through the 2028 to 2029 window.
If hyperscaler self-build accelerates, alternative third-party capacity floods the market, or AI compute demand growth slows, lease pricing on new sites could compress below the contracted average. This would compress NOI per MW and reduce 2030 cash EBITDA.
The bear case partially models this dynamic through the lower NOI per MW assumption. The risk flows through the model as a reduction in NOI per MW assumptions for pipeline sites.
11.7 Depreciation, Interest, and GAAP Earnings Risk
GAAP earnings during buildout will look weak relative to underlying cash economics. The depreciation and interest expense check shows GAAP losses in the bear case and only marginal profitability in the base case.
Public market investors do not always weight cash economics over GAAP earnings consistently. Index inclusion, institutional ownership, and analyst coverage frameworks sometimes anchor on GAAP profitability metrics.
The risk flows through the model as a potential discount on the EV/cash EBITDA multiple if the market punishes GAAP earnings weakness. The scenario-specific multiples in the model already incorporate some of this consideration.
11.8 Bitcoin Wind-Down and Transition Risk
Mining wind-down requires either site shutdown or HPC conversion at Odessa. Either path carries some execution risk. A poorly-timed wind-down could create a temporary cash flow gap during a critical construction funding window.
This risk is small in absolute terms because Odessa's contribution is modest relative to the HPC platform. It is worth noting because it is the residual risk from the company's previous identity.
The risk flows through the model as a marginal reduction in bridge cash flow if wind-down is mistimed.
11.9 Compute Ownership Risk
Reveille has been mentioned as a possible test site for compute ownership. If the company moves into owning compute hardware, it inherits hardware lifecycle risk, depreciation acceleration risk, and tenant credit risk specific to neocloud customers.
The model does not currently assume material compute ownership. If the company expands into this area materially, the model would need to be revised to reflect different revenue economics, different CapEx, and different risk profile.
11.10 Behind-the-Meter Generation Risk
Behind-the-meter power generation is a strategic option for some sites but introduces additional execution complexity. Generation development carries permitting risk, fuel supply risk, and operational risk that is different from grid-supplied power.
The model does not currently assume material behind-the-meter generation. Expansion in this area would add capability but also add operational and capital intensity.
A fair amount of work has gone into separating what is contracted from what is pipeline, what is funded from what requires new capital, and what is operational from what is GAAP. That framework now applies to the question that actually drives investment outcomes: at what price does CIFR clear the return hurdles a serious investor should require, and where do those clearing prices sit relative to the current quote.
The valuation work, scenario price targets, present value framework, position sizing, and the buy, hold, trim, and sell zones that follow are where the model becomes a decision rather than an analysis.
Northwise Premium
Choose how to continue with Northwise
Join Northwise Premium
Unlock the rest of this report, its complete valuation, the downloadable model, portfolios, and action framework.
Join Northwise PremiumCreate a Free Account
Continue across Free Northwise research, follow companies, save reports, and receive updates.
Create a Free Account
CIFR Stock Forecast
Cipher Digital has proven that hyperscalers will lease its capacity. The open question is whether it can finance four gigawatts without giving away too much of the economics.

CIFR Barber Lake Site
Barber Lake: Fluidstack's contracted capacity, phased delivery, Google's support and the September update on Colorado City's water infrastructure.

CIFR Stock Black Pearl Site
Black Pearl: initial AWS capacity delivered and rent begun, remaining construction, the lease structure and the limits of the public technical record.
Northwise Portfolios
See how the research becomes real decisions
Reader discussion
Discuss the research
Premium access is required to join this report's discussion.
Join Northwise Premium
No comments yet. Start a thoughtful discussion.