
CIFR Stock Forecast
Cipher Digital has proven that hyperscalers will lease its capacity. The open question is whether it can finance four gigawatts without giving away too much of the economics.
In this article
Cipher Digital has already proven that hyperscalers will lease its capacity. Whether it can finance 4 gigawatts without handing the economics to somebody else is a different question entirely.
1. The Core Debate in Our CIFR Stock Forecast 2030
1.1 The Question That Has Been Answered
For most of Cipher's public life, the argument was about whether a Bitcoin miner could credibly reinvent itself as a hyperscale data center developer. That argument is over. Amazon, Fluidstack, and Google have committed capital or credit to Cipher-developed capacity, project lenders have advanced billions against those leases, and construction is active at three campuses covering roughly 700 MW of gross power.
Along the way the future portfolio grew to approximately 5.3 GW across 11 sites, contracted lease revenue reached roughly $11.4 billion, and the company changed its name to match what it had become. Mining still shows on the reported revenue line, though it now functions as transitional cash flow inside a construction program that will consume tens of billions of dollars.
The market has largely absorbed this. What it has absorbed less well is that answering the first question opened a harder one.
1.2 The Question That Replaced It
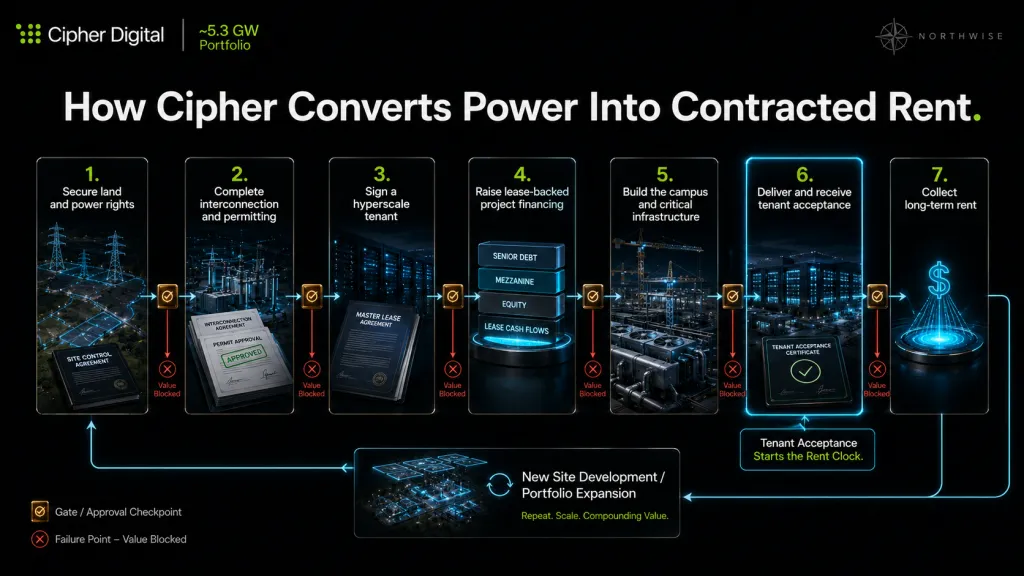
A developer that controls 5.3 GW of power-secured land in a market starved for energized capacity is holding something genuinely scarce. Converting that scarcity into a stock return requires a chain of events, and every link in the chain has a claimant standing in front of the common shareholder.
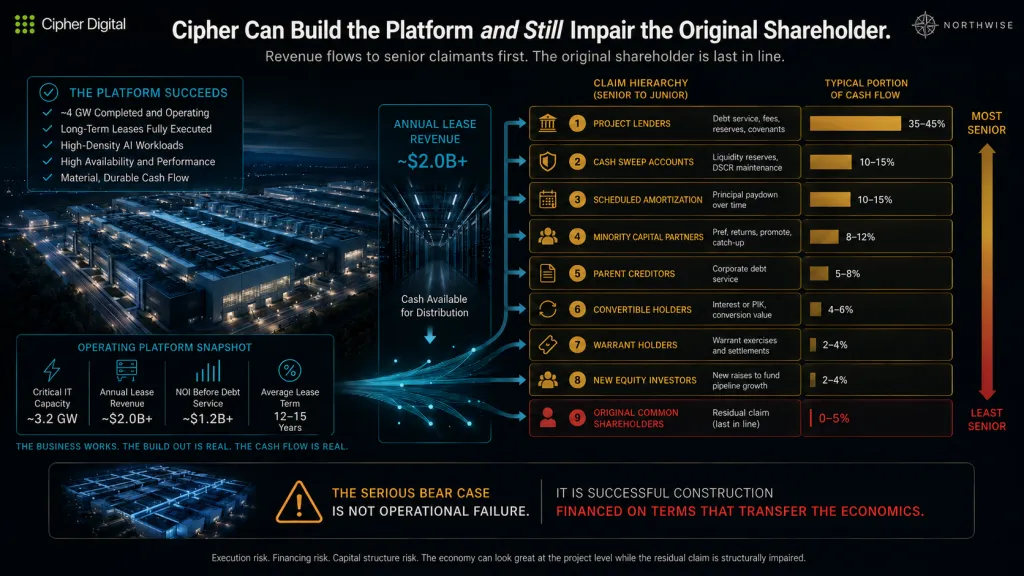
The chain runs from power-secured land to hyperscale lease to construction financing to delivered critical IT capacity to project NOI to debt service to parent cash to common equity. Project lenders get paid first. Then scheduled amortization, then excess cash flow sweeps, then minority partners, then corporate creditors, then convertible and warrant holders, and then whoever bought the equity Cipher issued along the way to keep the lights on.
What remains after that sequence is the investment. The size of the platform tells you almost nothing about the size of what remains.
1.3 What Our Model Actually Found
We ran three scenarios and the result surprised us in a specific way. The physical outcomes cluster tightly. Cipher reaches 3.8 GW in our downside, 4.25 GW in our central case, and 4.8 GW in our upside, a spread of roughly 26% from bottom to top.
However, the shareholder outcomes do not cluster at all. The same company producing $2.86 billion of annual project NOI in one scenario and $5.23 billion in another produces negative $169 million of common cash flow in the first and positive $1.62 billion in the second. Operating performance moves by a factor of 1.8. The cash reaching shareholders changes sign.
That gap is the report. Cipher can build the platform, service the debt, satisfy every tenant, and still deliver a common equity outcome that ranges from near-total loss to a very large gain, and the variable separating those outcomes is not demand, execution, or capacity. It is the terms on which the buildout gets financed.
2. What Cipher Digital Actually Is
2.1 The Rebrand Tracked an Economic Change
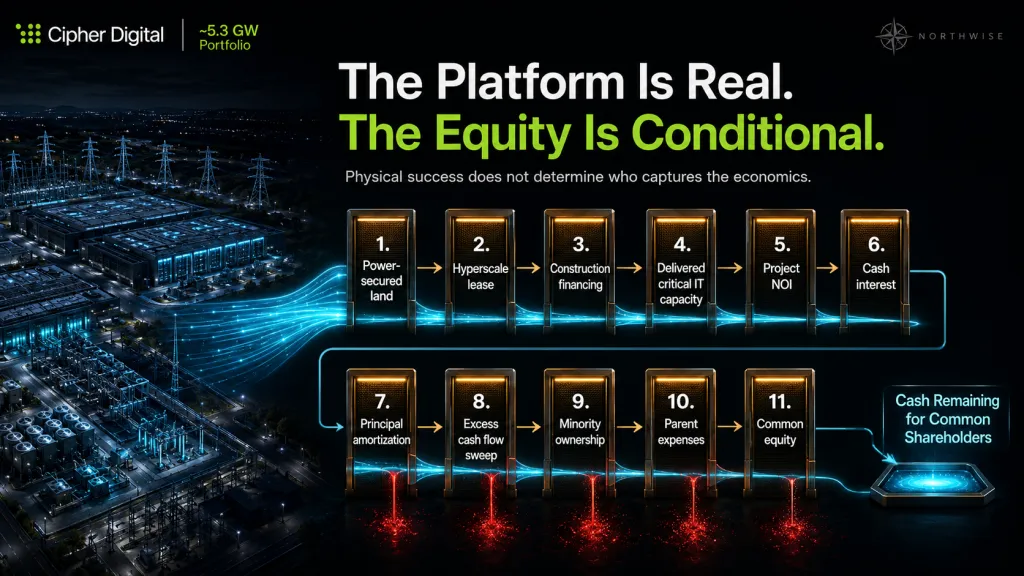
Mining and leasing are not adjacent businesses that share an asset base. A miner sells a commodity into a volatile market with no contractual protection, competes on power cost and fleet efficiency, and carries hardware that becomes obsolete on the manufacturer's schedule. A lessor collects contracted rent from investment-grade counterparties on 15-year terms and owns concrete, copper, and interconnection rights that do not depreciate on anybody's product roadmap.
The February 2026 change from Cipher Mining to Cipher Digital acknowledged which of those two the company intends to be. It was not a marketing exercise. The valuation frameworks, the risk profile, the capital structure, and the investor base all differ, and continuing to analyze this company through a mining lens produces answers to questions nobody is asking.
By 2028 our model carries zero mining contribution in all three scenarios. The legacy business contributes $51 million of cash in 2026 and $20 million in 2027, then stops. Anyone still underwriting CIFR on hash price is underwriting less than 2% of the 2027 cash flow and none of the 2028 cash flow.
2.2 The Operating Loop
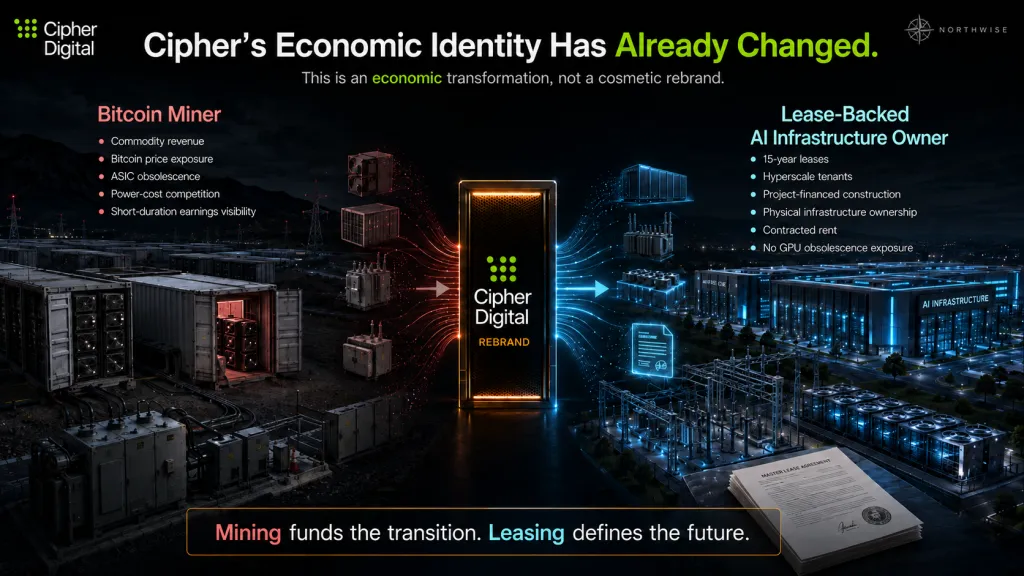
Cipher's business is a loop that repeats site by site. Secure land and power rights, complete interconnection and permitting, sign a long-term hyperscale tenant, raise project financing against that lease, build the shell and critical infrastructure, deliver accepted critical IT capacity, and collect rent for 15 years.
Each step gates the next in a way that makes the sequence unforgiving. Power rights without a tenant attract no financing. A tenant without completed construction produces no rent. Rent that arrives six months late produces six months of interest expense against nothing.
The company supplies land, power infrastructure, buildings, cooling, electrical systems, and physical operations. The tenant supplies the compute hardware and controls how it gets used. That division hands Cipher a specific and unusually clean risk profile at the operating layer.
Cipher carries no exposure to GPU obsolescence, no exposure to compute pricing, and no exposure to whether a given tenant's AI product succeeds commercially. Amazon can lose money on every workload running inside Black Pearl and Cipher still collects the rent. In exchange for shedding all of that, the company absorbs construction risk, financing risk, and concentration risk across a very small number of very large counterparties.
2.3 The Category Errors Worth Avoiding
Cipher is not a GPU cloud like CoreWeave, a full-stack AI cloud like Nebius, a mature diversified data center REIT like Equinix, or a semiconductor company. It is a developer-stage, lease-backed digital infrastructure owner, and analytical frames borrowed from any of those categories will mislead in predictable directions.
The most common error applies REIT logic to a company still inside its first full development cycle. Equinix does not need to raise billions of external equity to grow, does not carry a 1 billion share authorization it might approach, and does not depend on three tenants for the entirety of its contracted revenue. Applying stabilized REIT cap rates to Cipher assumes away the risks that determine the outcome.
The second error runs the opposite direction and values gross pipeline capacity as if the equity captures it. A 5.3 GW headline is not 5.3 GW of shareholder value. It is 5.3 GW of development opportunity requiring roughly $40 billion of capital that shareholders do not currently have.
3. The Scarcity Cipher Monetizes
3.1 The Constraint Is Not Capital
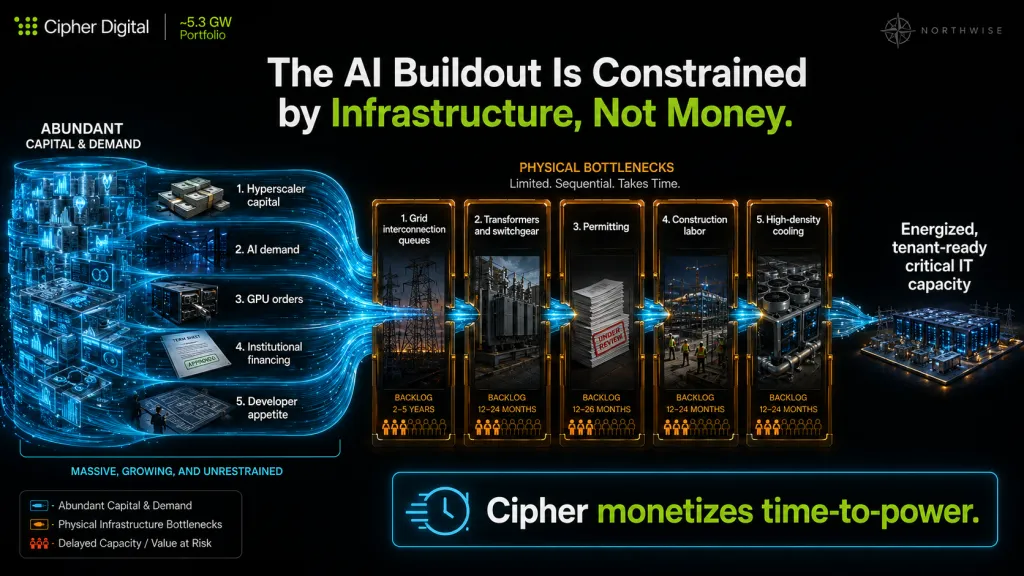
Data center capacity in 2026 is not limited by land, buildings, or money. It is limited by grid interconnection queues measured in years, transformer and switchgear lead times measured in quarters, permitting timelines that vary by jurisdiction and rarely improve, construction labor in a market bidding for the same crews, and cooling systems designed for densities that did not exist five years ago.
Capital is abundant. Energized megawatts with signed interconnection agreements are not, and that asymmetry is the entire reason a former Bitcoin miner can command 15-year leases from the largest technology companies in the world.
Cipher's ERCOT concentration reflects this directly. Texas offers interconnection timelines that other markets cannot match, a grid operator willing to work with large flexible loads, and land at prices that make 500 MW campuses economic. The sites are in Texas due to Texas being where the megawatts are available on a schedule hyperscalers can plan around.
3.2 Why Hyperscalers Outsource This
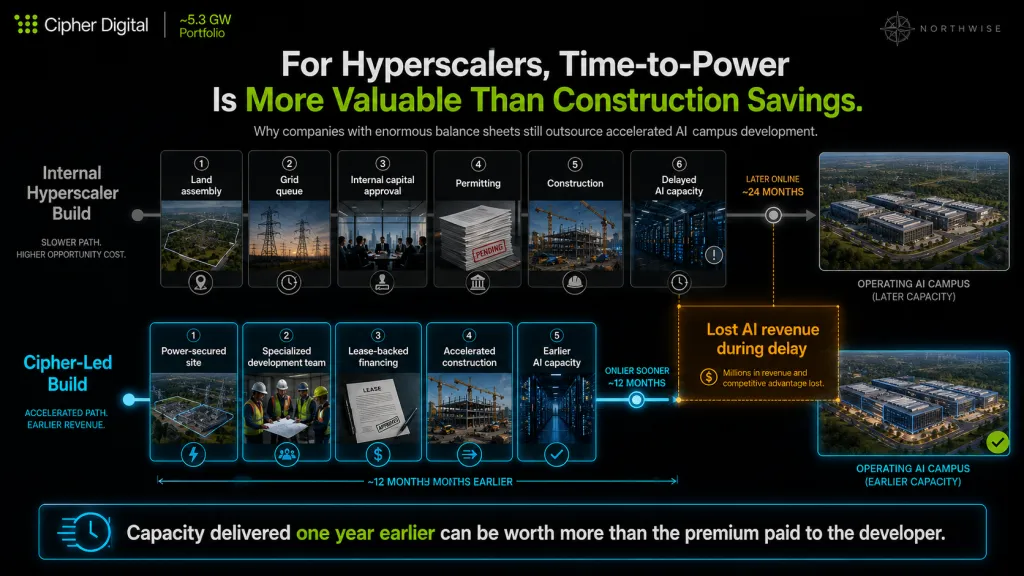
Amazon and Google could build every campus themselves and occasionally do. Using third-party developers preserves balance sheet flexibility, diversifies geography, transfers construction risk to a party that specializes in it, and provides access to power-secured sites the hyperscaler does not control and cannot easily assemble.
Speed carries the most weight. Capacity delivered a year early is a year of AI revenue a hyperscaler would otherwise forfeit, and against the revenue those companies generate per megawatt of deployed compute, the opportunity cost of delay dwarfs any premium paid to a developer. Cipher's acceleration of the first Black Pearl delivery is worth more to Amazon than the rent differential on the entire lease.
That dynamic explains why a developer who can compress schedules receives better lease terms, longer contracts, stronger tenant commitments, and cheaper project financing. It also explains why the window is competitive. Every developer in the market understands the same arithmetic.
3.3 The Leases as Credential
Amazon and Google do not sign or backstop 10 to 15 year agreements on optimism. Those commitments follow diligence on power access, engineering capability, construction execution, financial capacity, and operating reliability across the full lease term.
The contracted book therefore does two jobs. It produces roughly $793 million of average annualized NOI across the lease terms, and it certifies that Cipher can build and operate to hyperscale standards. The second job is what makes the remaining 4.6 GW of pipeline something other than a land bank.
One provenance note worth carrying forward. The $793 million figure is a company disclosure averaging across full lease terms extending well beyond 2030. Our model schedule of $686 million rising to $771 million covers the 2027 through 2030 window specifically, before later-year contractual escalators lift the average, and the two numbers should not be used interchangeably.
4. The Contracted Foundation
4.1 Three Campuses, Three Structures
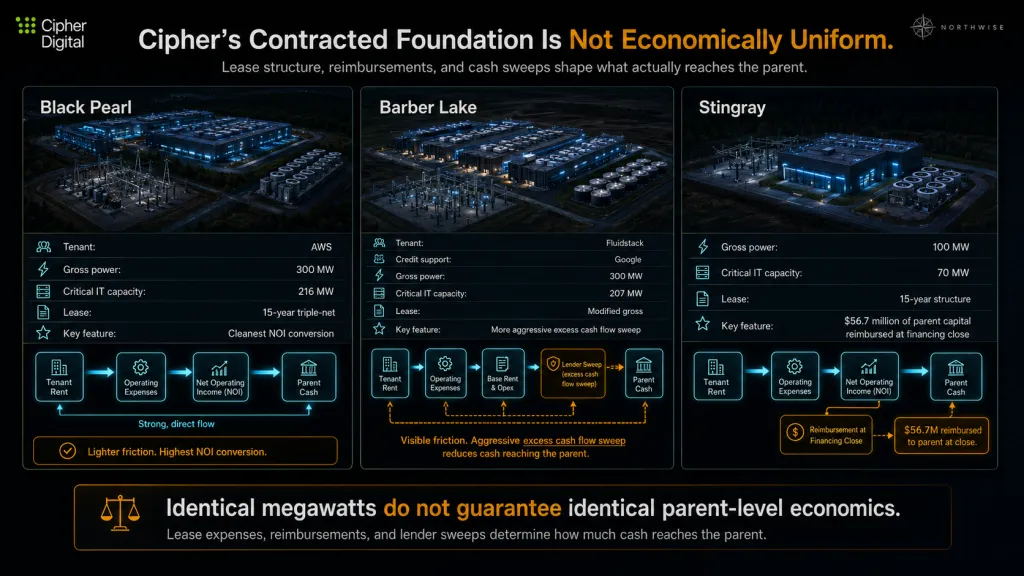
The contracted portfolio totals 700 MW of gross power and 493 MW of critical IT capacity. Those two figures differ by roughly 30%, and Section 6 explains why the second one is the one that matters. The three campuses were financed under materially different structures, which is itself informative about how Cipher negotiates.
Black Pearl is the AWS campus at 300 gross MW and 216 critical IT MW under a 15-year triple-net lease. Triple-net places the operating expense burden primarily with the tenant, which produces the cleanest NOI margin of the three. Cipher accelerated first delivery, starting the rent clock earlier and converting capitalized construction interest into project cash flow ahead of the original schedule.
Barber Lake carries Fluidstack as tenant with a Google backstop, at 300 gross MW and 207 critical IT MW across a phased delivery. The lease uses modified-gross economics and a more aggressive excess cash flow sweep than the AWS structure. That sweep is the single most consequential difference between the two, since it diverts project cash to lenders that would otherwise reach the parent.
Stingray is the smallest at 100 gross MW and 70 critical IT MW on a 15-year structure. Its financing reimbursed $56.7 million of parent capital at close, which is worth noting as the clearest published example of the reimbursement mechanism that keeps the corporate balance sheet from absorbing full development cost.
4.2 What the Contracted Core Actually Produces
We hold the contracted schedule nearly fixed across all three scenarios, since the leases, the debt, the coupons, and the amortization terms are documented in the financing presentations rather than assumed by us. The table below is close to the only part of this model that is not a forecast. Watch the relationship between the NOI line and the two lines beneath it.
Contracted core ($mm) | 2026 | 2027 | 2028 | 2029 | 2030 |
|---|---|---|---|---|---|
NOI | 97 | 686 | 727 | 749 | 771 |
Cash interest | 27 | 236 | 248 | 222 | 196 |
Principal and sweeps | 38 | 311 | 366 | 386 | 406 |
Ending project debt | 4,505 | 4,194 | 3,826 | 3,441 | 3,034 |
By 2030 the contracted core generates $771 million of NOI and pays out $602 million of it in interest and principal. Roughly 78 cents of every contracted NOI dollar goes to lenders, leaving $169 million of residual against a campus portfolio that cost billions to build.
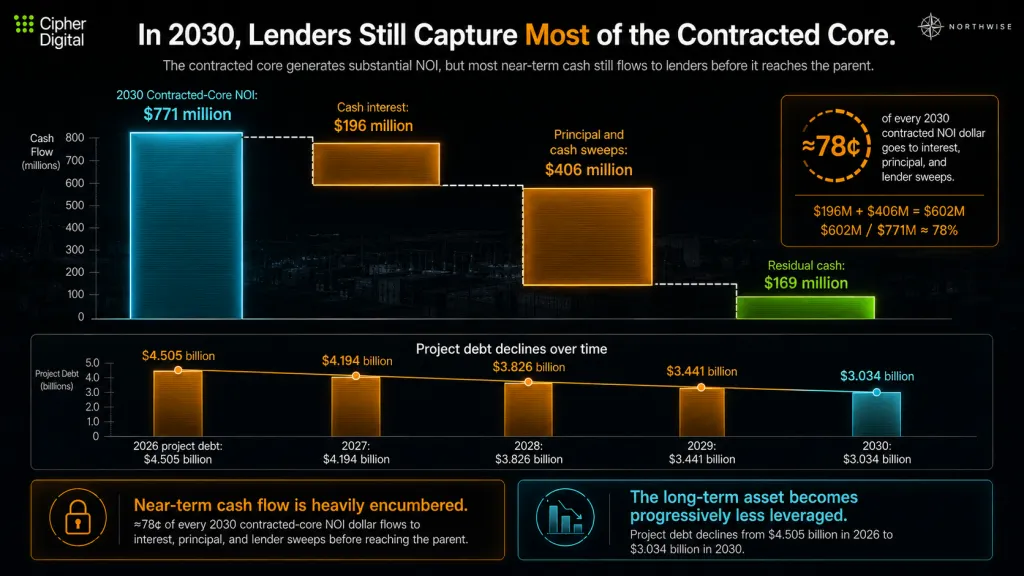
The deleveraging is real and it compounds. Project debt on the contracted core falls from $4.5 billion to $3.0 billion across the period, and cash interest falls from $248 million in 2028 to $196 million in 2030 as principal retires. A shareholder holding this asset into the 2030s inherits an increasingly unlevered stream. Getting there requires surviving the years when the sweeps are largest and the pipeline is consuming everything.
4.3 What Has Stopped Being Speculative
Six things are established rather than assumed. Hyperscale tenant demand exists at 300 MW scale. Leases can be executed on institutional terms with investment-grade counterparties. Project debt is available against those leases in the billions. Construction is active and delivering. Initial capacity has been accepted. Cipher can originate and secure sites at multi-hundred-megawatt scale.
That list would have read as speculation 18 months ago. Every item on it is now documented in a filing.
The open question is replication. Everything above describes 700 MW, and the investment case requires roughly 4 GW.
5. From 700 MW to 5.3 GW
5.1 Not All Megawatts Are the Same Megawatt
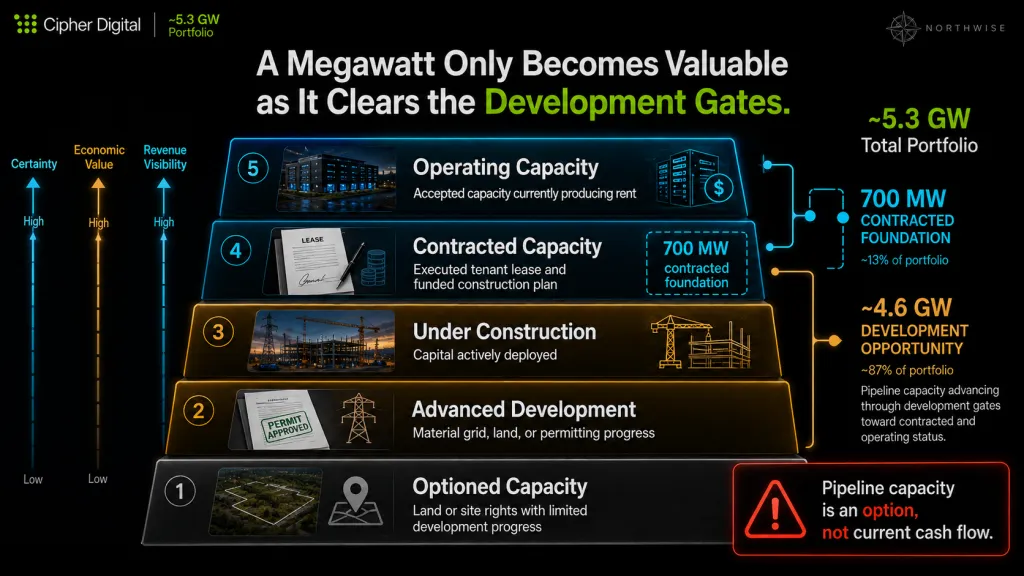
The most common failure in CIFR analysis is arithmetic performed on a 5.3 GW headline. Capacity exists in categories that carry entirely different economic weight, and combining them produces a number that means nothing.
Operating capacity generates revenue today. Contracted capacity has an executed lease and a funded construction program. Capacity under construction has capital actively deployed. Advanced development has material grid, land, or permitting progress and no tenant. Optioned capacity has secured rights and little else.
We never treat optioned megawatts as billable megawatts. A gigawatt of land holding a queue position is a genuinely valuable option, and it produces zero rent until a tenant signs and a lender funds. Odessa illustrates the discipline. The 207 MW mining site carries existing power infrastructure and real HPC conversion potential, and it receives no value in our capacity ledger without a signed lease and a financing plan.
5.2 The Sites That Decide the Decade
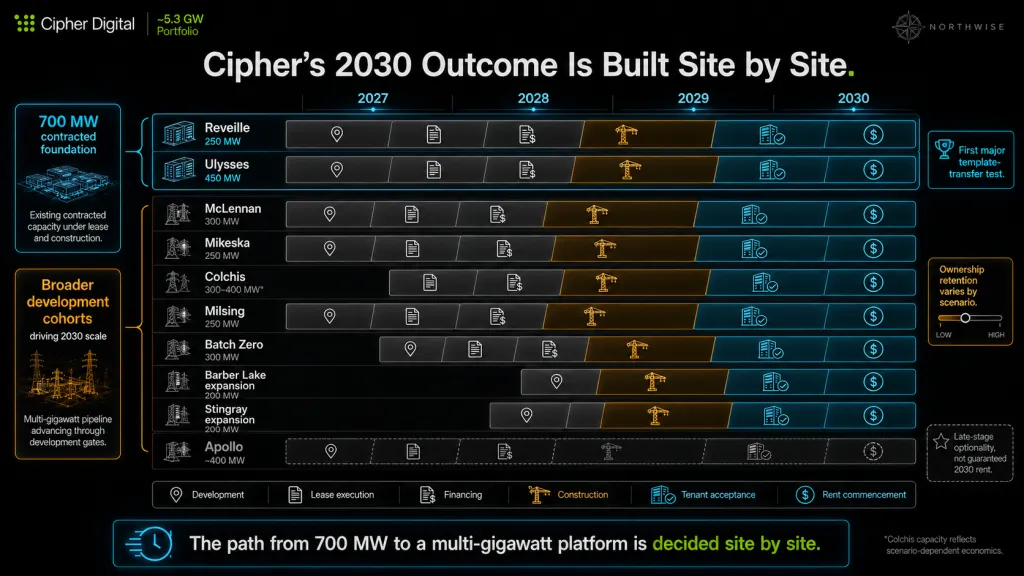
Reveille and Ulysses arrive in 2027 across all three scenarios and contribute 240 to 270 MW. Their importance exceeds their size. These are the first campuses where Cipher demonstrates that the Black Pearl template transfers to a new site without new tenants, new financing structures, or new engineering problems, and a clean delivery there compresses the perceived risk on everything behind it.
The large ERCOT cohort determines the 2028 through 2030 trajectory. McLennan and Mikeska each carry 500 MW in our central case. Colchis carries 1,000 MW across all three scenarios and differs only in how much of it Cipher owns. Milsing adds another 500 MW, and Batch Zero sits behind them as the next conversion test.
Colchis deserves separate attention as the only pipeline site where Cipher does not own 100% of the project economics. We assume 76% ownership in the bear case, 90% in base, and 95% in bull. Outside capital at the project level cuts both directions, reducing Cipher's required equity contribution and reducing its claim on the resulting NOI in the same proportion, which is why the variable belongs in the scenario set instead of being fixed.
Expansion capacity at Barber Lake and Stingray contributes 330 to 700 MW depending on scenario. Expanding a campus where interconnection, permitting, water, and construction logistics have already been solved once carries lower execution risk than greenfield development, and we treat those megawatts as marginally more probable than an equivalent block of new land.
Apollo is the newest addition, an option covering up to approximately 900 MW. We carry 80 MW in base and 630 MW in bull, and none in bear. Apollo expanded the opportunity set instead of replacing prior capacity, and we credit only the portion that could plausibly reach rent-bearing status inside a 2030 window given development lead times.
5.3 The Capacity Ladder and Why It Is Narrow
Our three scenarios resolve to a band most readers will find tighter than they expect.
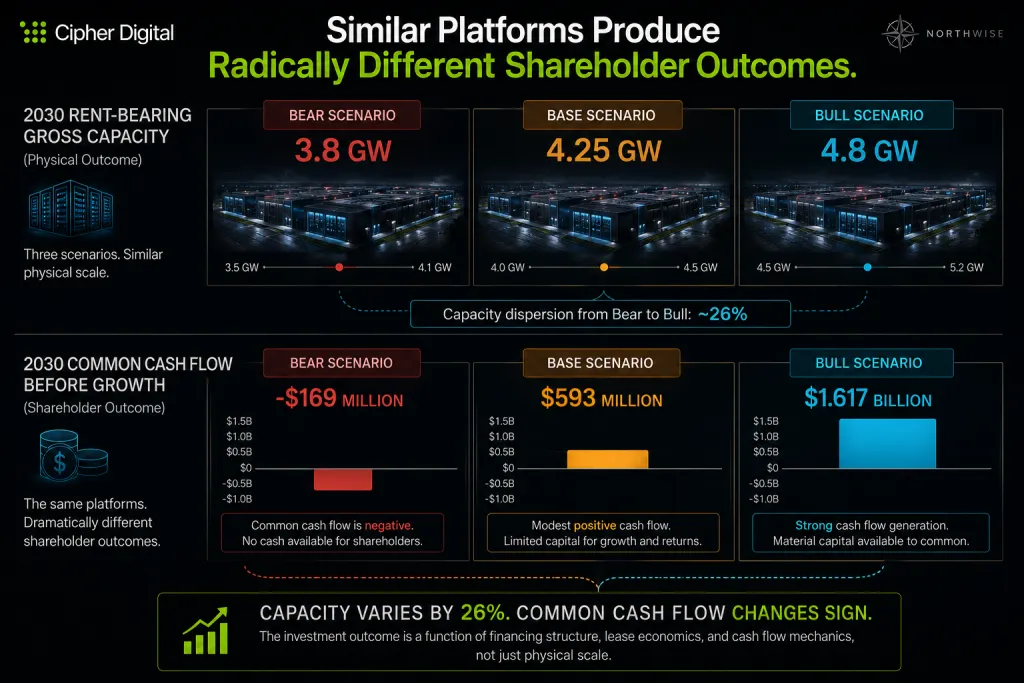
Rent-bearing gross MW | 2026 | 2027 | 2028 | 2029 | 2030 |
|---|---|---|---|---|---|
Bear | 700 | 940 | 1,900 | 2,800 | 3,800 |
Base | 700 | 970 | 2,200 | 3,500 | 4,250 |
Bull | 700 | 970 | 2,500 | 4,000 | 4,800 |
We considered a wider spread and rejected it. A bear case that assumed Cipher builds 1.5 GW would be modeling a company the filings do not describe, one where signed leases get terminated, funded construction stops, and a documented pipeline evaporates. That outcome is possible and it is not the normal downside for a business holding this contracted book.
The consequence is that this report's downside case cannot be reached through capacity failure. It has to be reached some other way, and the rest of the model is an argument about what that other way looks like.
6. How a Megawatt Becomes Cash
6.1 Gross Versus Critical IT
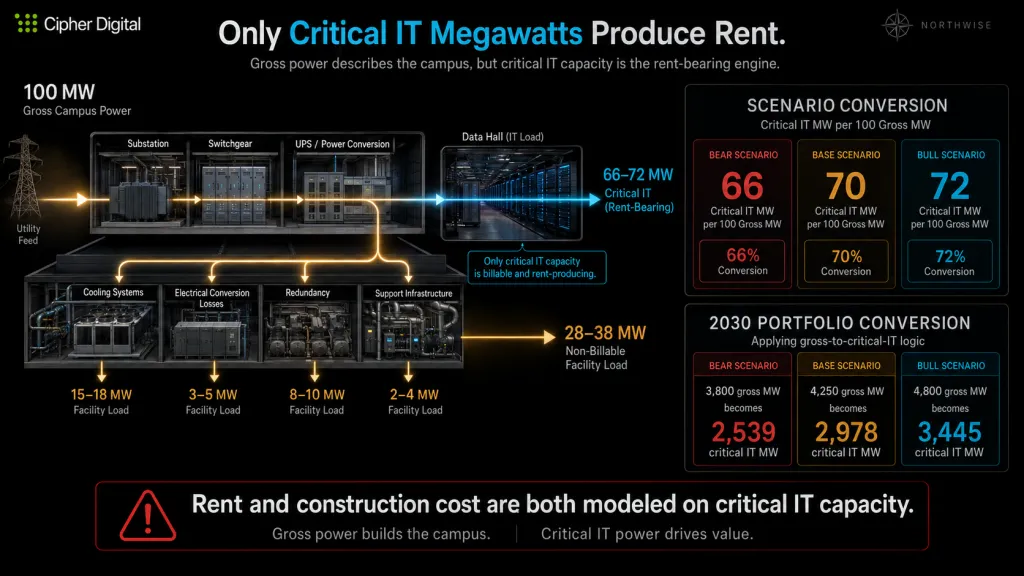
This distinction governs every revenue figure in the model and it is where casual analysis goes wrong by roughly 40%. Gross MW measures total campus power draw. Critical IT MW measures power actually delivered to tenant compute equipment. Cooling, redundancy, electrical conversion losses, and support infrastructure consume the difference.
Our conversion assumptions run 66% in bear, 70% in base, and 72% in bull, reflecting design efficiency, climate, cooling architecture, and contracted redundancy levels. Applied to the capacity ladder, 3,800 gross MW becomes 2,539 critical IT MW and 4,800 gross MW becomes 3,445 critical IT MW.
Rent is charged on critical IT capacity. Construction cost is incurred on critical IT capacity. Any valuation built on gross megawatts is overstating the asset by the inverse of the conversion factor.
6.2 Revenue Density and the Timing Problem
Critical IT MW multiplied by contractual NOI density multiplied by the billable period produces project NOI. Our pipeline density assumptions are $1.35 million per critical IT MW in bear, $1.50 million in base, and $1.62 million in bull, which sit near the economics implied by the contracted core.
That anchoring is deliberate. We assume Cipher signs future leases at terms broadly similar to the ones already executed, with modest degradation in the downside and modest improvement in the upside. Assuming materially better pipeline economics than the contracted core achieved would let optimism about the future rewrite what the company has actually demonstrated.
Billable timing carries more weight than most models allow. A campus energized in the fourth quarter of 2030 collects a fraction of a year's rent in 2030 while carrying a full year of interest. Our first-year billable fractions of 25% in bear, 50% in base, and 65% in bull capture both delivery timing within the year and the pace of tenant acceptance, and they explain why our 2030 full-year NOI sits well below the portfolio's stabilized run rate.
6.3 The Distance From NOI to a Shareholder
Project NOI is several layers above anything a shareholder receives, and naming the layers in order is the most useful thing this section can do.
Project NOI pays project interest. What survives pays scheduled principal. What survives that pays the excess cash flow sweep. The remainder is project residual, of which Cipher receives its ownership share, which then flows to the parent where corporate operating costs, cash taxes, parent interest, and replacement reserves take their portion. What is left is common cash flow.
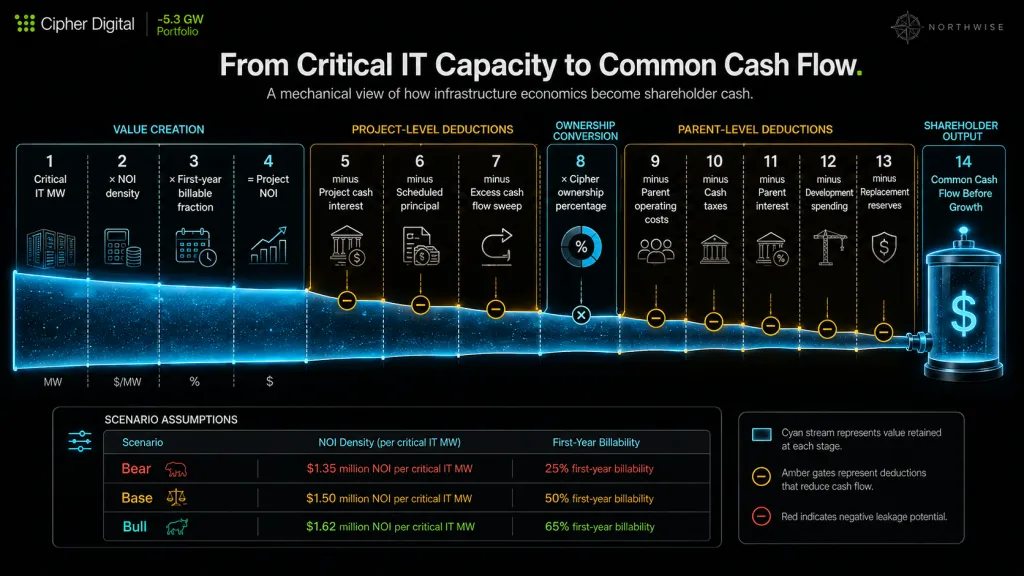
In our bear case, $2.86 billion of project NOI produces negative $169 million at the end of that sequence. In bull, $5.23 billion produces $1.62 billion. The conversion rate from NOI to shareholder cash runs from below zero to 31%, and nothing in the operating business explains that range.
7. The Financing Machine
7.1 How a Small Balance Sheet Builds a Large Platform
Cipher can construct tens of billions of dollars of infrastructure against a corporate balance sheet a fraction of that size due to where the debt sits. Project subsidiaries issue the debt, lenders underwrite the tenant lease, the project assets provide security, and the structure is ring-fenced from the parent. Proceeds fund construction and reimburse eligible sponsor capital, as the $56.7 million Stingray reimbursement demonstrated.
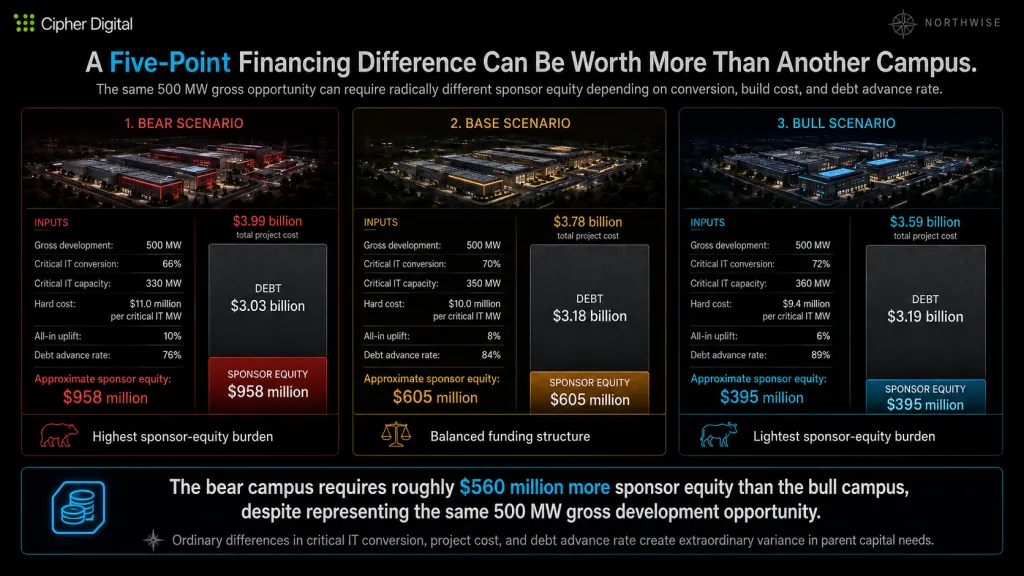
The advance rate determines how much parent equity each campus consumes, and it is the highest-leverage number Cipher negotiates. We assume 76% of all-in uses in bear, 84% in base, and 89% in bull. Against roughly $3.8 billion of all-in cost for a 500 MW campus in our central case, the difference between 76% and 89% is approximately $490 million of parent equity on that single site.
Coupons compound the same effect from the other direction. We carry 8.5% in bear, 7.1% in base, and 6.1% in bull on new project debt. Across $20 billion to $26 billion of terminal project debt, that spread moves annual cash interest by several hundred million dollars, which lands directly on distributions to the parent.
7.2 All-In Cost Exceeds Hard Cost
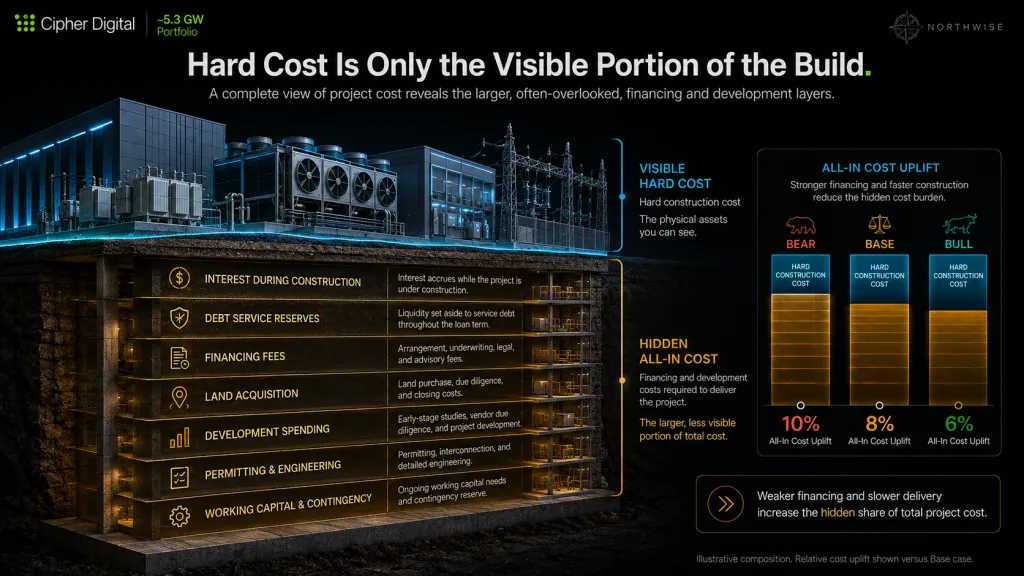
Hard construction cost is the number most models use and it understates the capital requirement. Our hard cost assumptions are $11.0 million per critical IT MW in bear, $10.0 million in base, and $9.4 million in bull, with all-in uplifts of 10%, 8%, and 6% respectively covering interest during construction, debt service reserves, financing fees, and land and development expense.
The uplift moves inversely to scenario quality for a reason. Cheaper debt means less capitalized interest, better execution means shorter construction periods, and stronger credit means smaller reserve requirements. One favorable assumption should not pay twice, and we were careful that the uplift schedule reflects the same financing terms already assumed elsewhere in the model instead of adding a second independent benefit.
7.3 The Capital Nobody Reimburses
Some parent capital is temporary and returns at financial close. Some is permanent project equity that stays in the structure for the life of the asset. Some is uncontracted development spending on sites that may never reach a lease, and that money never comes back from anyone.
Our model carries uncontracted development spend explicitly at $250 million cumulative in bear, $280 million in base, and $340 million in bull across 2026 through 2030. Bull spends the most, which is the correct relationship. A company converting sites successfully has more sites worth developing, and the spending is a cost of maintaining the pipeline that produces the upside.
Simplified CIFR models routinely omit this line. Doing so makes the parent's cash position look several hundred million dollars healthier than it is at exactly the moment the buildout is most capital-hungry.
8. Why Nonrecourse Debt Does Not Protect the Common Equity
8.1 The Residual Claim
Nonrecourse project debt limits direct recourse to the parent, matches debt service to lease cash flow, and permits development at a scale the corporate balance sheet could never support. Those are genuine structural advantages and they are the reason this platform is buildable.
They do not make the common equity safe, and the reason is that limiting recourse does not create cash. It only determines who can seize what when cash runs short. Shareholders still own the residual after project lenders, cash sweeps, corporate creditors, minority investors, convertible holders, warrant holders, and every new equity investor have been satisfied.
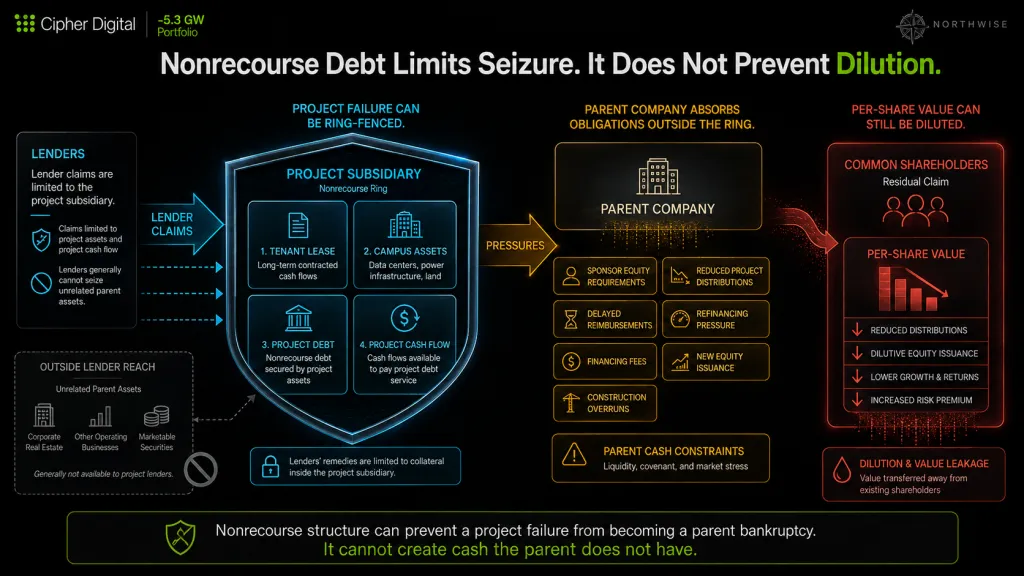
The equity absorbs sponsor equity requirements, delayed reimbursements, financing fees, construction overruns, reduced distributions, refinancing stress, and whatever share issuance liquidity preservation demands. Nonrecourse structure protects the parent from bankruptcy at a failed project. It offers no protection at all against dilution.
8.2 The Dilution Stack
A 414 million share company becomes something considerably larger by 2030 in every scenario. The stack below shows how, and the instructive part is how little of the variance comes from anything other than the final line.
Dilution source (mm shares) | Bear | Base | Bull |
|---|---|---|---|
June 30, 2026 shares outstanding | 414.3 | 414.3 | 414.3 |
Unvested service RSUs | 10.6 | 10.6 | 10.6 |
Remaining 2025 earned PSUs | 2.9 | 2.9 | 2.9 |
2026 executive PSUs | 0.5 | 2.2 | 4.9 |
Key provider PSUs | 0.1 | 0.1 | 0.3 |
Future awards through 2030 | 29.2 | 18.2 | 12.9 |
Google warrant | 24.2 | 24.2 | 24.2 |
2030 convertible shares | 38.8 | 38.8 | 38.8 |
2031 convertible net economic shares | 0.0 | 59.0 | 64.2 |
Pipeline funding shares | 447.4 | 112.9 | 8.3 |
Total diluted shares | 967.8 | 683.1 | 581.2 |
Pipeline funding shares account for 439 million of the 387 million share gap between bear and bull. Every other instrument combined moves in the opposite direction by enough to partially offset it, since a stronger stock triggers larger PSU payouts and richer convertible settlement. The financing line overwhelms all of it.
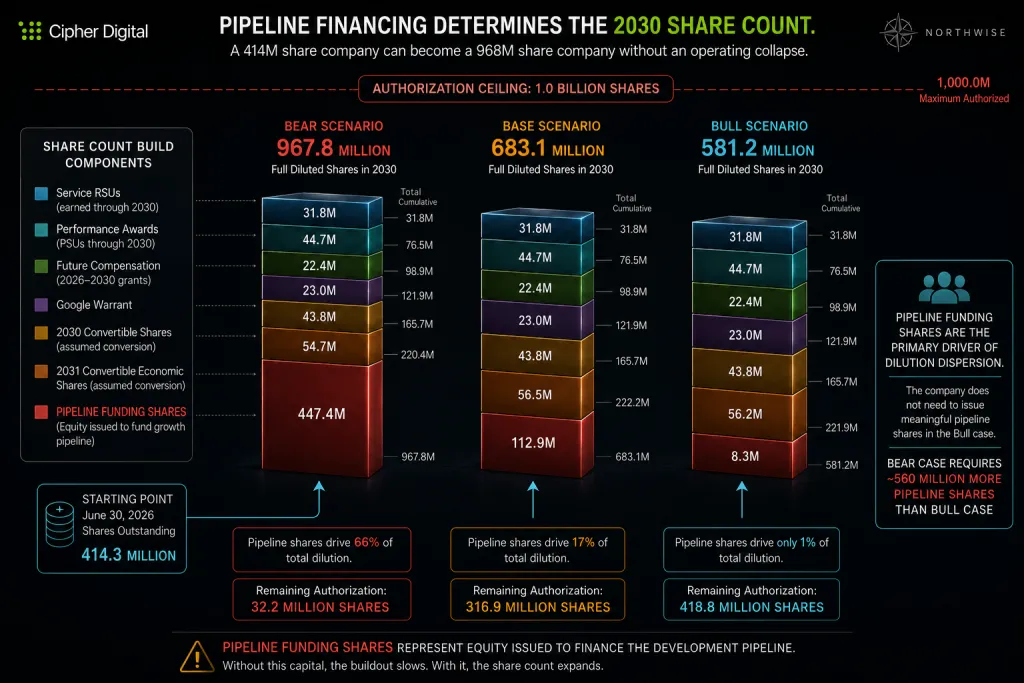
Two mechanics inside the stack are frequently mishandled. The Google warrant carries a baseline share count with a $430 million value threshold tested at the commencement date, so the top-up is a function of that test rather than the 2030 share price, and it remains a separate sensitivity sitting outside our figures. The convertibles cannot be counted as both debt and equity, so we treat the 2030 notes as converting to 38.8 million shares and carry the 2031 notes at net economic shares of zero in bear, 59.0 million in base, and 64.2 million in bull depending on settlement path.
8.3 The Loop That Produces the Bear Case
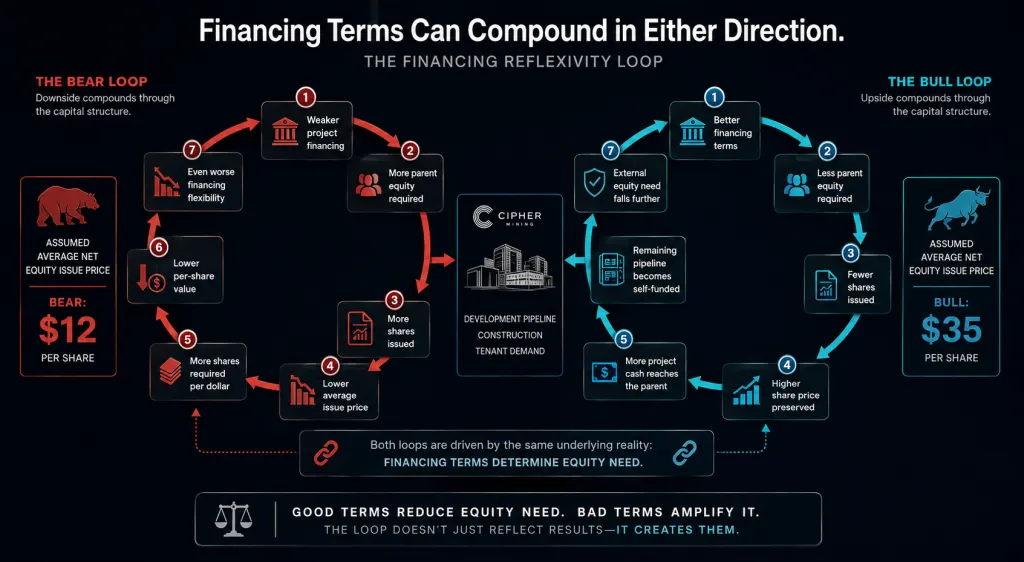
The downside in this model is reflexive, which is why it deserves more probability than a static reading of the contracted book suggests. Weaker financing terms require more parent equity. More parent equity forces more issuance. Issuance at a depressed price requires more shares. More shares depress the price further, and the next round is worse than the last.
Our average net equity issue price assumptions carry this directly: $12 per share in bear, $22 in base, $35 in bull. Bear needs $5.37 billion of external equity and issues 447 million shares to raise it. Bull needs $292 million and issues 8 million. The capital requirement differs by a factor of 18 while the platform differs by 26%.
The same loop runs in reverse and produces the upside. Better financing means less equity required, which supports the price, which means fewer shares per dollar raised, which preserves value per share and reduces the equity needed next time.
8.4 The Authorization Becomes a Real Constraint
Cipher has 1 billion authorized common shares. Our bear case ends 2030 with 967.8 million outstanding, leaving 32.2 million shares of headroom against a company still requiring capital.
This converts a valuation sensitivity into a governance problem. A company approaching its authorization must seek shareholder approval to increase it, accept more expensive financing, or slow the buildout, and all three of those happen at the worst possible moment. Base and bull end with 316.9 million and 418.8 million shares of headroom respectively, which removes the constraint entirely and is part of why those scenarios compound favorably.
9. The Q2 2026 Starting Point
9.1 The Cash Is Not What It Appears
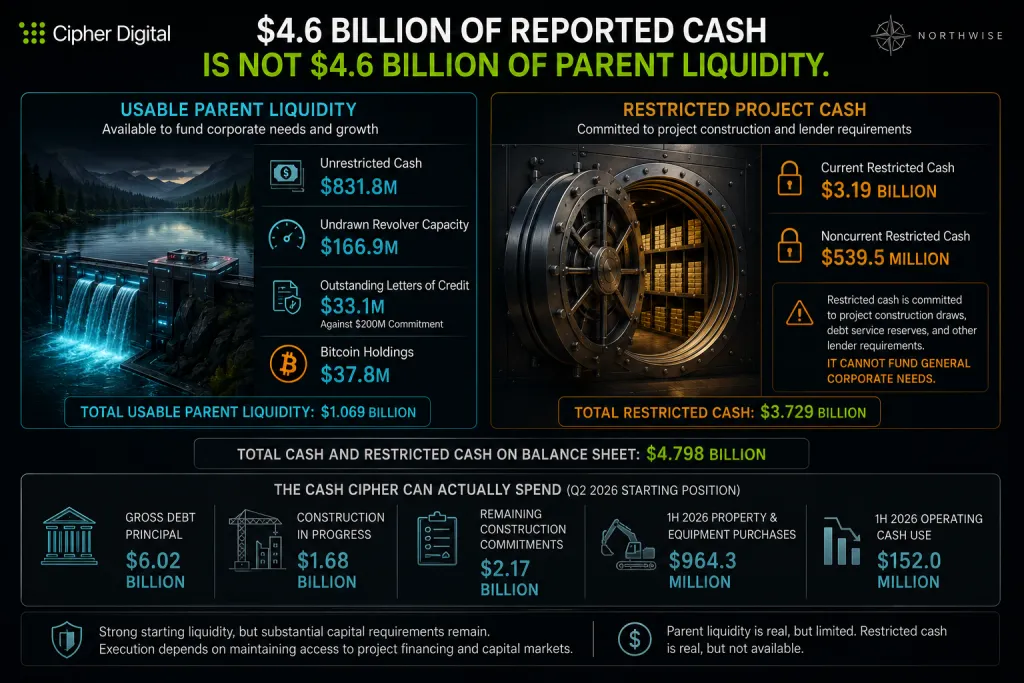
The August 4, 2026 Form 10-Q shows $831.8 million of unrestricted cash alongside $3.19 billion of current restricted cash and $539.5 million of noncurrent restricted cash. A reader adding those together arrives at roughly $4.6 billion of liquidity and a materially wrong conclusion.
The restricted balances sit inside project structures for construction draws and debt service reserves. They are committed to specific campuses under specific agreements and unavailable to the parent for corporate purposes. Practical corporate liquidity is the $831.8 million plus $166.9 million of undrawn revolver capacity, after accounting for $33.1 million of outstanding letters of credit against the $200 million commitment.
Bitcoin adds $37.8 million representing 646 coins, which rounds to nothing against a construction program of this size. Gross debt principal stands at $6.02 billion with only $94.5 million current, and common shares outstanding are 414.25 million.
9.2 A Balance Sheet Caught Mid-Transition
Property and equipment net is $2.13 billion with construction in progress at $1.68 billion. Remaining construction commitments total $2.17 billion, and first-half purchases of property and equipment reached $964.3 million against $152.0 million of operating cash use.
The ratio of construction in progress to completed property describes where this company sits in its cycle better than any other figure in the filing. Most of Cipher's asset base is not yet earning, and the earnings power everyone is underwriting has not started arriving.
9.3 Why the Income Statement Carries No Information
Q2 mining revenue was $24.8 million against $15.0 million of cost of revenue, with adjusted EBITDA at negative $30.0 million. HPC rent had not materially entered the reported income statement as of June 30, 2026.
Reported operating losses reflect staffing, development activity, depreciation on assets that have not begun producing, stock-based compensation, financing costs, and noncash fair-value movements on Bitcoin and warrants. Historical P/E and EPS on this company measure accounting convention applied to a construction project.
The filed statements describe a miner funding a buildout. The forward model describes a leveraged infrastructure landlord servicing $20 billion of project debt. Both are accurate, they describe different companies, and only the second one is the investment case.
10. The Northwise 2030 Operating Model
10.1 How the Model Is Built
The model runs in the same sequence as this report, which is deliberate. Gross capacity by site feeds gross-to-IT conversion, which feeds billable timing, which feeds NOI density, producing project NOI at the cohort level. Construction cost drives all-in uses, which split into project debt and sponsor equity according to the advance rate.
Debt service and sweeps then determine project residual by cohort and year. Cipher's ownership share of that residual flows to the parent, where corporate costs, taxes, and development spending are deducted, and any shortfall against a $200 million minimum liquidity floor is met with equity issued at the scenario's assumed price. That issuance produces the share count, and the share count meets the cash flow at the end.
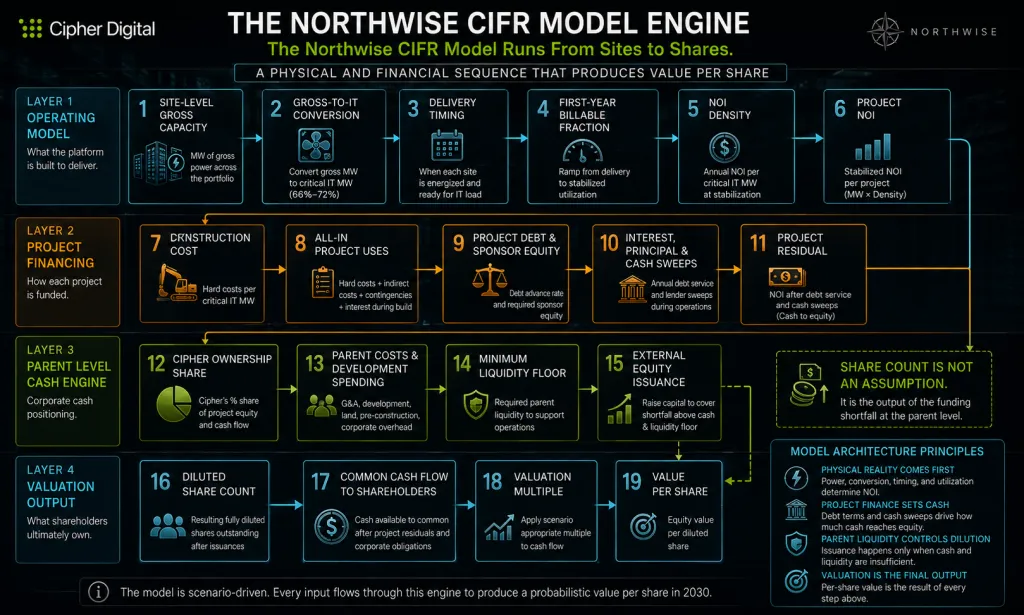
Every figure in this section is a calculated output of that chain. None of them is an independent estimate laid on top.
10.2 What We Held Fixed and What We Let Move
Four things stay relatively tight across scenarios: total rent-bearing capacity, contracted core performance, general tenant demand, and the long-term lease model. Documented evidence supports all four, and letting them swing widely would manufacture dispersion the filings do not justify.
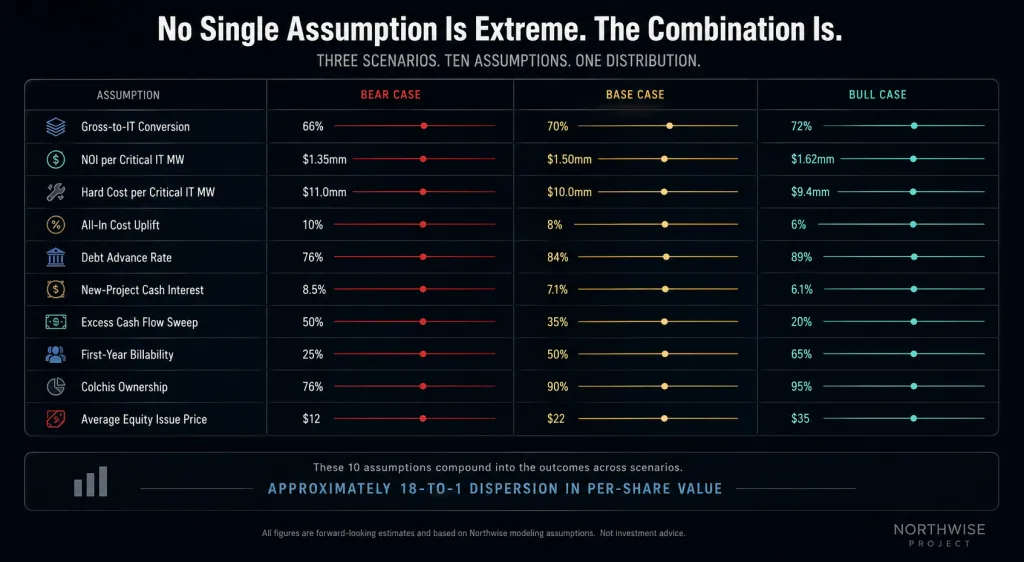
Eleven variables carry the actual spread: delivery timing, gross-to-IT conversion, NOI density, construction cost, debt advance rate, interest rates, cash sweeps, Colchis ownership, equity issuance price, convertible settlement, and resulting share count. Nine of those eleven are financing variables, which is the model telling us where the risk lives before we have said a word about valuation.
The full assumption set is worth studying for how unremarkable each individual line is.
Assumption | Bear | Base | Bull |
|---|---|---|---|
Gross-to-IT conversion | 66% | 70% | 72% |
Pipeline NOI per critical IT MW | $1.35mm | $1.50mm | $1.62mm |
Hard cost per critical IT MW | $11.0mm | $10.0mm | $9.4mm |
All-in cost uplift | 10% | 8% | 6% |
Project debt / all-in uses | 76% | 84% | 89% |
New project cash interest | 8.5% | 7.1% | 6.1% |
Excess cash flow sweep | 50% | 35% | 20% |
First-year billable fraction | 25% | 50% | 65% |
Colchis Cipher ownership | 76% | 90% | 95% |
Average net equity issue price | $12 | $22 | $35 |
No line above is extreme. A 66% conversion factor and a 72% conversion factor are both ordinary engineering outcomes. An 8.5% coupon and a 6.1% coupon both exist in today's project finance market. Compounded across 4 gigawatts and five years, those ordinary differences produce a per-share range of roughly 18 to 1.
10.3 A Discipline Note on Scenario Construction
We resisted the temptation to let strong scenarios win on every axis simultaneously. Bull already benefits from a higher advance rate, a lower coupon, better NOI density, and a smaller sweep, and each of those independently reduces the parent's equity requirement. Allowing it to also carry a materially larger portfolio than base would let one favorable view pay four times.
The same discipline applies in the other direction. Bear carries the highest future equity award count in the dilution stack, which looks counterintuitive until you notice that delivering a fixed dollar value of compensation requires more shares when the stock is depressed. The charge is a symptom of the scenario, not an additional insult layered onto it.
11. Three Versions of the Same Company
11.1 Bear: The Platform Works and the Shareholder Does Not
Cipher builds 3.8 GW. Tenants accept capacity, leases perform, and the contracted core deleverages exactly as documented. Nothing goes wrong that an operator would recognize as going wrong.
Project financing arrives at a 76% advance rate and an 8.5% coupon, and the excess cash flow sweep takes half of what remains after debt service. Project distributions to the parent reach only $111.6 million in 2030 against $2.86 billion of project NOI. The parent needs $5.37 billion of external equity across the period and raises it at an average net price of $12.
Diluted shares reach 967.8 million, leaving 32.2 million of authorization. Common cash flow before growth runs negative $169 million, and parent-level refinancing debt of $1.3 billion carries $124 million of annual cash interest by 2030. The most instructive coverage figure in the entire model appears here: NOI divided by cash interest plus principal comes to 1.04x, meaning the asset base covers its own debt service with a 4% margin and produces essentially nothing above it.
11.2 Base: A Scaled Infrastructure Owner With an Ordinary Return
Most of the portfolio converts, financing stays available on constructive terms, and dilution is meaningful without becoming reflexive. Cipher builds 4.25 GW and generates $4.10 billion of project NOI, with $732.8 million reaching the parent in 2030.
External equity totals $2.48 billion at an average $22 net price, producing 112.9 million pipeline funding shares and 683.1 million total diluted shares. Common cash flow before growth reaches $593.4 million. Coverage improves to 1.24x on NOI against interest plus principal, and interest coverage alone reaches 2.72x.
This is a company that has succeeded by any operating standard. Whether that success translates into an attractive return from today's price is a separate question, and the premium sections answer it.
11.3 Bull: Self-Funding Arrives Before the Buildout Ends
Delivery runs early, project leverage reaches 89%, NOI density improves to $1.62 million per critical IT MW, and the sweep falls to 20%. Cipher builds 4.8 GW and generates $5.23 billion of project NOI.
The mechanism that separates this scenario is timing rather than magnitude. Project distributions reach $735.0 million by 2028 and $1.72 billion by 2030, which largely self-funds the remaining pipeline. External equity across the entire five-year period totals $292 million, all of it issued in 2028, and the company issues nothing in 2029 or 2030.
Diluted shares stay at 581.2 million. Common cash flow before growth reaches $1.62 billion, parent liquidity ends at $1.13 billion instead of the $200 million floor, and 418.8 million shares of authorization remain unused. A company that stops needing external capital before its buildout finishes has crossed into a different category of business.
11.4 The Comparison That Contains the Argument
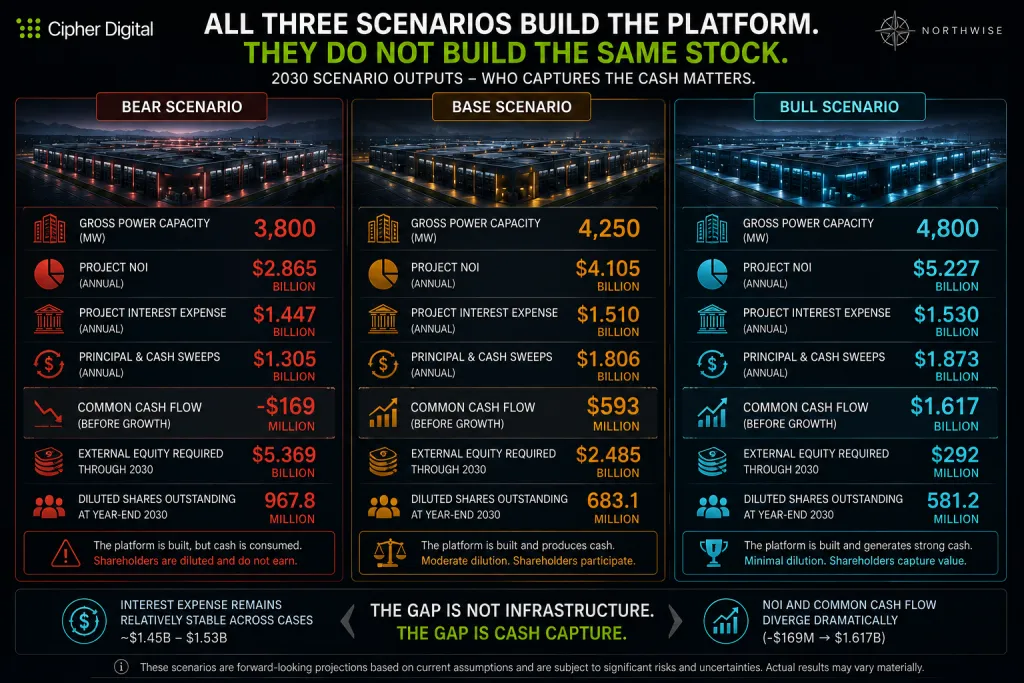
Read across the project NOI line, then read across the common cash flow line, and the report's controlling idea appears without commentary.
2030 metric | Bear | Base | Bull |
|---|---|---|---|
Rent-bearing gross MW | 3,800 | 4,250 | 4,800 |
Critical IT MW | 2,539 | 2,978 | 3,445 |
Full-year project NOI ($mm) | 2,864.9 | 4,104.8 | 5,226.6 |
Cash EBITDA ($mm) | 2,748.9 | 3,986.8 | 5,103.6 |
Project cash interest ($mm) | 1,447.4 | 1,510.2 | 1,529.9 |
Project principal and sweeps ($mm) | 1,305.2 | 1,806.3 | 1,873.2 |
Common cash flow before growth ($mm) | (169.4) | 593.4 | 1,616.5 |
Ending project debt ($mm) | 20,337.5 | 23,058.4 | 26,514.6 |
Adjusted net debt ($mm) | 20,115.6 | 21,359.6 | 23,657.8 |
External equity required 2026-2030 ($mm) | 5,368.7 | 2,484.5 | 291.7 |
Diluted shares (mm) | 967.8 | 683.1 | 581.2 |
Project cash interest varies by 5.7% across the three scenarios while project NOI varies by 82%. Bear carries nearly as much interest expense as bull on a platform producing barely half the income, which is what a low advance rate and a high coupon look like when they appear in the same scenario.
The model is not forecasting whether Cipher builds data centers. All three cases build them, and the narrowest still delivers 3.8 GW. It is forecasting who ends up owning the cash they produce.
12. The Bear Case in Its Strongest Form
12.1 The Argument We Take Seriously
A serious short case on CIFR does not require AI demand to disappoint, and the versions that lean on Bitcoin or on quarterly GAAP losses are not worth engaging. The strong version runs differently and deserves to be stated in its own register.
Cipher is a development company being valued as an infrastructure owner. It has delivered one campus and contracted three, and the market is capitalizing 5.3 GW of largely optioned capacity as though the conversion is a formality. Development companies fail in the middle, after the capital is committed and before the cash flow arrives, and Cipher is entering the widest part of that gap with $831.8 million of usable corporate cash against a program requiring tens of billions.
The financing is where the argument sharpens. Project debt at 84% of all-in cost sounds conservative until you notice that the remaining 16% on 4 gigawatts is roughly $6 billion of equity the parent does not have, and every dollar of it must come from distributions that lenders sweep first or from shares issued into whatever price the market offers. The excess cash flow sweep is the mechanism most investors overlook. It is specifically designed to keep project cash away from the parent during exactly the years the parent needs it most.
The dilution then does the rest. A company with 414 million shares and a 1 billion authorization has room for one financing cycle at a poor price and no room for two. Concentration compounds it, since three tenants carry the entire contracted book, and a single counterparty renegotiation or delivery dispute at a 300 MW campus reshapes the credit profile of a company with no diversification to absorb it.
The conclusion follows without requiring anything to go badly wrong operationally. Cipher builds a real 4 gigawatt platform, lenders and minority partners and new shareholders capture the returns it generates, and the original common shareholder funds the construction of an asset somebody else ends up owning.
12.2 Where We Part Company
Large portions of that argument sit inside our model, which is why our bear case carries 30% weight instead of appearing as a footnote. The sweep is why bear distributions reach only $111.6 million in 2030 on $2.86 billion of NOI. The dilution mechanism is why bear ends with 967.8 million shares and 32.2 million of headroom. The 1.04x coverage figure is the short case expressed in our own arithmetic.
We part company on two points. The first is that the argument treats financing terms as fixed when they are responsive to demonstrated execution. Cipher's advance rates and coupons on Barber Lake and Stingray already improved relative to earlier structures, and a developer with a delivery record prices differently than a developer with a plan. The short case assumes the worst terms persist across every campus for five years, which requires the credit market to learn nothing from four years of performance.
The second is timing. The bear case is a cash flow gap argument, and gaps close when distributions arrive. Our bull case reaches $735.0 million of project distributions by 2028 and stops requiring external equity entirely after that year. The difference between that outcome and the bear outcome is roughly 24 months of delivery schedule, which is a real risk and a considerably narrower one than the short case implies.
What we do not dispute is the shape. The downside here is severe, it is financing-driven, and it does not require anyone to be wrong about AI.
13. What Moves the Model
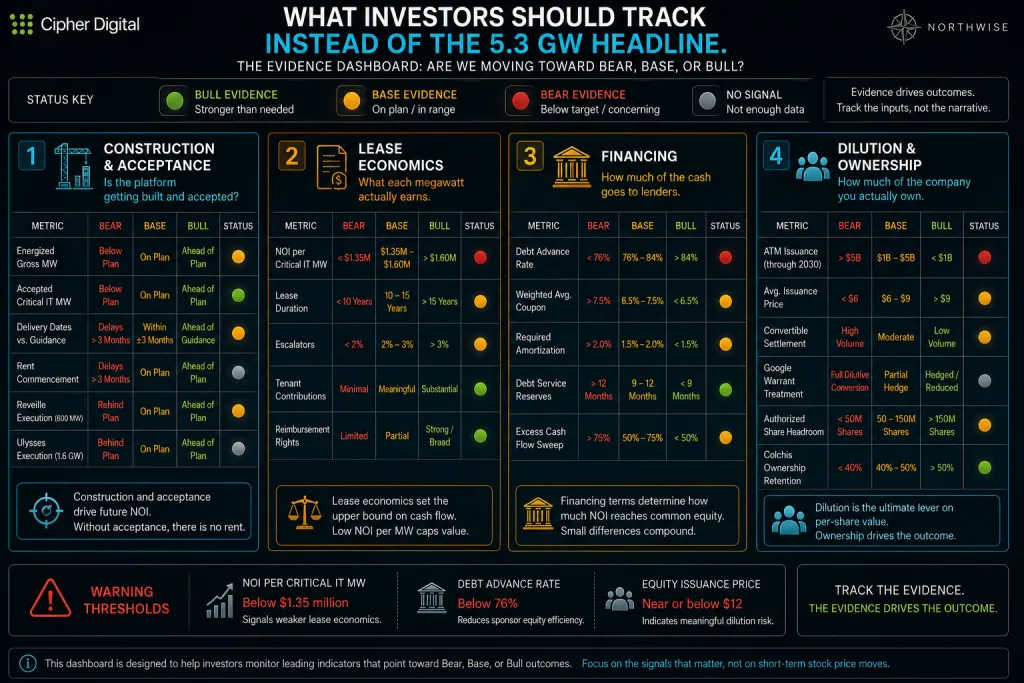
13.1 The Evidence Worth Tracking
Construction and acceptance come first, since acceptance is the gating event and construction completion without it produces interest expense against no revenue. Watch energized gross MW, accepted critical IT MW, delivery dates against guidance, and rent commencement. Reveille and Ulysses in 2027 are the first clean read on template transfer, and Batch Zero results, interconnection agreements, land option exercises, and construction starts across the ERCOT cohort are the second.
New lease economics move the model through NOI per critical IT MW, duration, escalators, tenant contribution, and reimbursement rights. A single 500 MW campus signed at $1.62 million per critical IT MW instead of $1.35 million moves 2030 NOI by roughly $95 million before any change in capacity.
Financing terms move it further and faster. The advance rate, the coupon, required amortization, debt service reserve sizing, and the sweep percentage each land directly on parent equity requirements. A 5-point improvement in advance rate across the remaining pipeline is worth more to shareholders than an additional 500 MW at bear-case terms.
Dilution and ownership close the loop. Track ATM issuance and the price at which it occurs, convertible settlement decisions, any Google warrant top-up, and remaining authorized headroom. Retained ownership at Colchis and at any future partnered site determines how much consolidated project NOI is actually attributable to Cipher shareholders, and consolidated figures will overstate the shareholder claim wherever outside capital sits in the structure.
13.2 The One Ratio That Contains the Rest
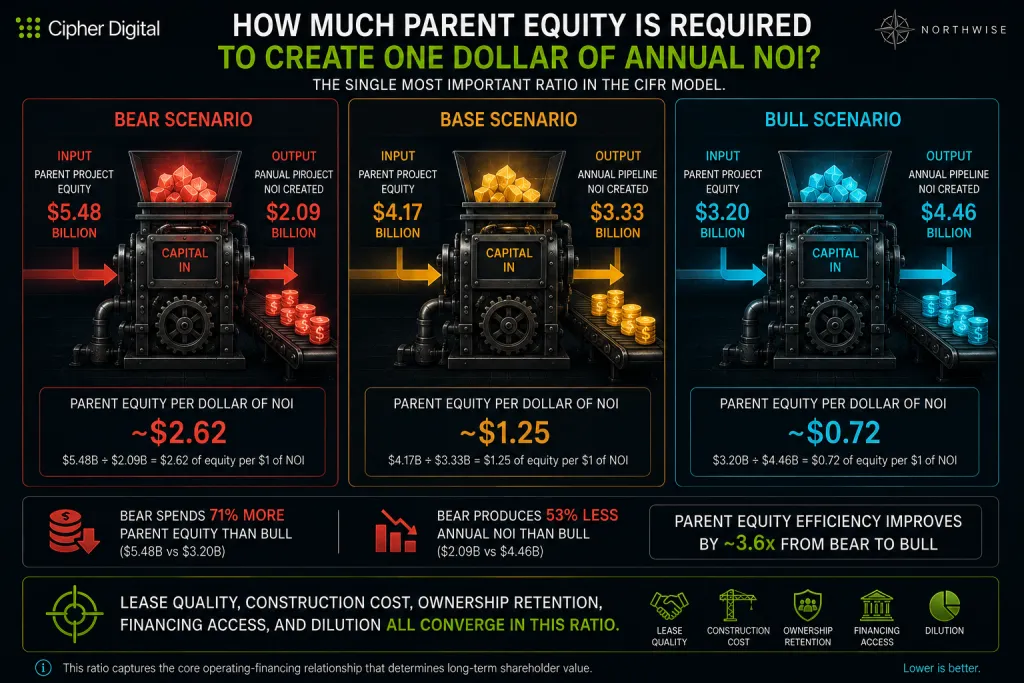
The most important variable in this analysis is not gross pipeline megawatts. It is the amount of parent equity required for each new dollar of project NOI, which combines lease quality, financing access, construction efficiency, ownership retention, and dilution into a single number.
In our base case, Cipher contributes roughly $4.17 billion of project equity across 2027 through 2030 to build $3.33 billion of annual pipeline NOI. In bull, $3.20 billion of project equity builds $4.46 billion. In bear, $5.48 billion builds $2.09 billion.
Bear spends 71% more parent equity than bull to produce 53% less NOI. Every other figure in this report is commentary on that ratio, and an investor who tracks only one thing should track that one.
13.3 What Would Break the Thesis
The thesis does not break due to Bitcoin weakness, noisy quarterly GAAP results, high depreciation on assets that have not started earning, or construction temporarily consuming cash. All four are expected features of a company at this stage and none of them touch the chain from site rights to shareholder value.
It breaks if Cipher repeatedly fails to convert power-secured sites into contracted and financed capacity. That failure shows up as slipping delivery dates across multiple campuses, leases signed below $1.35 million per critical IT MW, advance rates below 76%, or equity issued near the $12 bear assumption.
The subtler failure mode is the one worth watching more closely. Cipher can convert sites successfully, deliver on schedule, and still hollow out the equity by financing each campus slightly worse than the last while the share count compounds. That path produces impressive press releases and a deteriorating investment for four straight years, and it is the reason we weight the downside as heavily as we do.
The free portion of this report ends here. We have built the operating model in the open: the portfolio and what counts as capacity, the contracted economics, the unit economics of a critical megawatt, the financing structure and the dilution stack, the filed Q2 2026 position, the complete 2030 outcome across three scenarios, the strongest version of the bear case, and the evidence that moves each variable. A reader who stops here has the full architecture and enough to form an independent view.
The Premium Work: Valuation, Price Targets, and the Action Framework
What follows is the part of this report that takes the most labor and the most judgment, and it is the part we reserve for the members who fund our work.
Everything above stands on its own. The premium sections answer the question the model was built to answer: what is a 4 gigawatt lease-backed platform with a leveraged capital structure actually worth to the person holding the common stock, and at what price does owning it make sense.
They hold the multiples and cap rates by method and scenario with the reasoning behind each, the per-share output of all three valuation approaches, why the weightings shift across scenarios, the probability assignment and our defense of it, the weighted 2030 value, the required-return ladder showing maximum entry price at every hurdle from 10% to 30%, and the Northwise rating zones from Strong Buy through Strong Sell.
Premium members also receive the workbook itself. Every figure in this report traces to a live cell in a 12-tab model built from the filed Q2 2026 Form 10-Q, the three project financing presentations, and the FY2025 Form 10-K, with a source tab citing each document by URL and a checks tab that must read PASS across all three scenarios before we publish anything.
The workbook is downloadable and the assumptions tab is editable end to end. A member who thinks our 84% advance rate is generous, our $22 average issue price is optimistic, or our 90% Colchis ownership is wrong can change the input and watch the capacity ledger, the cohort engine, the funding bridge, the dilution stack, and the 2030 valuation recompute against their own view. Research that cannot be tested is an opinion carrying footnotes, and we would rather hand a member the machine than ask them to trust the output.
CIFR is a name where the difference between a Hold and a Buy comes down to variables a reader can now adjust themselves. Premium membership is what funds the quarterly model rebuilds, the site-by-site updates as campuses convert, and the next teardown at this depth.
Northwise Premium
Choose how to continue with Northwise
Join Northwise Premium
Unlock the rest of this report, its complete valuation, the downloadable model, portfolios, and action framework.
Join Northwise PremiumCreate a Free Account
Continue across Free Northwise research, follow companies, save reports, and receive updates.
Create a Free Account
CIFR Barber Lake Site
Barber Lake: Fluidstack's contracted capacity, phased delivery, Google's support and the September update on Colorado City's water infrastructure.

CIFR Stock Black Pearl Site
Black Pearl: initial AWS capacity delivered and rent begun, remaining construction, the lease structure and the limits of the public technical record.
CIFR Stock Forecast 2030
CIFR Stock Forecast 2030 models Cipher Digital’s AI data center ramp, contracted HPC capacity, dilution risk, and fair value.
Northwise Portfolios
See how the research becomes real decisions
Reader discussion
Discuss the research
Premium access is required to join this report's discussion.
Join Northwise Premium
No comments yet. Start a thoughtful discussion.