
RKLB Stock Forecast 2030: Pricing the Full-Stack Space Company
Rocket Lab stock forecast to 2030: launch, Space Systems, Iridium, dilution and six valuation scenarios with a probability-weighted RKLB price target.
In this article
A premium valuation framework for Rocket Lab through 2030, built from launch cadence upward through Space Systems execution, the Iridium transaction, financing, dilution, and what enterprise value finally leaves for a single share.
Executive Summary
Most people meet Rocket Lab through a video. A small black rocket lifts off a green peninsula at the bottom of the world, the camera holds until it becomes a point of light, and the New Zealand coastline falls away beneath it. The footage is accurate. It stopped describing the company several years ago.
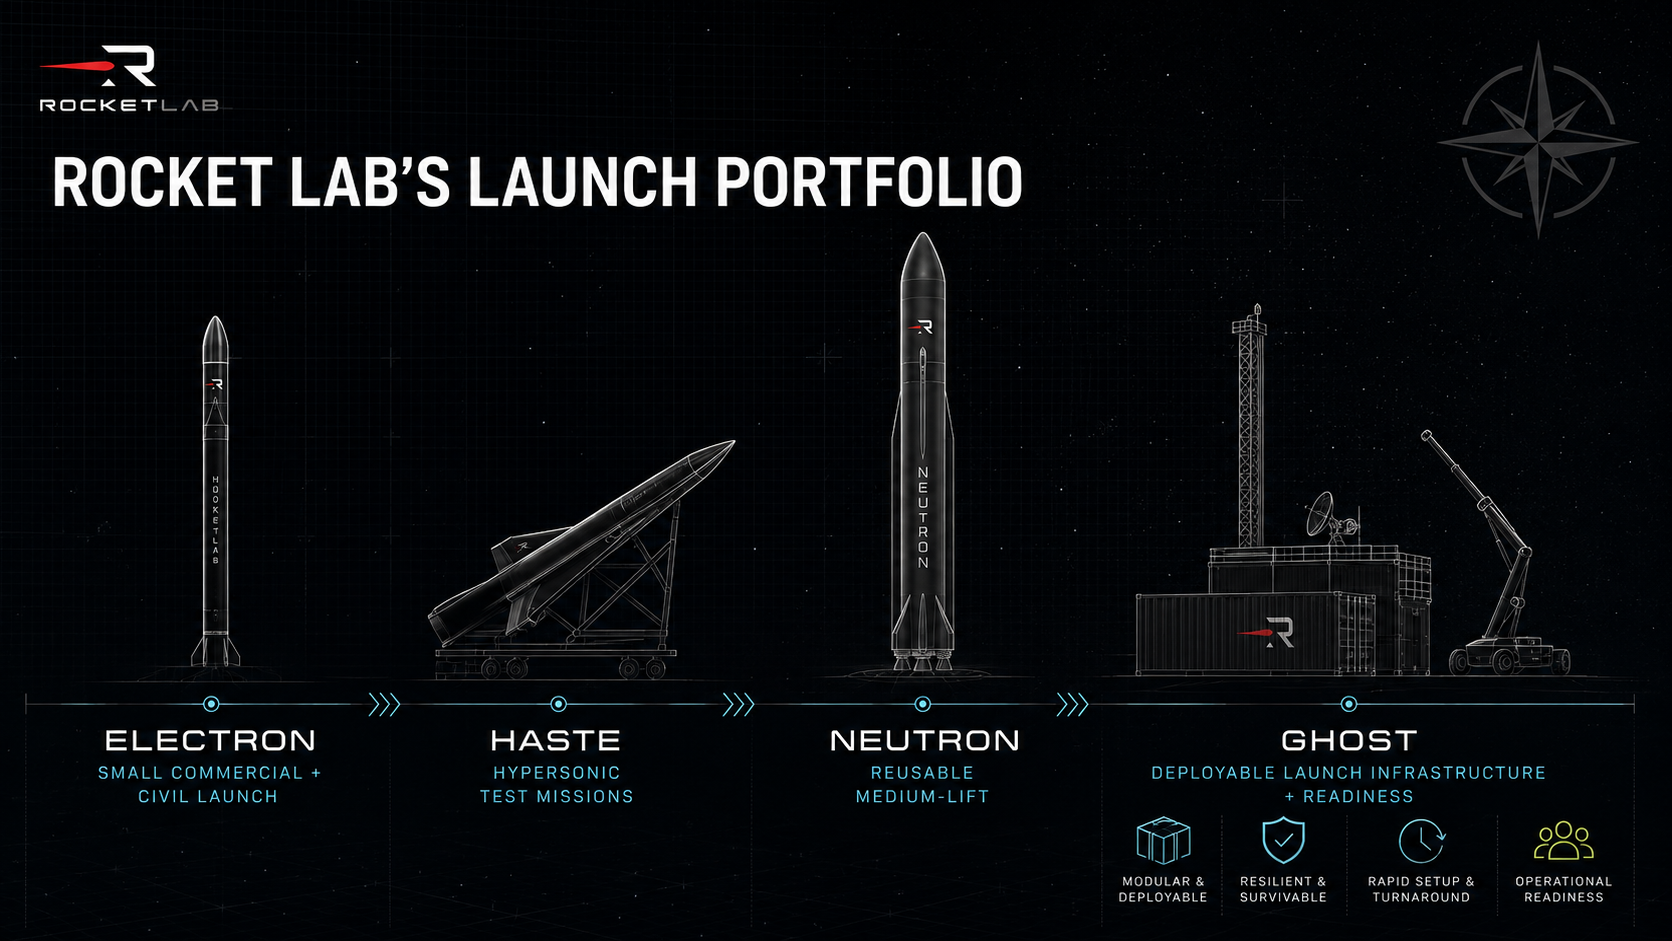
Walk through everything Rocket Lab now does and the launch pad becomes one room in a much larger building. A factory in Long Beach turns out Electron vehicles at a cadence no other small-launch provider has matched. A suborbital variant flies hypersonic test payloads for the defense community. A reusable medium-lift rocket sits in final qualification at Wallops.
Solar cells, star trackers, and separation systems ship to companies that compete with Rocket Lab for launch contracts. Complete spacecraft are built under government prime contracts and flown from Rocket Lab's own control rooms. Laser communications terminals come off a line in Germany. And a pending acquisition would hand the company a global satellite network carrying spectrum that no amount of capital can recreate.
Launch is still the introduction. It has not been the economics for some time.
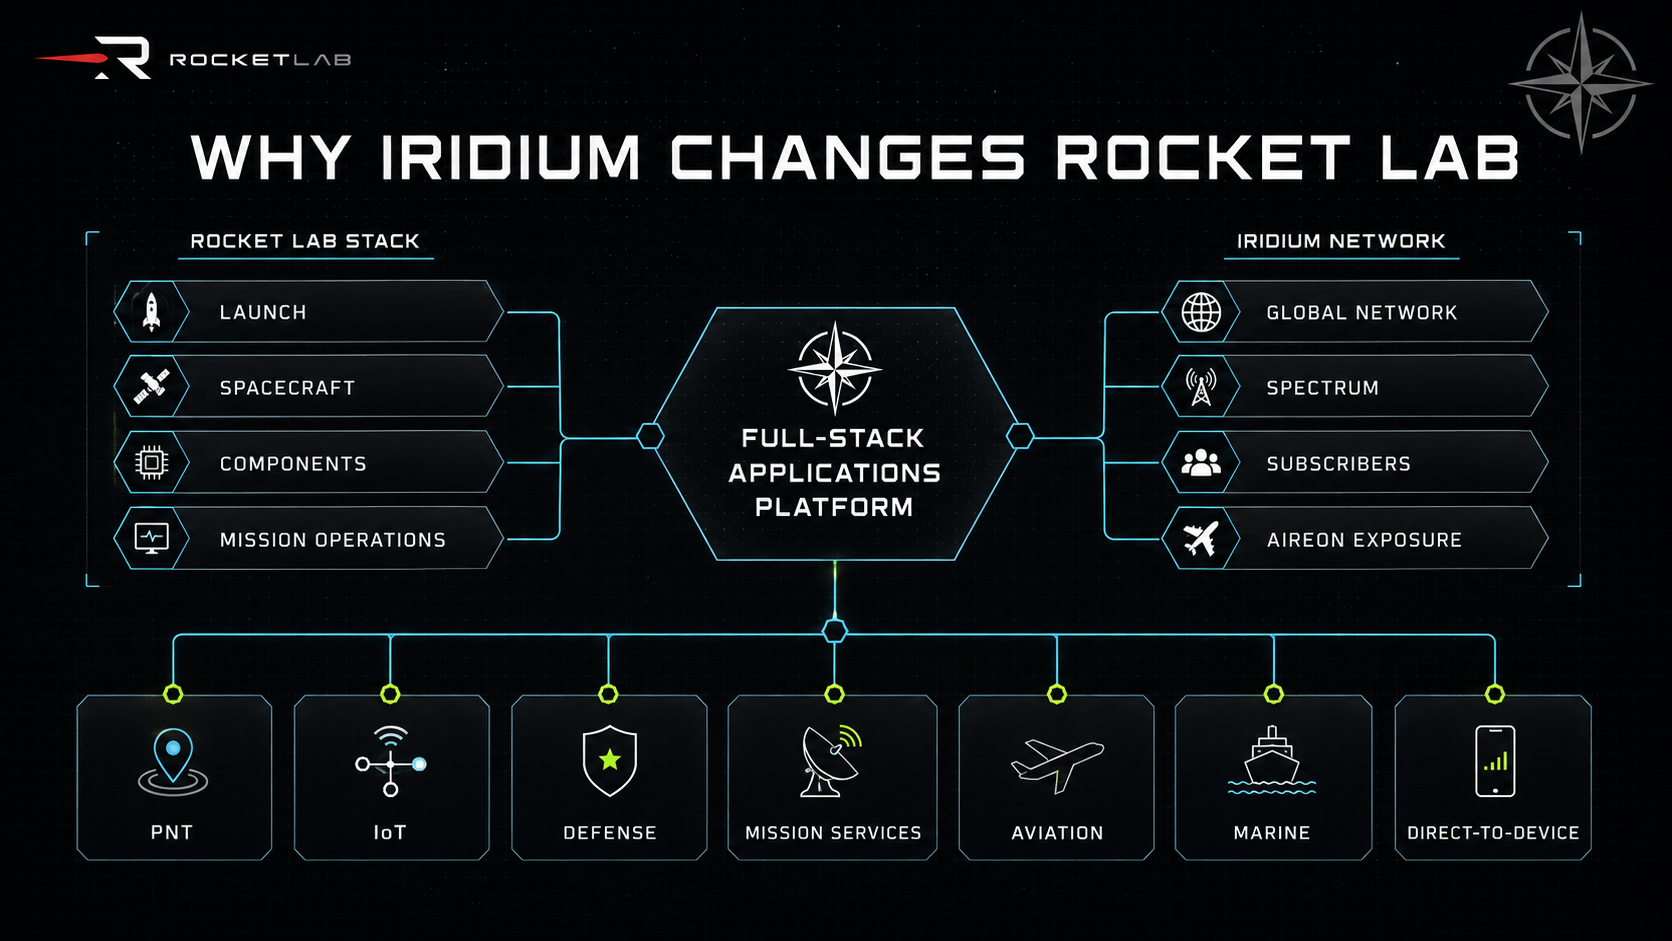
What the company is attempting is easy to state and brutally hard to execute. Rocket Lab wants to build the physical infrastructure of space, launch that infrastructure on its own vehicles, operate it once it arrives, and sell services through it for a decade afterward. Four activities that historically belonged to four separate companies are being pulled inside one balance sheet.
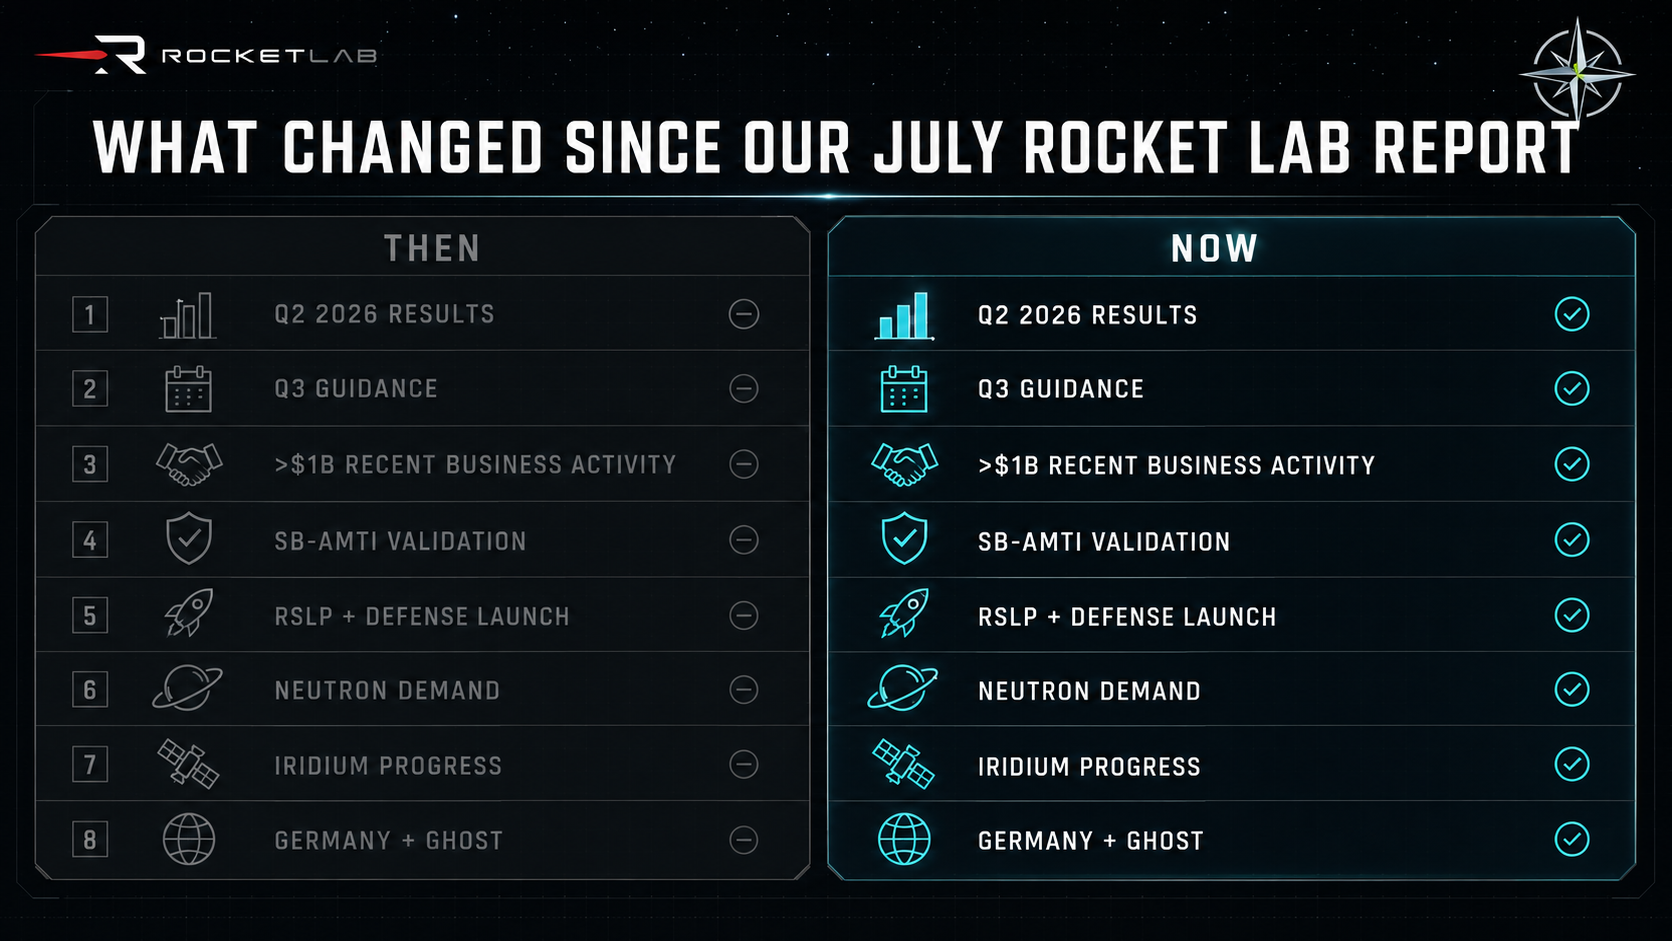
The second quarter of 2026 gave that ambition its strongest evidence yet. Revenue reached $234.1 million, up 62% year over year, with Space Systems contributing $189.5 million against $44.6 million from Launch. Backlog climbed to $2.36 billion. Across the quarter and the weeks after it, Rocket Lab announced more than $1 billion of contract activity spanning defense launch, national-security spacecraft, GEO payloads, optical communications, and responsive missions, while Neutron flight hardware moved measurably closer to the pad and the Iridium transaction cleared antitrust review.
Neutron remains the largest single variable in the story, and the way that variable gets discussed deserves correcting. Base does not require a 2026 launch. A first flight in Q1 2027 still supports four physical missions during calendar 2027, given that later vehicle tails are already in production ahead of the first one. Management's one-three-five language describes the shape of a production ramp after first flight, not a fixed calendar schedule.
That distinction carries the entire risk framework. A modest timing slip is an ordinary event for a new launch vehicle and gets absorbed by the rest of the business. A first flight that forces broad requalification of structures or propulsion belongs in a different category altogether, and it is handled here as a separate Stress scenario.
Neutron also does not carry the weight alone. Base leans on Electron and HASTE cadence, GHOST readiness infrastructure, merchant components sold across the industry including into competitors' spacecraft, prime spacecraft programs, Flatellite standardization, GEO expansion, growing mission operations revenue, Iridium's recurring network, and a measured applications overlay above Iridium's own forecast. Several of those engines have to work. None has to dominate.
Here is the complete Base operating outcome, disclosed in full ahead of the premium section.
Base 2030 operating metric | Modeled outcome |
|---|---|
Revenue | $6.218B |
Adjusted EBITDA | $2.029B |
GAAP net income | $912M |
GAAP EPS | $1.18 |
Owner free cash flow | $872M |
Normalized owner free cash flow | $700M |
Net debt | $600M |
Diluted shares | 770M |
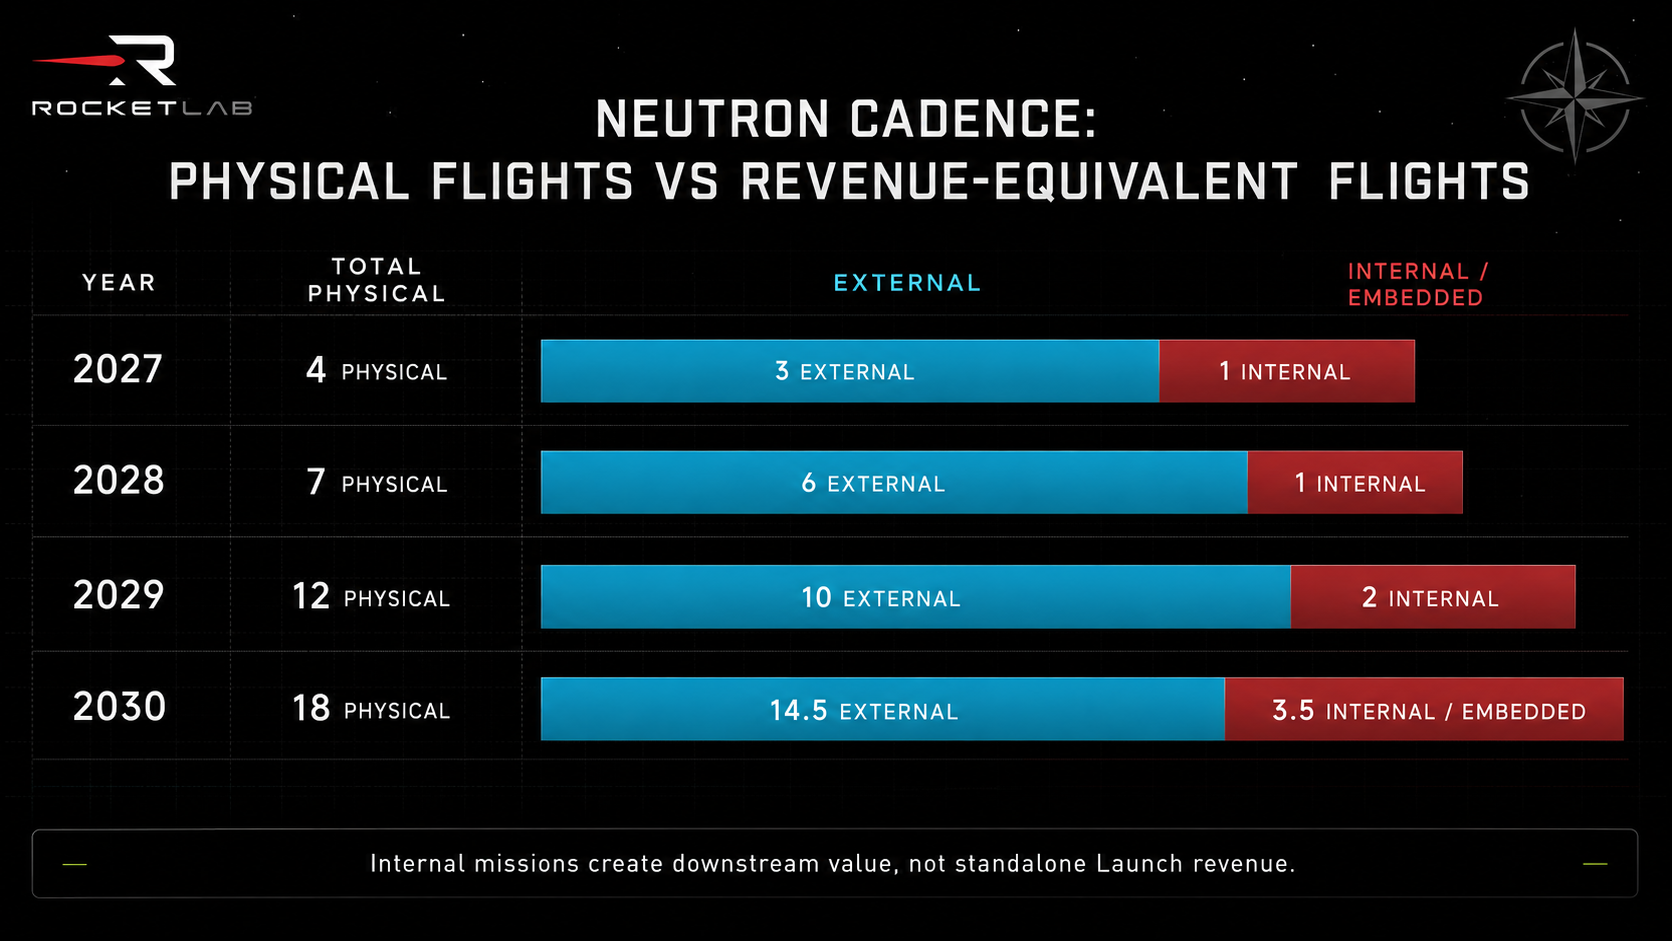
Neutron physical missions | 18 |
Neutron external revenue equivalents | 14.5 |
Neutron internal or embedded missions | 3.5 |
That describes a company clearing $6 billion of revenue and roughly $2 billion of adjusted EBITDA in 2030, financed through a long stretch of heavy investment, with a share count about 16% above 2026. Everything ahead of the premium gate explains how each line is built and what has to happen for it to arrive.
The investor question sits one layer beyond all of it. Rocket Lab can plausibly become an exceptional company. Whether the current share price offers an exceptional return is a different question, and the premium section answers that one.
Part I: The Company Rocket Lab Has Become
The five layers of the space economy
Value in space gets created at five distinct layers, and confusing them produces most of the bad analysis written about this sector.
Launch delivers mass to orbit. Spacecraft manufacturing builds the object that stays there. Components and subsystems supply the solar arrays, reaction wheels, star trackers, radios, and propulsion units that go inside somebody's spacecraft.
Orbital infrastructure means constellations operated as assets. Data and recurring services are sold through that infrastructure to end customers.
Launch is the most visible of the five and the most economically brutal. A rocket is consumed in minutes and then has to be rebuilt, or recovered and refurbished, before it earns again. A spacecraft can operate productively for a decade. A component supplier participates in dozens of constellations at once, including constellations launched by competitors, and a network monetizes the same orbital asset repeatedly across many years and many customers.
Rocket Lab started in the first layer. It built its way into manufacturing and components through a decade of acquisitions and internal development. With Iridium, it is attempting to buy its way into the last two, which is where recurring economics live.
The three-layer operating system
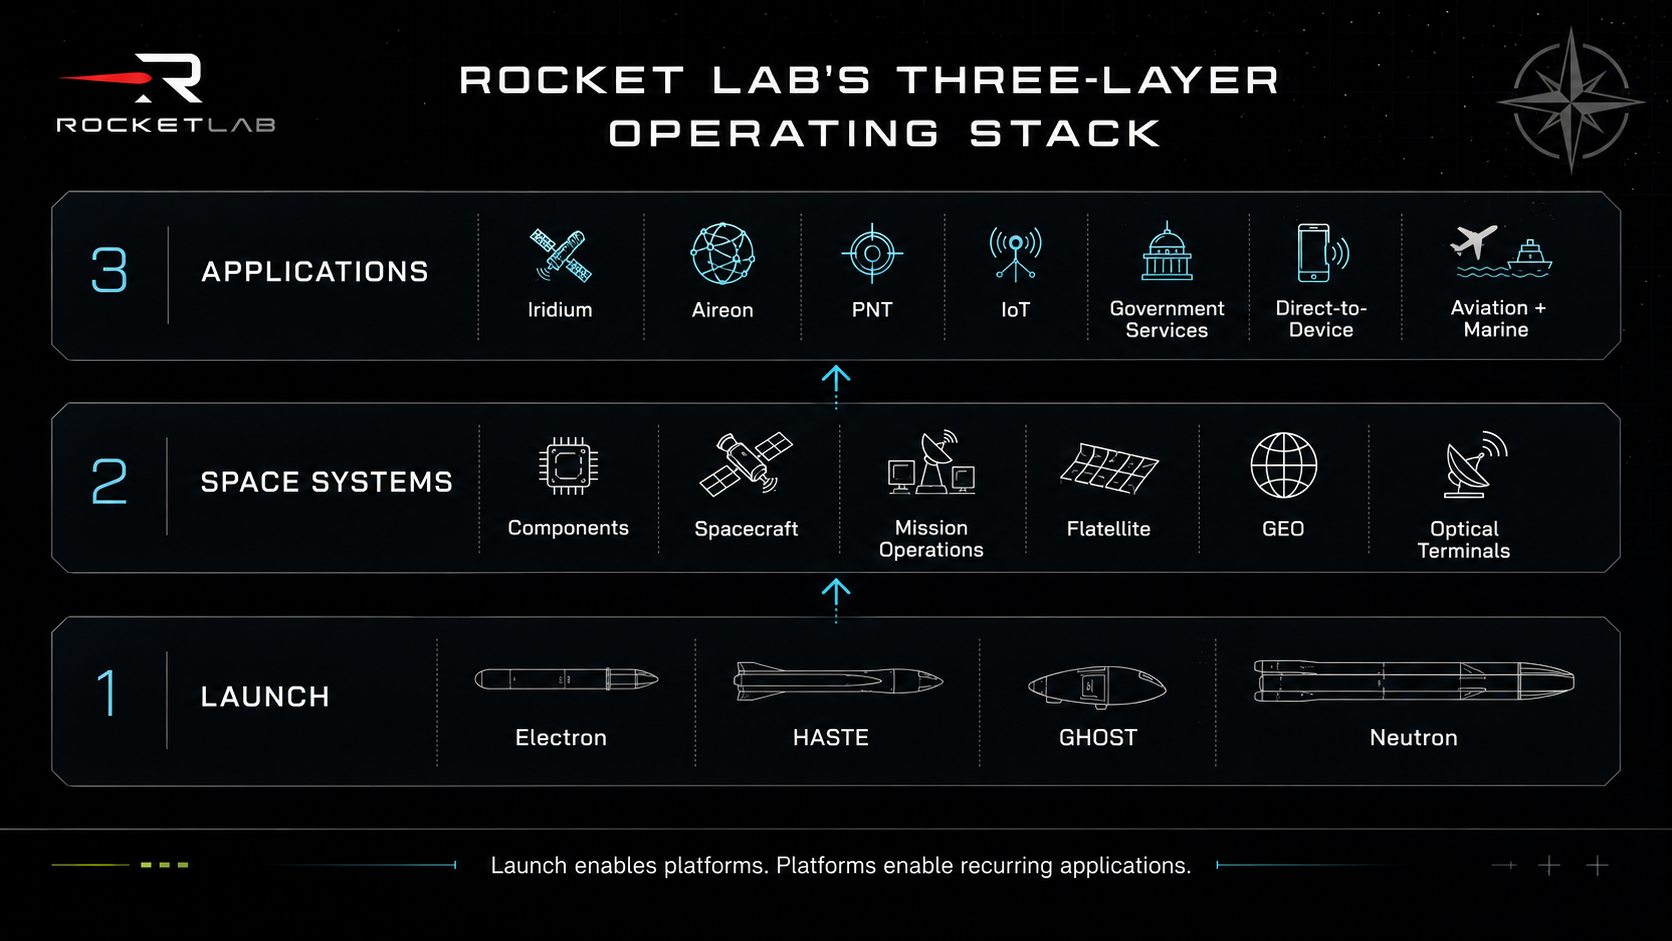
The company resolves into three systems with very different economic characters.
Operating system | Core assets | What it sells |
|---|---|---|
Launch | Electron, HASTE, GHOST, Neutron | Access to orbit and controlled schedule |
Space Systems | Components, payloads, spacecraft, Flatellite, mission operations | Physical capability and delivered missions |
Applications | Iridium, Aireon, PNT, IoT, defense services, aviation, marine, direct-to-device | Recurring outcomes over time |
Launch sells access, which is episodic and consumed on use. Space Systems sells physical capability, delivered against contracts with defined scopes and defined margin risk. Applications sells recurring outcomes that arrive whether or not anything new was built that quarter.
Those three revenue characters carry different margins, working capital profiles, customer relationships, and valuation logic. Collapsing them into one growth rate and one multiple produces a number that describes no part of the company accurately, so they stay separate all the way through consolidation here, and separate again in the valuation section.
Launch as the wedge, and what integration must prove
Launch handed Rocket Lab something it could not have manufactured on its own: direct commercial relationships with nearly every organization trying to put a small satellite into orbit.
Selling a dedicated launch means understanding the customer's spacecraft, its deployment sequence, its orbit, its schedule constraints, and its replacement plans. That conversation exposes the supplier to the customer's whole problem set. In the ordinary course of selling launches, Rocket Lab learned which components were scarce, which vendors ran late, and where the spacecraft supply chain kept jamming.
The company bought or built into those gaps and started selling parts. Then it started selling complete spacecraft. Eventually it started winning the mission itself as prime contractor, at which point the relationship inverted and Rocket Lab became the organization other suppliers sell into.
Launch opened the door. The company followed the customer through it.
Vertical integration gets treated as self-evidently good far more often than it should be. Internal supply does lower supplier markups, improve schedule control, raise internal content per mission, speed iteration, and make coordination between payload, spacecraft, and launch vehicle far easier. Those advantages compound in an industry where the binding constraint is frequently one component with a two-year lead time.
The costs are equally real and they arrive earlier. Integration raises fixed costs, multiplies capital requirements, increases organizational complexity, creates more internal points of failure, and transfers responsibility for schedule and quality onto Rocket Lab's own books. A company that owns everything also owns every delay.
One accounting rule follows from that and governs everything downstream. When Rocket Lab launches an Iridium spacecraft on its own Neutron, no consolidated launch revenue is created. When it builds a spacecraft for its own network, no consolidated Space Systems revenue is created. Value from internal work shows up as avoided external cost, lower capital spending, better timing, and downstream service revenue, and any forecast that books internal missions as launch sales counts the same activity twice.
Why Rocket Lab is a scarce public asset
Most public space companies offer one narrow exposure. An investor can buy a component supplier, an imaging company, a ground-segment provider, or a launch startup. Buying the commercial space economy through a single listed instrument is close to impossible.
Rocket Lab is the exception. Proven orbital launch, hypersonic test capability, a merchant components business, spacecraft manufacturing, prime contractor status on national-security programs, mission operations, and, on closing, a global network with spectrum. SpaceX remains private and has broadened well past launch into broadband and adjacent ambitions, which leaves Rocket Lab as the cleanest public expression of the sector.
The scarcity is part technical and part financial. Rebuilding this architecture would take flight heritage, government trust, a manufacturing base, a decade of acquisitions, and continuous access to capital markets willing to fund losses along the way. Very few organizations hold all four at once.
Peter Beck deserves a mention here without a premium attached to him. Founder credibility affects customer trust, engineering recruitment, investor patience, and the terms on which capital arrives, all of which show up in the numbers indirectly. It exempts the company from nothing, and no part of this valuation rests on it.
The architecture looks coherent today. It was assembled through a long sequence of decisions that were not obviously coherent at the time.
Part II: The Historical Crucible
The outsider factory and design for production
Rocket Lab was founded in a country with no space industry to speak of. New Zealand had no aerospace primes to hire engineers away from, no established supplier ecosystem to order parts from, and no procurement culture built around low-volume, high-cost hardware. There was nobody to call.
That absence turned out to be formative. Peter Beck came out of practical engineering, not program management, and the company that grew around him solved problems by building things instead of waiting on a vendor quote. Scarcity forced vertical problem-solving years before anyone articulated vertical integration as a strategy.
The contrast with traditional aerospace runs deep. Legacy programs are organized around procuring small numbers of expensive, highly customized units through long supplier chains. Rocket Lab was organized, out of necessity, around making many of the same thing in one building. Culture came from constraint long before it came from capital.
The Rutherford engine is the clearest artifact of that upbringing. It runs electric pumps driven by batteries in place of conventional turbomachinery, and most of its primary structure is additively manufactured.
Rutherford is not the highest-performance engine ever built, and treating it as a technological triumph misses what it accomplished. Electric pumps and printed components pulled an entire category of slow, complex, expensive manufacturing off the critical path. The design was chosen to match a production system, not to win a specification contest.
The consequences show up everywhere in the business today. Electron flies at a cadence that hand-built turbopumps would make impossible. HASTE reuses the same manufacturing base and the same engines.
The factory absorbs fixed cost across a growing number of units. Repetition, not spectacle, is what turned Electron into a business.
Electron becomes a business, and HASTE turns it toward defense
Early Electron flights went the way early launch vehicle flights always go, which is a mix of success, partial success, and public failure. Reliability improved through iteration. Customers began booking multi-mission agreements. Production volume rose to meet them.
By 2025 the vehicle had passed through four stages worth separating. Technical validation proved the rocket reached orbit. Commercial validation proved customers would pay a premium for dedicated missions.
Manufacturing scale proved the factory could produce vehicles faster than the pads could consume them. Operating leverage proved gross profit could rise faster than mission count.
Electron is no longer speculative technology. What remains contested is the ceiling of the dedicated small-launch market and how much of it Rocket Lab holds, which is a very different argument from whether the vehicle works.
HASTE, a suborbital variant built for hypersonic testing, changed the customer base without changing much in the factory.
Hypersonic test capacity is scarce. Government programs need repeatable, schedulable flights to gather data on vehicles and payloads travelling at extreme speeds, and the supply of vehicles able to provide that has never kept pace with demand. HASTE shares Electron's engines, structures, production line, people, and launch infrastructure, so each incremental defense mission absorbs fixed cost that already exists.
The strategic value runs past margin. HASTE pulls Rocket Lab away from venture-funded commercial satellite demand, which is cyclical and sentiment-driven, and toward defense budgets, which move on a different clock entirely. Government work also carries engineering, integration, and range support scopes that push recognized revenue per mission well above a commercial ticket price.
The first acquisition wave
Between 2020 and 2022 Rocket Lab bought four companies. Read individually they look like opportunistic tuck-ins. Read together they are an attempt to assemble the basic organs of a spacecraft.
Sinclair Interplanetary supplied reaction wheels and star trackers, which is attitude control and orientation. Advanced Solutions supplied flight software and mission simulation, the spacecraft's brain and the ability to rehearse a mission before flying it. Planetary Systems supplied separation systems, the mechanisms that release a satellite from its launch vehicle. SolAero supplied space-grade solar cells and arrays, which is power.
Every one of those businesses sells externally, a point the market still underweights. Every one also removed a supplier dependency from Rocket Lab's own spacecraft. Orientation, brain, release, and power are not a random shopping list. They are the minimum set required to stop buying satellites and start building them.
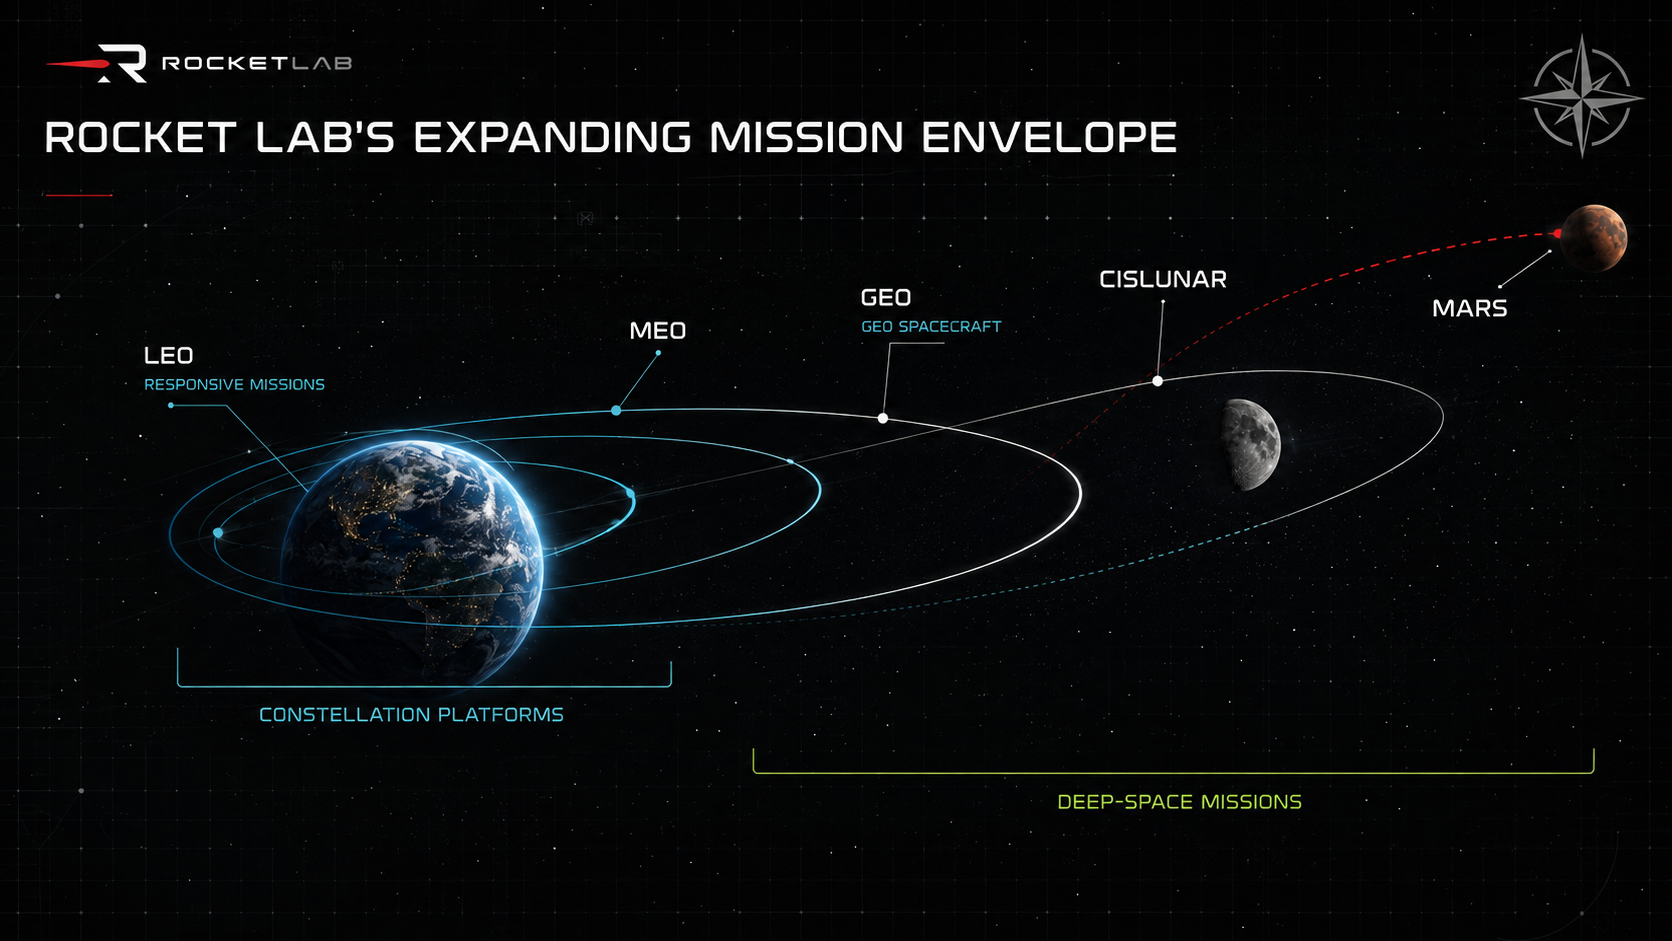
Deep-space work reinforced the same shift from a different direction. CAPSTONE validated launch, upper-stage maneuvering, deep-space navigation, and mission operations in a single mission. ESCAPADE extended the credibility of complete Rocket Lab spacecraft well beyond low Earth orbit.
Neither program moved the financial statements much. Both bought flight heritage, which is the currency government buyers actually price.
From supplier to prime, and the second acquisition wave
The Space Development Agency changed what Rocket Lab could bid on, and the company's response changed what it is.
SDA architectures are built around large numbers of relatively small, relatively standardized satellites deployed in tranches, which rewards production cadence over bespoke engineering. Rocket Lab won Transport Layer Tranche 2 Beta, then Tracking Layer Tranche 3, taking full prime responsibility for delivering complete spacecraft in place of supplying parts into someone else's bus.
Prime status transforms the economics in both directions at once. Revenue per program rises by an order of magnitude, internal component content lifts effective margin, and mission-level credibility opens further doors. It also transfers schedule risk, integration risk, and fixed-price exposure onto Rocket Lab, and it brings percentage-of-completion accounting that spreads revenue across years and produces catch-up adjustments whenever costs move against the estimate.
That inflection, from selling pieces to owning outcomes, is the most consequential structural change in the company's history.
The second acquisition wave followed a different logic than the first. Completing a spacecraft was no longer the objective. Competing as a higher-level space prime was.
Purpose | Acquired or built capability |
|---|---|
See | Optical and infrared payloads through GEOST and Optical Support |
Communicate | Laser terminals and radios through Mynaric |
Move | Propulsion and robotics through Motiv and internal propulsion lines |
Build | Precision machining, composites, and structures |
Operate | Flight software and mission systems |
Payloads separate building a bus from building a mission. A prime that supplies the sensor, the spacecraft, the data link, the propulsion, the structures, and the operations team can bid work no bus manufacturer can touch, and it keeps far more of the contract value in-house when it wins.
By the middle of 2026 the architecture had stopped being theoretical. It started showing up in the financial statements.
Part III: Q2 2026 and the Commercial Reset
What the quarter proved
Q2 2026 metric | Result |
|---|---|
Revenue | $234.1M |
Year-over-year growth | 62% |
Space Systems revenue | $189.5M |
Launch Services revenue | $44.6M |
GAAP gross margin | 36.1% |
Non-GAAP gross margin | 41.5% |
Adjusted EBITDA | $(8.8)M |
Backlog | $2.36B |
Operating cash flow | $(84.1)M |
Free cash flow | $(110.1)M |
Approximate liquidity | $2.4B |
Read honestly, the quarter contains a real tension.
Revenue and backlog both set records. Space Systems drove the growth. Margins landed above expectations and adjusted EBITDA beat management's own guidance. Those are the marks of a business scaling ahead of its plan.
Cash consumption also worsened materially, with operating cash flow at negative $84.1 million and free cash flow at negative $110.1 million. The company is scaling faster than its cash conversion, which is normal for a manufacturer ramping several product lines at once and expensive to fund all the same.
Mix, margins, and backlog quality
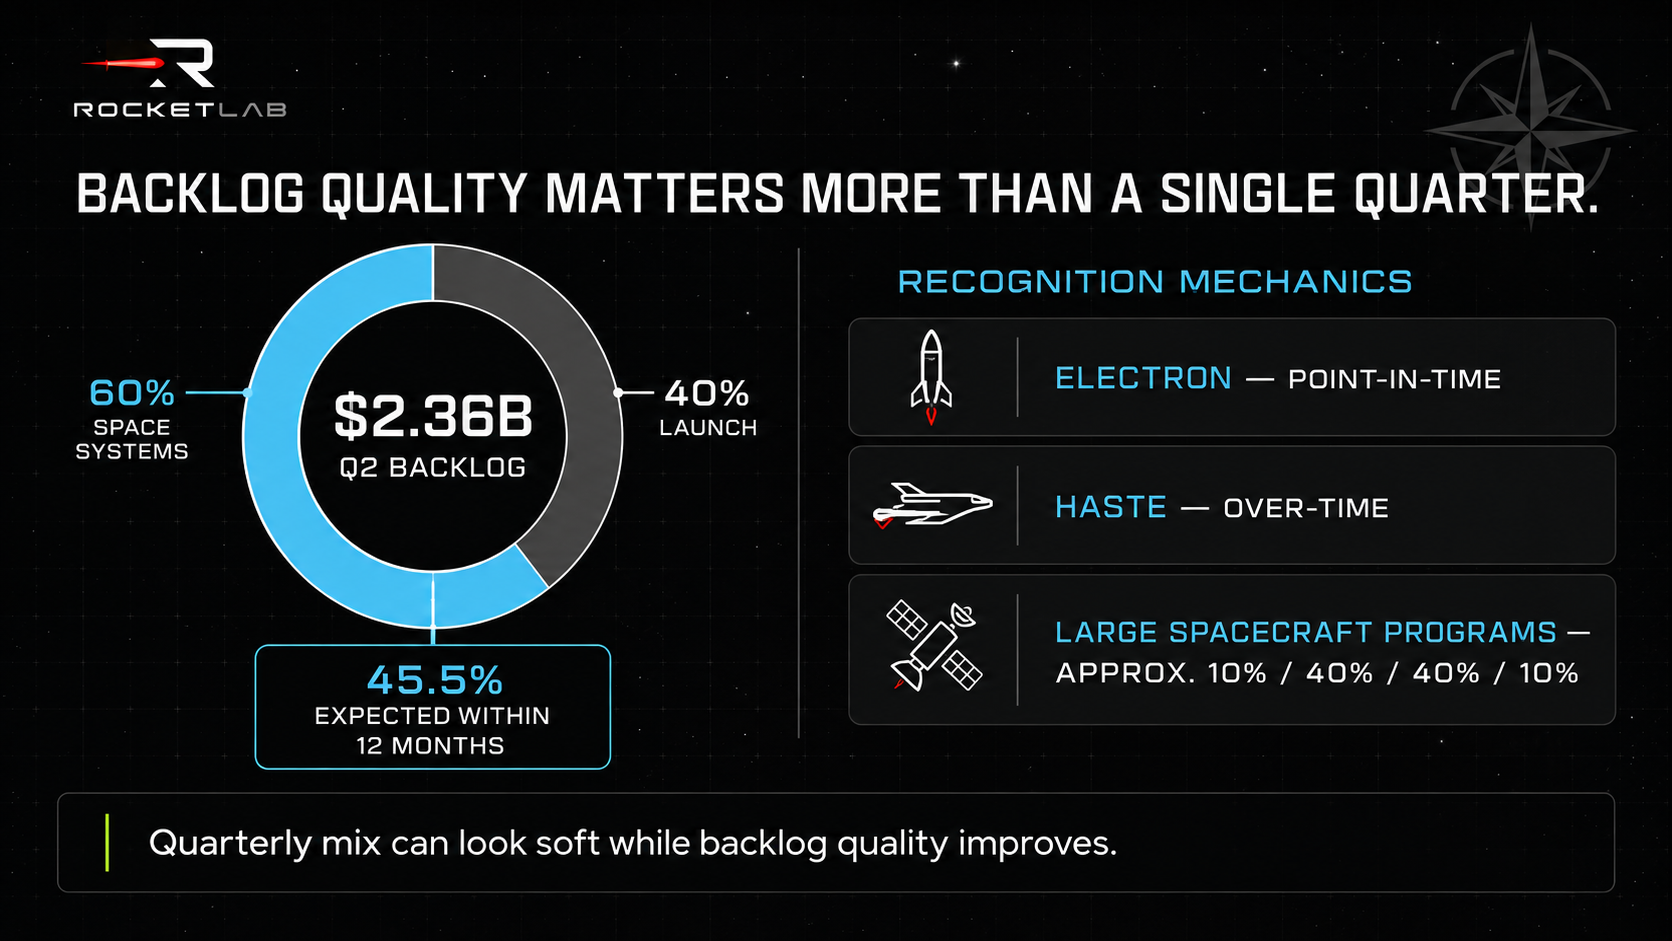
Launch revenue fell sequentially despite a comparable number of missions, which set off a round of confused commentary. The explanation is recognition timing, not demand.
Electron revenue lands largely at the point the mission flies. HASTE revenue can be recognized over time as engineering, integration, and program milestones complete, so a quarter containing HASTE launches can report lower Launch revenue if the associated work was recognized earlier. Mission count and quarterly launch revenue are only loosely coupled, and any forecast built on missions multiplied by a fixed price will misread individual quarters badly.
Margins moved for identifiable reasons too. Mynaric entered the quarter and pressured near-term gross margin while optical terminal production is still being industrialized. Satellite platform work carries lower margin than mature merchant components. A tariff benefit in the period was offset by an inventory reserve taken against a later Neutron vehicle.
None of that excuses soft launch revenue. It does mean the right response is to model the recognition profile and not extrapolate a single quarter's segment split.
Backlog reached $2.36 billion, split roughly 60% Space Systems and 40% Launch, with approximately 45.5% expected to convert within twelve months. Short-cycle component orders and launch bookings add revenue beyond that conversion, making backlog a floor on near-term activity and not a ceiling.
Business | Recognition logic |
|---|---|
Electron | Primarily at launch |
HASTE | Engineering and program activity recognized over time |
Components | On product delivery |
Large spacecraft programs | Percentage of completion |
Mission operations | Service period or milestone |
Iridium | Recurring service recognition |
Large government programs are handled here on a 10%, 40%, 40%, 10% recognition profile across program life, which approximates how management has described the shape of these contracts. Actual program accounting varies, and the convention is a working tool and not a disclosed schedule.
Cash burn, the production ramp, and the 2026 bridge
Capital expenditure is only one piece of the cash story, and the other pieces get far less attention.
Neutron Flight 1 remains in development and consumes engineering and hardware spend producing no revenue. Later Neutron vehicles are being built before the first one flies, pulling cash forward on purpose. Long-lead materials are being procured for SDA programs ahead of recognition. Inventory rose, receivables and contract assets rose, and Mynaric needed working-capital support through integration.
Pulling those apart matters for reading the business correctly. Capital expenditures fund pads, factories, and tooling. Inventory investment funds vehicles and spacecraft not yet delivered.
Contract assets represent work performed and not yet billed, receivables represent billed work not yet collected, and customer advances offset part of the total. Ordinary operating losses sit underneath all of it.
Management's own framing is useful and worth repeating accurately. Adjusted EBITDA can turn positive well before free cash flow does, and free cash flow may lag a successful Neutron test flight by roughly 18 to 24 months. Building later vehicle tails early raises near-term cash use and shortens the gap between first flight and meaningful cadence, a deliberate trade and not a financing accident.
Q3 guidance calls for revenue of $250 million to $265 million, GAAP gross margin of 29% to 31%, an adjusted EBITDA loss of $17 million to $23 million, and weighted shares around 641 million.
Against H1 actual revenue of $434.4 million and a Q3 midpoint of $257.5 million, reaching the $1.0 billion full-year Base requires roughly $308.1 million in Q4. That is achievable and no longer trivial. It needs spacecraft program recognition to land in the period, component shipments to clear, launch timing to hold, acquired operations to integrate cleanly, and no major program reset along the way.
The 2026 anchor carries more weight than a single year usually would. Every scenario in this forecast starts from the same $1.0 billion and diverges from there.
The contract ledger
Rocket Lab disclosed more than $437 million of Launch contracts and more than $581 million of Space Systems contracts across Q2 and the weeks after quarter-end, clearing $1 billion in total, with launch backlog rising above 90 missions and 26 new launches booked.
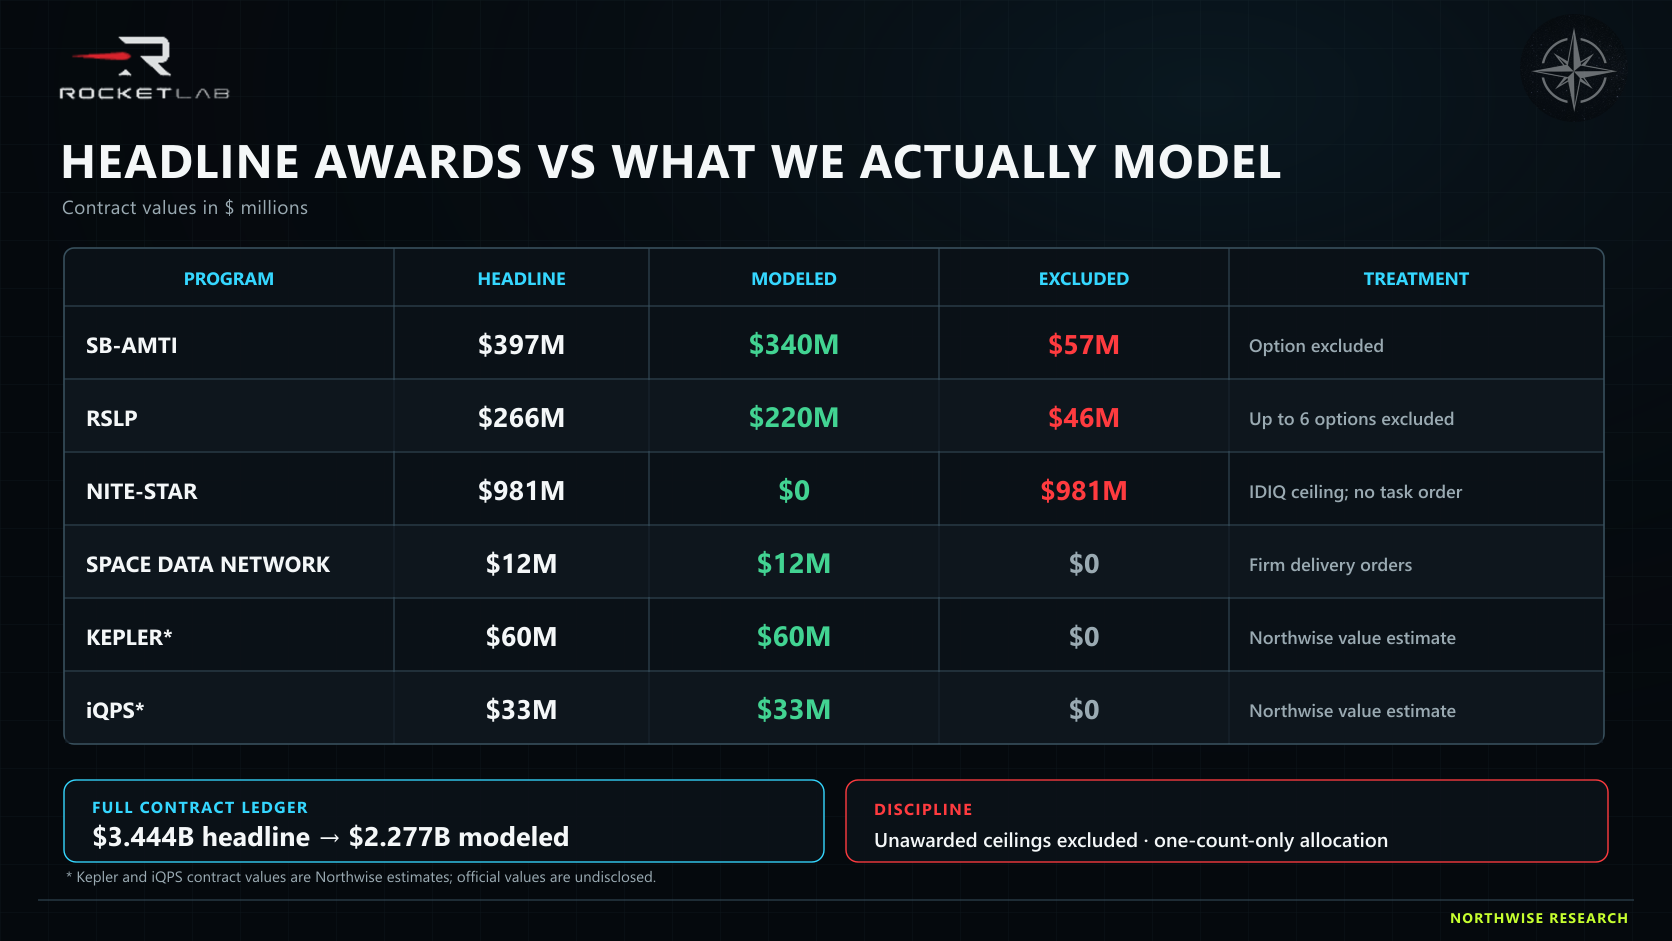
Headline contract activity is not firm recognized revenue, and the gap between the two is where most models go wrong. Some announced values include unexercised options. Some represent IDIQ ceilings carrying no revenue until a task order arrives.
Some awards span multiple segments and get double-counted by anyone allocating them naively. Some were partly known before the announcement.
The ledger below shows every material award beside the value actually carried in Base.
Program | Headline | Base modeled | Treatment |
|---|---|---|---|
SDA Transport Layer Tranche 2 Beta | $515M | $515M | Existing program, recognized by completion |
SDA Tracking Layer Tranche 3 | $816M | $806M | Options excluded from Base |
SB-AMTI Flatellite | $397M | $340M | Multi-segment award allocated once |
Government GEO programs | $160M | $160M | Four-year recognition, no double count of May and post-quarter releases |
MDA 17-platform program | $143M | $70M | Remaining unrecognized balance only |
Space Data Network delivery orders | $12M | $12M | Firm orders only, consortium ceiling excluded |
NITE-STAR IDIQ | $981M | $0 | Ceiling is not backlog |
RSLP HASTE and Kodiak infrastructure | $266M | $220M | 12 firm missions, up to 6 options excluded |
Kepler dedicated Neutron mission | $60M | $60M | Value undisclosed, modeled at mission pricing |
iQPS three-launch Electron deal | $33M | $33M | Value undisclosed, modeled at three mission units |
NASA three Electron launches | $31M | $31M | Value undisclosed, modeled at three mission units |
Confidential defense prime HASTE | $30M | $30M | Two mission units |
Total | $3.444B | $2.277B | Allocated once across segments |
Roughly a third of the announced activity is optionality, ceiling, or value already counted somewhere else. The $1.167 billion between the two columns is the difference between reading press releases and building a forecast.
A few of these awards carry more meaning than their dollar figures suggest.
RSLP covers 12 firm suborbital missions with up to 6 options, plus Kodiak infrastructure, GHOST deployment, and continuing readiness and support. Dividing $266 million by 18 missions produces a HASTE price that exists nowhere in the program. Firm mission revenue is separated from infrastructure and support here, and the options are excluded outright.
SB-AMTI is the most strategically significant of the group. The $397 million award covers multiple Flatellite spacecraft, a Neutron launch, and mission operations, with Rocket Lab selected as one of only two providers on a national-security program. Base carries $340 million of it, allocated as $255 million to spacecraft and prime work, $55 million to Neutron, and $30 million to mission operations, with $57 million held back for options and uncertainty.
That is the full-stack thesis executed inside a single contract. A customer bought spacecraft, launch, and operations from one company, using a standardized platform, with follow-on architecture on the table. No other public company could have bid the scope.
The iQPS and NASA bookings prove something quieter and equally useful. iQPS added three dedicated Electron missions, taking the total relationship to 18, and continues to use Rocket Lab separation hardware. Repeat bulk purchases from a commercial operator are the cleanest available evidence that dedicated small launch has demand that outlives any single year.
Kepler booked a dedicated Neutron mission, moving from rideshare to reserved medium-lift capacity before the vehicle has flown. No contract value was disclosed, so Base carries an inferred figure at standard mission pricing.
GEO entry widens the addressable market in a way the headline understates. More than $160 million across disclosed GEO activity covers space domain awareness and protected tactical communications with payload integration, and geostationary spacecraft carry far higher dollar content per unit than LEO buses. The May and post-quarter announcements overlap, and the combined program is counted once.
NITE-STAR is the cleanest discipline test in the ledger. Rocket Lab was onboarded to a program with a $981 million ceiling, which is valuable qualification and produces exactly zero Base revenue until task orders actually arrive.
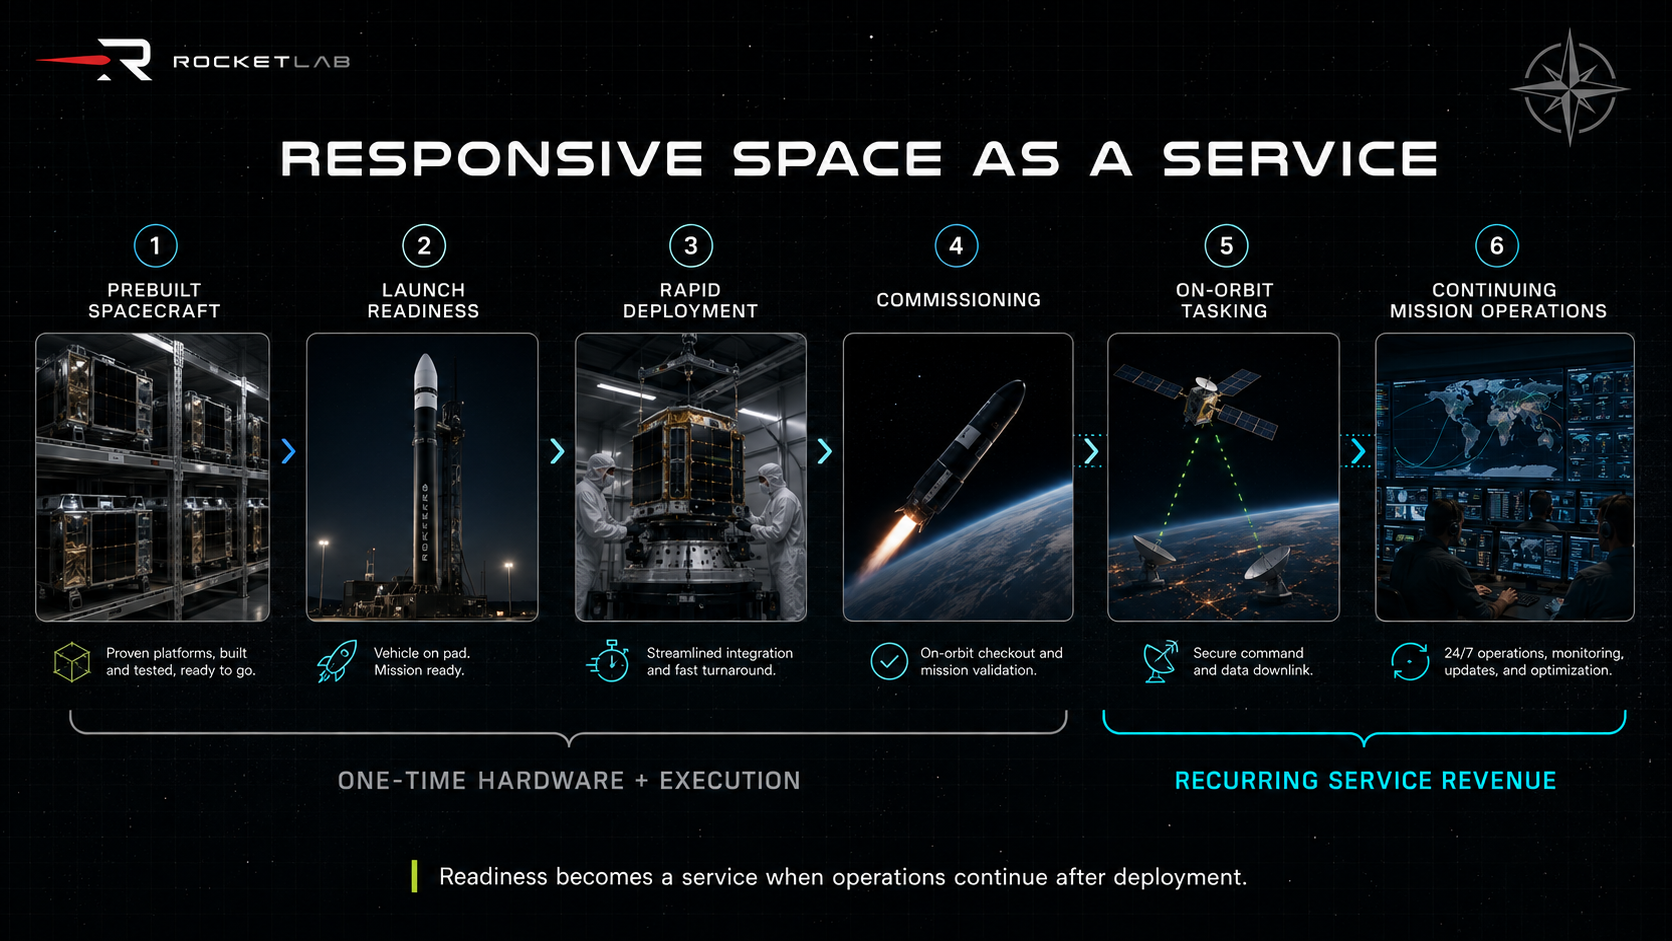
Two program updates round out the picture. The first eight of 17 MDA spacecraft reached orbit and generated power nominally, retiring a meaningful portion of the schedule and liquidated-damages risk attached to that program, with nine platforms still to go. VICTUS HAZE ran the full responsive-space sequence, from a Rocket Lab-built spacecraft launched on short notice, through rapid commissioning, to on-orbit pursuit and inspection with continuing tasking.
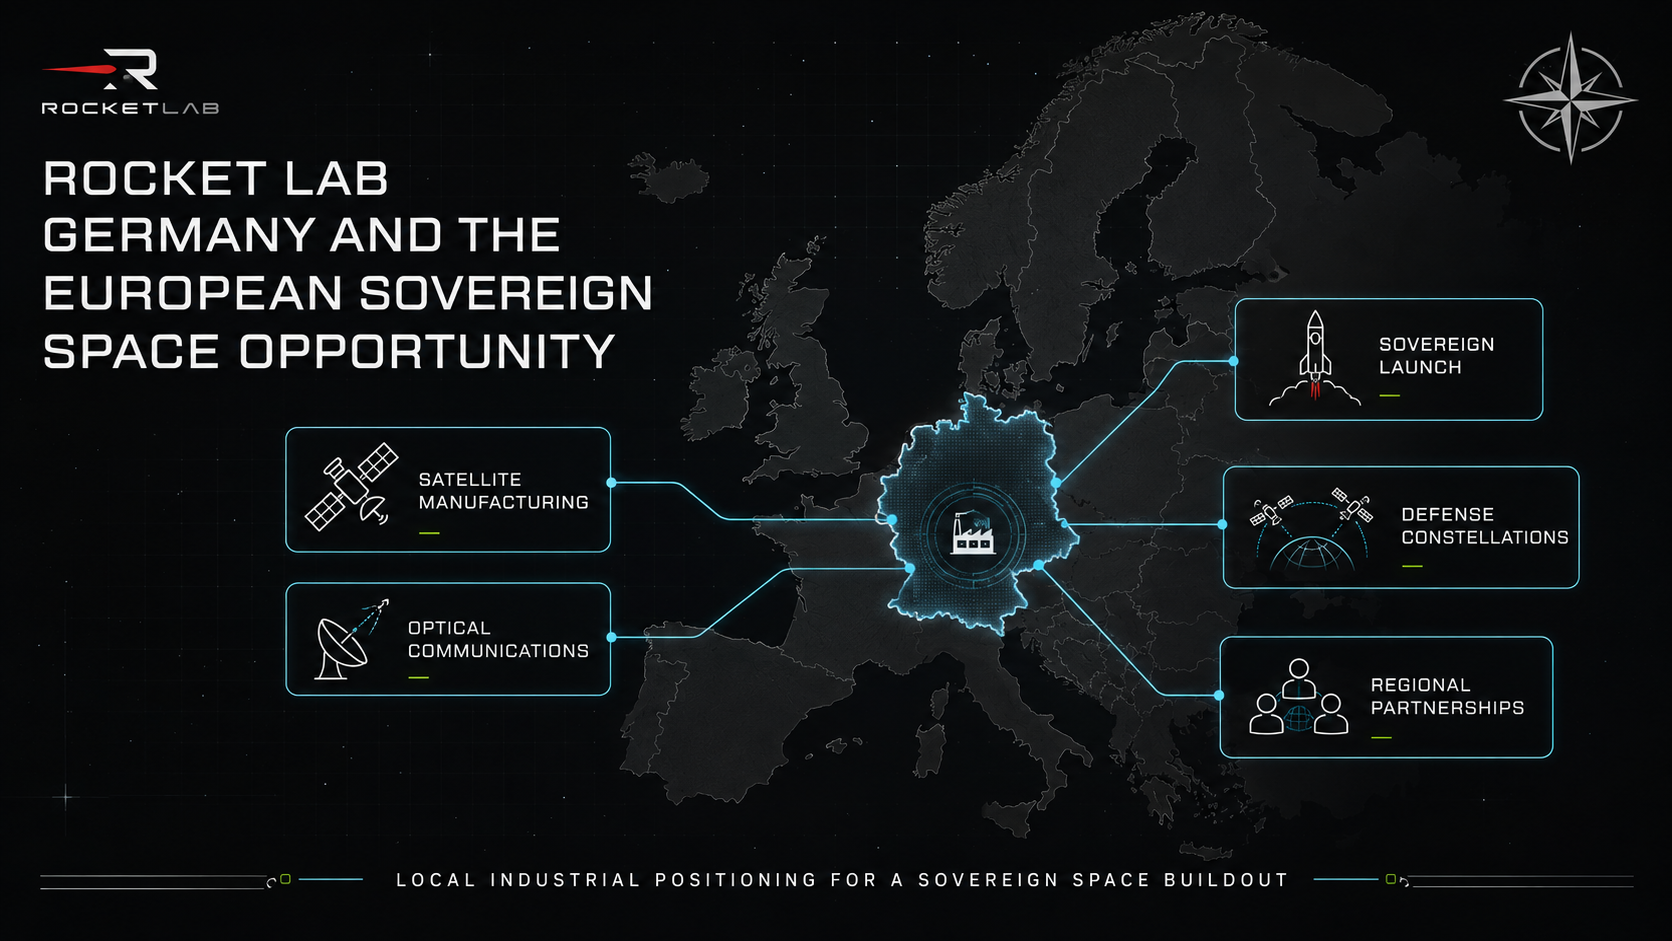
Rocket Lab Germany sits slightly apart from the rest. Mynaric provides the manufacturing base, Europe faces a genuine sovereign launch and spacecraft deficit, and defense budgets across the continent are rising. Base embeds roughly $100 million of 2030 European contribution spread across existing segment lines in place of inventing a seventh reporting segment for it.
What changed from the July model, and the question that remains
Northwise published a Rocket Lab forecast in July. The architecture identified then has held. Several inputs have not, and the changes are set out here in full.
Operating item | July model | Revised model | Reason |
|---|---|---|---|
2030 Base revenue | $5.625B | $6.218B | Stronger Space Systems and mission-services evidence |
Neutron treatment | 18 external-equivalent missions | 18 physical, 14.5 external, 3.5 internal | Better consolidated accounting |
Components | $950M | $1.150B | Merchant payload, optical, robotics, and propulsion demand |
Spacecraft and prime | $1.250B | $1.650B | SB-AMTI, GEO, Flatellite, stronger prime validation |
Mission operations | $150M | $340M | Responsive space and continuing on-orbit services |
Network and applications | $1.465B | $1.442B | Proxy-anchored network plus explicit $200M overlay |
Adjusted EBITDA | $1.959B | $2.029B | Larger operating platform |
Owner FCF | $1.003B | $872M | More realistic cash costs and investment burden |
Normalized owner FCF | Not fully reserved | $700M | Explicit network renewal reserve |
Net debt | $800M | $600M | Revised financing and cash generation path |
Diluted shares | 770M | 770M | Dilution conclusion unchanged |
The most consequential correction is the Neutron treatment. July implicitly valued all 18 Base missions as external launch revenue, overstating consolidated Launch sales by counting internal Iridium and program-embedded flights as third-party sales. Splitting physical flights from external equivalents from internal missions lowers headline launch revenue and produces a more honest picture of where value actually lands.
The second correction runs the other way. Space Systems and applications opportunity increased across the board, while terminal cash flow decreased through an explicit reserve against Iridium's approaching constellation replacement cycle. Same company, better instrument.
Which leaves the question everything ahead of the gate is built to answer. Rocket Lab has already shown it can launch reliably, manufacture components at merchant scale, build complete spacecraft, and win major government programs as prime. What remains unresolved is whether it can convert that breadth into a repeatable industrial system while commercializing Neutron and absorbing a larger network business, without letting debt, dilution, or fixed-price contract risk eat the value created.
Part IV: Electron, HASTE, and GHOST
Dedicated launch, cadence, and margin
Electron survives in a market where rideshare offers dramatically lower cost per kilogram, and the reason has almost nothing to do with cost per kilogram.
A dedicated launch sells control. The customer picks the orbit, the inclination, the deployment sequence, the timing, and the replacement schedule. A rideshare customer accepts the orbit the primary payload needs, the date the primary payload is ready, and every delay the primary payload creates. For a constellation operator replacing a failed satellite, a defense customer with an urgent requirement, or a commercial operator whose revenue depends on completing an orbital plane, that gap is the whole transaction.
The customer's real arithmetic includes costs that never appear in a per-kilogram comparison. Six months waiting for a rideshare slot is six months of forgone constellation revenue. Reaching the correct orbit from a compromise drop-off burns propellant, and propellant is satellite life.
Schedule risk compounds through integration, insurance, and ground-segment readiness. A missing replacement satellite degrades coverage across an entire service area. National-security missions often carry confidentiality requirements a shared vehicle simply cannot satisfy.
Electron sells a controlled orbital outcome. Pricing it against bulk transportation misprices the product.
Base builds Electron from physical missions and recognized revenue per mission, with margin improving through repetition.
Year | Electron missions | Electron revenue | Gross margin |
|---|---|---|---|
2026 | 20 | $194M | 44% |
2027 | 25 | $252.5M | 45% |
2028 | 30 | $312M | 46% |
2029 | 34 | $371M | 47% |
2030 | 38 | $432M | 48% |
Revenue per mission climbs from $9.7 million to roughly $11.4 million across the period, reflecting mix and integration scope more than price increases. Cadence stays constrained by customer readiness, weather, regulatory approvals, and factory output, leaving 38 missions in place of a theoretical pad capacity number.
Margin improvement is the least speculative assumption in the table. Each additional vehicle absorbs the same fixed manufacturing base, and a decade of production learning keeps compounding. Electron does not have to become a 70-mission platform for any of this to work.
HASTE as a defense program
HASTE revenue per mission looks anomalous beside Electron until the scope comes into view.
Year | HASTE missions | HASTE and GHOST revenue | Gross margin |
|---|---|---|---|
2026 | 3 | $61M | 32% |
2027 | 6 | $105M | 36% |
2028 | 8 | $150M | 39% |
2029 | 10 | $185M | 42% |
2030 | 12 | $218M | 44% |
A HASTE engagement includes program engineering, payload integration, range support, readiness maintenance, and infrastructure, with revenue recognized across milestones in place of concentrating at flight. Recognized revenue per mission runs from $12 million in 2026 to $14.5 million in 2030, with GHOST and program support layered on top. Margin starts below Electron, weighed down by heavy early engineering content, and converges upward as the mission mix matures.
RSLP, Kodiak, and GHOST
The RSLP award matters more than its dollar figure implies, and the reason is geography.
Missile-defense testing needs Pacific test geometry. Launching from Alaska opens trajectories over open ocean toward instrumented ranges that no other domestic site can replicate. Kodiak is one of very few locations offering that geometry with infrastructure already in place, and the award funds two planned pads plus supporting systems.
Government funding of launch infrastructure changes the capital profile of the program entirely. Rocket Lab gains capacity without financing all of it, the pads share manufacturing and operations with Electron, and the program generates recurring readiness revenue independent of the commercial satellite launch cycle. Defense backlog built this way behaves unlike commercial backlog, renewing on procurement schedules in place of funding rounds.
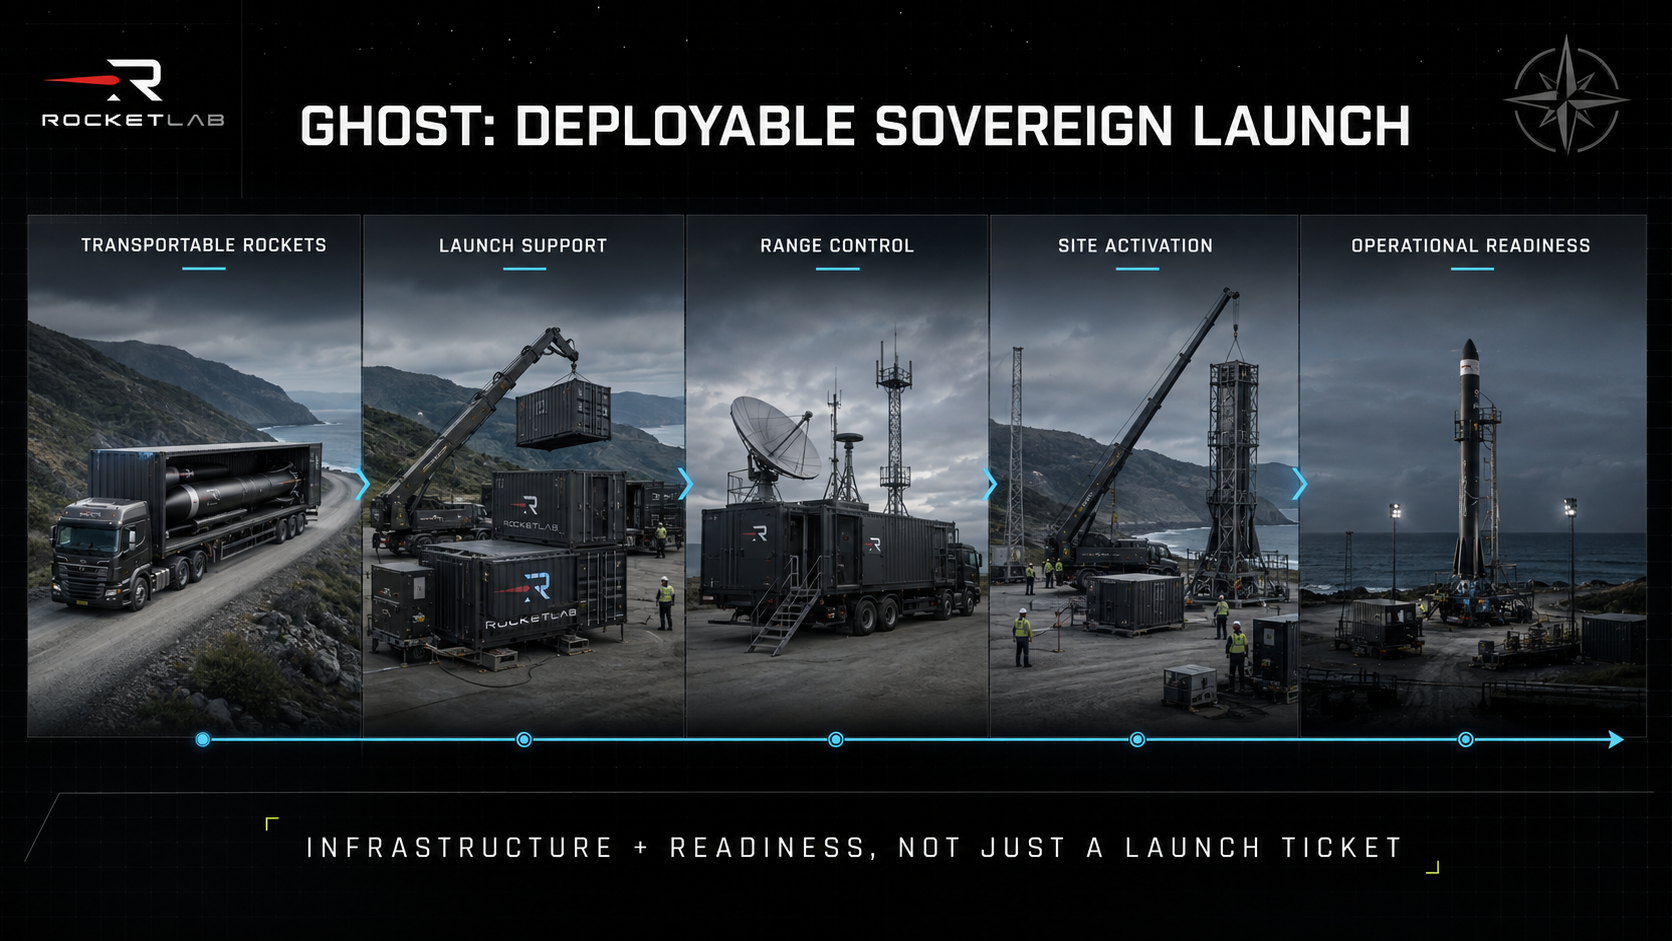
GHOST extends the same logic into a product. The system packages a rocket, ground support equipment, launch infrastructure, range-control systems, transportable support, and operational training into a deployable capability, with revenue arriving through system delivery, site activation, readiness retainers, maintenance, training, and launch campaigns.
For a country that wants sovereign launch access and has no domestic launch industry, GHOST is the only realistic path available on a reasonable timeline. It stays inside the Launch segment here without a separate reporting line.
The small-launch model through 2030
Year | Electron | HASTE | Total missions | Electron revenue | HASTE and GHOST revenue |
|---|---|---|---|---|---|
2026 | 20 | 3 | 23 | $194M | $61M |
2027 | 25 | 6 | 31 | $252.5M | $105M |
2028 | 30 | 8 | 38 | $312M | $150M |
2029 | 34 | 10 | 44 | $371M | $185M |
2030 | 38 | 12 | 50 | $432M | $218M |
Fifty small-launch missions in 2030 is a meaningful manufacturing ramp and still sits well below the total of every mission Rocket Lab has announced or booked. The gap is deliberate. Launch schedules slip, customers arrive late, and any forecast assuming every announced mission flies on its stated date overstates revenue every single year.
Electron and HASTE together prove Rocket Lab can run a launch production system. Neutron asks whether it can repeat the achievement at roughly forty times the payload mass with a reusable first stage underneath it.
Part V: Neutron
Why medium lift changes the ceiling, and how the vehicle is built
Electron addresses a market measured in hundreds of kilograms. Neutron addresses one measured in tons, and the difference is categorical.
Medium lift opens constellation deployment in commercially meaningful batches, larger national-security payloads, dedicated commercial missions that currently have one credible provider, civil science, responsive launch at scale, cargo, and Rocket Lab's own network infrastructure. It also opens replacement and replenishment launches for constellations already in orbit, which is a recurring market and not a one-time one.
The competitive objective gets stated wrong constantly. Neutron does not need to beat Falcon 9 on price, cadence, or reuse. It needs to be a credible second provider in a market where demand exceeds supply and where most large customers actively want an alternative to a single dominant vendor. That bar is far lower and far more defensible.
The vehicle is designed for approximately 13,000 kilograms to low Earth orbit, powered by nine sea-level Archimedes engines on the first stage and a vacuum-optimized variant on the second. It burns methane and liquid oxygen, uses carbon-composite primary structure, recovers and reuses the first stage, and carries an integrated fairing whose halves stay attached to the booster and reopen for stage separation.
Each of those choices maps to a consequence. Methalox propellant supports cleaner engine reuse and simpler refurbishment than kerosene. Carbon composite cuts dry mass and lifts performance, at the cost of a manufacturing process unforgiving of defects.
The integrated fairing eliminates a recovery problem outright, returning with the booster in place of requiring separate retrieval at sea. Nine engines provide engine-out capability and the production volume that drives unit cost down. First-stage reuse is the assumption mature gross margin depends on, and it sits furthest from being proven.
Launch Complex 3 at Wallops provides the pad. Recovery and refurbishment infrastructure has to exist alongside it before reuse contributes anything at all.
The tank failure, the correction, and what Q2 progress proves
A hydrostatic qualification test failed after the tank reached expected flight loads. The root cause was a manufacturing defect at a critical join, produced by a third-party manual layup process.
The sober reading has three parts. A ground test failure is far preferable to a flight failure, costing hardware and schedule in place of a vehicle, a payload, and a customer relationship. The failure nonetheless exposed a real weakness in a critical manufacturing process, a more serious finding than a design margin issue would have been. The correction, moving to automated fiber placement with added structural margin, appears technically credible and addresses the actual cause and not the symptom.
Schedule risk stays live until new hardware completes requalification. Automated fiber placement should produce more consistent parts than manual layup, which is the entire reason for the change, and consistency is exactly what a production ramp demands.
Q2 showed Stage 1 barrels and domes progressing, interstage qualification underway, Stage 2 integration advancing, thrust module integration in work, more than 400 Archimedes hot fires completed, a flight engine set entering production, integrated fairing preflight testing, and Launch Complex 3 activation.
That is substantial progress sitting at a specific point on a longer ladder. Component test, qualification test, acceptance test, integrated stage test, vehicle-pad integration, wet dress rehearsal, static fire, first flight, repeat flight, recovery, and refurbishment are eleven distinct gates. Collapsing them into "the rocket is almost done" is how launch schedules get believed and then missed.
First flight itself proves a great deal. Integrated propulsion, structures, guidance, avionics, stage separation, fairing operation, pad systems, and mission operations all working together under real conditions. It proves the vehicle is real.
First flight proves almost nothing about the business. Repeatability, production rate, recovery success, refurbishment economics, insurance acceptance, schedule reliability, mature mission pricing, and high-cadence gross margin all stay open after a successful debut. Commercialization begins at first flight and finishes somewhere around the tenth.
One-three-five describes a ramp, not a calendar
Management has described early Neutron scaling as roughly one, then three, then five. That language gets widely misread as one launch in calendar 2027, three in 2028, and five in 2029.
It describes elapsed time after first flight and the shape of an early production ramp. Later vehicle tails are already being manufactured ahead of Flight 1, which is precisely why cash burn is elevated right now. A first flight in Q1 2027 leaves nine months of the year and a queue of vehicles already built, supporting three more physical flights before December.
The branch that matters is whether Flight 1 requires corrective work. A clean flight lets the queue move. A flight revealing a design or manufacturing problem stops the queue and consumes the vehicles already sitting in it.
Calendar year | Physical Neutron missions |
|---|---|
2027 | 4 |
2028 | 7 |
2029 | 12 |
2030 | 18 |
Physical flights, external equivalents, and internal missions
This distinction is the most important accounting concept in the forecast, and getting it wrong inflates launch revenue by roughly 20% in the terminal year.
Year | Physical missions | External revenue equivalents | Internal or embedded |
|---|---|---|---|
2026 | 0 | 0 | 0 |
2027 | 4 | 3 | 1 |
2028 | 7 | 6 | 1 |
2029 | 12 | 10 | 2 |
2030 | 18 | 14.5 | 3.5 |
A physical mission is a rocket leaving the pad. It consumes hardware, propellant, range time, and people, and it belongs in any operational count of what the company achieved.
An external revenue equivalent is a mission generating revenue comparable to a paid third-party launch. Some government missions count above one conventional commercial mission, with integration, security requirements, and mission services expanding scope well past transportation, leaving the equivalent count in fractional units.
An internal or embedded mission is a test flight, an internal deployment, or a launch whose economics sit inside a larger program already counted elsewhere. Launching a replacement Iridium satellite on Neutron creates enormous value through avoided external launch cost, better timing, and preserved network continuity. It creates no consolidated launch revenue, for the simple reason that Rocket Lab cannot sell a service to itself.
By 2030 Base carries 3.5 internal or embedded missions out of 18 physical flights. Anyone booking all 18 as launch sales reports roughly $240 million of revenue that does not exist.
Pricing, recognition, and the economics of reuse
Year | External equivalents | Neutron revenue | Implied revenue per equivalent |
|---|---|---|---|
2027 | 3 | $165M | $55M |
2028 | 6 | $372M | $62M |
2029 | 10 | $670M | $67M |
2030 | 14.5 | $986M | $68M |
Early advertised Neutron pricing sat around $50 million to $55 million per mission. No deep discounting is assumed to win early business, which holds up in a supply-constrained medium-lift market where the alternative provider is fully booked.
Average recognized revenue rises above the advertised ticket through mix. Government missions carry integration, security, and mission services scopes commercial missions do not. Some contracts bundle spacecraft, launch, and operations, with the launch component recognized at a value reflecting full-service scope. Internal flights stay out of this line entirely.
Mature margin is a separate question from revenue, and it turns almost entirely on reuse.
Year | Neutron gross margin |
|---|---|
2027 | (35%) |
2028 | (5%) |
2029 | 18% |
2030 | 38% |
A recovered booster is not automatically an economic booster, and the industry's history is full of vehicles that landed beautifully and never flew again profitably.
Economic reuse needs flights per booster high enough to amortize manufacturing, engine life surviving multiple missions without full teardown, inspection labor staying bounded, reentry thermal damage staying within tolerance, refurbishment turnaround measured in weeks and not months, recovery logistics costing less than the hardware saved, high landing success rates, efficient launch-site staffing, and production yield sufficient that boosters are not scarce. Every one of those variables is unknown for Neutron today.
Two consequences point in different directions. Revenue does not require mature reuse, given that customers pay for delivery to orbit regardless of what happens to the booster afterward. Base gross margin does require reuse to become economically meaningful by roughly 2029, as expendable operation at these price points never reaches 38%. Neutron can fly successfully, generate the revenue in the table above, and still disappoint financially.
The Neutron scenario framework
Scenario | 2030 physical | External equivalents | Internal | Neutron revenue |
|---|---|---|---|---|
Standalone | 16 | 14 | 2 | $950M |
Stress | 4 | 3 | 1 | $220M |
Bear | 10 | 8 | 2 | $560M |
Base | 18 | 14.5 | 3.5 | $986M |
Bull | 30 | 26 | 4 | $1.950B |
Exceptional | 45 | 40 | 5 | $3.200B |
Standalone assumes the Iridium transaction never closes, removing internal network launches and trimming total physical missions while leaving Neutron commercially successful.
Stress assumes severe delay, a requalification cycle, or economics that never come together, with four physical flights by 2030 and negligible margin contribution.
Bear assumes a useful but subscale vehicle. Neutron flies, wins work, and reaches ten flights, without the cadence or the reuse economics that justify a scarcity multiple.
Base assumes credible commercialization on the elapsed-time ramp above. Bull assumes Neutron becomes a genuine second major launch platform at 30 flights with reuse working well enough to support 45% gross margin. Exceptional assumes an industry-defining vehicle at 45 flights, requiring everything to work at once and weighted accordingly.
Neutron widens the top of the funnel. Space Systems decides how much value Rocket Lab captures after the payloads leave the fairing.
Part VI: Space Systems
The segment the market still frames incorrectly
Space Systems generated $189.5 million in Q2 against Launch's $44.6 million. It is the larger business, it is growing faster, and the market still describes Rocket Lab as a launch company.
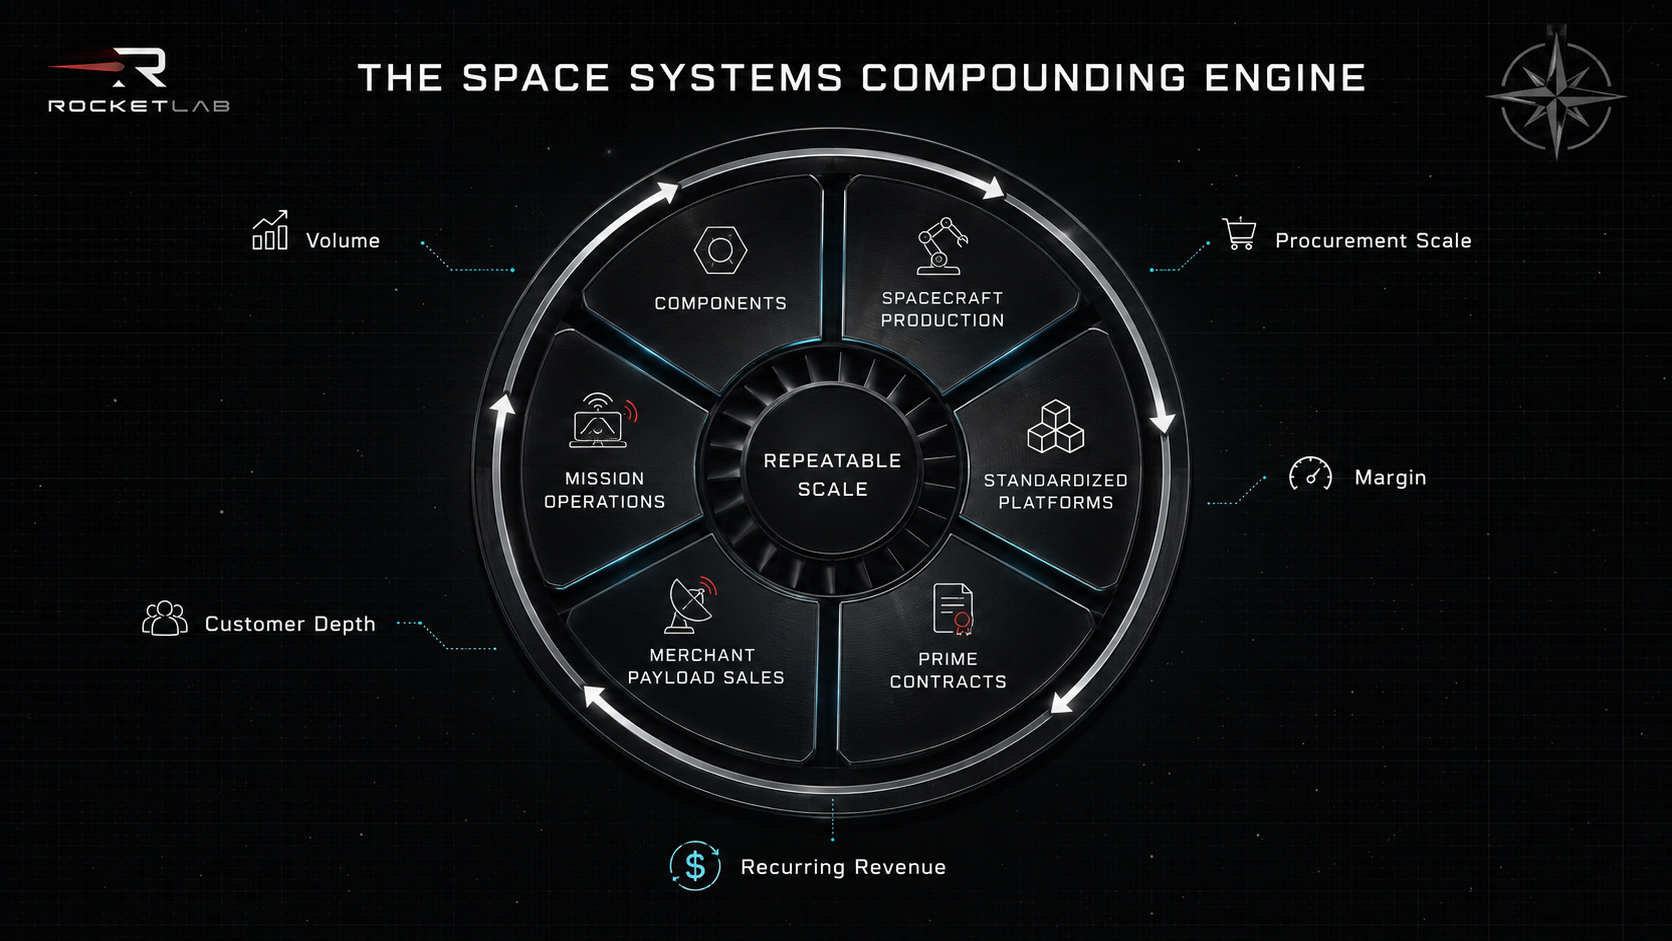
The segment resolves into three lines with separate economics. Components and subsystems sell hardware across the industry. Spacecraft and prime programs deliver complete missions under government contracts. Mission operations and services sell recurring capability after the spacecraft arrives on orbit.
Components, merchant revenue, and standardized platforms
Rocket Lab manufactures solar cells and arrays, reaction wheels, star trackers, flight software, separation systems, radios, laser terminals, optical payloads, propulsion units, robotics, precision mechanisms, and composite and machined structures.
Component economics are attractive for structural reasons. Products are standardized, qualification history is expensive to replicate, designs recur across programs, production learning compounds, and swapping suppliers on a qualified spacecraft is disruptive enough that customers rarely bother. One design can sell into dozens of unrelated programs for a decade.
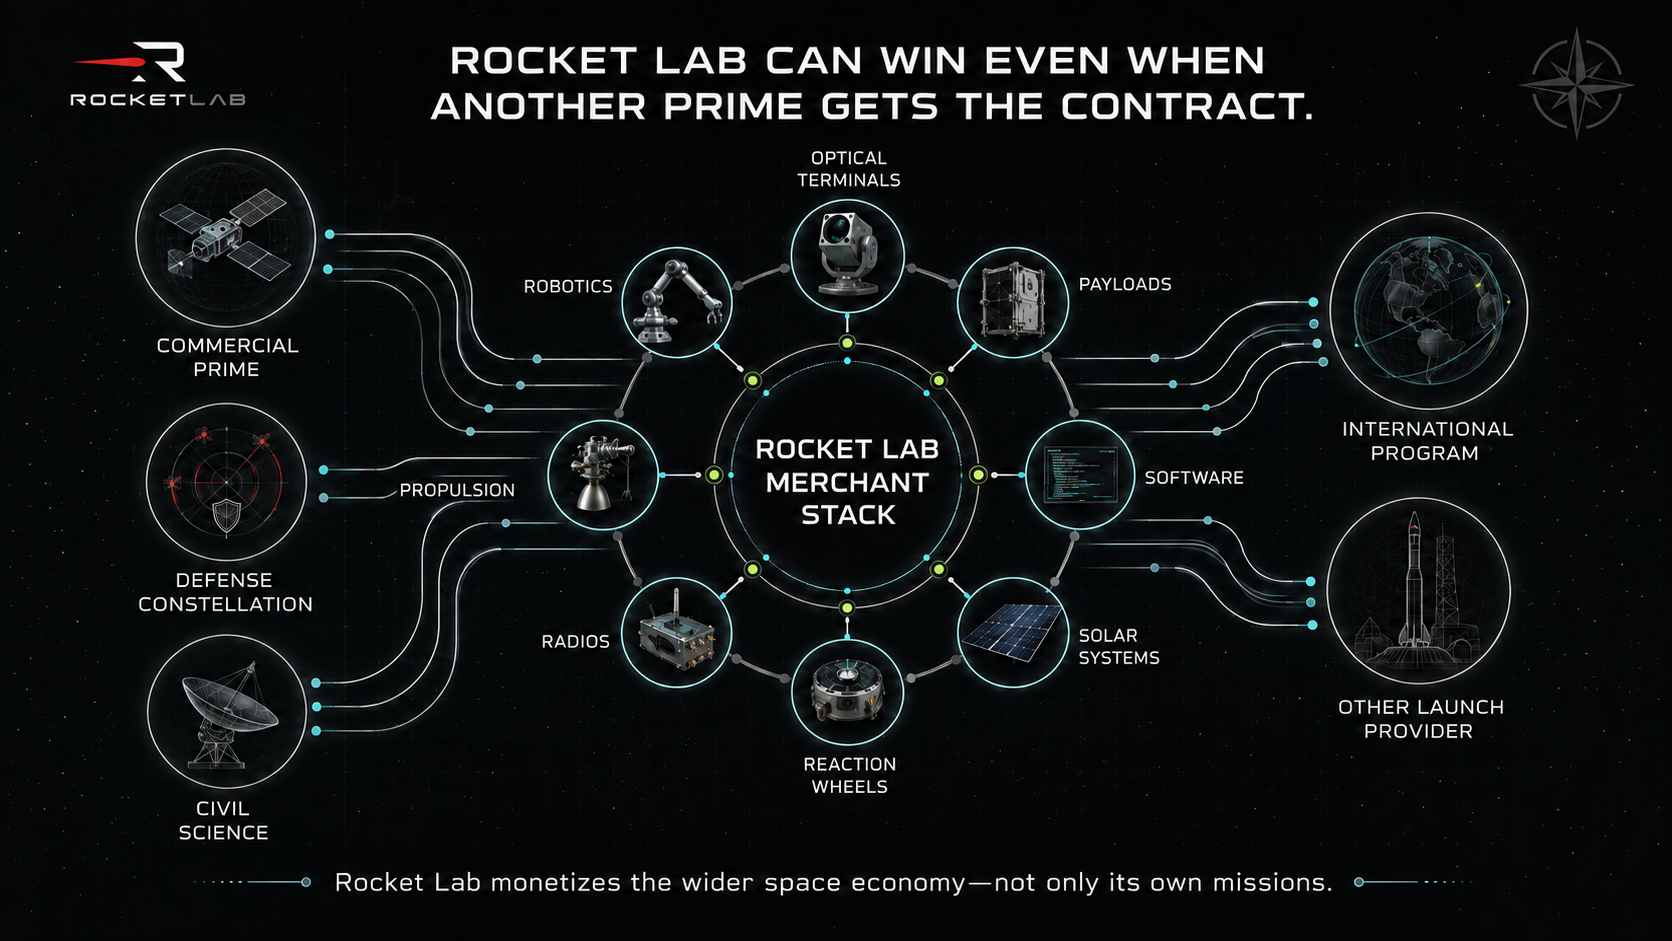
The merchant dynamic is where the market most consistently undervalues the business. Rocket Lab does not have to win the prime contract to earn revenue from a program. Its solar arrays, payloads, laser terminals, radios, flight software, and separation systems fly on spacecraft built by rival primes and launched on rival vehicles.
A government architecture awarding ten satellites to a competitor still generates Rocket Lab revenue across all ten. That structure diversifies the business in a way pure primes cannot replicate, and Tranche 3 and the broader optical communications buildout will generate component demand regardless of which manufacturer wins each individual award.
The spacecraft portfolio spans Photon, larger buses, deep-space platforms, responsive spacecraft, Flatellite, and now GEO platforms. What matters is the direction of travel across it.
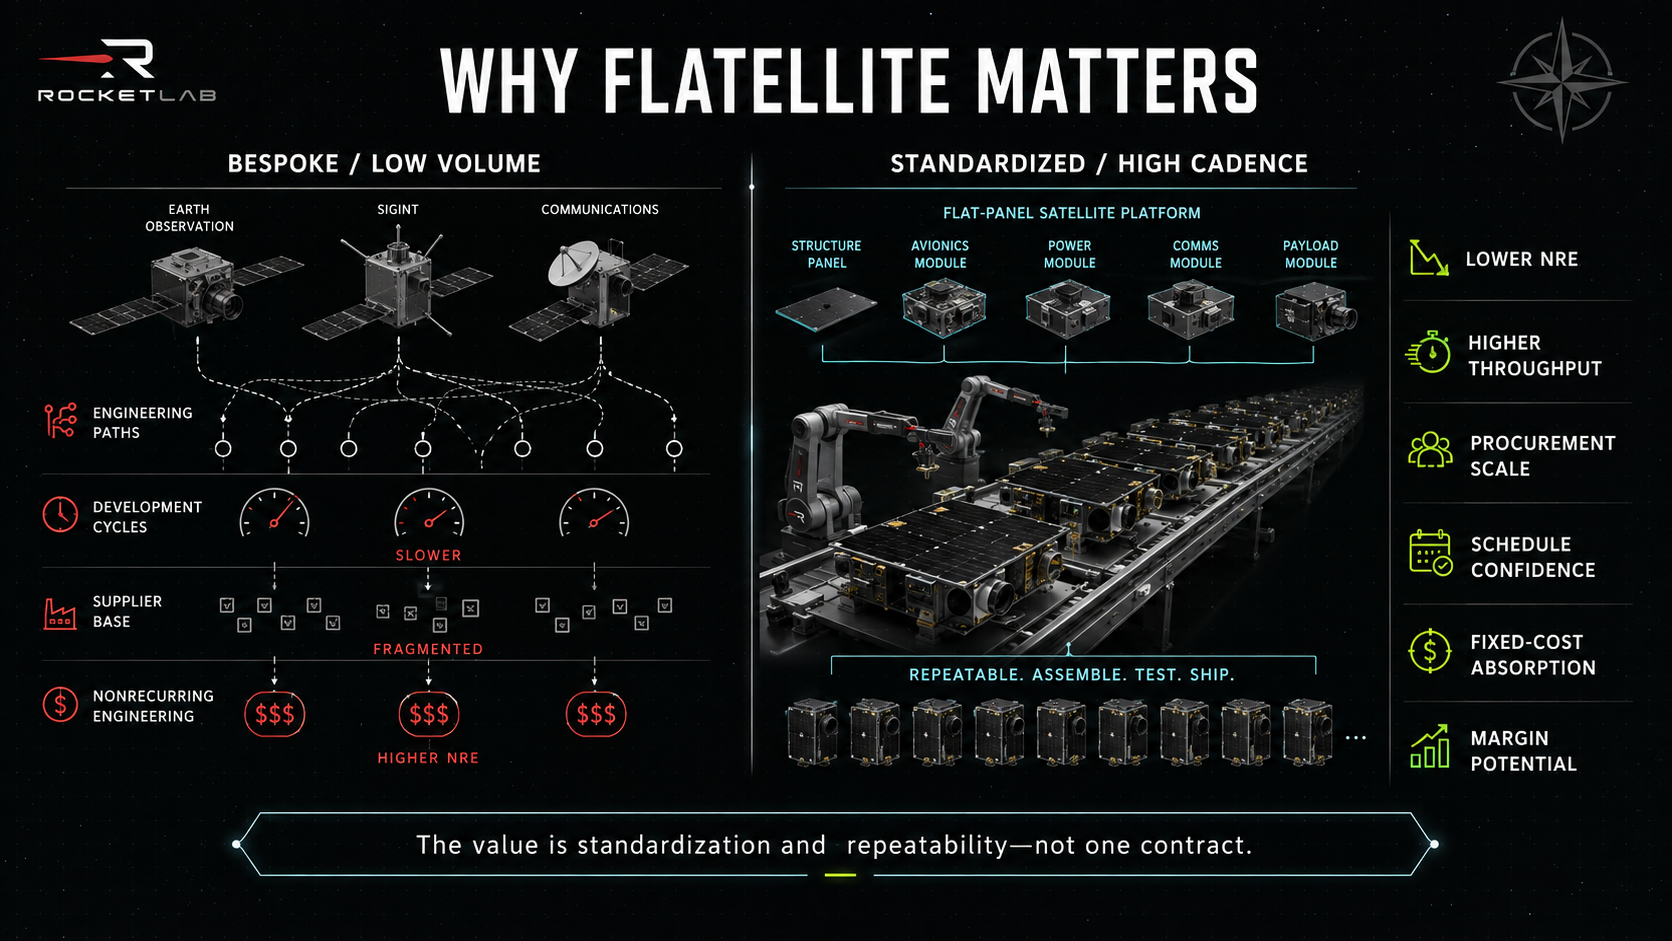
Bespoke engineering programs are the least attractive, each unit carrying fresh nonrecurring engineering, unique procurement, and unpredictable margin. Configurable platforms improve on that by reusing a core design with mission-specific modification. Standardized production platforms are the destination, where the same design gets built repeatedly with common procurement and predictable cost.
Flatellite carries that shift furthest. Its low-profile form allows dense packing inside a fairing, meaning more satellites per launch. It is designed for rapid production with common procurement and reusable design elements, cutting nonrecurring engineering across programs and improving factory utilization as the same line runs continuously in place of cycling between bespoke builds. It is also launch-agnostic, flying on Neutron or on whatever a customer prefers, which keeps the spacecraft business independent of Neutron's schedule.
Prime programs, SB-AMTI, GEO, and MDA execution
SDA prime work established the franchise. Transport Layer Tranche 2 Beta and Tracking Layer Tranche 3 handed Rocket Lab complete spacecraft responsibility, high internal component content, and payload capability on national-security programs, with revenue recognized across program life and real fixed-price exposure underneath.
The open question is whether one generation of awards becomes a recurring franchise. Winning a tranche proves capability. Winning successive tranches, and adjacent programs, proves a business.
SB-AMTI is the strongest evidence yet that the answer might be yes. Spacecraft, launch, and mission operations under single-prime accountability on a national-security priority program, with Rocket Lab one of only two selected providers. Nobody else in public markets could have written that bid.
GEO entry widens the opportunity along a different axis. Geostationary spacecraft are larger, carry more capable payloads, operate for 15 years or more, and consequently carry far higher dollar content per unit than LEO buses. Space domain awareness and protected tactical communications are both growth areas inside defense budgets, and both demand the payload integration Rocket Lab spent five years acquiring. More than $160 million of disclosed activity establishes a position without establishing dominance, and a new entrant facing entrenched incumbents is treated here as an expanding capability and not a captured market.
MDA matters for a different reason. The program suffered supply chain delays that created real exposure to liquidated damages, and the first eight of 17 spacecraft have now reached orbit and generated power nominally. That retires a meaningful slice of schedule risk and, more usefully, demonstrates Rocket Lab can recover a troubled program and deliver. Nine platforms remain, and the margin question is not fully closed.
Mission operations and responsive space
VICTUS HAZE shows the revenue ladder mission operations creates. Rocket Lab built the spacecraft, launched it responsively, commissioned it rapidly, then ran on-orbit pursuit and inspection operations with continuing tasking. Every stage of that sequence bills separately, and the final stage recurs.
Year | Mission services revenue |
|---|---|
2026 | $55M |
2027 | $90M |
2028 | $145M |
2029 | $230M |
2030 | $340M |
Base margin reaches 40% by 2030 as the mix shifts from one-time commissioning toward recurring operations, monitoring, readiness retainers, and follow-on tasking. This is the closest thing in the portfolio to software-like economics, given that operating one more spacecraft from an existing control center costs very little at the margin.
Optical communications, robotics, and Europe
Mynaric supplies CONDOR laser terminals, which move data between satellites without ever touching the ground. SDA architectures lean heavily on inter-satellite optical links, and the Space Data Network consortium position adds a further channel with $12 million of firm delivery orders. Manufacturing optical terminals at volume is genuinely difficult, and Mynaric's industrialization is a live execution risk that pressured Q2 margins.
Motiv contributes robotics, motion control, and precision mechanisms with Mars flight heritage. Propulsion spans Curie, HyperCurie, and Gauss engines across chemical and electric approaches, covering orbit raising, station keeping, and end-of-life disposal. Precision Components supplies machining, structures, and throughput, the least glamorous capability in the portfolio and arguably the most operationally important, given that supplier delays on structures stop entire programs cold.
Rocket Lab Germany ties several threads together. Europe faces a sovereign launch deficit, defense spending is climbing, regional procurement rules favor domestic providers, and Mynaric supplies an existing manufacturing base. Base embeds roughly $100 million of 2030 European contribution across existing segment lines. Bull carries substantially more, contingent on actual European program awards arriving.
Space Systems revenue, margin, and the replacement-award requirement
Line | 2026 | 2027 | 2028 | 2029 | 2030 |
|---|---|---|---|---|---|
Components | $300M | $440M | $600M | $820M | $1.150B |
Prime programs | $390M | $700M | $1.050B | $1.350B | $1.650B |
Mission operations | $55M | $90M | $145M | $230M | $340M |
Total Space Systems | $745M | $1.230B | $1.795B | $2.400B | $3.140B |
Base gross margins reach 45% for components, 38% for prime programs, and 40% for mission operations by 2030.
One requirement buried in those numbers gets less attention than anything else in the forecast.
Named awards support most of the 2026 through 2028 forecast. Those programs then decline as they complete. Reaching $1.650 billion of prime revenue in 2030 requires Rocket Lab to keep winning roughly billion-dollar-class annual award activity throughout the period. Nothing here assumes current backlog repeats itself automatically, and nothing assumes follow-on tranches arrive by default.
If prime awards stop after the current generation, Space Systems revenue does not hold this trajectory. That is a real dependency, and it is why competitive position and government relationships appear in the risk framework in place of being treated as settled.
2030 scenario | Components | Prime | Mission ops | Total Space Systems |
|---|---|---|---|---|
Standalone | $1.100B | $1.550B | $300M | $2.950B |
Stress | $750M | $850M | $150M | $1.750B |
Bear | $950M | $1.350B | $230M | $2.530B |
Base | $1.150B | $1.650B | $340M | $3.140B |
Bull | $1.450B | $2.500B | $550M | $4.500B |
Exceptional | $1.800B | $3.500B | $850M | $6.150B |
Part VII: Iridium
The network that was too early, and the rescue that worked
Motorola conceived Iridium as a global satellite telephone system, a handset that would work anywhere on Earth. The company built it, launched it, and switched it on. Within roughly a year of beginning service, it was in bankruptcy.
The engineering was never the problem. The constellation worked exactly as designed, covering oceans and poles alongside everywhere else. The commercial premise fell apart instead.
Handsets were expensive and bulky. Per-minute pricing was punitive. Terrestrial cellular expanded far faster than anyone had modeled, and the wealthy global traveler who needed a phone everywhere largely stopped existing as coverage spread. On top of that, the debt taken on to build the system left no room whatsoever for a slow ramp.
The lesson travels well past satellites. Infrastructure can work perfectly and still destroy equity value when the customer, the price, the device, the distribution, and the capital structure are all wrong together.
Then a group led by Dan Colussy bought the constellation out of bankruptcy for a small fraction of what it cost to build. That single transaction reset everything downstream, since a network constructed for billions and acquired for a fraction of that carries an entirely different economic profile.
The business model changed alongside the cost basis. The U.S. government became an anchor customer, supplying predictable contracted revenue that funded operations. The target user shifted from wealthy travelers to mission-critical operators, meaning maritime, aviation, defense, energy, scientific, and remote industrial users with no practical alternative. Distribution moved to partners and resellers, and Iridium sold network access in place of consumer devices.
That history connects directly to where Rocket Lab now stands. The same physical asset produced a bankruptcy and then a durable, cash-generative business, and the difference was capital structure and customer selection. Rocket Lab is taking on that asset with new debt attached to it.
How the constellation works
Iridium operates 66 active satellites in six polar orbital planes, 11 operational satellites per plane, in low Earth orbit, plus in-orbit spares.
Polar orbits carry the satellites over the poles on every revolution, and the Earth rotating beneath them produces truly global coverage including oceans, poles, and remote landmass. Most communications constellations concentrate coverage where people live. Iridium covers everywhere, which is the entire point of it.
The architecture's distinguishing feature is inter-satellite crosslinks. A conventional bent-pipe satellite receives a signal and relays it straight to a ground station, so service requires a ground station within view. Iridium satellites pass traffic directly to one another across the constellation until a satellite in view of a gateway can deliver it to the ground.
Two things follow. Service works thousands of kilometers from any ground infrastructure, including mid-ocean and polar regions. And the network keeps functioning when individual gateways are unavailable, which is precisely why defense and safety customers pay for it.
L-band spectrum, Iridium NEXT, and hosted payloads
Iridium operates in L-band, and the spectrum is arguably the single most valuable asset in the transaction.
Radio frequency involves a direct trade. Higher frequencies carry more data and get disrupted more easily by rain, foliage, buildings, and atmosphere, demanding larger and more precisely pointed antennas. Lower frequencies carry less data and penetrate obstacles far more reliably using small, simple terminals.
L-band sits low enough to support small omnidirectional antennas, reliable operation in weather, and terminals that fit on a ship's mast, an aircraft fuselage, a shipping container, or a handheld device. Throughput is modest. Reliability is exceptional.
Spectrum of this kind cannot be manufactured. It takes international coordination through the ITU, national licensing across every jurisdiction served, and interference protection built over decades. A competitor with unlimited capital cannot simply create equivalent global L-band rights, so Iridium should never be framed as a broadband competitor. It is a reliability and coverage asset.
The original fleet was fully replaced by Iridium NEXT across a multi-year launch campaign completed at the end of the last decade, with the current constellation expected to provide service into approximately 2035.
NEXT introduced something economically important beyond replacement capacity. The satellites were designed to carry hosted payloads, meaning third-party equipment flying on Iridium spacecraft and performing entirely separate functions.
Aireon is the flagship example, and the economics are worth following. The same 66 satellites carrying communications traffic also carry ADS-B receivers that create a global aviation surveillance business. Revenue per satellite rises without launching another fleet, without additional launch cost, and without a second constellation to operate.
How Iridium makes money
Subscriber count explains very little here, given that revenue per user varies by more than an order of magnitude across categories.
Voice is mature, with a slowly declining subscriber base partially offset by pricing, serving a mission-critical niche where no substitute exists. IoT is the largest device category by unit count, carrying low revenue per device, very high retention, deep industrial integration, and device lifetimes measured in many years. IoT is the primary organic volume engine.
Broadband is declining as a primary connectivity choice as higher-throughput alternatives expand, while retaining real value as a backup and safety layer on vessels and aircraft that cannot afford a total communications failure. Nothing here forces that line back to growth.
Government airtime under the EMSS structure works unlike everything else. It is a fixed-fee arrangement covering unlimited authorized users through a dedicated government gateway, so subscriber count and revenue decouple entirely. Contract renewal carries procurement timing risk, and the relationship carries strategic value past its revenue, given that defense trust is hard to earn and easy to lose.
Equipment, engineering, and support lines carry lower margins and still matter. Equipment places revenue-generating endpoints into the field, where they generate airtime for years afterward. Engineering revenue funds capability development and deepens government relationships.
That last point creates an analytical trap worth naming. Engineering and equipment revenue can grow while recurring service revenue disappoints, producing respectable headline revenue with materially worse economic quality underneath. Stress reflects exactly that pattern.
PNT and standards-based connectivity
Position, navigation, and timing is the highest-value near-term growth vector in the network, and it rests on a vulnerability most people never think about.
Modern infrastructure depends on GPS timing far more than on GPS positioning. Telecommunications networks, power grids, financial markets, and data centers all use GPS as a synchronization source. That timing signal arrives from medium Earth orbit at extremely low power, making it straightforward to jam and increasingly practical to spoof.
Iridium transmits from low Earth orbit at substantially higher received power, and the Satelles acquisition brought the technology to deliver authenticated timing and positioning through the existing constellation. The addressable problem is critical-infrastructure redundancy, where customers will pay meaningfully for a second independent source.
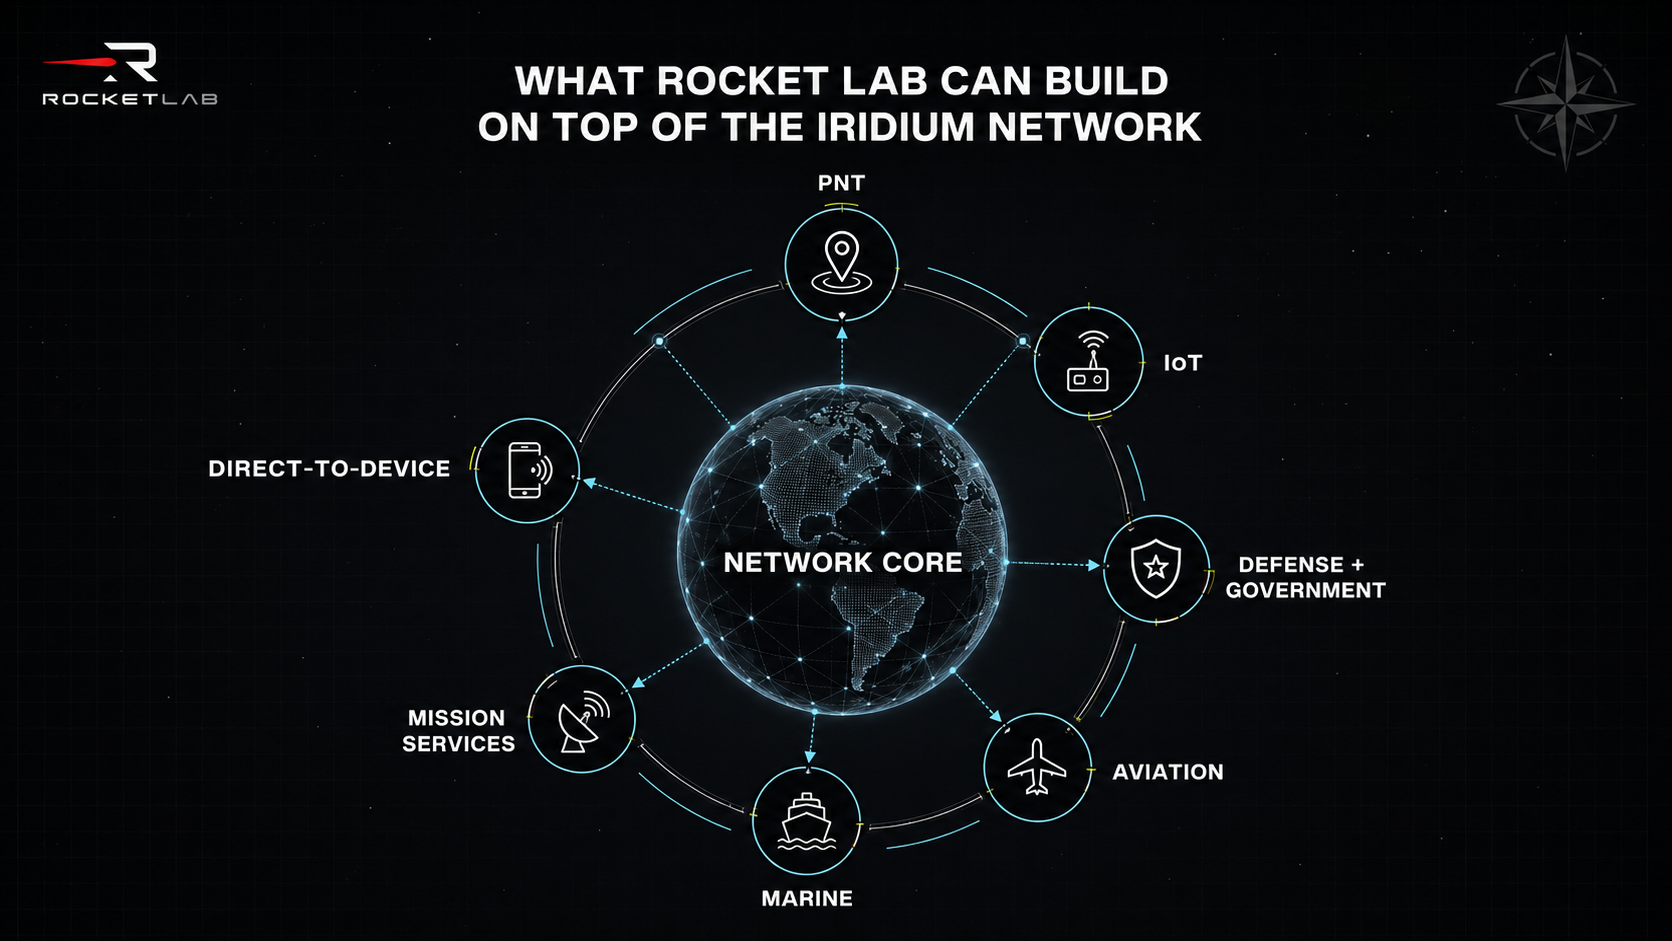
The constraint is the sales cycle. Critical infrastructure operators move slowly, procurement runs through security review, and deployment happens in phases. Revenue arrives later than the opportunity suggests, so the Base overlay assigns a specific and modest $60 million of incremental 2030 revenue to Rocket Lab-accelerated PNT above the standalone forecast.
NTN Direct addresses a different opportunity through the 3GPP non-terrestrial network standard. A standards-based module lets ordinary devices connect to satellites without proprietary terminals, opening telecom partnerships, industrial IoT, emergency messaging, automotive, agriculture, logistics, and utilities.
The limits are real and should not be glossed over. The use case is narrowband messaging and telemetry, nothing close to mass-market broadband. Revenue sharing with telecom partners is unsettled, device economics are unproven at scale, and constellation capacity is finite. Base assigns $40 million of 2030 overlay revenue to direct-to-device and NTN.
The proxy and the Rocket Lab overlay
Iridium's own management forecast, disclosed through the transaction, supplies the operating anchor.
Proxy metric | 2030 |
|---|---|
Revenue | $1.242B |
Adjusted OEBITDA | $748M |
Unlevered free cash flow | $529M |
2031 unlevered free cash flow | $(21)M |
These are unaudited transaction projections and not guidance. They exclude any strategic action Rocket Lab might take after closing, making them an anchor and not a ceiling. That 2031 figure is the one that shapes terminal value, and the renewal reserve section deals with it directly.
Base adds a separately identified overlay above the proxy, so a reader can strip it out entirely and still see Iridium's standalone economics.
Application | Incremental 2030 revenue |
|---|---|
PNT | $60M |
Direct-to-device and NTN | $40M |
Defense and government | $35M |
Aviation and marine | $25M |
Mission services | $25M |
IoT and other | $15M |
Total overlay | $200M |
Combined, Base carries $1.442 billion of network and applications revenue in 2030 at 50% gross margin, producing $878 million of adjusted OEBITDA at roughly 61% margin.
2030 scenario | Network revenue | Adjusted OEBITDA |
|---|---|---|
Standalone | $0 | $0 |
Stress | $1.100B | $540M |
Bear | $1.250B | $630M |
Base | $1.442B | $878M |
Bull | $1.650B | $1.050B |
Exceptional | $2.200B | $1.350B |
Stress carries a negative overlay, meaning integration disruption drags network revenue below Iridium's own standalone forecast. An acquisition going badly should look like that.
Part VIII: Aireon
The signal aircraft already transmit, and why oceans break it
Nearly every commercial aircraft in the world broadcasts an ADS-B message continuously. Automatic, so no crew action is required. Dependent, so the aircraft derives its position from satellite navigation in place of being found by radar.
Surveillance, so others can track it. Broadcast, so anyone able to receive it can.
The message carries identity, position, altitude, speed, direction, and vertical movement. Every aircraft is already telling the world exactly where it is, several times per second, at no incremental cost to anyone.
The signal was never the problem. Ground receivers cannot hear it over oceans, polar regions, deserts, jungles, and mountain ranges, and radio line of sight demands a receiver within range of roughly 70% of a planet that has no such infrastructure.
Without surveillance, oceanic air traffic control runs procedurally. Aircraft report position by voice or datalink at intervals. Controllers hold large separation buffers to absorb the uncertainty between those reports. Route and altitude changes get granted conservatively or not at all.
The costs are continuous and invisible to passengers. Larger separation puts fewer aircraft on efficient tracks. Restricted altitude changes leave aircraft at suboptimal levels burning more fuel.
Fixed routing prevents adjusting for winds. Search and rescue response slows when the last known position is 15 minutes old.
Space-based receivers change all of it. Position updates arrive continuously in place of at intervals, controllers gain the confidence to reduce separation, routing becomes flexible, fuel burn falls, and emergency response improves dramatically.
Customers, certification, and switching costs
Aireon's customers are national air navigation service providers, among them NAV CANADA, NATS in the United Kingdom, ENAIRE in Spain, AirNav Ireland, Isavia in Iceland, and Airways New Zealand.
None of these is a casual data subscription. Contracts run long. The service is certified for use in safety-critical air traffic control operations, which takes years of regulatory work to obtain. Once integrated, the data feeds directly into controller workstations and separation standards, and controllers are trained around it.
Replacing that supplier means recertifying the replacement, retraining controllers, revalidating separation standards, and accepting operational risk throughout the transition. Switching costs like that produce durable revenue.
The data layer and safety intelligence
The surveillance signal is collected once and sold repeatedly, which is where operating leverage appears.
Past air traffic control, the same data supports airline route analysis and fuel optimization, airport congestion and gate management, government airspace monitoring, safety organization investigation and event reconstruction, and aviation insurance risk assessment. Each additional customer consumes data that has already been gathered and processed.
Jamming and spoofing add a dimension with growing commercial and national-security value. An individual aircraft experiencing GPS interference can only report its own degraded state. Aireon observes the same phenomenon across many aircraft at once, which allows it to locate interference geographically, distinguish jamming from spoofing, map affected regions, and reconstruct flight paths through conflict zones. That capability has become considerably more relevant over the last several years.
Space-based VHF sits further out. Extending pilot-controller voice communication into oceanic and remote airspace would remove another constraint of procedural control, and it requires spectrum coordination, certification, aircraft compatibility, and capacity that do not yet exist. Base carries zero material revenue for it. Meaningful value appears only in Bull and Exceptional, after evidence arrives.
Aireon as the template
Aireon's strategic importance to Rocket Lab exceeds its revenue, and the reason is that it demonstrates a repeatable pattern.
One constellation, already funded for communications, also supports aviation surveillance and potentially positioning and timing, weather sensing, missile warning, environmental monitoring, and space domain awareness. Each additional payload raises revenue per satellite without a new fleet underneath it.
Rocket Lab is the only party to this transaction that can manufacture payloads, build spacecraft, launch them, and operate them. If the next-generation Iridium constellation is designed from inception to carry multiple revenue-generating payloads, built and launched internally, the economics of that replacement cycle look nothing like the last one.
Part IX: The Iridium Transaction and Combined Architecture
The shape of the deal and the exchange-ratio collar
Rocket Lab agreed to acquire Iridium at approximately $8 billion enterprise value, at $54 per Iridium share, roughly half cash and half Rocket Lab stock.
The structural facts are unusual enough to sit with for a moment. The target is larger than the acquirer by revenue and dramatically larger by cash generation. The target carries meaningful debt. The acquirer remains unprofitable on a GAAP basis while funding a major vehicle development program at the same time.
One question falls out of that configuration, and the rest of this section works toward it. Can the combined company create more enterprise value than the equity, cash, and debt required to assemble it?
The exchange ratio floats within a collar, and the mechanism has consequences the market frequently skips over. Below a $67.50 reference price, Iridium holders receive a fixed 0.4000 Rocket Lab shares. Above $112.50, they receive a fixed 0.2400 shares. Between those points, the ratio is $27 divided by the reference price, determined on a ten-day volume-weighted average.
Inside the collar, the stock component delivers a fixed $27 of value per Iridium share wherever Rocket Lab trades, so Rocket Lab issues fewer shares when its price is higher. Outside the collar in either direction, the value delivered floats with the price.
The circularity runs in a loop. A higher Rocket Lab share price reduces merger shares issued, which reduces dilution, which supports the share price. It also improves the efficiency of the separate equity financing, as fewer shares raise the same cash. A lower price increases both the merger share count and the financing share count, which increases dilution, which pressures the price further.
Rocket Lab's share price is therefore an input to its own acquisition cost, so share count appears here as a scenario output and never as a fixed assumption.
Financing the cash consideration
Immediate use | Amount |
|---|---|
Cash consideration | $2.861B |
Transaction and integration costs | $230M |
Total immediate uses | $3.091B |
Funding source | Amount |
|---|---|
Rocket Lab cash | $850M |
Acquisition equity | $1.250B |
New permanent debt | $991M |
Total | $3.091B |
Rocket Lab held approximately $2.4 billion of liquidity at Q2 and Base uses $850 million of it. The restraint is deliberate and necessary.
Neutron development and production consume cash through 2027 and beyond. Working capital requirements rise with every new spacecraft program. Space Systems capacity expansion continues.
Integration itself costs money, the combined company needs resilience against an operational surprise in either business, and the network requires ongoing investment. Spending the entire balance at close would leave no margin for any of it.
Base assumes $1.775 billion of Iridium's existing term loan is retained through financing amendments, plus $155 million of other assumed obligations and $991 million of new permanent debt, producing approximately $2.921 billion of immediate pro forma gross debt.
Retaining the existing term loan is a meaningful assumption. Iridium's debt was arranged in a different rate environment, and replacing it at current terms would raise interest expense materially. A committed bridge facility provides certainty of funds, which is a different thing entirely from certainty of economics. Bridges are expensive and designed to be replaced, and the terms on which permanent financing arrives set several years of interest expense.
The diluted share count and purchase accounting
Dilution source | Base |
|---|---|
2026 diluted framework | 665M |
Iridium merger consideration and assumed awards | 46M |
Acquisition equity financing at $70 | 18M |
Ongoing compensation and other through 2030 | 41M |
2030 fully diluted shares | 770M |
Scenario | 2030 diluted shares |
|---|---|
Standalone | 720M |
Stress | 860M |
Bear | 815M |
Base | 770M |
Bull | 750M |
Exceptional | 735M |
The inverse relationship between scenario quality and share count is not an artifact of construction. Stronger outcomes mean equity is issued at higher prices, so fewer shares raise the same capital. Stronger outcomes generate operating cash sooner, so less external financing is required. Stronger outcomes also need fewer shares to deliver the same dollar value of employee compensation.
A weak scenario compounds in the opposite direction. Lower prices mean more shares for the same cash, slower cash generation means more financing, and depressed prices mean more shares issued for the same compensation value. Stress carries 860 million shares against Base's 770 million, and that 12% gap lands on top of far worse operating results.
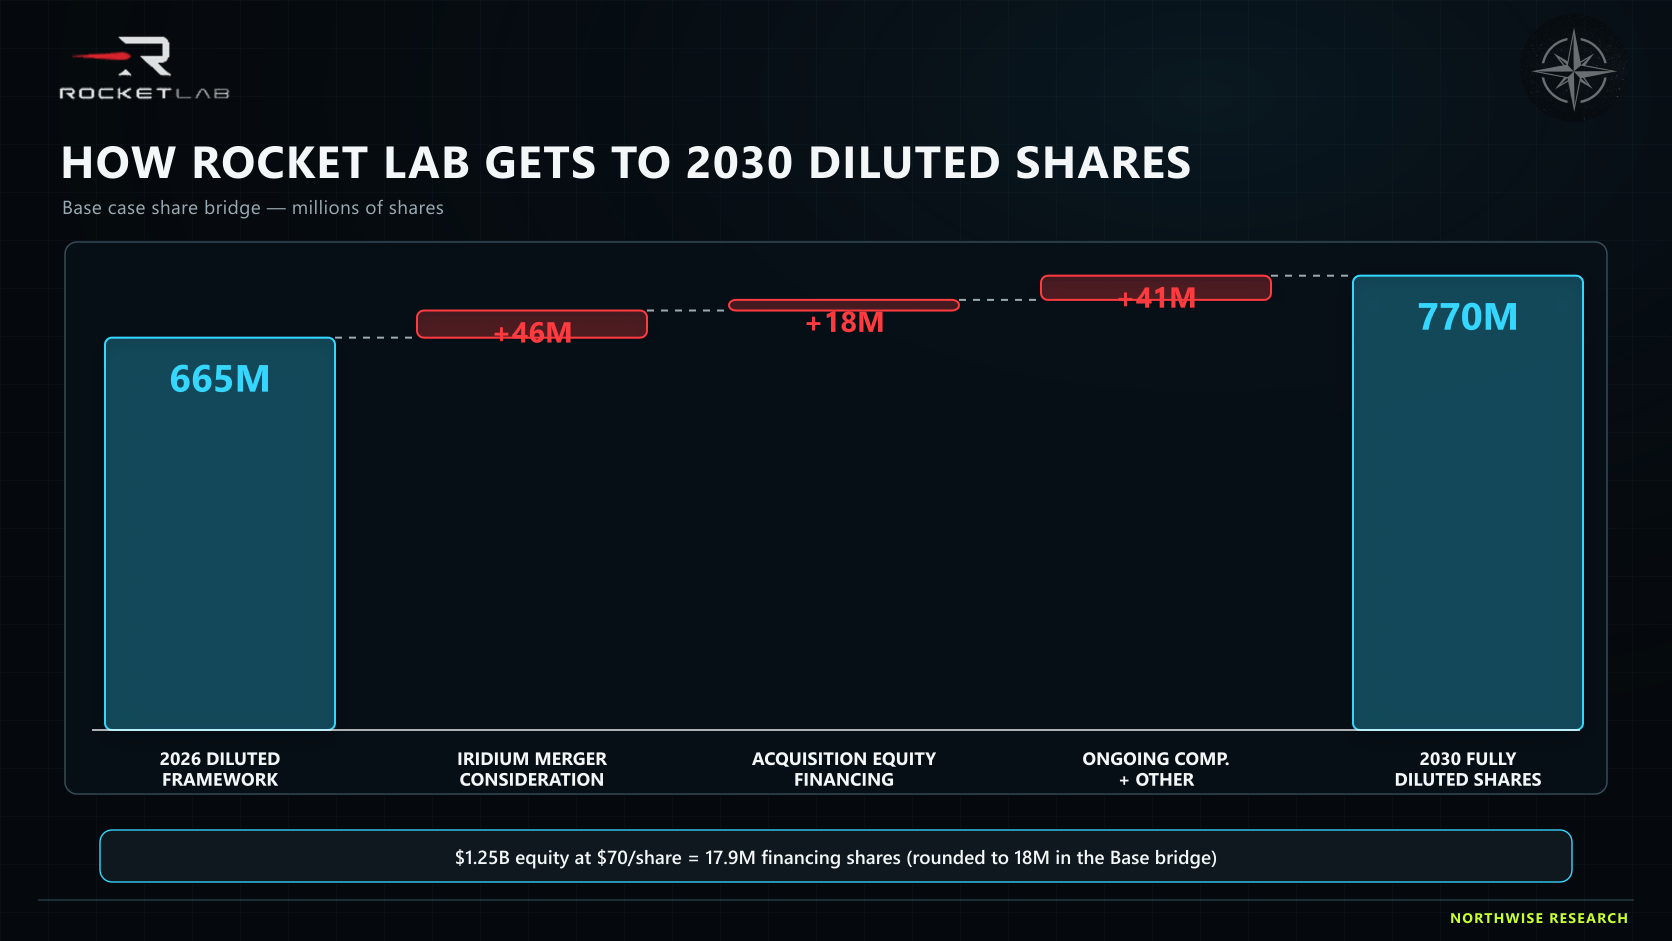
Purchase accounting adds a wrinkle to reported earnings. The acquisition creates identifiable intangibles, principally spectrum rights, customer relationships, and technology, plus goodwill, and those intangibles amortize through the income statement over their assigned lives. GAAP net income and EPS will be reduced by acquired intangible amortization for years while cash flow is unaffected.
Both treatments deserve care. Ignoring the amortization entirely pretends the acquisition price was free. Treating it as an ongoing economic cost double-counts a purchase price already reflected in the debt and shares issued. GAAP earnings are reported here including the charge, and the business is valued on cash and operating earnings.
The flywheel and the trap
The strategic case assembles into a sequence. Reliable launch creates customer relationships. Those relationships create component and spacecraft sales. Complete mission delivery deepens trust and produces prime awards.
Network ownership creates recurring revenue. Recurring revenue funds reinvestment. Reinvestment expands launch and spacecraft capability. Internal manufacturing and launch lower the cost of the network's own renewal cycle, and hosted payloads raise revenue per satellite.
Each stage feeds the next, and the cost advantage on network renewal is the piece no competitor can replicate.
The same structure runs in reverse with equal force. Debt service consumes network cash meant for reinvestment. Neutron absorbs capital without generating adequate returns. Fixed-price programs lose margin on execution.
Integration damages Iridium's partner relationships and its recurring revenue. Overcentralizing Aireon disrupts a business that works. Further acquisitions add complexity before the current one has stabilized. Dilution rises to cover the gap.
The company grows and per-share value stagnates. That is the specific failure mode this architecture creates, and detecting it is what the valuation section exists to do.
Part X: The Full Operating Model
How the model is built and where it starts
The forecast runs in one direction and never reverses.
Physical activity comes first, meaning launch cadence, mission allocation, and program delivery. Revenue follows from that activity. Gross margin applies by segment.
Cash operating expenses produce adjusted EBITDA. Share-based compensation, depreciation and amortization, integration expense, and interest produce GAAP earnings. Capital expenditure and working capital produce owner free cash flow, a renewal reserve adjusts the terminal year, and debt and share count are tracked separately by scenario.
Valuation happens last, after the gate. The governing principle is easy to state and easy to violate: the price target is an output and never determines the operating assumptions that produce it.
Every scenario begins from the same 2026 base, which removes a degree of freedom from the comparison. Revenue of $1.0 billion comprises $194 million Electron, $61 million HASTE and GHOST, $300 million components, $390 million prime programs, $55 million mission operations, and no Neutron or network contribution. Gross margin runs 34.9%, adjusted EBITDA is negative $45 million, GAAP net loss is $166 million, EPS is negative $0.25, owner free cash flow is negative $461 million, net cash is $2.0 billion, and diluted shares are 665 million.
Revenue and gross margin by engine
$ millions | 2026 | 2027 | 2028 | 2029 | 2030 |
|---|---|---|---|---|---|
Electron | 194 | 252.5 | 312 | 371 | 432 |
HASTE and GHOST | 61 | 105 | 150 | 185 | 218 |
Neutron | 0 | 165 | 372 | 670 | 986 |
Components | 300 | 440 | 600 | 820 | 1,150 |
Prime programs | 390 | 700 | 1,050 | 1,350 | 1,650 |
Mission operations | 55 | 90 | 145 | 230 | 340 |
Iridium and applications | 0 | 520 | 1,149 | 1,287 | 1,442 |
Total revenue | 1,000 | 2,272.5 | 3,778 | 4,913 | 6,218 |
Two features of that table get misread easily. The 2027 network contribution of $520 million reflects a half year of consolidation following an assumed mid-2027 close, and 2028 is the first full network year, so organic Rocket Lab growth has to be read separately from acquisition accounting.
The distribution matters as much as the total. No single engine exceeds 27% of 2030 revenue, and Base does not require dominance in any one market.
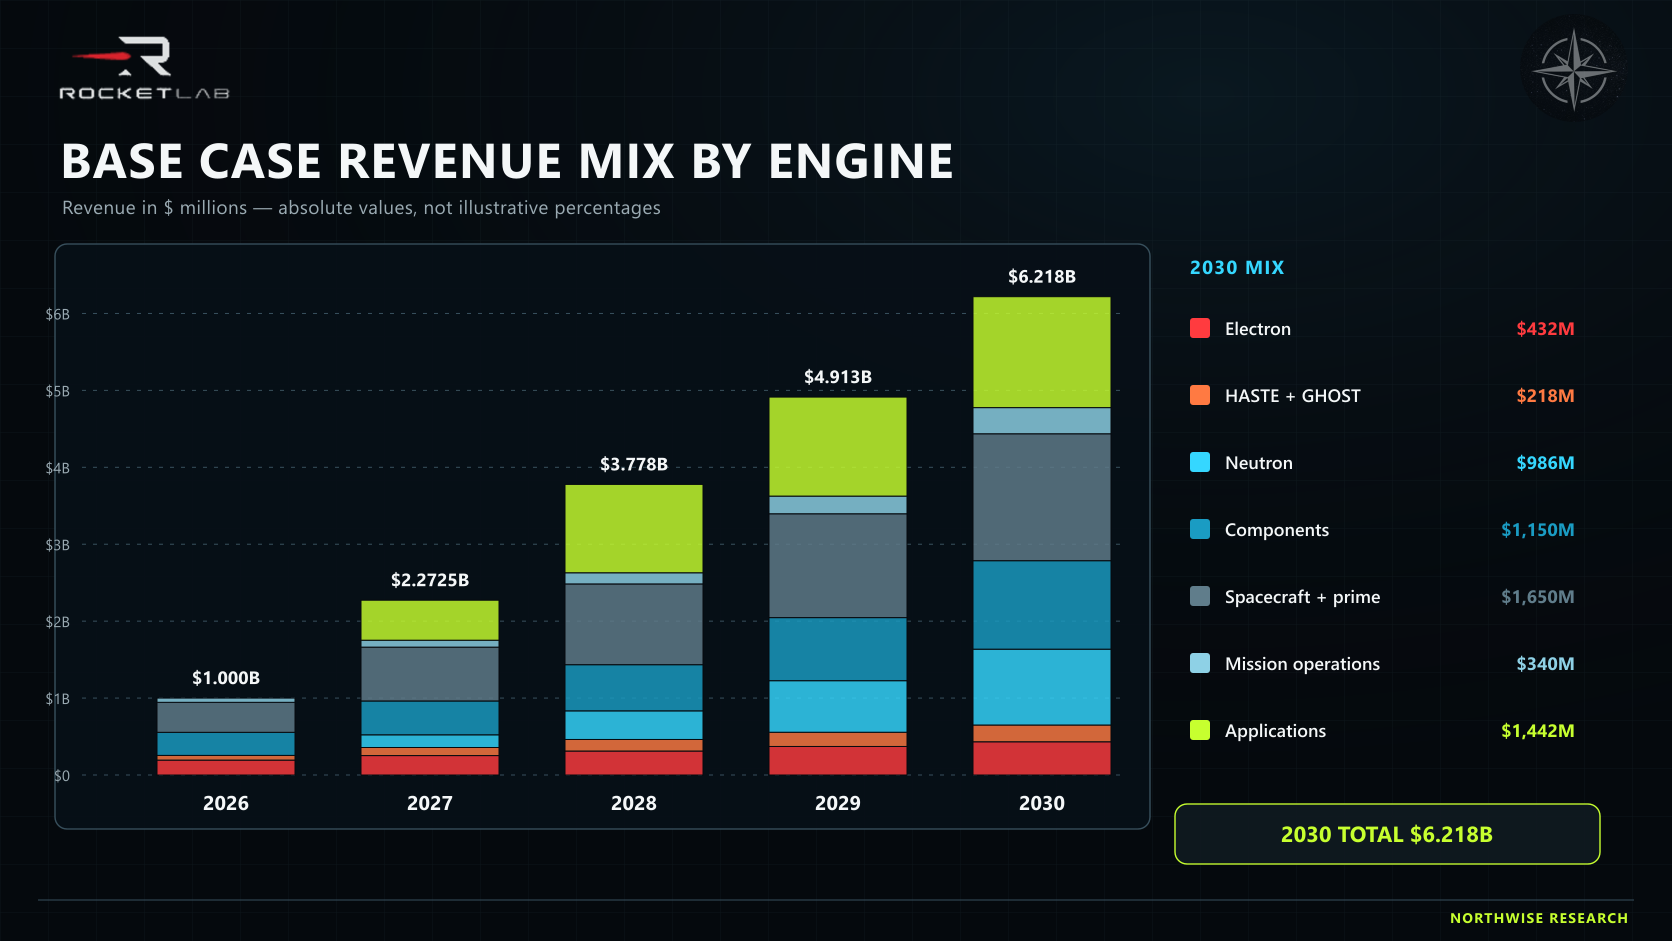
Margin by engine follows a different path from revenue, and the two should be read together.
Segment | 2026 | 2027 | 2028 | 2029 | 2030 |
|---|---|---|---|---|---|
Electron | 44% | 45% | 46% | 47% | 48% |
HASTE and GHOST | 32% | 36% | 39% | 42% | 44% |
Neutron | 0% | (35%) | (5%) | 18% | 38% |
Components | 36% | 38% | 40% | 42% | 45% |
Prime programs | 31% | 33% | 35% | 36.5% | 38% |
Mission operations | 28% | 30% | 33% | 36% | 40% |
Iridium and applications | 0% | 46% | 48% | 49% | 50% |
Consolidated | 34.9% | 33.4% | 36.8% | 39.1% | 43.1% |
Consolidated margin dips in 2027 for identifiable reasons. Early Neutron flights carry deeply negative margin while fixed costs spread across very few missions. Acquisition mix brings a partial year of network revenue alongside integration disruption. Spacecraft programs scale faster than their margin improves.
The 2030 figure of 43.1% leans heavily on Neutron reaching 38% and the network holding 50%. Neither is guaranteed, and the scenario set tests both.
Operating expenses, adjusted EBITDA, and GAAP earnings
Base cash R&D runs from $264.1 million in 2026 to $390 million in 2030, and cash SG&A from $130.1 million to $260 million.
Year | Adjusted EBITDA | Margin |
|---|---|---|
2026 | $(45M) | (4.5%) |
2027 | $288M | 12.7% |
2028 | $870M | 23.0% |
2029 | $1.333B | 27.1% |
2030 | $2.029B | 32.6% |
Operating expenses grow at roughly half the rate of revenue, which is where most of the margin expansion originates. Adjusted EBITDA adds back share-based compensation and depreciation, both real economic costs, so the line should never be read as cash available to shareholders.
Below adjusted EBITDA, non-cash charges and financing costs take over the income statement.
Year | GAAP net income | Diluted shares | GAAP EPS |
|---|---|---|---|
2026 | $(166M) | 665M | $(0.25) |
2027 | $(287M) | 725M | $(0.40) |
2028 | $77M | 745M | $0.10 |
2029 | $413M | 760M | $0.54 |
2030 | $912M | 770M | $1.18 |
The 2027 result is the one that needs explaining, with adjusted EBITDA positive at $288 million while net income falls to negative $287 million. The gap comprises $135 million of share-based compensation, $220 million of depreciation and amortization including acquired intangibles, $100 million of transaction and integration expense, and $120 million of net interest following the debt draw.
GAAP profitability arrives in 2028 and scales quickly afterward, as the largest non-cash charges stabilize while gross profit keeps growing.
Capital spending, cash flow, the renewal reserve, and dilution
Year | Capex | Working capital increase | Owner FCF |
|---|---|---|---|
2026 | $135M | $260M | $(461M) |
2027 | $220M | $170M | $(432M) |
2028 | $320M | $140M | $(13M) |
2029 | $400M | $120M | $368M |
2030 | $500M | $100M | $872M |
Capital expenditure funds Neutron production capacity, launch infrastructure, Space Systems factories, and network investment. Working capital funds inventory, long-lead procurement, and contract assets on programs where delivery precedes payment. Physical growth consumes cash before it produces revenue, which is why a manufacturer scaling this fast burns cash even as its income statement improves.
Owner free cash flow deliberately leaves out the add-back of share-based compensation. Paying employees in stock is a real cost borne by existing shareholders through dilution, and adding it back produces a cash flow figure no shareholder ever receives.
Then there is the wall sitting just past the forecast window. Iridium's own projection shows unlevered free cash flow of $529 million in 2030 falling to negative $21 million in 2031 as constellation replacement investment begins.
Capitalizing a 2030 peak as though it were permanent would overstate terminal value substantially. Base therefore reduces 2030 owner free cash flow of $872 million by a $172 million network renewal reserve, producing $700 million of normalized owner free cash flow.
The reserve is not a full replacement budget, and replacing 66 satellites costs far more than $172 million a year. It is an annualized guardrail preventing the terminal year from being valued as though the investment cycle were not coming, and it is the most conservative adjustment anywhere in this work.
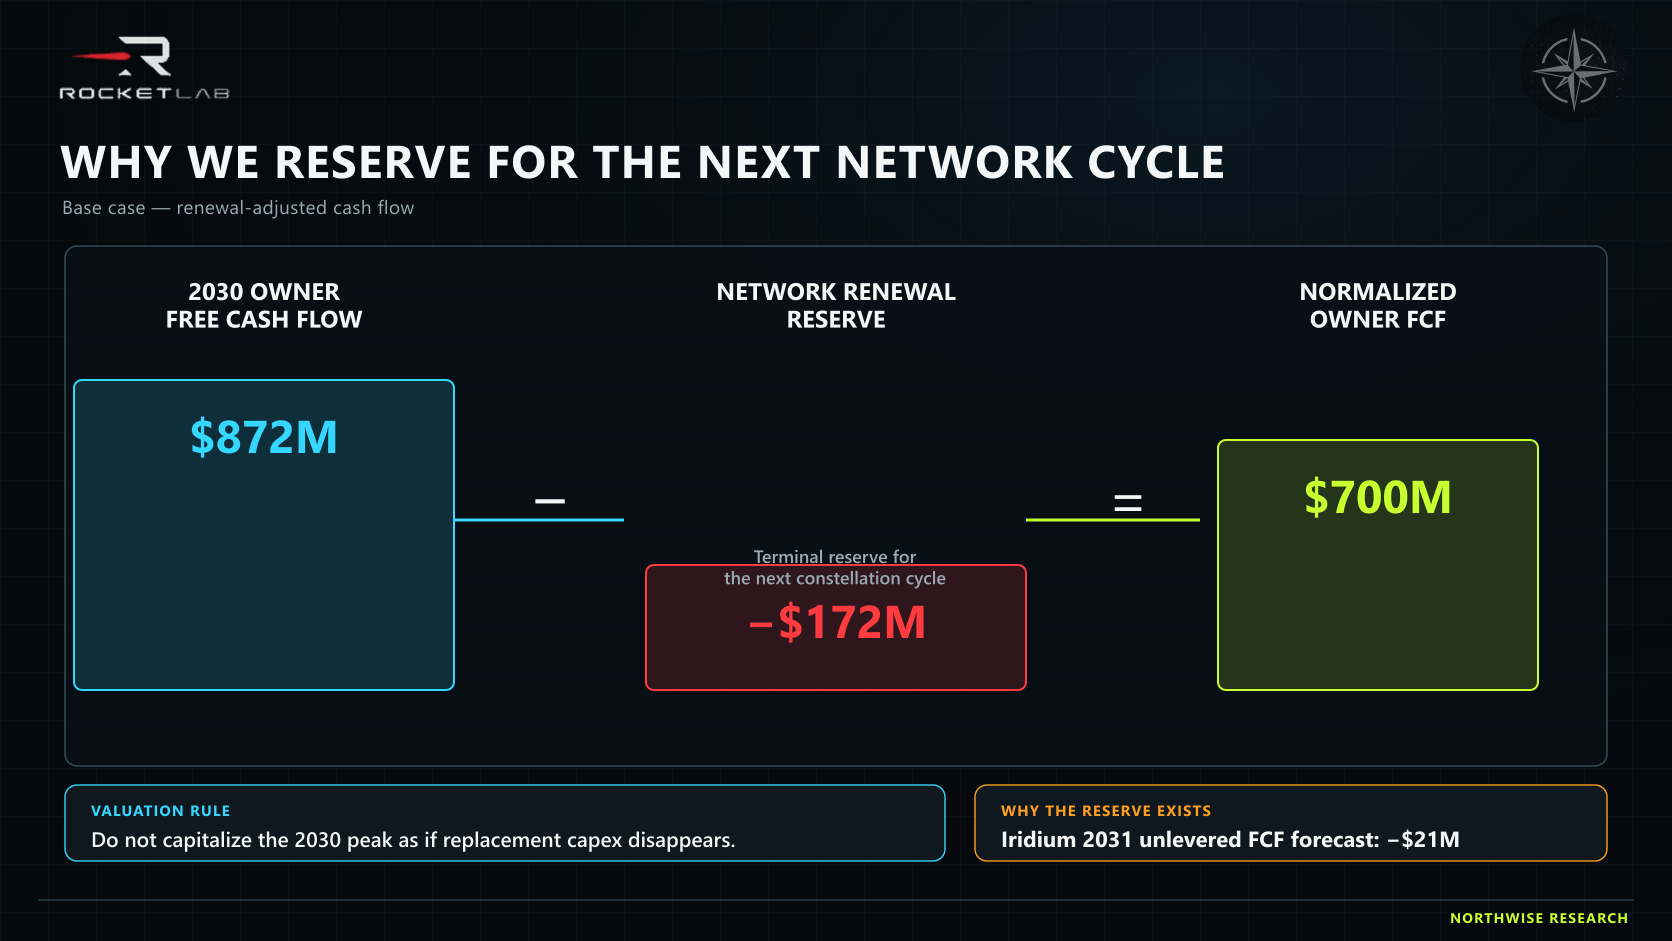
Net cash of $2.0 billion in 2026 becomes $2.0 billion of net debt in 2027 following the transaction, then falls to $1.4 billion in 2028, $900 million in 2029, and $600 million in 2030 as operating cash flow arrives. Net interest moves from $60 million of income in 2026 to $120 million of expense in 2027, peaks at $220 million in 2028 with a full year of post-close debt, then declines to $160 million and $100 million as the balance comes down.
Diluted shares rise from 665 million to 770 million across the period. Rocket Lab can become a substantially larger company while an existing share represents a smaller portion of it, and in Base both statements are true at once.
The complete Base case and the six-scenario table
Base describes a company flying 50 Electron and HASTE missions and 18 physical Neutron missions in 2030, of which 14.5 are external revenue equivalents. It generates $1.636 billion of Launch revenue, $3.140 billion of Space Systems revenue, and $1.442 billion of network and applications revenue, totaling $6.218 billion at 43.1% gross margin.
That produces $2.029 billion of adjusted EBITDA, $912 million of GAAP net income, $1.18 of EPS, $872 million of owner free cash flow, $700 million normalized, against $600 million of net debt and 770 million shares.
What Base does not require is as informative as what it does. Neutron does not have to challenge the dominant launch provider. Mass-market satellite broadband never appears.
Space-based VHF contributes nothing. The next-generation Iridium constellation is never completed. No large unnamed acquisition arrives, and Rocket Lab does not win every government program it bids.
2030 metric | Standalone | Stress | Bear | Base | Bull | Exceptional |
|---|---|---|---|---|---|---|
Revenue | $4.540B | $3.540B | $4.890B | $6.218B | $8.950B | $12.600B |
Gross margin | 39.7% | 36.0% | 39.1% | 43.1% | 46.6% | 50.0% |
Adjusted EBITDA | $1.213B | $556M | $1.211B | $2.029B | $3.483B | $5.544B |
GAAP net income | $614M | $(514M) | $239M | $912M | $2.020B | $3.509B |
Owner FCF | $589M | $(394M) | $274M | $872M | $2.015B | $3.519B |
Normalized owner FCF | $520M | $(394M) | $250M | $700M | $1.450B | $2.400B |
Net debt / (net cash) | $1.8B cash | $4.2B debt | $2.4B debt | $600M debt | $800M cash | $2.0B cash |
Diluted shares | 720M | 860M | 815M | 770M | 750M | 735M |
Standalone assumes the Iridium transaction never closes. Rocket Lab succeeds as a launch and Space Systems platform, generates $4.540 billion of revenue with no debt burden and $1.8 billion of net cash, and forgoes the network, the spectrum, the subscriber base, Aireon, and the applications flywheel. It is a different company, not merely a weaker one.
Stress assumes the transaction closes and then several problems arrive together. Neutron reaches only four physical missions, Space Systems margins compress under fixed-price losses, network revenue drops below Iridium's own standalone forecast through integration disruption, financing turns expensive, and net debt compounds to $4.2 billion against 860 million shares.
Bear assumes the platform works and stays incomplete. Neutron flies ten missions without achieving reuse economics, prime margins stay uneven, applications adoption is slow, and leverage persists at $2.4 billion.
Bull assumes launch, Space Systems, and applications reinforce one another, with Neutron at 30 missions and working reuse, prime revenue at $2.500 billion, the network at $1.650 billion, and the company back to net cash. Exceptional assumes upper-tail execution across every engine at once, producing $12.600 billion of revenue at 50% gross margin.
One comparison in that table repays attention. Standalone and Bear produce nearly identical adjusted EBITDA from very different revenue bases, and Standalone's clean balance sheet makes its equity outcome materially better despite lower revenue. Capital structure, not revenue, separates them.
Part XI: Risks, Offsets, and Thesis Breakers
Neutron delay versus Neutron failure
A first flight slipping from late 2026 into early or mid-2027 does not break the 2030 forecast, and the reason is that eleven other things keep producing revenue while it happens.
Electron continues at 20 or more missions annually with improving margin. HASTE grows on defense procurement schedules independent of commercial launch demand. GHOST creates infrastructure and readiness revenue. Prime awards recognize revenue across program lives already underway.
Flatellite reduces cost on programs already won. Components sell into competitors' spacecraft regardless of Neutron's schedule. GEO expands dollar content per unit. Mission operations grows on contracts already signed.
Iridium contributes recurring revenue from an operating network. PNT addresses a problem that exists today. Aireon serves customers on multi-year contracts. Europe adds sovereign demand.
A two-quarter slip shifts revenue between years and trims the 2030 mission count modestly. The timing sensitivity shows a Q2 2027 first flight still reaching 16 physical missions by 2030, and a Q4 2027 slip still reaching 13. The company survives either one intact.
Structural failure is a different event. The word gets used loosely, so it needs a definition.
A broken Neutron requires major propulsion redesign, structural redesign, broad stage requalification, repeated integrated failures, an inability to reach economically meaningful reuse, or a production system that cannot scale past a handful of vehicles per year.
The consequences compound on one another. Launch revenue falls directly. Gross margin falls further, as fixed costs remain in place.
Full-stack credibility erodes, which affects Space Systems bids where launch is part of the offering. External launch dependence continues, raising the cost of Rocket Lab's own network deployment. The public-market scarcity premium compresses.
Cash burn extends. Financing needs rise. Dilution increases at depressed prices.
That is the Stress scenario, and it is why Stress produces a target roughly 90% below Base despite the company still generating $3.540 billion of revenue.
Space Systems execution and fixed-price risk
Backlog does not guarantee attractive program economics, and this is the aerospace risk the market underweights most consistently.
Fixed-price contracts transfer cost overruns to the contractor. Under percentage-of-completion accounting, a cost estimate revision produces a catch-up adjustment in the current period, which can turn a profitable quarter into an unprofitable one. Supplier delays cascade into schedule penalties. Liquidated damages attach to late delivery, and customer concentration in government programs means a single procurement decision can move an entire year.
MDA demonstrated both sides of that. The program hit supply chain delays with real liquidated-damages exposure, and Rocket Lab recovered it and delivered the first eight spacecraft to orbit. Recovery is evidence of capability. The exposure was equally real while it lasted.
Iridium financing, integration, and network risk
Closing risk remains until the shareholder vote scheduled for September 24 and the remaining regulatory conditions clear. Antitrust clearance lowers the probability of failure without eliminating the conditions.
Financing risk continues after closing. The bridge has to be replaced with permanent debt at acceptable terms, and rates at the time of takeout set several years of expense. A lower Rocket Lab share price during the financing window increases equity issuance and dilution.
Integration risk is the subtler exposure. Iridium's model depends on partners and resellers who own the customer relationships, and a buyer that centralizes those relationships can damage the distribution system producing the revenue. Aireon operates as a separate business with its own certifications and customers, and overintegrating it would put a working franchise at risk. Culture mismatch between a mature network operator and a fast-moving manufacturer is an operational risk and not a soft one, and further acquisitions before this one stabilizes would compound every item above.
On the network itself, PNT sales cycles into critical infrastructure run long and the Base overlay assumes adoption that has not yet happened at scale. NTN economics depend on revenue-sharing terms with telecom partners that remain unsettled, while better-capitalized players build competing direct-to-device offerings. IoT faces ongoing revenue-per-device pressure, EMSS renewal carries procurement timing risk, and broadband continues to decline.
The largest structural item sits just past the forecast window. The current constellation serves into approximately 2035, and the capital step-up begins in 2031 as Iridium's own projection shows. The $172 million renewal reserve is a guardrail, and the full replacement decision falls outside this horizon while affecting the terminal value inside it.
Competition and the scarcity thesis
Two competitive risks apply here, and they operate independently of one another.
Operating competition comes from SpaceX, Blue Origin, ULA, Firefly, Stoke, Relativity, traditional primes moving into small satellites, and new component suppliers. Rocket Lab has to win work against all of them.
Valuation competition is separate and far less discussed. A meaningful portion of Rocket Lab's multiple exists due to the absence of comparable public alternatives. If SpaceX lists, or several credible space companies reach public markets, the scarcity premium can compress while Rocket Lab's operations perform exactly as forecast. That risk is quantified explicitly after the gate.
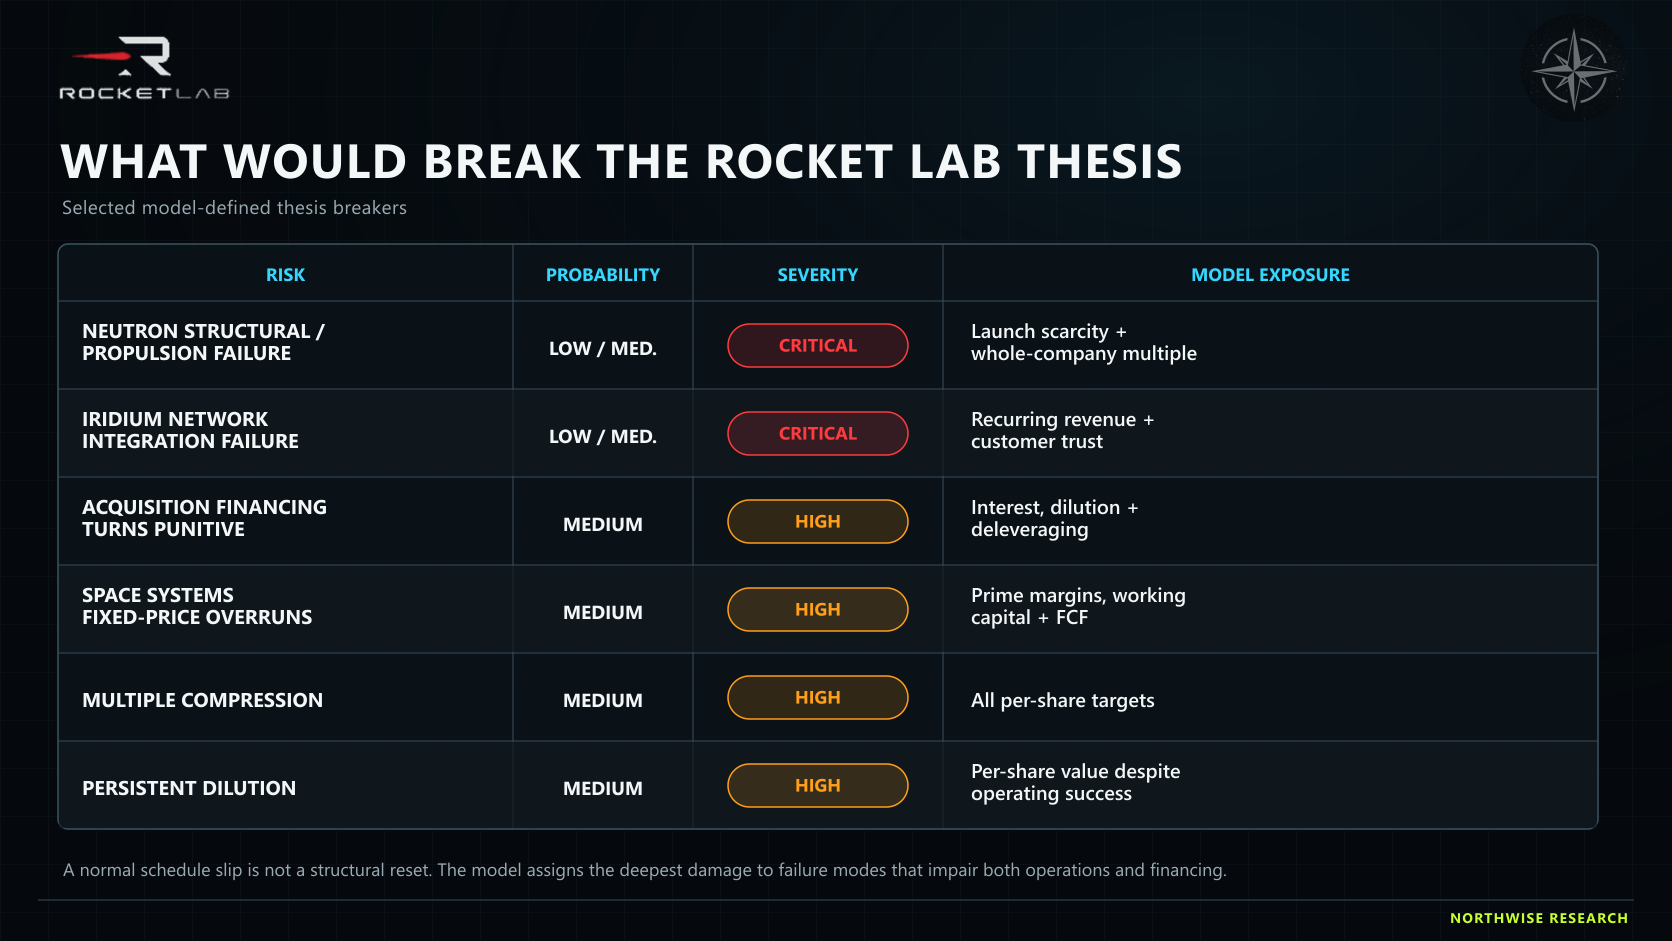
The monitoring framework and what would falsify the thesis
Area | What to track |
|---|---|
Electron | Missions flown, factory output, gross margin |
HASTE | New awards, mission cadence, infrastructure support revenue |
Neutron | Qualification progress, pad integration, first flight, repeat flights, recovery |
Prime programs | New awards, program milestones, catch-up adjustments |
Components | External sales, optical terminal output, product margins |
Mission operations | New recurring tasking and readiness contracts |
Iridium | Revenue, OEBITDA, subscribers, EMSS renewal, PNT wins |
Aireon | Contract expansion, data products, VHF evidence |
Capital | Cash burn, working capital, debt, equity issue price, diluted shares |
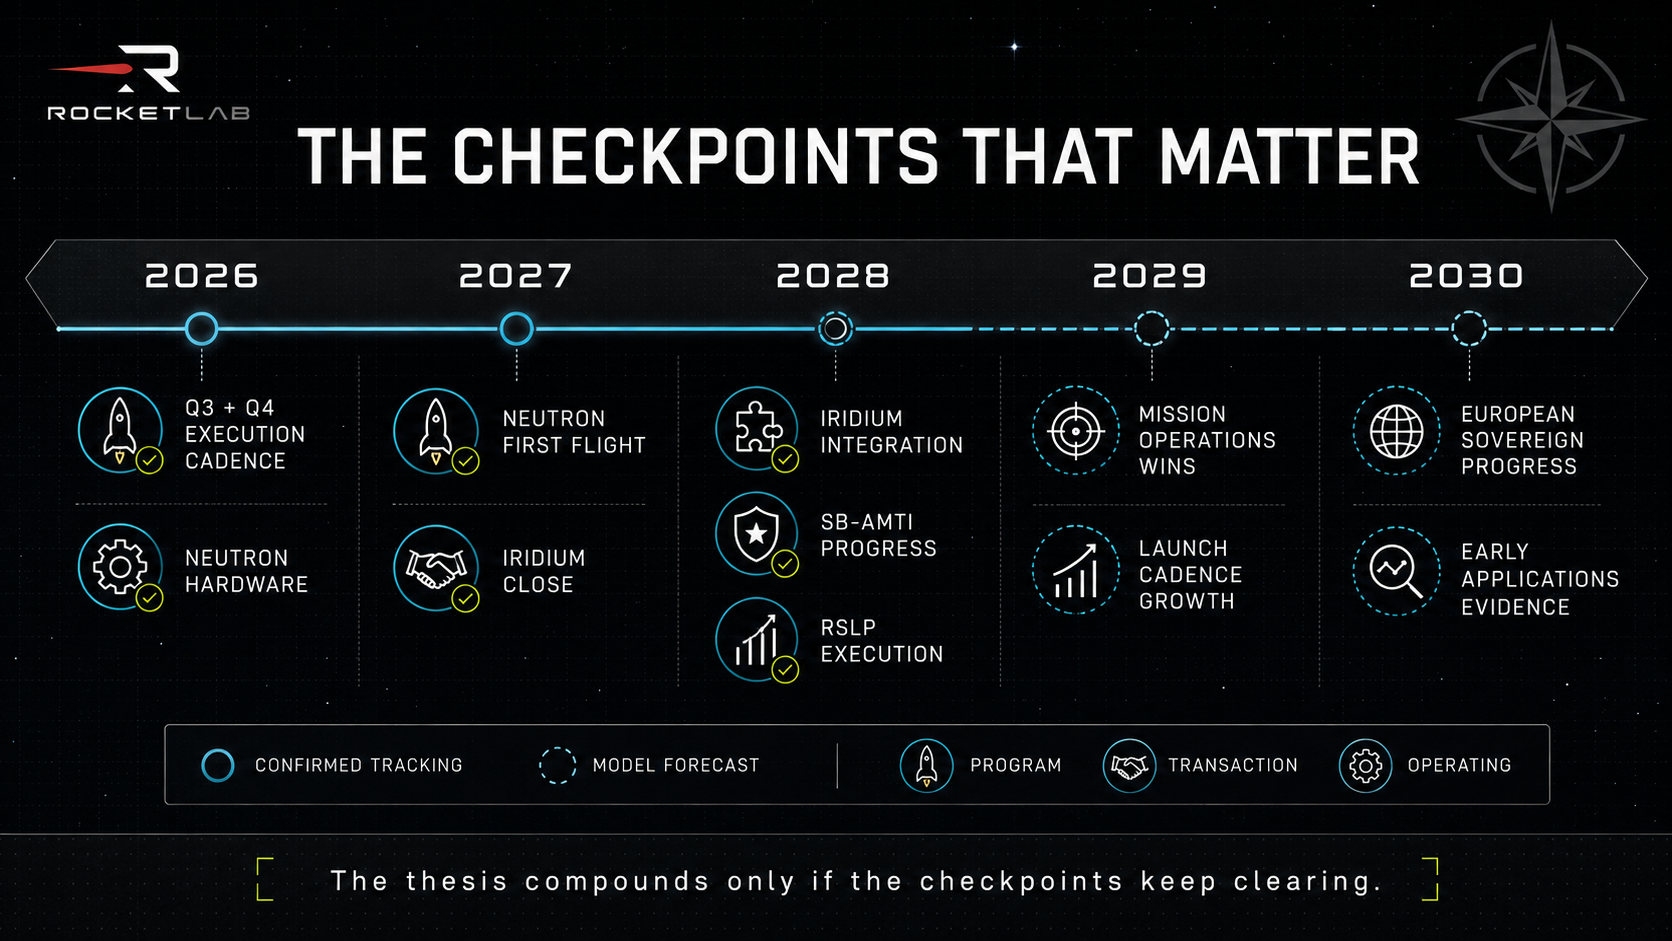
Monitoring detects drift. Falsification is a higher bar, and the conditions below would require rebuilding this work in place of adjusting it.
Neutron's first flight forces broad redesign or requalification. Neutron reaches flight and reuse remains economically irrelevant through 2029. Space Systems revenue scales without any margin progression. Prime-program catch-up losses become recurring in place of isolated.
Iridium financing costs exceed the forecast materially. Diluted shares move toward the Stress path without operating evidence deteriorating in parallel, which would indicate financing distress. PNT and applications remain immaterial through 2029. Network renewal capital is required materially earlier than 2031.
Rocket Lab loses government confidence or program eligibility. The public-market scarcity premium collapses while cash generation stays insufficient to compensate.
Any two of those occurring together would move this from a Base-case company to a Bear-case company.
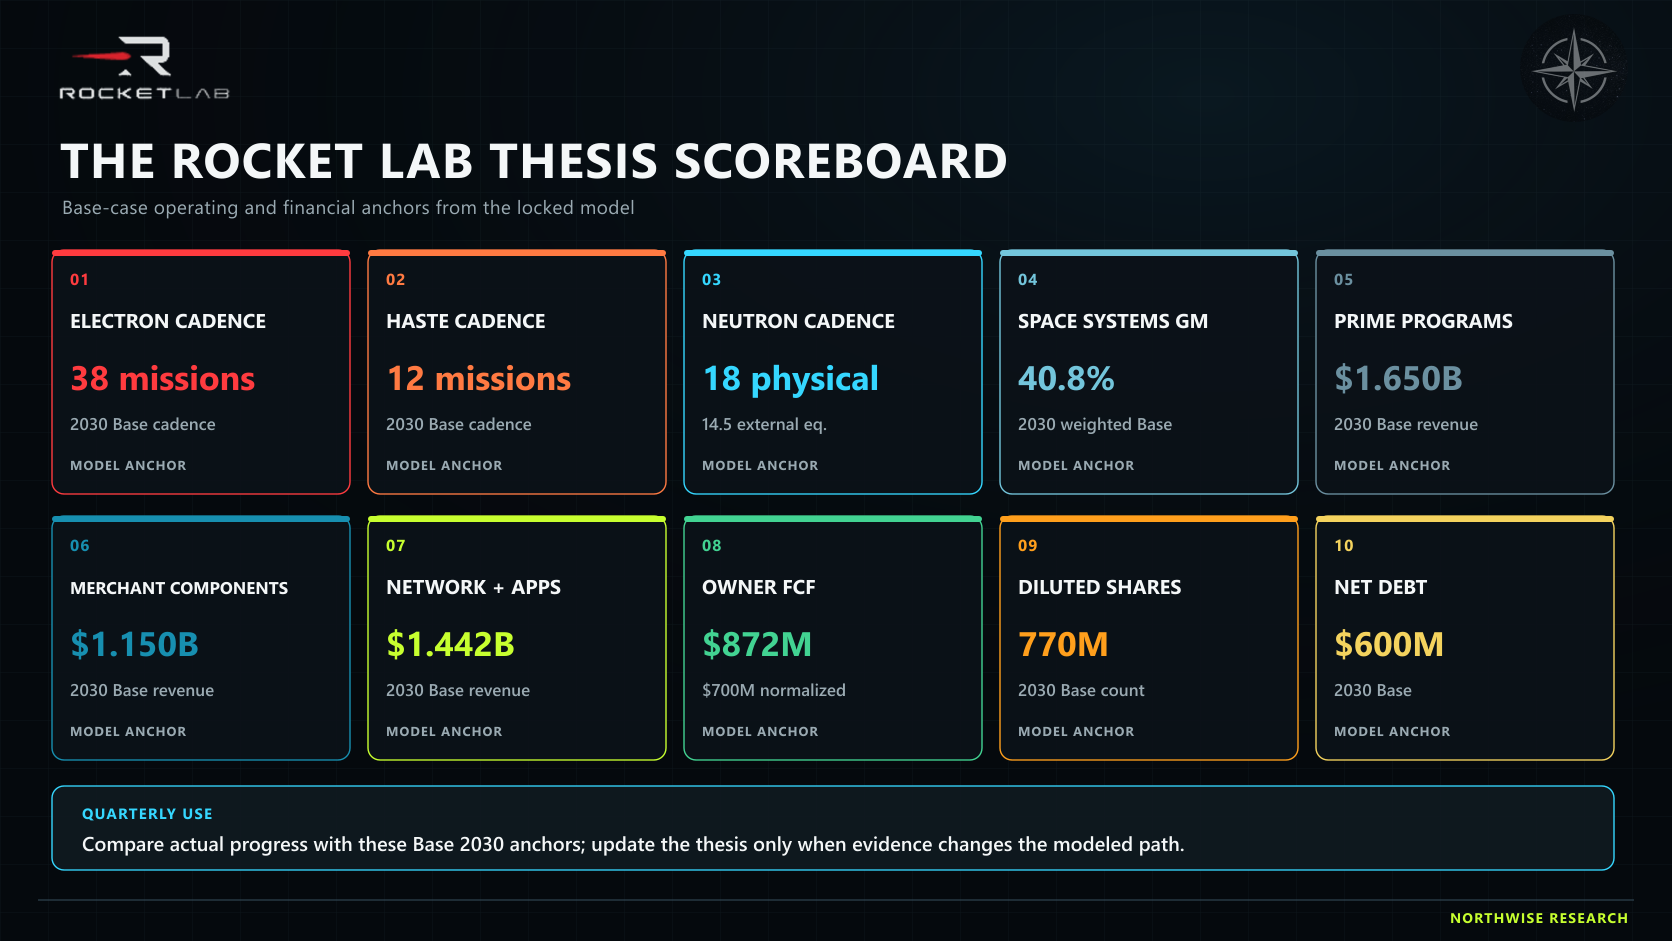
Part XII: The Free Model Ends Here
What the reader now has
Everything above constitutes a complete operating analysis of Rocket Lab.
The company history and how the architecture was assembled. The full Q2 2026 results and what they proved. Every material recent contract, with headline values reconciled against modeled values. Launch cadence by vehicle through 2030.
Neutron's schedule, mission accounting, pricing, and reuse economics. Space Systems revenue and margin by line, including the replacement-award requirement. Iridium's network, spectrum, and revenue lines. Aireon's business model.
The transaction structure, financing, debt, and share count. The complete Base income statement, capital spending, working capital, owner free cash flow, and renewal reserve. All six operating scenarios, the full risk framework, and explicit falsification conditions.
The operating question is closed. What Rocket Lab has to build, how each business can scale, where the cash comes from, where it goes, and what can break are all on the table.
The remaining question is different in kind. It concerns what each of those outcomes is worth to one diluted share.
Northwise Premium
Everything below this line is decision-useful valuation output.
Premium members receive the complete valuation architecture, six scenario price targets with the multiples and operating anchors behind each, the probability weighting applied to those scenarios, the probability-weighted 2030 target, expected total return and expected CAGR at the current price, the required-CAGR ladder showing the maximum entry price for each return threshold, the normalized-multiple red-team case, and the formal Northwise rating with its buy, hold, and trim zones.
Premium members also receive the complete Rocket Lab 2030 model as a downloadable Excel workbook. Every scenario, multiple, probability, financing assumption, and share-count input is editable. Anyone who disagrees with the 46% Base probability, the 20x launch multiple, the $68 million Neutron mission price, or the mid-2027 close can change the input and watch the target recalculate, since the workbook is fully linked from physical launch cadence through to the return ladder.
The valuation section follows.
Northwise Premium
Choose how to continue with Northwise
Join Northwise Premium
Unlock the rest of this report, its complete valuation, the downloadable model, portfolios, and action framework.
Join Northwise PremiumCreate a Free Account
Continue across Free Northwise research, follow companies, save reports, and receive updates.
Create a Free Account
RKLB Stock Forecast
Rocket Lab is expanding from dedicated launch into spacecraft, components, networks, and data services. This model tests what that integrated platform may be worth.
RKLB Stock Forecast 2030
Our RKLB Stock Forecast 2030 reveals why the market is mispricing Rocket Lab. See why the "Space Prime" thesis could drive the stock to $104+.

RocketLab Stock Analysis
RocketLab stock analysis focused on vertical integration, national security tailwinds, and why small to mid-lift rockets are pivotal to long term growth.
Northwise Portfolios
See how the research becomes real decisions
Reader discussion
Discuss the research
Premium access is required to join this report's discussion.
Join Northwise Premium
No comments yet. Start a thoughtful discussion.